

An AI-Based Open-Source Software for Varroa Mite Fall Analysis in Honeybee Colonies

 , ,
, ,  , , and
Abstract
1. Introduction
2. Materials and Methods
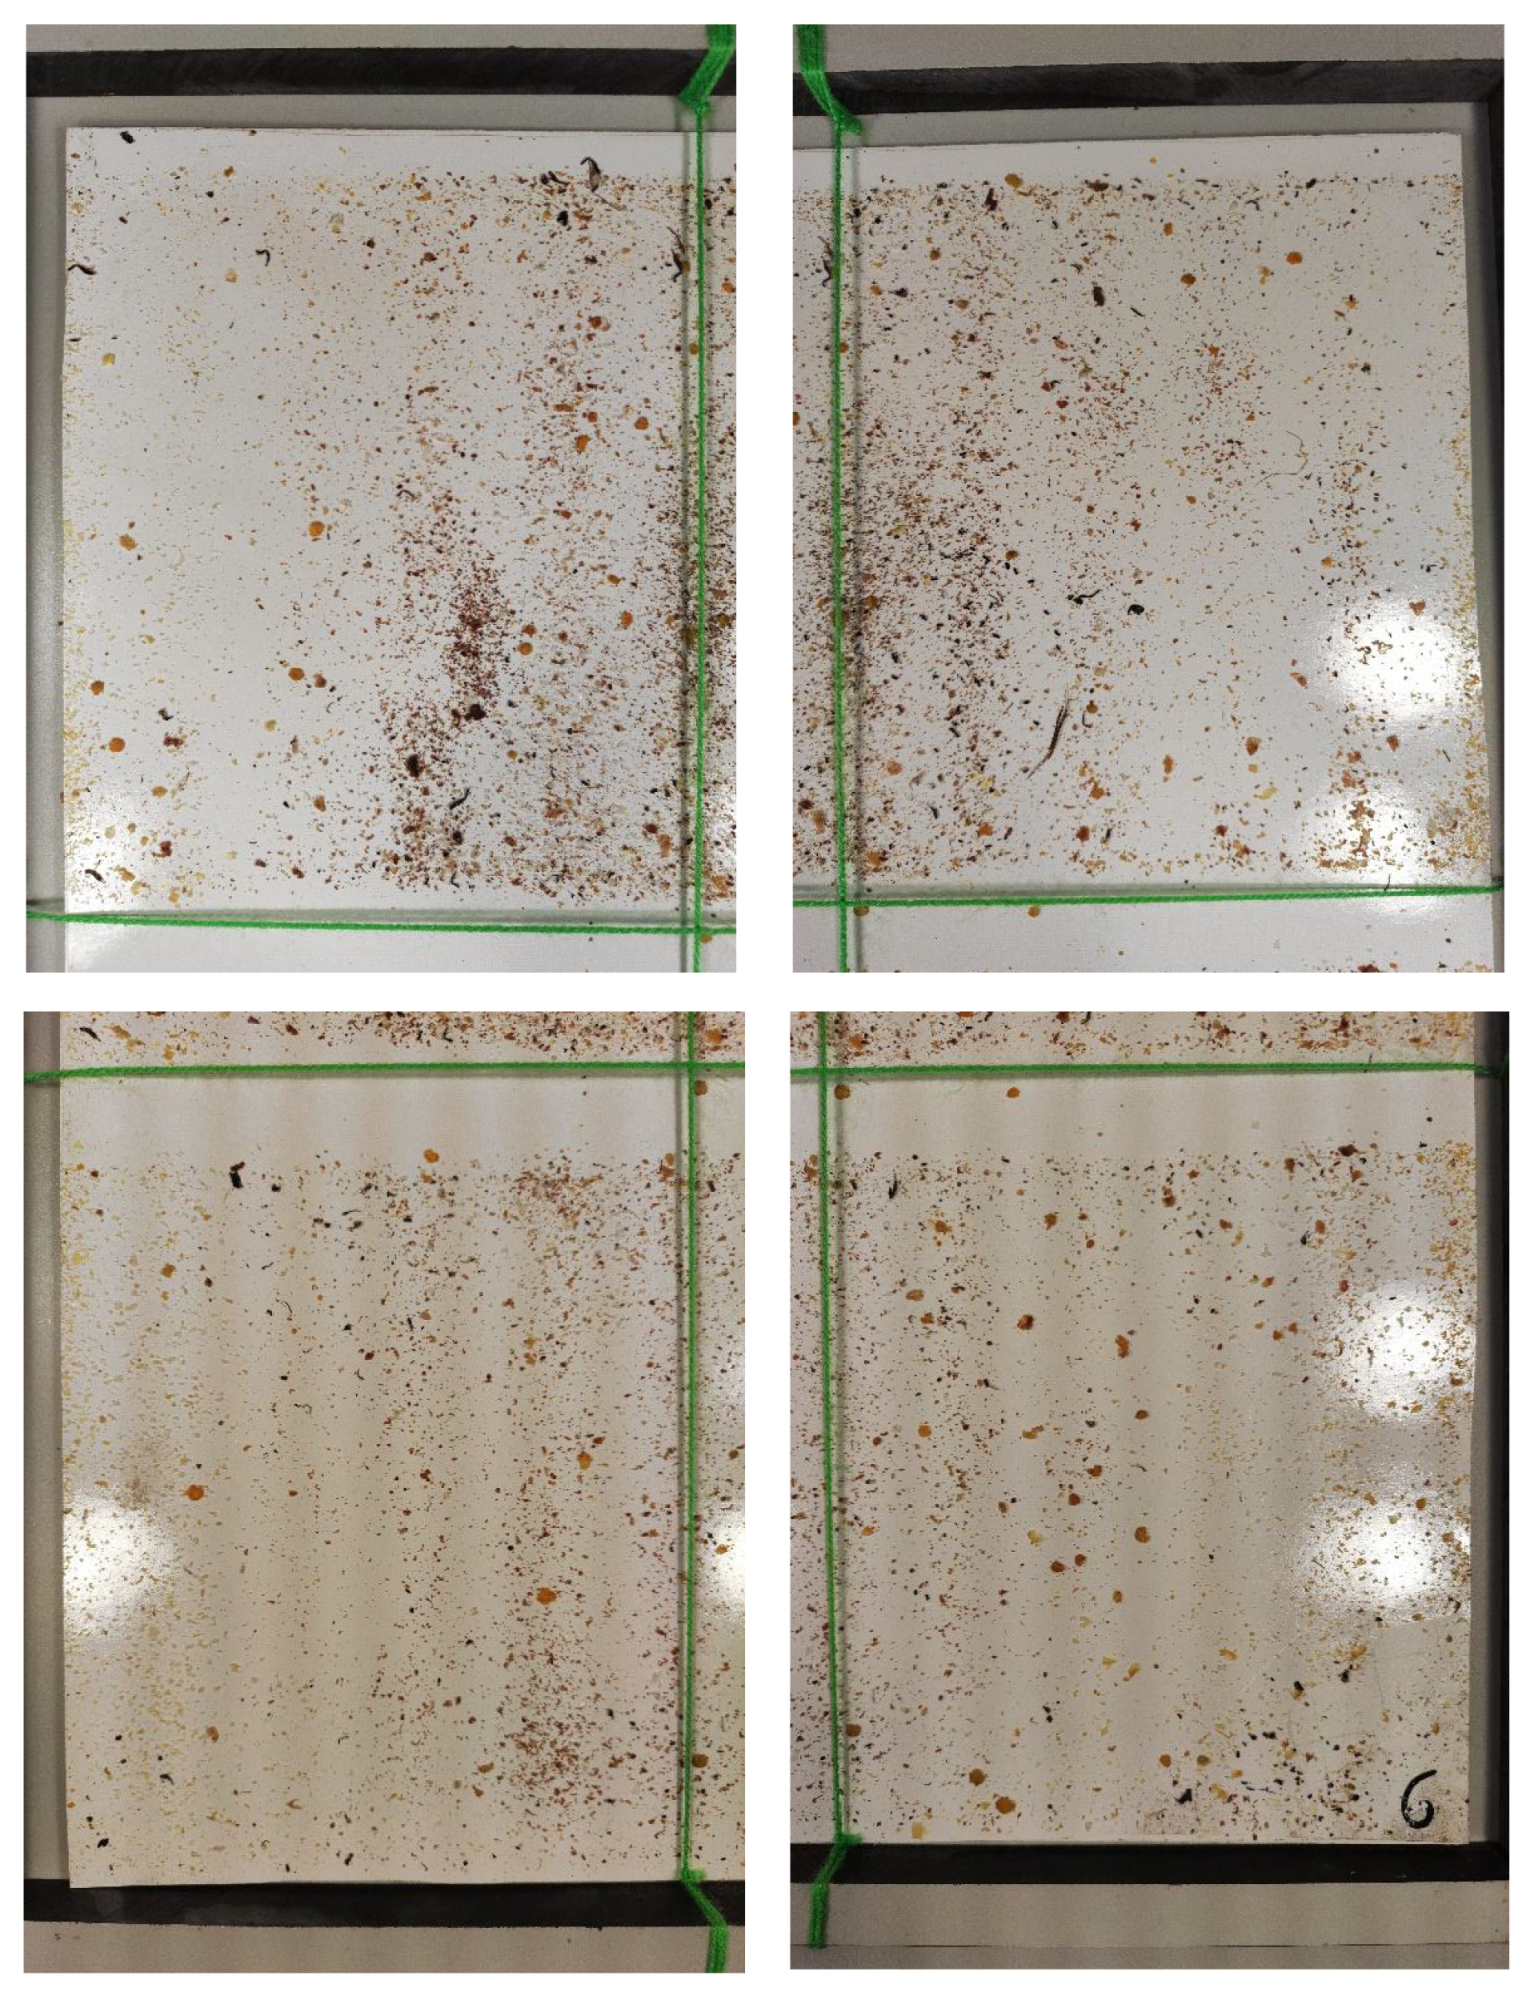
2.1. Image Acquisition
2.2. Dataset Description
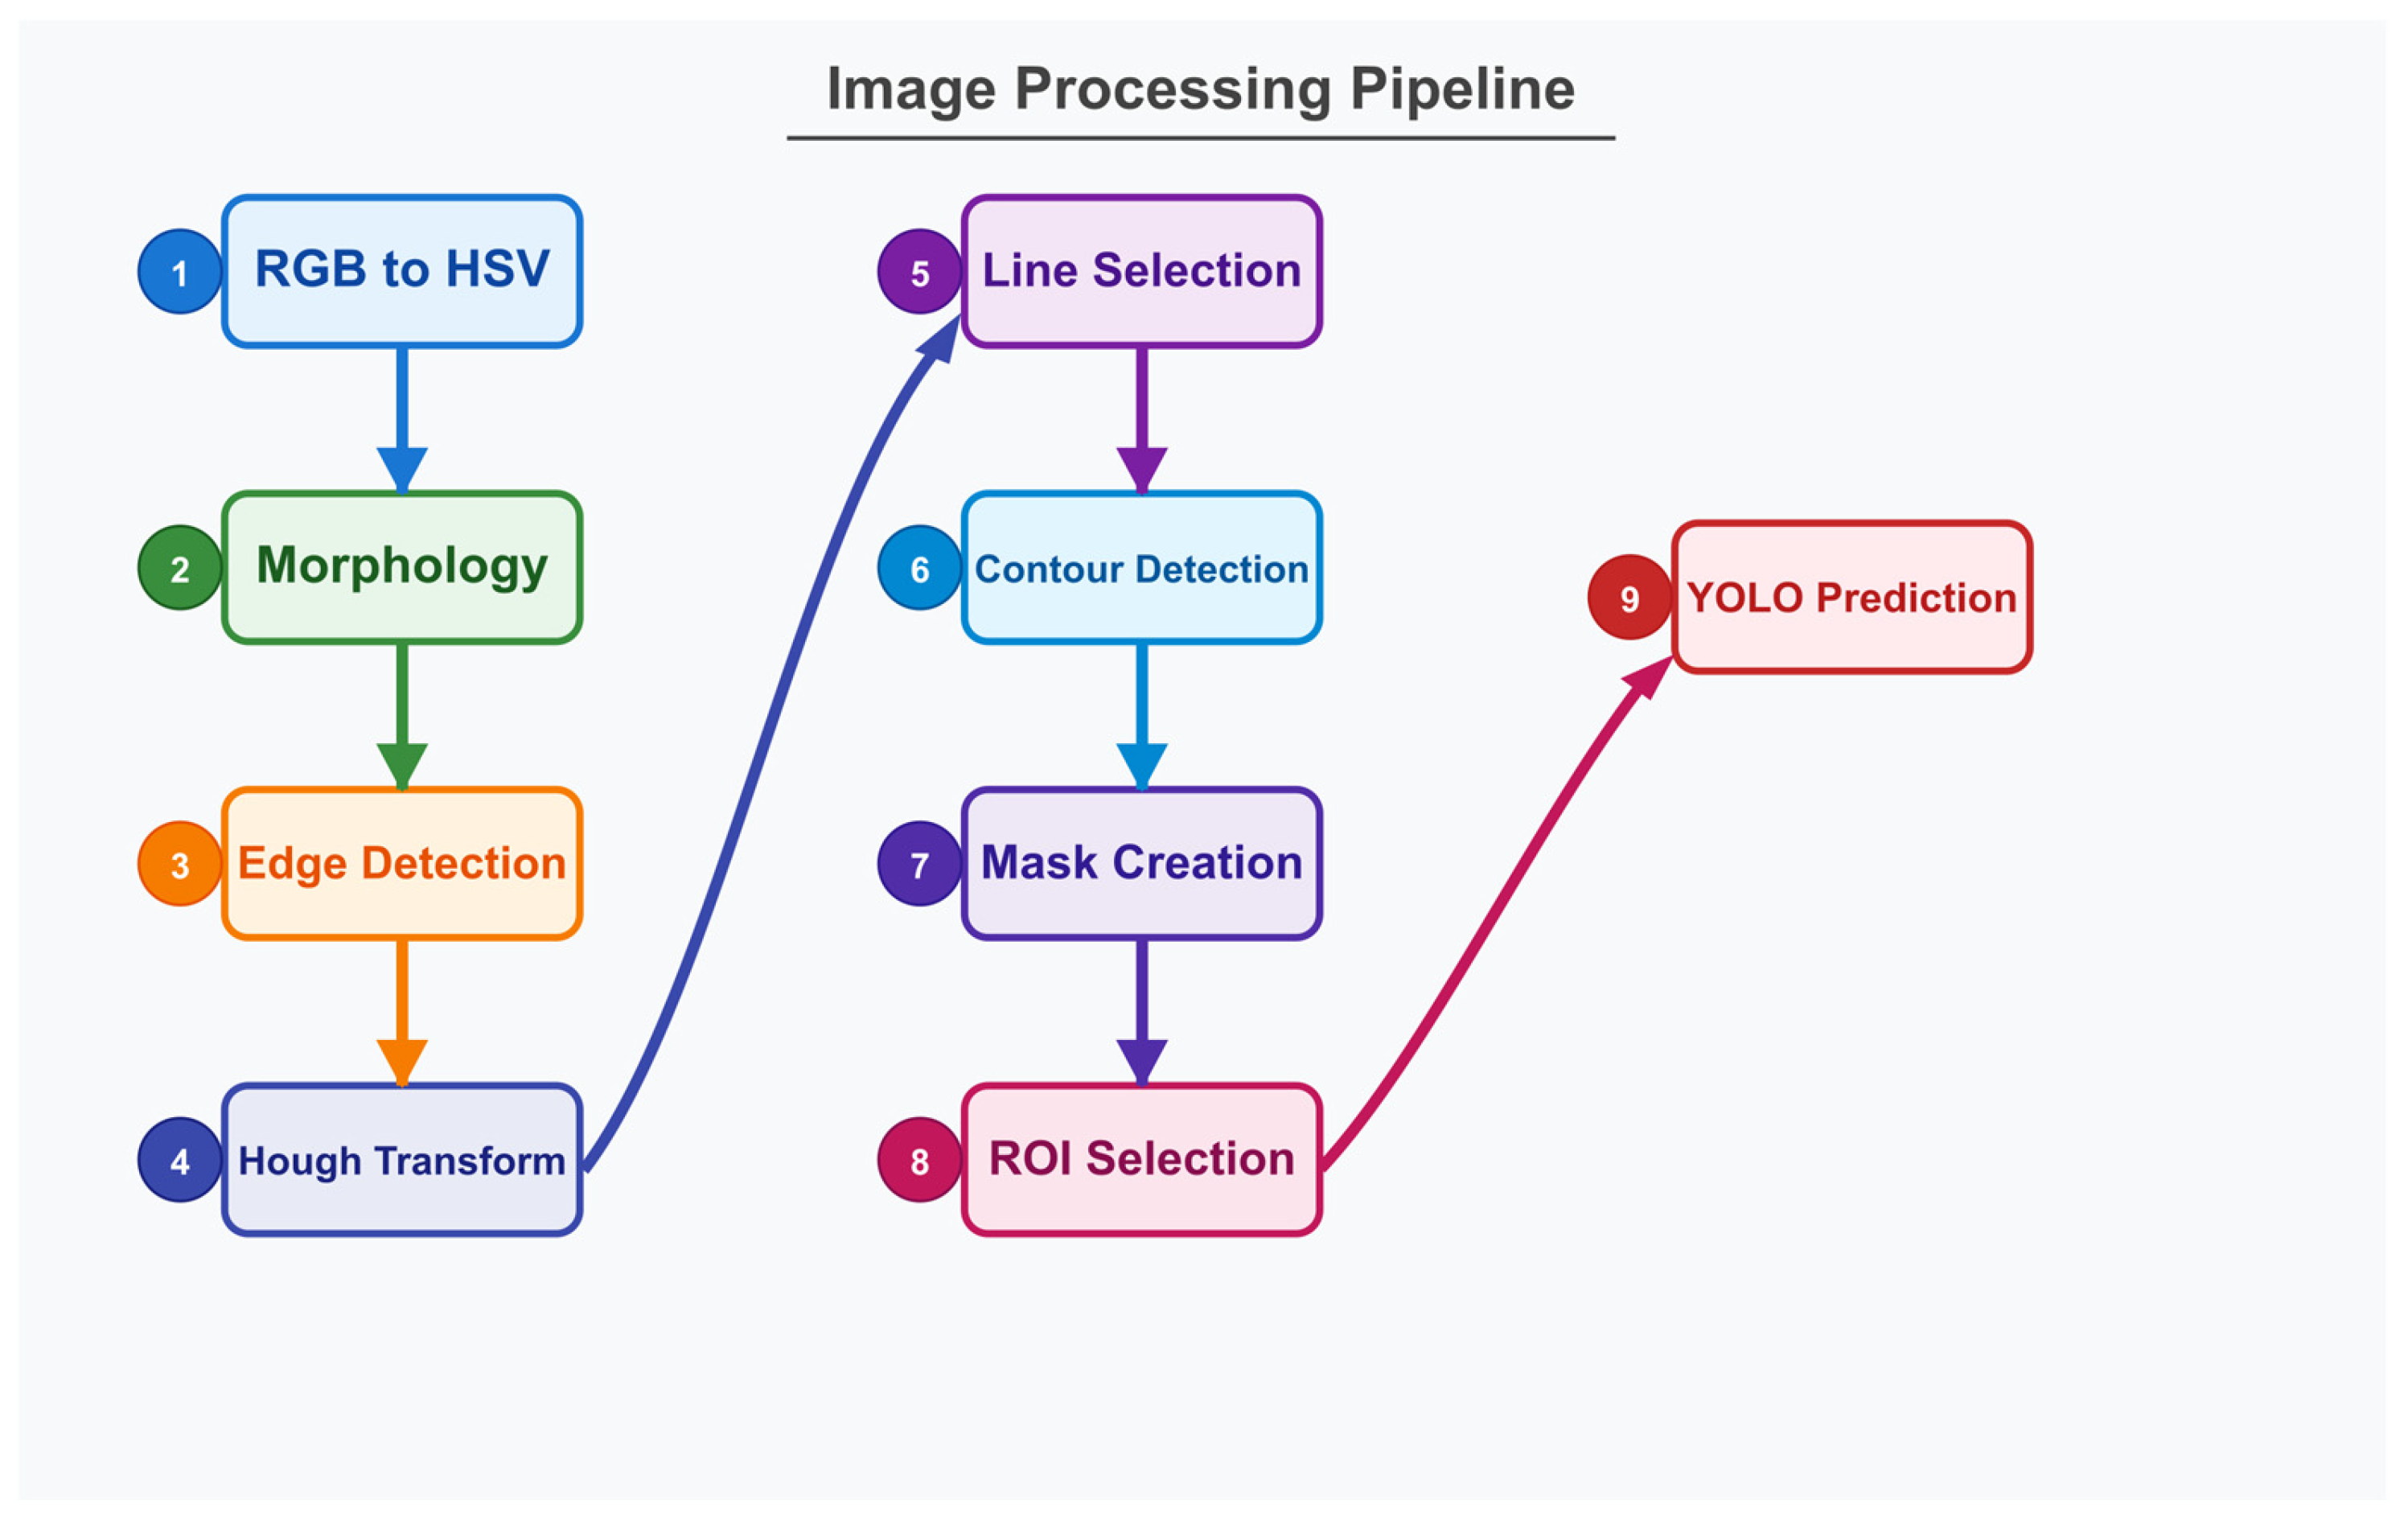
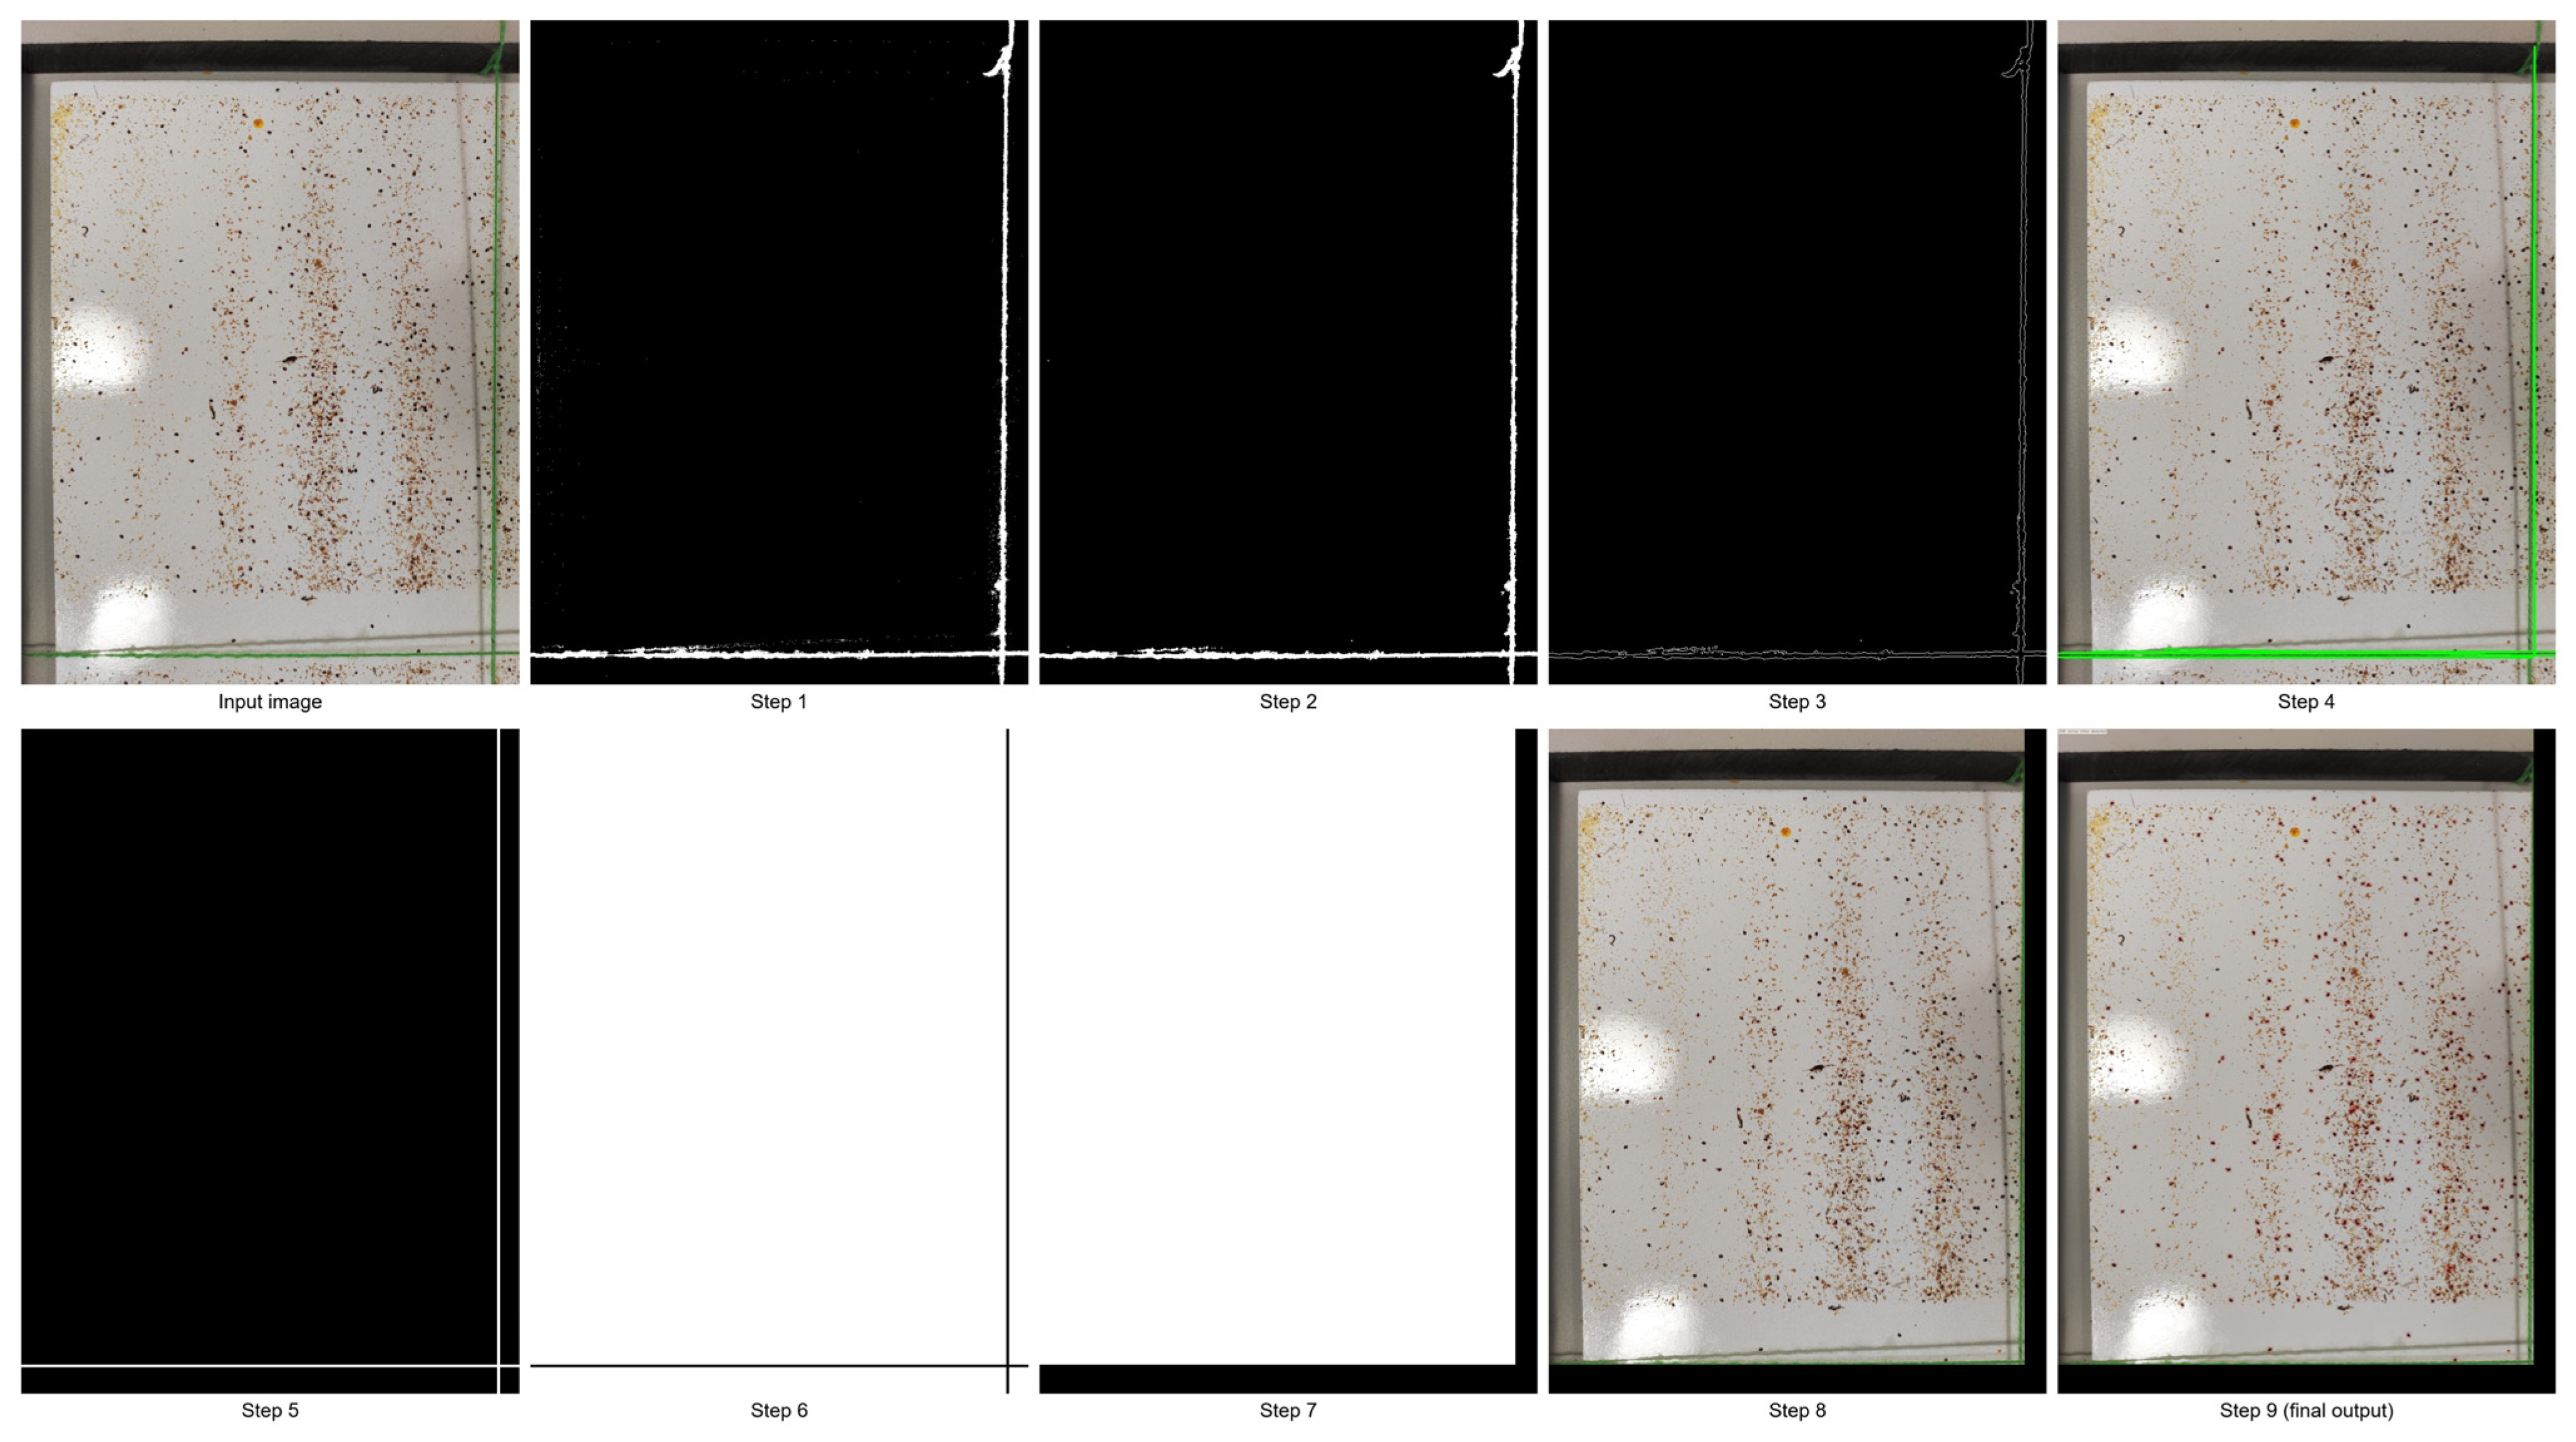
2.3. Algorithm Description
- Step 1: Conversion from RGB to HSV colorspace is performed, followed by string color filtering of the image.
- Step 2: Morphological operations (erosion and dilation) are applied to refine the filtered result.
- Step 3: Edge detection is applied via the Canny algorithm.
- Step 4: Hough transform is utilized for straight line detection.
- Step 5: The resulting segments are sorted by length, with the longest segments selected. These segments are extended to the image boundaries. Intersection points are calculated, and segments forming approximately 90-degree angles are preserved and drawn as complete lines to the edges in a binary image.
- Step 6: Contour detection is performed, resulting in the delimitation of four distinct regions.
- Step 7: The largest region is isolated and converted to a binary mask (white pixels on black background).
- Step 8: The generated mask is applied to the original image for selecting the region of interest within the strings.
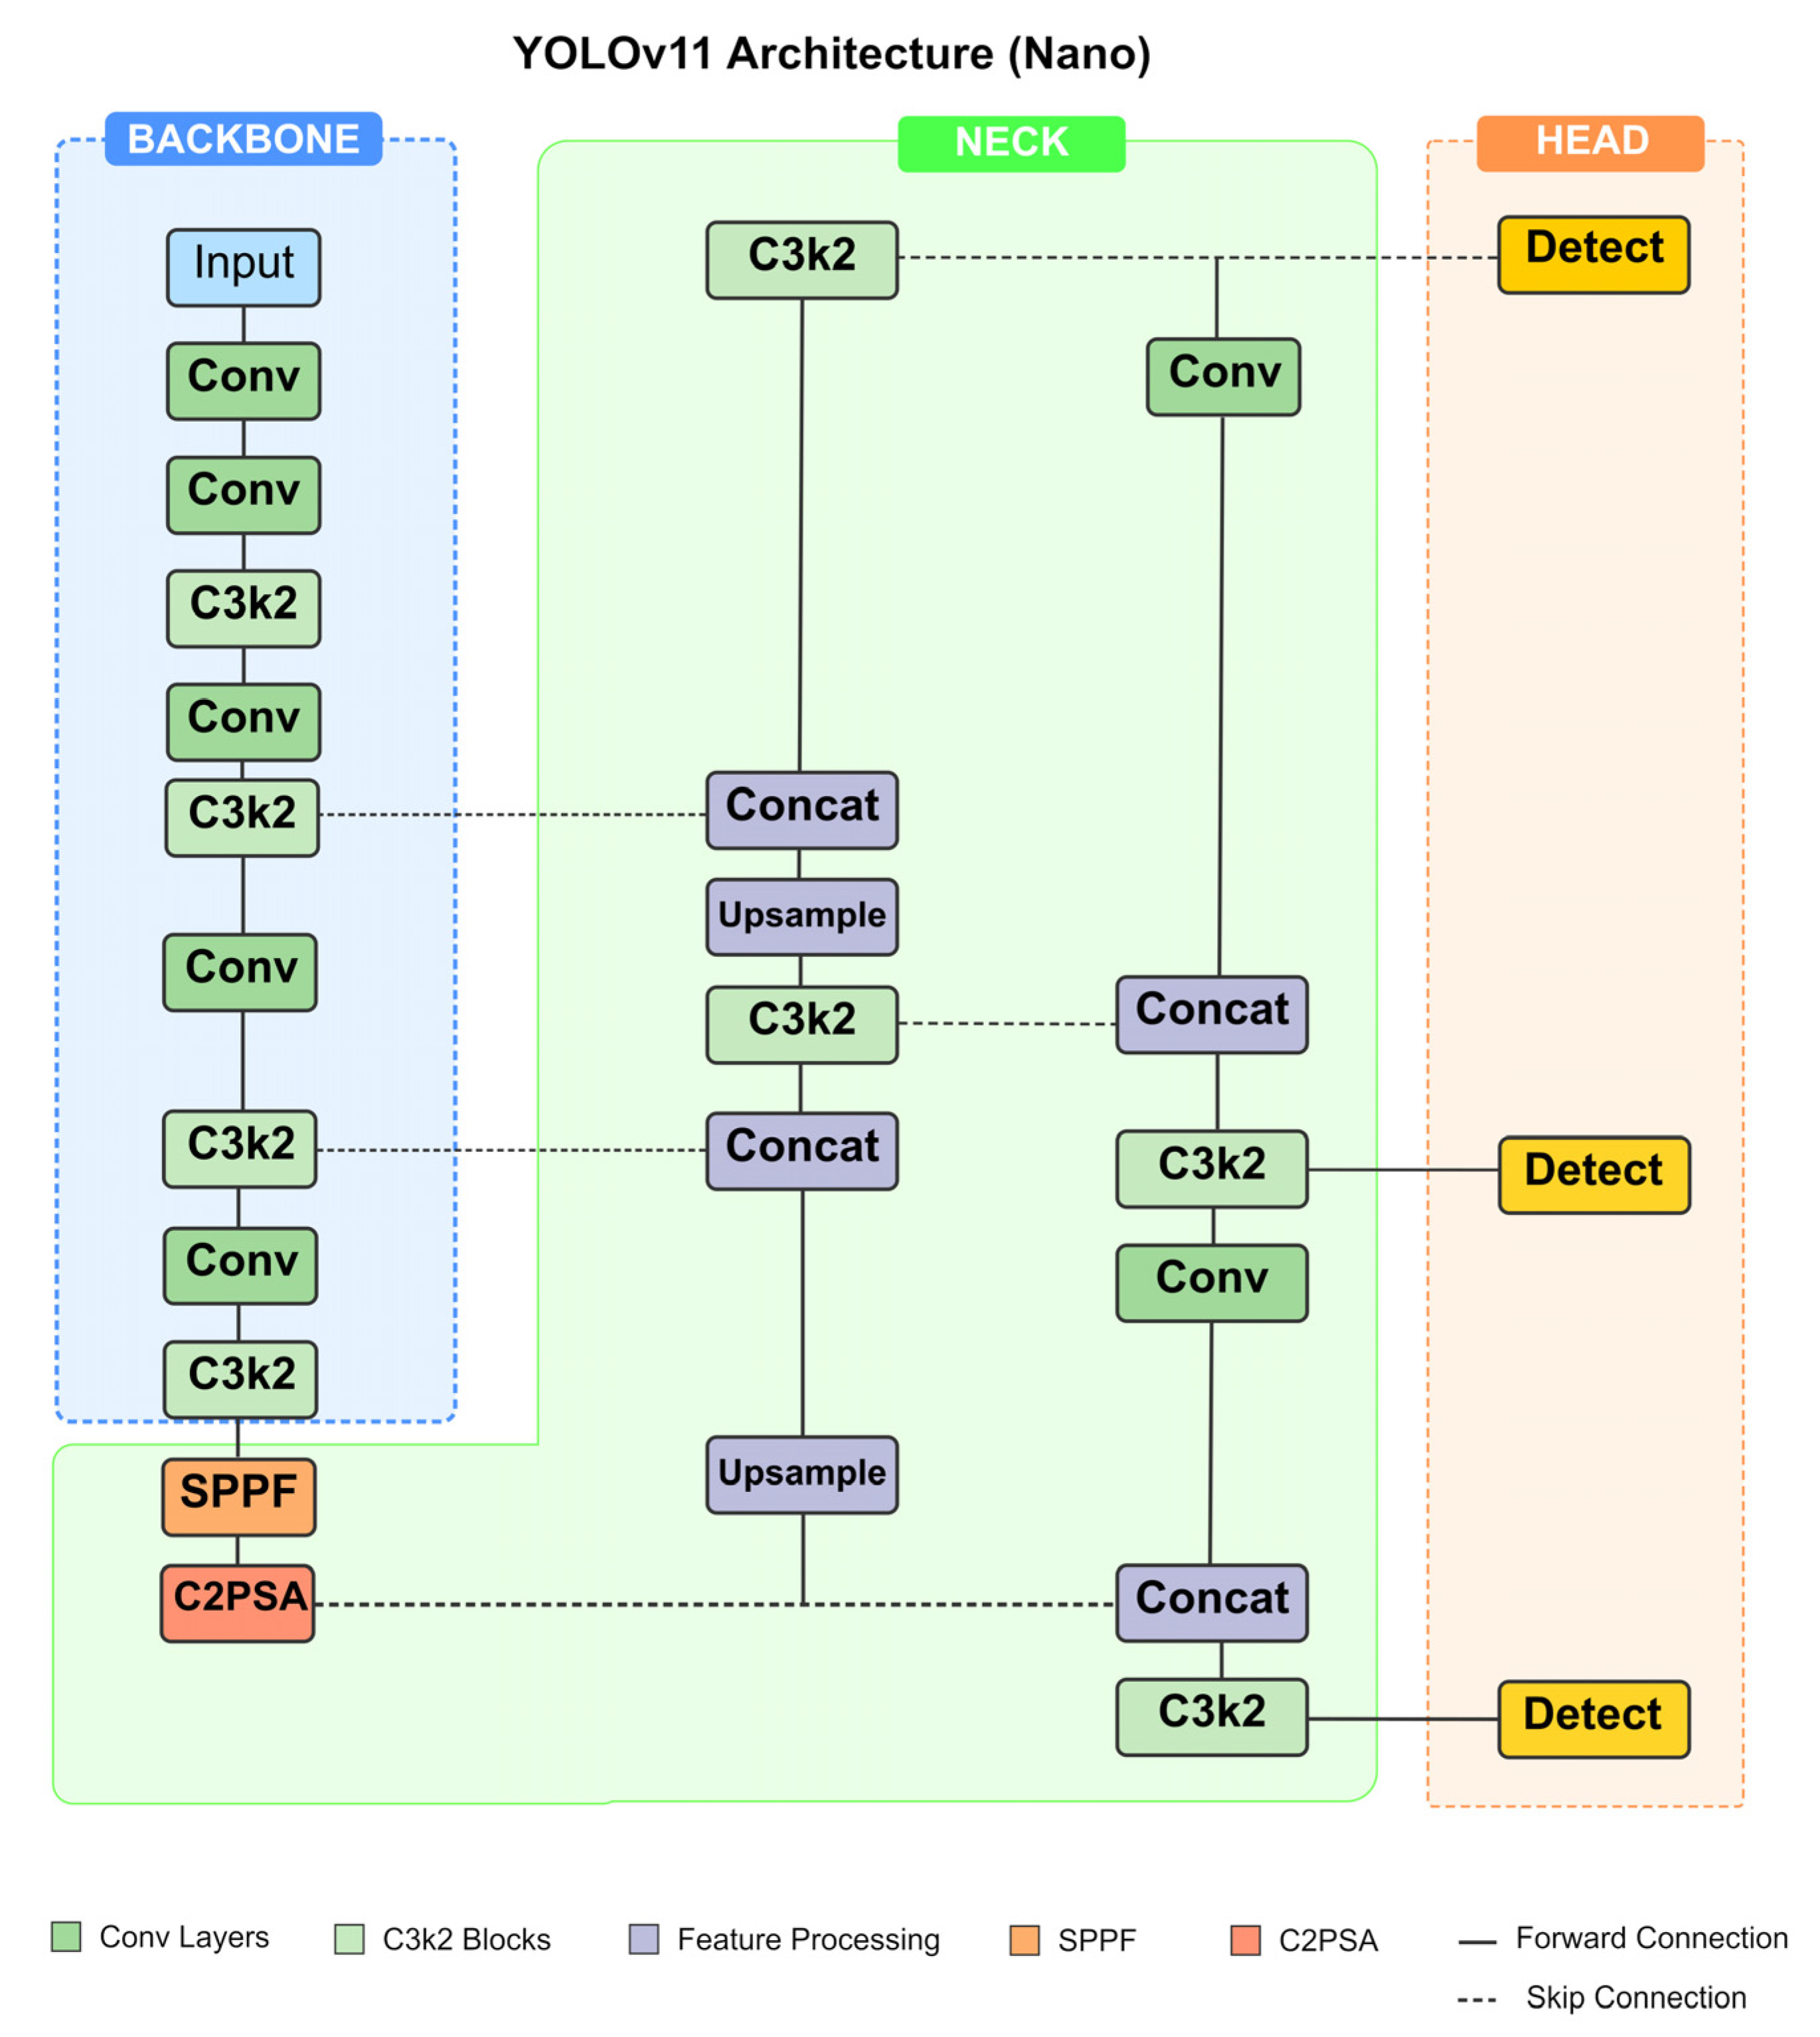
- Step 9: Predictions are made with the YOLO deep learning model.
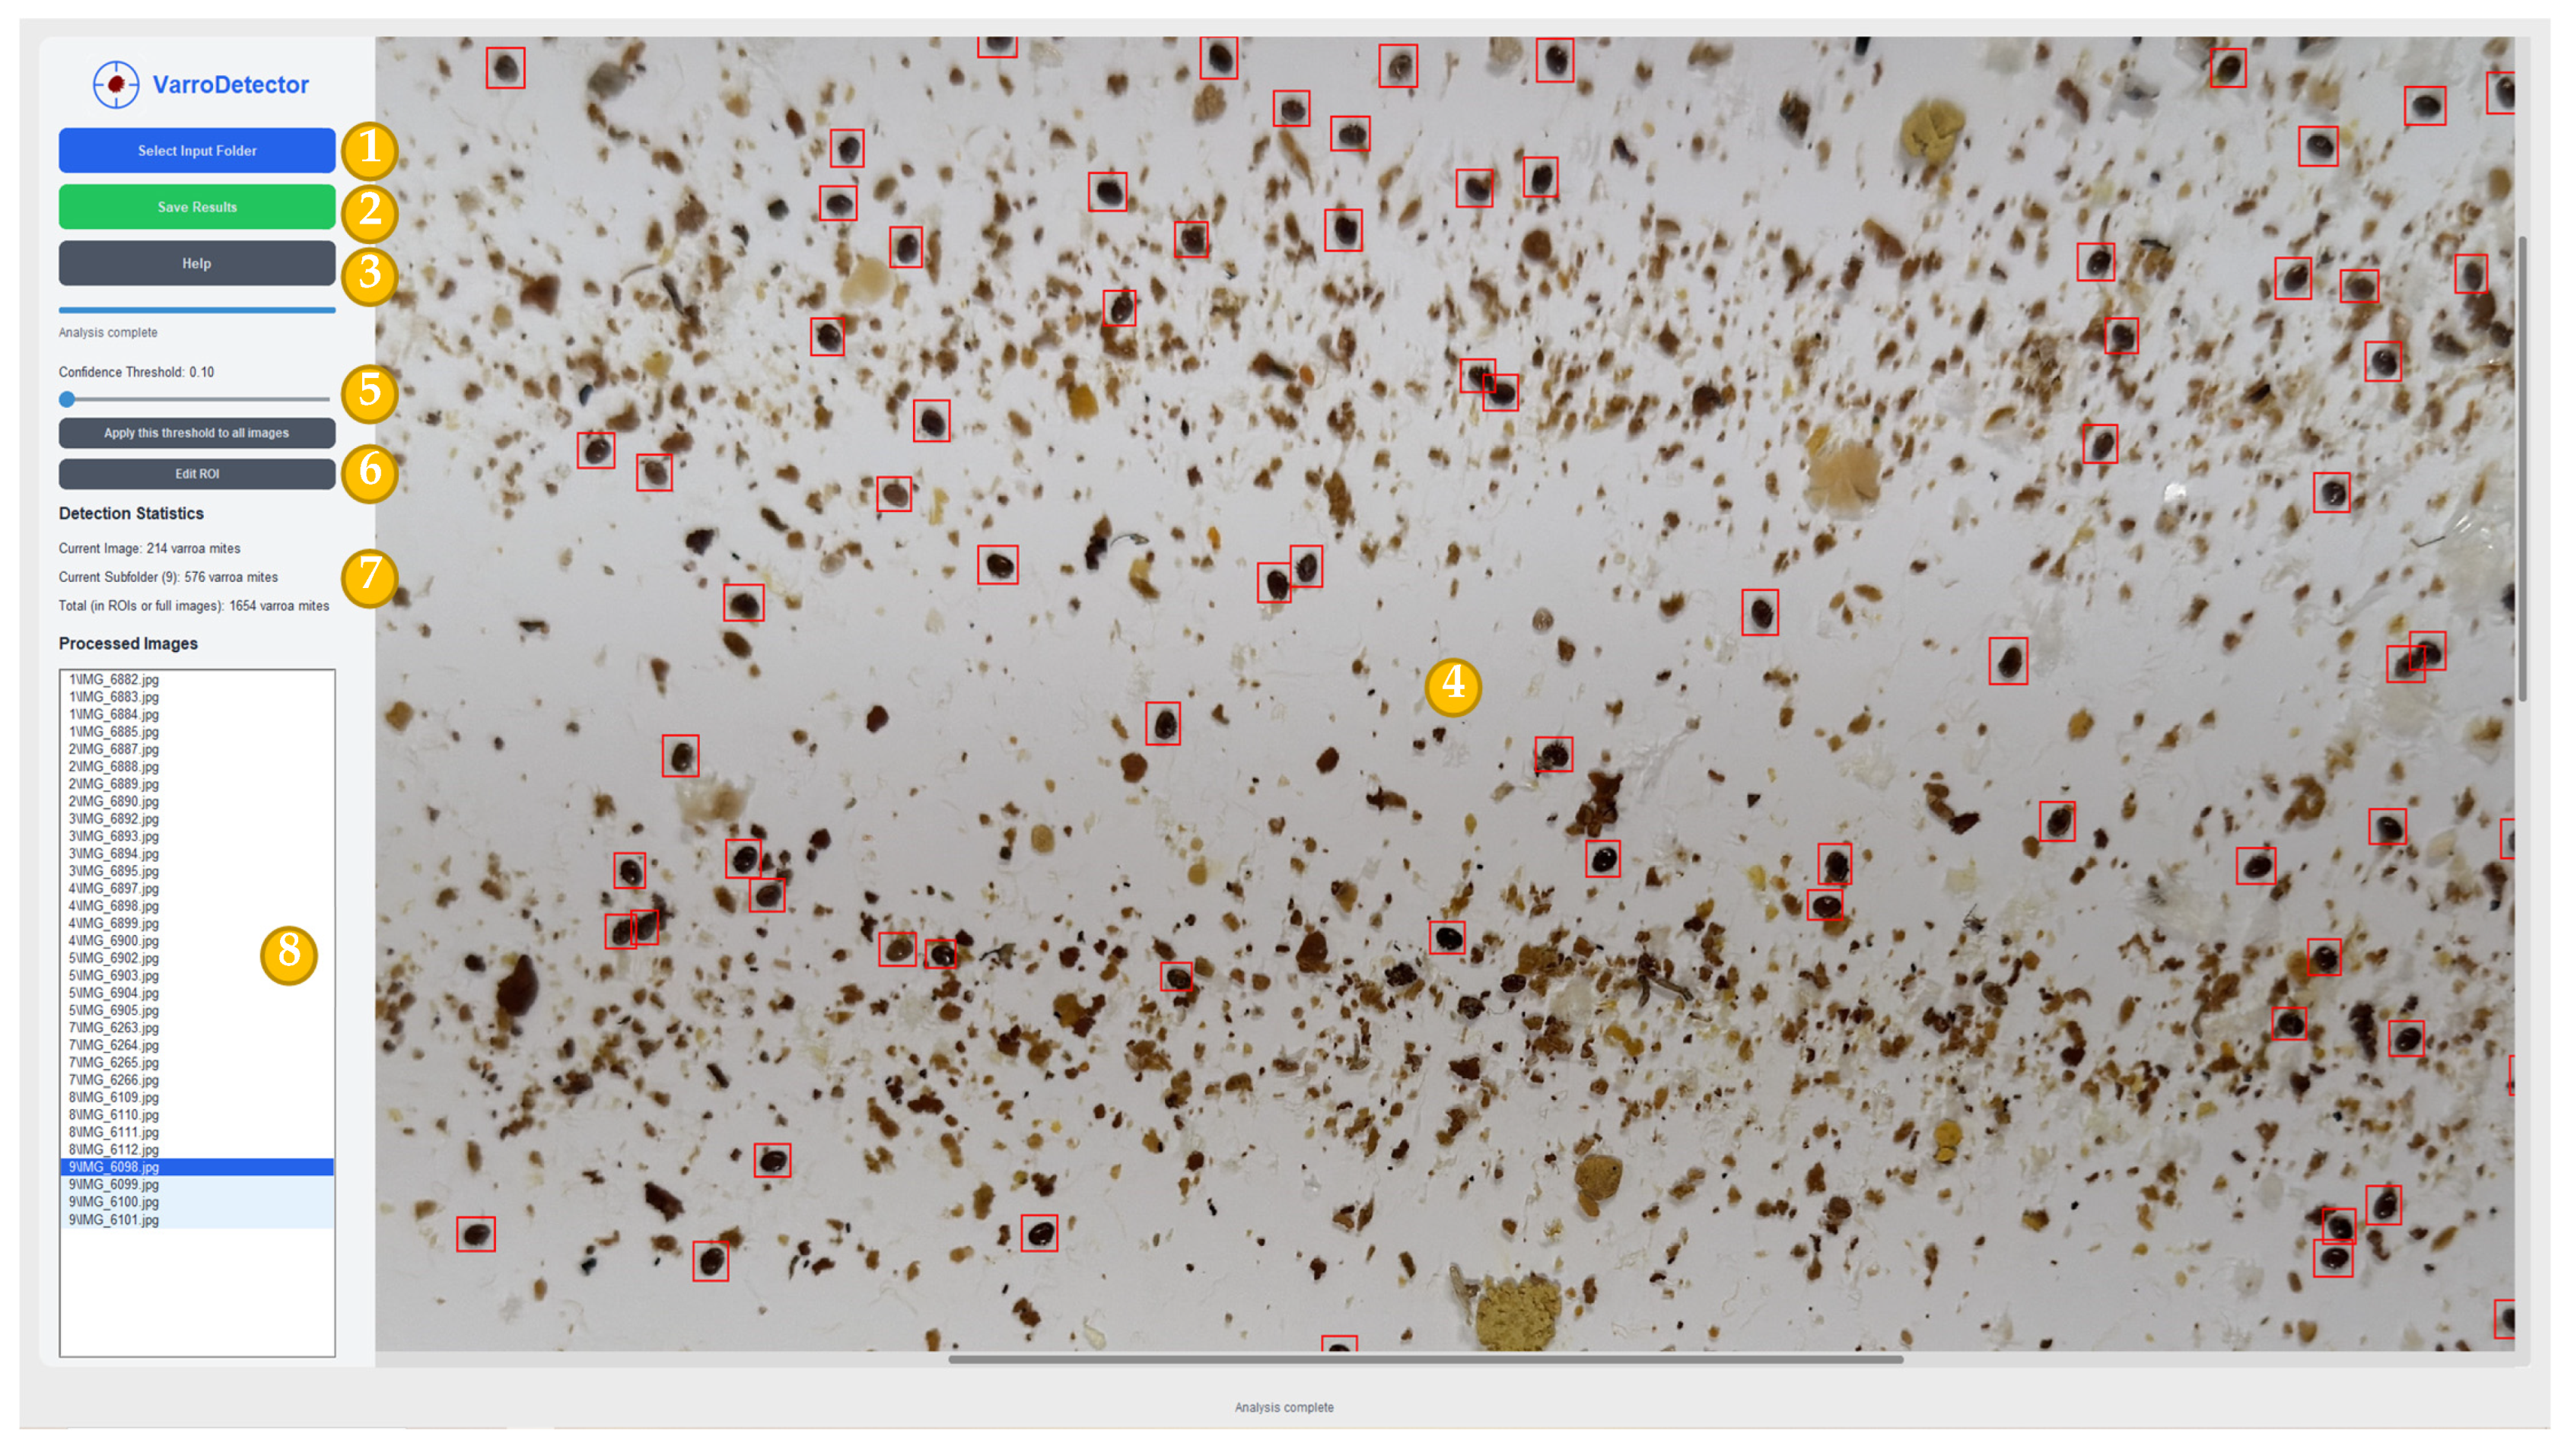
2.4. Software Interface
- (1)
- Select input folder: A button to allow users to select a folder containing the images to be analyzed. If the folder includes subfolders, the program recursively also processes all images within the directory. This functionality is particularly useful for analyzing multiple sticky sheets simultaneously, especially when each sheet’s four images are stored in separate subfolders.
- (2)
- Save button: The program allows to export statistical data in CSV format. Additionally, annotated images with detected mites and their corresponding labels are saved in YOLO format.
- (3)
- Help button: This button displays information about the application and a guide about the basic controls and functionality available.
- (4)
- Image viewer: The program employs the YOLO neural network to detect Varroa mites and displays the processed image with detected bounding boxes marked on the right panel. Users can zoom and pan within the image and manually adjust detections by adding, modifying, or removing identified Varroa mites.
- (5)
- Threshold slider: The detection sensitivity can be adjusted using a confidence slider, which controls the neural network’s prediction threshold confidence. This threshold can be modified per image or applied uniformly across all images. Lower confidence levels increase detections but may also introduce more false positives.
- (6)
- Region of interest (ROI): The software allows the user to restrict the area to count mites. This may be used, for example, in rare instances where string recognition fails.
- (7)
- Statistics panel: This panel provides key information, including the total number of Varroa mites detected across all images, the number of mites within the same subfolder as the selected image (representing a single sheet), and the count of mites in the currently selected image.
- (8)
- List of images: This panel provides the names of the images that have been analyzed and allows the user to select which image to display in the image viewer. The selected image is marked on a dark blue background, whereas those images contained in the same subfolder are marked in light blue.
2.5. Verification (Testing)
2.6. Statistical Analysis
3. Results
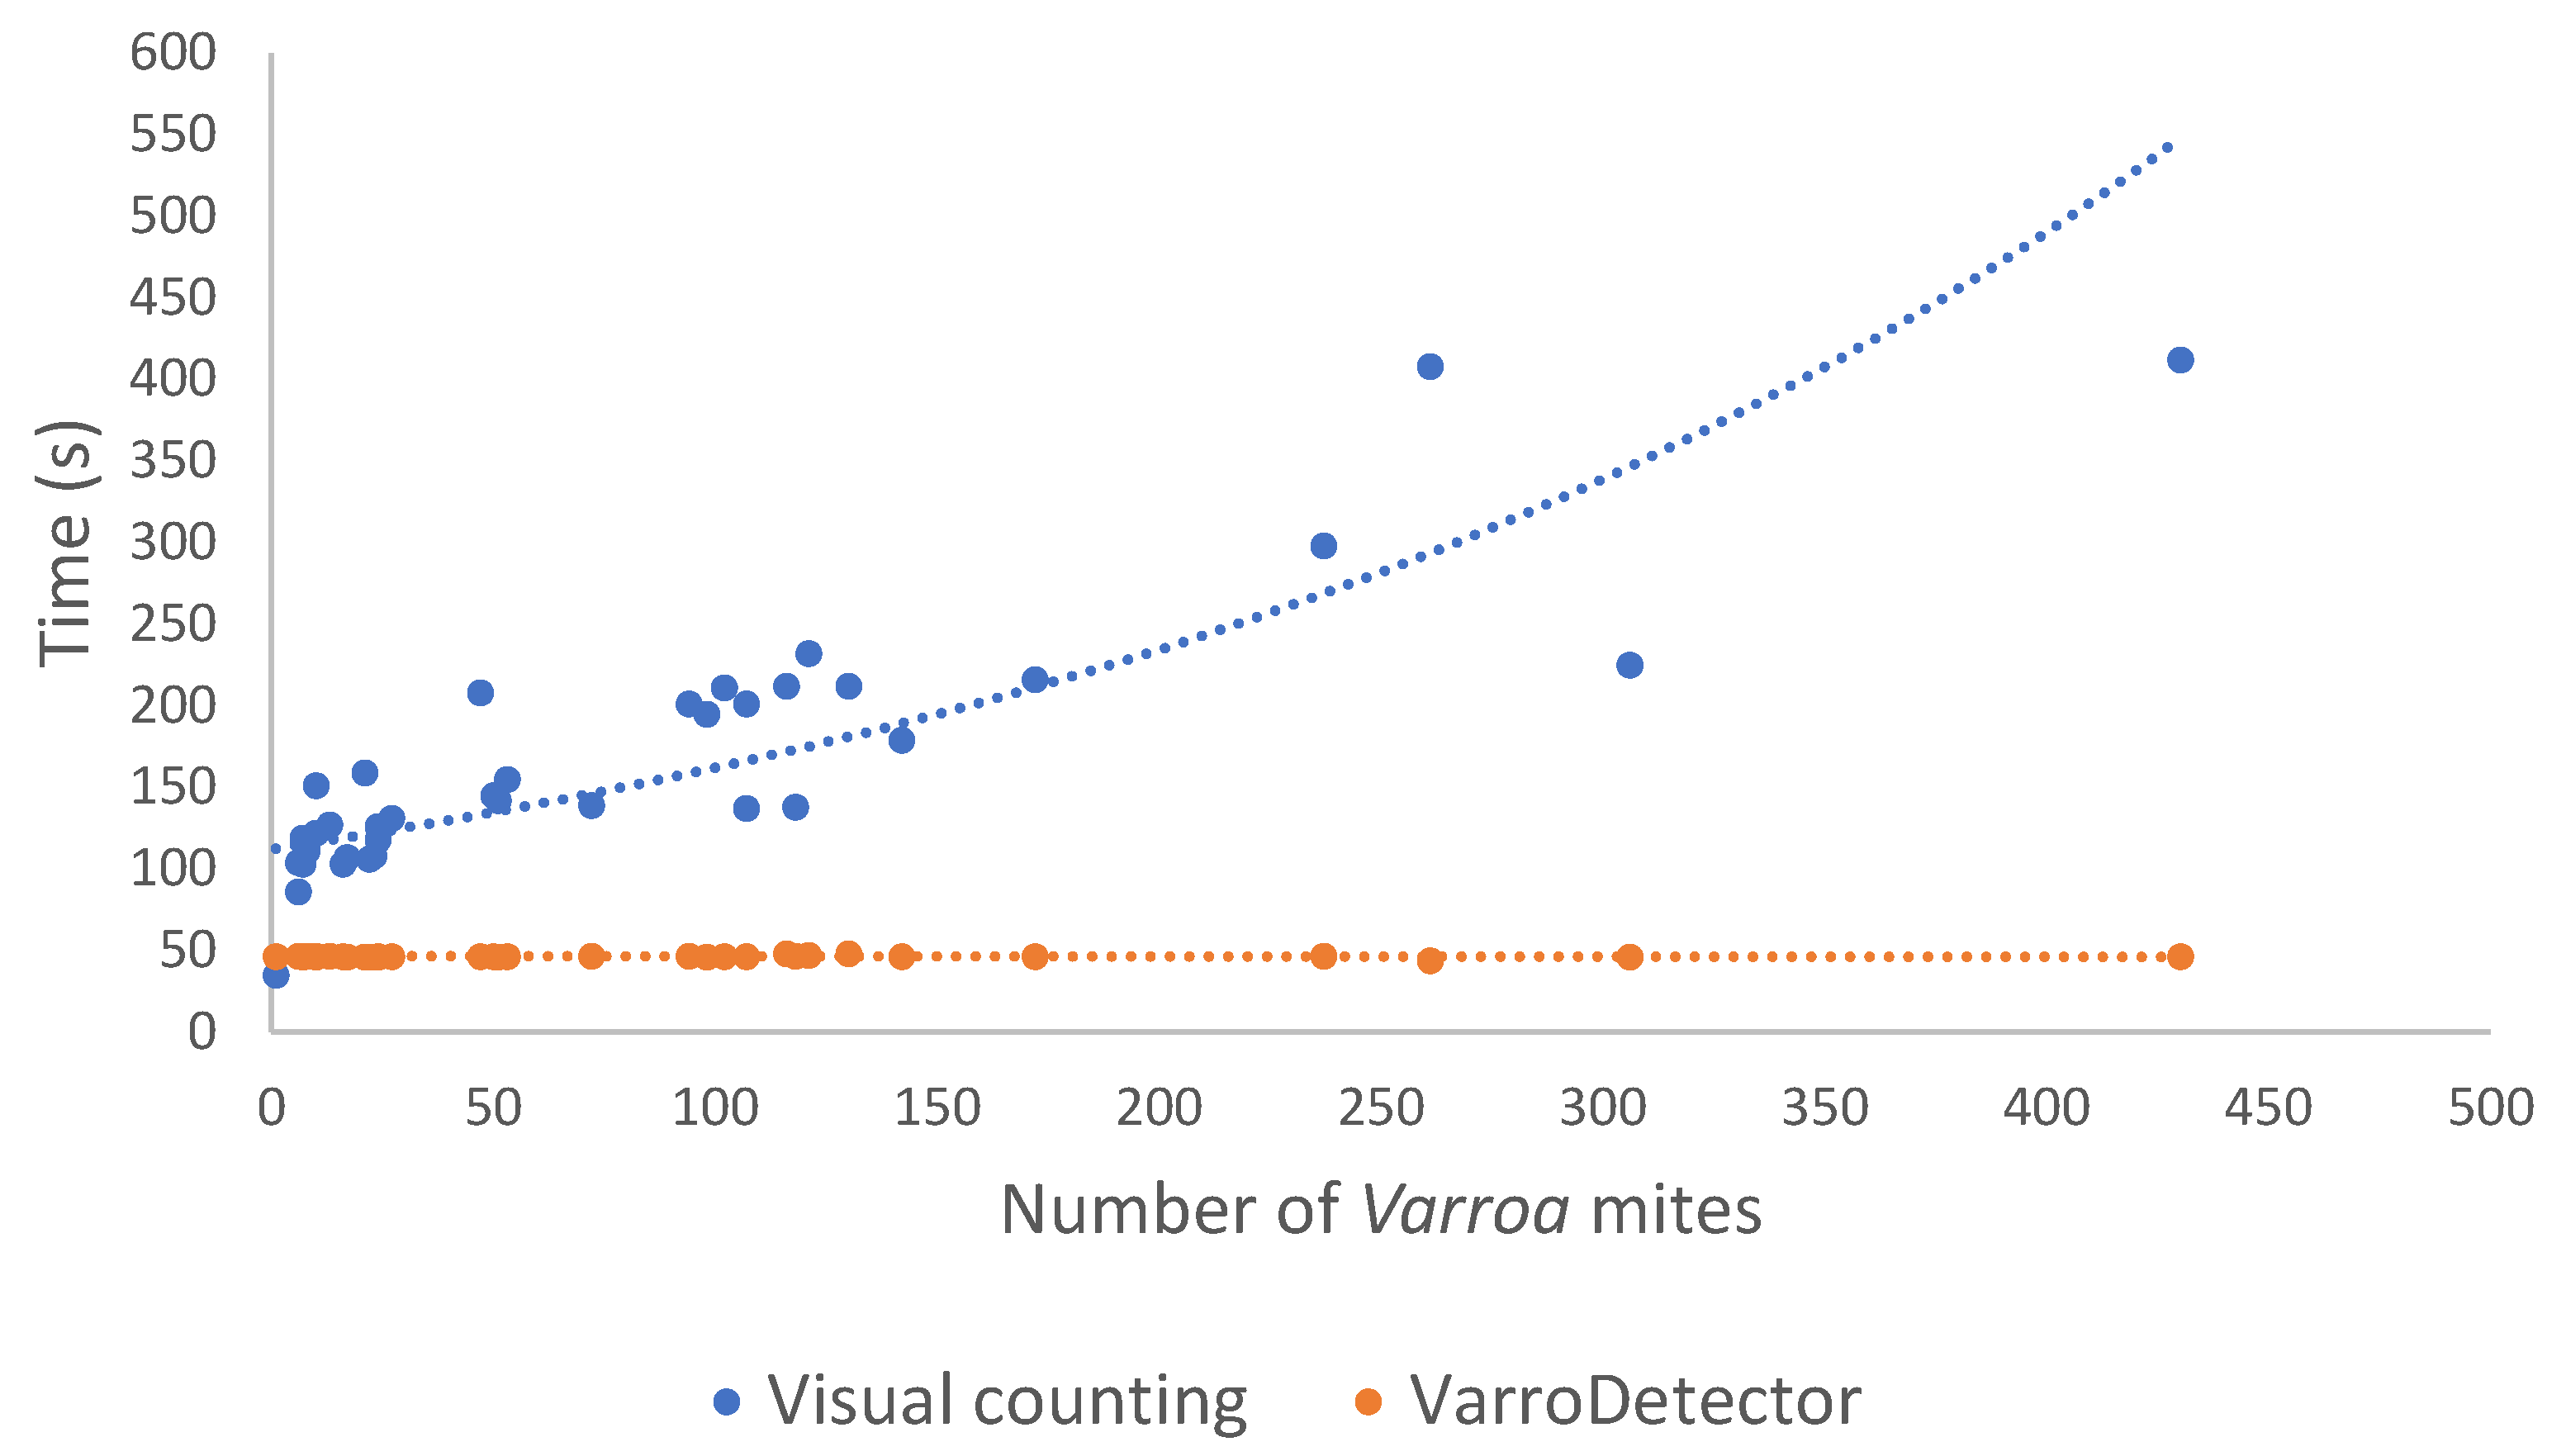
3.1. Detection Time Efficiency
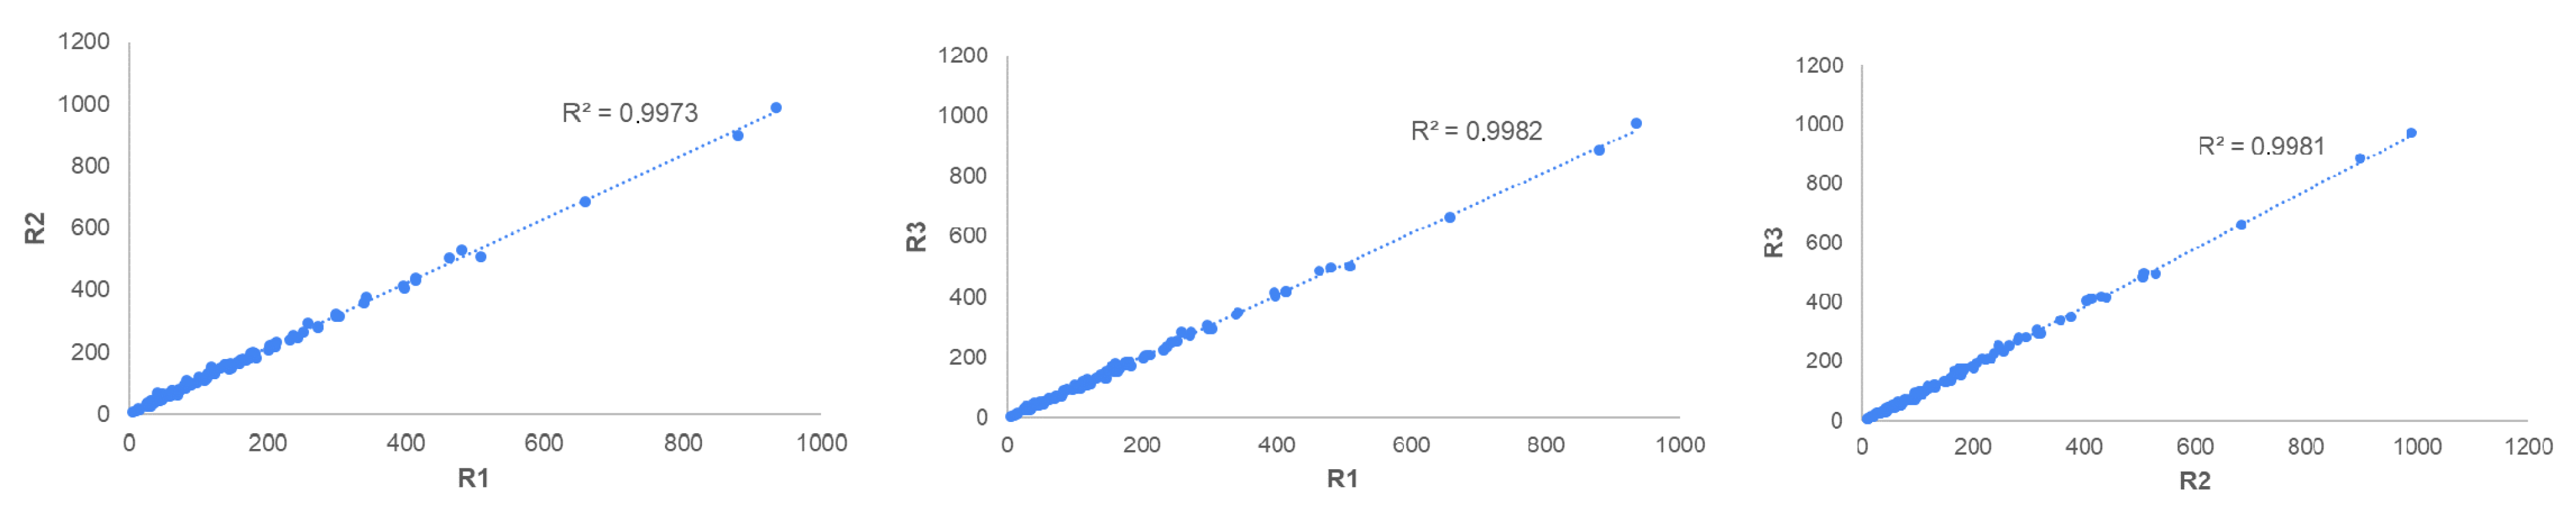
3.2. Repeatability of the VarroDetector as a Function of Sheet Orientations
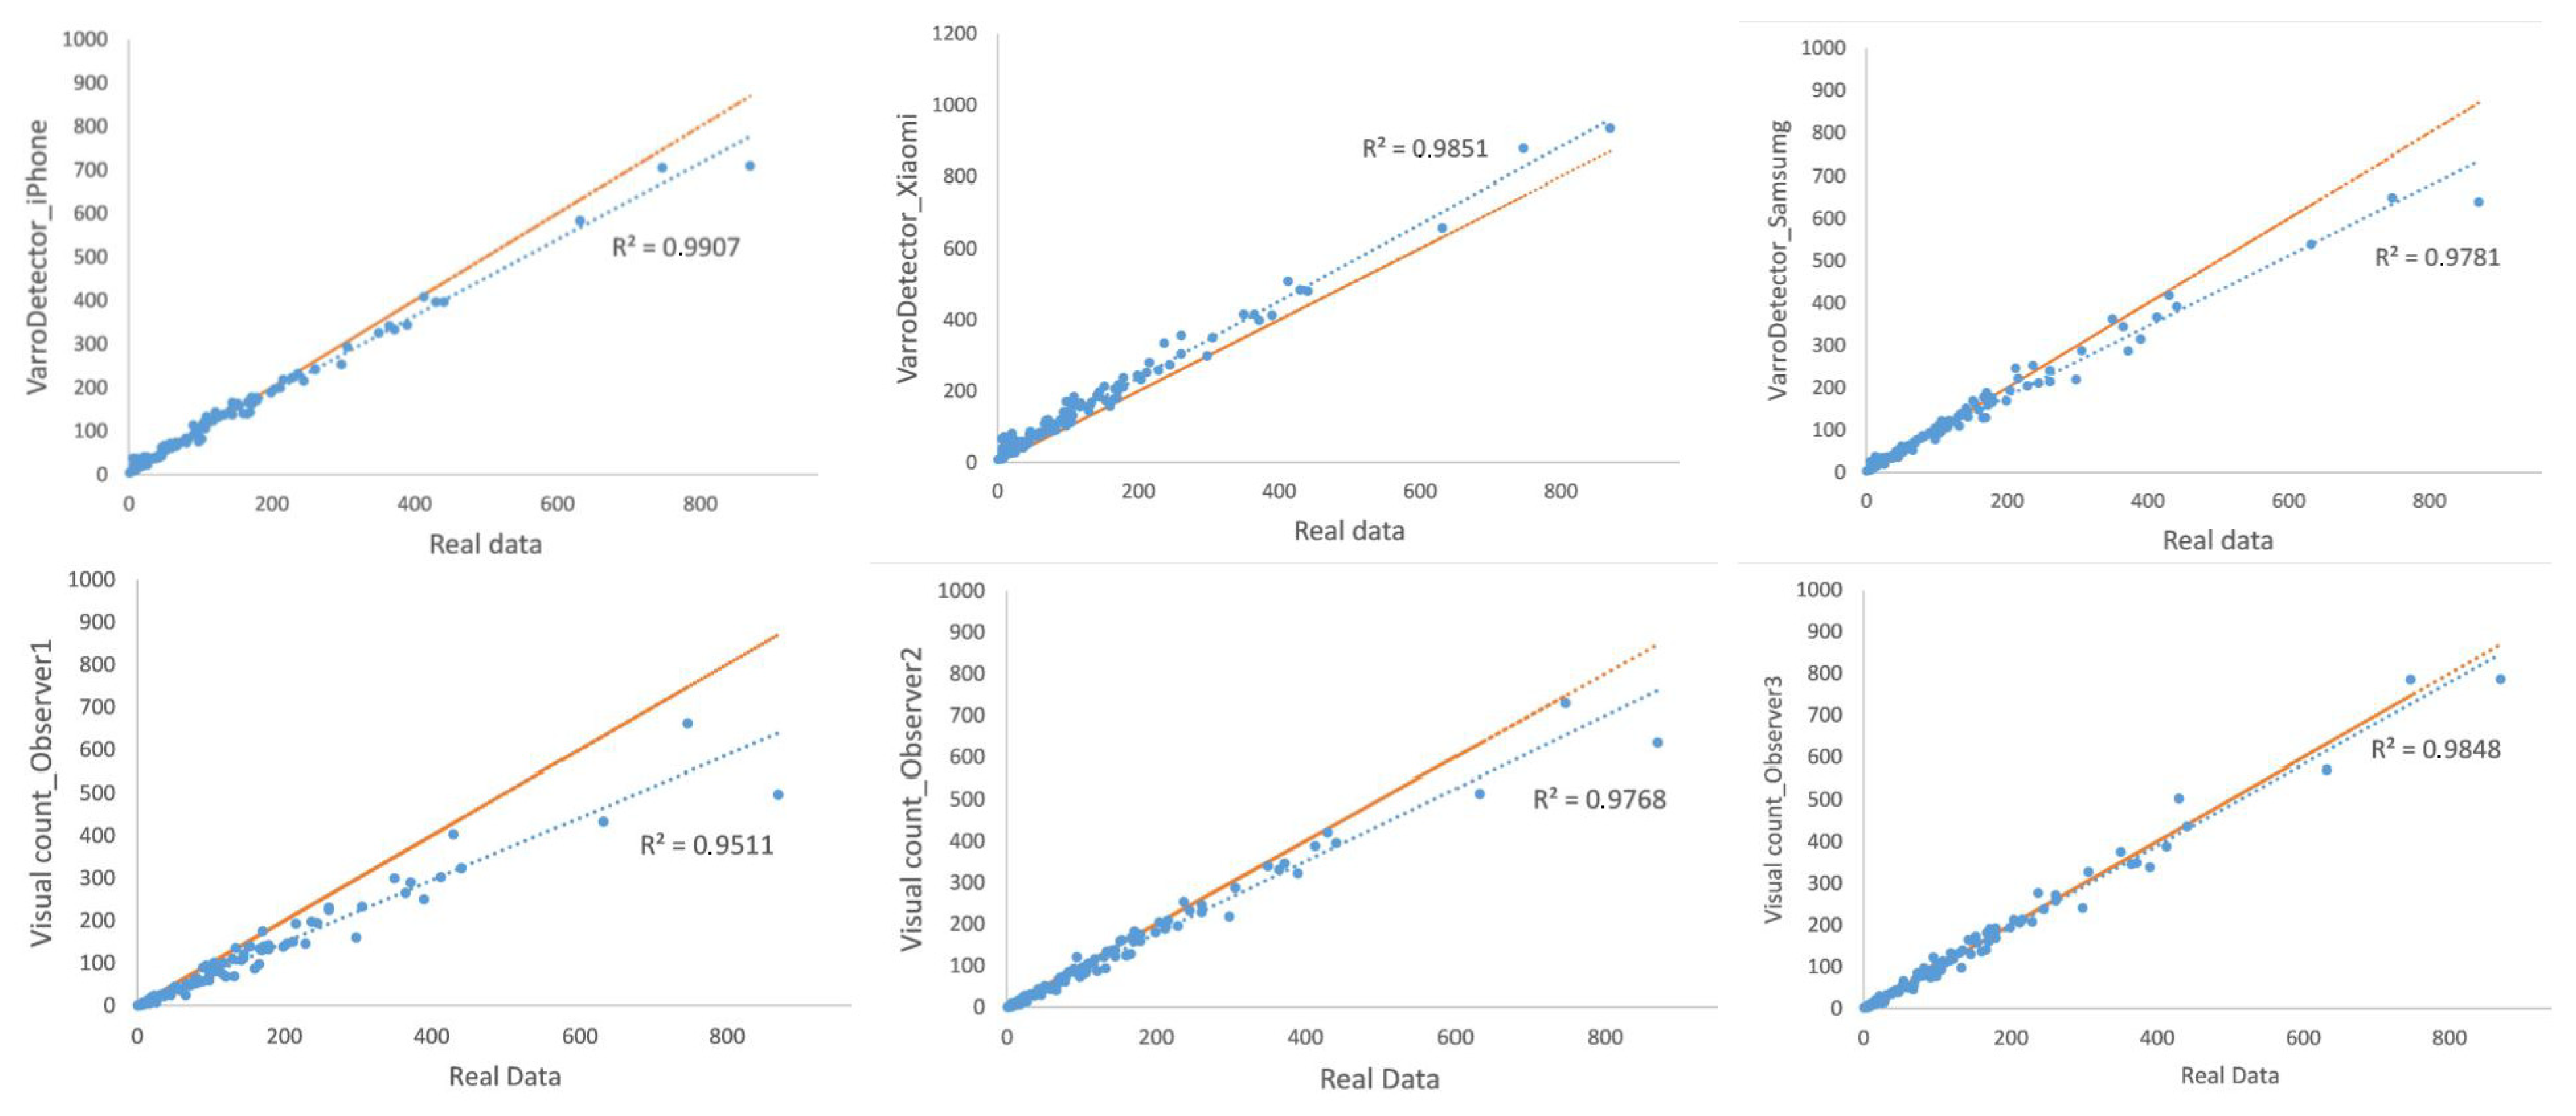
3.3. Accuracy of Varroa Counting Methods (Visual Inspection and VarroDetector) Compared to the Real Value
4. Discussion
5. Conclusions
Author Contributions
Funding
Data Availability Statement
Conflicts of Interest
Abbreviations
| DWV | Deformed Wing Virus |
| AI | Artificial Intelligence |
| GPU | Graphics Processing Unit |
| mAP | Mean Average Precision |
| ROI | Region of Interest |
References
- Potts, S.G.; Biesmeijer, J.C.; Kremen, C.; Neumann, P.; Schweiger, O.; Kunin, W.E. Global pollinator declines: Trends, impacts and drivers. Trends Ecol. Evol. 2010, 25, 345–353. [Google Scholar] [CrossRef] [PubMed]
- Hung, K.L.J.; Kingston, J.M.; Albrecht, M.; Holway, D.A.; Kohn, J.R. The worldwide importance of honey bees as pollinators in natural habitats. Proc. R. Soc. B Biol. Sci. 2018, 285, 20172140. [Google Scholar] [CrossRef]
- Soroker, V.; Hetzroni, A.; Yakobson, B.; David, D.; David, A.; Voet, H.; Slabezki, Y.; Efrat, H.; Levski, S.; Kamer, Y.; et al. Evaluation of colony losses in Israel in relation to the incidence of pathogens and pests. Apidologie 2011, 42, 192–199. [Google Scholar] [CrossRef]
- Clermont, A.; Eickermann, M.; Kraus, F.; Georges, C.; Hoffmann, L.; Beyer, M. A survey on some factors potentially affecting losses of managed honey bee colonies in Luxembourg over the winters 2010/2011 and 2011/2012. J. Apicult. Res. 2014, 53, 43–56. [Google Scholar] [CrossRef]
- Dainat, B.; Evans, J.D.; Chen, Y.P.; Gauthier, L.; Neumann, P. Predictive markers of honey bee colony collapse. PLoS ONE 2012, 7, e32151. [Google Scholar] [CrossRef]
- Hristov, P.; Shumkova, R.; Palova, N.; Neov, B. Factors associated with honey bee colony losses: A mini-review. Vet. Sci. 2020, 7, 166. [Google Scholar] [CrossRef]
- De la Mora, A.; Goodwin, P.H.; Emsen, B.; Kelly, P.G.; Petukhova, T.; Guzman-Novoa, E. Selection of Honey Bee (Apis mellifera) Genotypes for Three Generations of Low and High Population Growth of the Mite Varroa destructor. Animals 2024, 14, 3537. [Google Scholar] [CrossRef]
- Mondet, F.; Beaurepaire, A.; McAfee, A.; Locke, B.; Alaux, C.; Blanchard, S.; Danka, B.; Le Conte, Y. Honey bee survival mechanisms against the parasite Varroa destructor: A systematic review of phenotypic and genomic research efforts. Int. J. Parasitol. 2020, 50, 433–447. [Google Scholar] [CrossRef]
- Dietemann, V.; Nazzi, F.; Martin, S.J.; Anderson, D.L.; Locke, B.; Delaplane, K.S.; Wauquiez, Q.; Tannahill, C.; Frey, E.; Ziegelmann, B.; et al. Standard methods for varroa research. J. Apic. Res. 2013, 52, 1–54. [Google Scholar] [CrossRef]
- Ramsey, S.D.; Ochoa, R.; Bauchan, G.; Gulbronson, C.; Mowery, J.D.; Cohen, A.; Lim, D.; Joklik, J.; Cicero, J.M.; Ellis, J.D.; et al. Varroa destructor feeds primarily on honey bee fat body tissue and not hemolymph. Proc. Natl. Acad. Sci. USA 2019, 116, 1792–1801. [Google Scholar] [CrossRef]
- Noël, A.; Le Conte, Y.; Mondet, F. Varroa destructor: How does it harm Apis mellifera honey bees and what can be done about it? Emerg. Top. Life Sci. 2020, 4, 45–57. [Google Scholar] [CrossRef] [PubMed]
- DeGrandi-Hoffman, G.; Curry, R. A mathematical model of varroa mite (Varroa destructor anderson and trueman) and honeybee (Apis mellifera L.) population dynamics. Int. J. Acarol. 2004, 30, 259–274. [Google Scholar] [CrossRef]
- Ostiguy, N.; Sammataro, D. A simplified technique for counting Varroa jacobsoni Oud. on sticky boards. Apidologie 2000, 31, 707–716. [Google Scholar] [CrossRef]
- Pietropaoli, M.; Gajger, I.T.; Costa, C.; Gerula, D.; Wilde, J.; Adjlane, N.; Sánchez, P.A.; Škerl, M.I.S.; Bubnič, J.; Formato, G. Evaluation of two commonly used field tests to assess varroa destructor infestation on honey bee (Apis mellifera) colonies. Appl. Sci. 2021, 11, 4458. [Google Scholar] [CrossRef]
- Roth, M.A.; Wilson, J.M.; Tignor, K.R.; Gross, A.D. Biology and Management of Varroa destructor (Mesostigmata: Varroidae) in Apis mellifera (Hymenoptera: Apidae) Colonies. J. Integr. Pest Manag. 2020, 11, 1. [Google Scholar] [CrossRef]
- Lee, H.G.; Kim, M.J.; Kim, S.B.; Lee, S.; Lee, H.; Sin, J.Y.; Mo, C. Identifying an Image-Processing Method for Detection of Bee Mite in Honey Bee Based on Keypoint Analysis. Agriculture 2023, 13, 1511. [Google Scholar] [CrossRef]
- Bilik, S.; Kratochvila, L.; Ligocki, A.; Bostik, O.; Zemcik, T.; Hybl, M.; Horak, K.; Zalud, L. Visual Diagnosis of the Varroa Destructor Parasitic Mite in Honeybees Using Object Detector Techniques. Sensors 2021, 21, 2764. [Google Scholar] [CrossRef]
- Sevin, S.; Tutun, H.; Mutlu, S. Detection of Varroa mites from honey bee hives by smart technology Var-Gor: A hive monitoring and image processing device. Turk. J. Vet. Anim. Sci. 2021, 45, 487–491. [Google Scholar] [CrossRef]
- Voudiotis, G.; Moraiti, A.; Kontogiannis, S. Deep Learning Beehive Monitoring System for Early Detection of the Varroa Mite. Signals 2022, 3, 506–523. [Google Scholar] [CrossRef]
- Divasón, J.; Martinez-de-Pison, F.J.; Romero, A.; Santolaria, P.; Yániz, J.L. Varroa Mite Detection Using Deep Learning Techniques. In Hybrid Artificial Intelligent Systems; Lecture Notes in Computer Science (Including Subseries Lecture Notes in Artificial Intelligence and Lecture Notes in Bioinformatics); Springer: Cham, Switzerland, 2023; pp. 326–337. [Google Scholar] [CrossRef]
- Divason, J.; Romero, A.; Martinez-de-Pison, F.J.; Casalongue, M.; Silvestre, M.A.; Santolaria, P.; Yaniz, J.L. Analysis of varroa mite colony infestation level using new open software based on deep learning techniques. Sensors 2024, 24, 3828. [Google Scholar] [CrossRef]
- Scutaru, D.; Bergonzoli, S.; Costa, C.; Violino, S.; Costa, C.; Albertazzi, S.; Capano, V.; Kostić, M.M.; Scarfone, A. An AI-Based Digital Scanner for Varroa destructor Detection in Beekeeping. Insects 2025, 16, 75. [Google Scholar] [CrossRef] [PubMed]
- Redmon, J.; Divvala, S.; Girshick, R.; Farhadi, A. You Only Look Once: Unified, Real-Time Object Detection. In Proceedings of the IEEE Conference on Computer Vision and Pattern Recognition (CVPR), Las Vegas, NV, USA, 27–30 June 2016; pp. 777–778. [Google Scholar]
- Terven, J.; Córdova-Esparza, D.M.; Romero-González, J.A. A Comprehensive Review of YOLO Architectures in Computer Vision: From YOLOv1 to YOLOv8 and YOLO-NAS. Mach. Learn. Knowl. Extr. 2023, 5, 1680–1716. [Google Scholar] [CrossRef]
- Wong, A.; Famuori, M.; Shafiee, M.J.; Li, F.; Chwyl, B.; Chung, J. YOLO Nano: A Highly Compact You only Look Once Convolutional Neural Network for Object Detection. In Proceedings of the Proceedings 5th Workshop on Energy Efficient Machine Learning and Cognitive Computing, EMC2-NIPS 2019, Vancouver, BC, Canada, 13 December 2019; pp. 22–25. [Google Scholar]
- Padilla, R.; Netto, S.L.; Da Silva, E.A.B. A Survey on Performance Metrics for Object-Detection Algorithms. In Proceedings of the International Conference on Systems, Signals, and Image Processing, Niterói, Brazil, 1–3 July 2020; pp. 237–242. [Google Scholar]
- Smirnov, N.V. Table for estimating the goodness of fit of empirical distributions. Ann. Math. Stat. 1948, 19, 279–281. [Google Scholar] [CrossRef]
- Levene, H. Robust tests for equality of variances. In Contributions to Probability and Statistics: Essays in Honor of Harold Hotelling; Olkin, I., Ghurye, S.G., Hoeffding, W., Madow, W.G., Mann, H.B., Eds.; Stanford University Press: Redwood City, CA, USA, 1960; pp. 278–292. [Google Scholar]
- Lecun, Y.; Bengio, Y.; Hinton, G. Deep learning. Nature 2015, 521, 436–444. [Google Scholar] [CrossRef] [PubMed]
- Bates, K.; Le, K.; Lu, H. Deep learning for robust and flexible tracking in behavioral studies for C. elegans. PLoS Comput. Biol. 2022, 18, e1009942. [Google Scholar] [CrossRef]
- Geldenhuys, D.S.; Josias, S.; Brink, W.; Makhubele, M.; Hui, C.; Landi, P.; Bingham, J.; Hargrove, J.; Hazelbag, M.C. Deep learning approaches to landmark detection in tsetse wing images. PLoS Comput. Biol. 2023, 19, e1011194. [Google Scholar] [CrossRef]
- Akyon, F.C.; Altinuc, S.O.; Temizel, A. Slicing aided hyper inference and fine-tuning for small object detection. In Proceedings of the IEEE International Conference on Image Processing (ICIP), Bordeaux, France, 16–19 October 2022; pp. 966–970. [Google Scholar] [CrossRef]
- Ren, S.; He, K.; Girshick, R.; Sun, J. Faster R-CNN: Towards real-time object detection with region proposal networks. In Proceedings of the Advances in Neural Information Processing Systems, Montreal, Canada, 7–12 December 2015; pp. 91–99. [Google Scholar]
- Liu, M.; Cui, M.; Xu, B.; Liu, Z.; Li, Z.; Chu, Z.; Zhang, X.; Liu, G.; Xu, X.; Yan, Y. Detection of Varroa destructor Infestation of Honeybees Based on Segmentation and Object Detection Convolutional Neural Networks. Agriengineering 2023, 5, 1644–1662. [Google Scholar] [CrossRef]


| Parameter Analyzed—Efficiency | Statistical Analysis Applied |
|---|---|
| Comparison of the time efficiency between visual inspection and VarroDetector methods for the detection of Varroa mites. | None; data illustrated through graphical representation only. |
| Parameter Analyzed—Repeatability | Statistical Analysis Applied |
| Correlation between VarroDetector replicates as a function of sheet orientations. | Pearson correlation analysis. |
| Parameter Analyzed—Accuracy | Statistical Analysis Applied |
| Accuracy of the visual and VarroDetector counting methods relative to the reference data. | Standard deviations, Friedmann test (non-parametric for paired samples). |
| Correlation between the two counting methods and the reference data. | Pearson correlation analysis. |
| Accuracy of the visual and VarroDetector counting methods relative to the reference data. | Cumulative percentage error. |
| Range of Varroa Mite per Sheet | Number of Sheets | Dev Standard R-Visual | Dev. Standard R-VarroDetector |
|---|---|---|---|
| 0 ≤ N ≤ 10 | 10 | 1.74 ** | 10.51 ** |
| 10 < N ≤ 50 | 35 | 4.13 ** | 6.55 ** |
| 50 < N ≤ 100 | 19 | 10.94 ** | 9.71 |
| 100 < N ≤ 200 | 28 | 14.16 ** | 13.35 |
| N > 200 | 20 | 52.74 ** | 35.44 ** |
| Range of Varroa Mite per Sheet | Number of Sheets | Total Number of Varroa Mites Counted with Visual Inspection | Total Number of Varroa Mites Counted with VarroDetector | Real Number (Control) | Error % Visual | Error % VarroDetector |
|---|---|---|---|---|---|---|
| 0 ≤ N ≤ 10 | 10 | 35 | 179 | 72 | 32.01 | 148.61 |
| 10 < N ≤ 50 | 35 | 631 | 1187 | 957 | 21.70 | 24.03 |
| 50 < N ≤ 100 | 19 | 1067 | 1498 | 1465 | 12.65 | 2.25 |
| 100 < N ≤ 200 | 28 | 3095 | 3969 | 3962 | 10.02 | 0.18 |
| N > 200 | 20 | 5597 | 6849 | 7479 | 12.68 | 8.42 |
Disclaimer/Publisher’s Note: The statements, opinions and data contained in all publications are solely those of the individual author(s) and contributor(s) and not of MDPI and/or the editor(s). MDPI and/or the editor(s) disclaim responsibility for any injury to people or property resulting from any ideas, methods, instructions or products referred to in the content. |
© 2025 by the authors. Licensee MDPI, Basel, Switzerland. This article is an open access article distributed under the terms and conditions of the Creative Commons Attribution (CC BY) license (https://creativecommons.org/licenses/by/4.0/).
Share and Cite
Yániz, J.; Casalongue, M.; Martinez-de-Pison, F.J.; Silvestre, M.A.; Consortium, B.; Santolaria, P.; Divasón, J. An AI-Based Open-Source Software for Varroa Mite Fall Analysis in Honeybee Colonies. Agriculture 2025, 15, 969. https://doi.org/10.3390/agriculture15090969
Yániz J, Casalongue M, Martinez-de-Pison FJ, Silvestre MA, Consortium B, Santolaria P, Divasón J. An AI-Based Open-Source Software for Varroa Mite Fall Analysis in Honeybee Colonies. Agriculture. 2025; 15(9):969. https://doi.org/10.3390/agriculture15090969
Chicago/Turabian StyleYániz, Jesús, Matías Casalongue, Francisco Javier Martinez-de-Pison, Miguel Angel Silvestre, Beeguards Consortium, Pilar Santolaria, and Jose Divasón. 2025. "An AI-Based Open-Source Software for Varroa Mite Fall Analysis in Honeybee Colonies" Agriculture 15, no. 9: 969. https://doi.org/10.3390/agriculture15090969
APA StyleYániz, J., Casalongue, M., Martinez-de-Pison, F. J., Silvestre, M. A., Consortium, B., Santolaria, P., & Divasón, J. (2025). An AI-Based Open-Source Software for Varroa Mite Fall Analysis in Honeybee Colonies. Agriculture, 15(9), 969. https://doi.org/10.3390/agriculture15090969