1. Introduction
The rising global demand for food has led to growing public concern about animal welfare. Studies have shown significant correlations between common behavioral modalities in group-housed pig and their health status [
1]. Among these behaviors, eating, lying on the belly, lying on the side, and standing are key indicators of pigs’ physical health. Specifically, eating behavior directly reflects nutritional intake levels, and abnormal feeding frequency can effectively signal potential illness [
2]. Postural behaviors like lying on the belly, lying on the side, and standing help assess the animals’ comfort levels and can also serve as indicative signs of external injuries [
3]. Furthermore, the timing and frequency of posture changes are particularly important indicators during the gestation period in sows, providing valuable insights into their health status [
4]. Continuous monitoring of these behaviors facilitates the early detection of health problems and enables timely adjustments to feeding and management strategies, thereby enhancing animal welfare while ensuring economic efficiency in pig production.
As research into human–animal–robot [
5,
6] interactions advances, the use of robotic agents in standardized production has become a key strategy for the sustainable development of animal husbandry. In recent years, functional robots have been increasingly deployed in group-housed animal-farming systems to perform specific tasks, such as poultry house inspection [
7] and automated cattle feeding [
8]. However, conventional robotic perception systems, which rely on sensors with limited information bandwidths (e.g., infrared or radar), have limited ability to detect health-related behavioral patterns in livestock. Although wearable or implantable sensors can be used to monitor pig behavior, such methods may adversely affect their health and welfare. Against this backdrop, accurate behavior-detection technologies have emerged as a breakthrough tool for enhancing the efficiency and sustainability of farm management [
9].
Automated detection technology based on machine vision enables effective assessment of physiological status and growth performance [
10,
11,
12]. These technologies have achieved field-tested success in several agricultural areas, including posture monitoring in dairy cattle [
13] and behavior tracking in the field of poultry [
14]. In recent years, research interest in pig health status detection and posture recognition has grown significantly. Several studies have adopted multidimensional machine learning approaches to identify disease manifestations and behavioral patterns in pigs simultaneously [
15]. For instance, Lee [
16] employed depth sensors to capture the movement characteristics of pigs and applied support vector machines (SVM) to predict aggressive behavior based on posture analysis in farm environments. Other researchers have developed methods using motion history images to extract kinematic features [
17]. Additionally, prior research has demonstrated that utilizing acceleration features and hierarchical clustering [
18], in combination with the kinetic energy differences between adjacent video frames [
19], can significantly enhance the accuracy of aggressive behavior recognition in group-housed pigs. These studies offer viable solutions for early warning and continuous monitoring of pigs’ health status. However, these methods exhibit compromised robustness when dealing with real-world disturbances, including illumination variance, partial occlusion, and heterogeneous farm configurations, resulting in performance degradation.
In the field of deep learning, this approach demonstrates superior performance in addressing the aforementioned challenges. This technical paradigm has also achieved serial breakthroughs in pig behavior detection: Wei et al. [
20] proposed an EMA-YOLOv8 enhanced behavior-detection framework integrated with ByteTrack. Through quantitative analysis of multi-scale feature coupling between individual pig motion trajectory parameters (detection accuracy 96.4%) and aggressive behaviors (head-neck biting/body collisions). Yang et al. [
11] conducted a comprehensive review of methodological advances in pig body segmentation, individual detection, and behavior recognition using computer vision technologies for intelligent livestock monitoring. Nasirahmadi et al. [
21] proposed a deep learning framework integrating R-FCN and ResNet101 for automated detection of standing and lying postures in pigs through machine vision analysis. Ji et al. [
22] introduced an enhanced YOLOX architecture for multi-pose detection in group-housed pigs, enabling accurate detection of standing, lying, and sitting postures. An enhanced Faster R-CNN framework was proposed by Riekert et al. [
23] for real-time localization of swine spatial coordinates and behavioral posture discrimination between recumbent and ambulatory states. Kai et al. [
24] proposed an automatic temporal detection method that utilizes RGB data and optical flow to detect aggressive behaviors among group-housed pigs. In addition, Chen et al. [
25] systematically constructed a multimodal algorithm-evaluation framework for pig posture detection, establishing cross-scenario deployment standards through quantitative analysis of synergistic gain boundaries between multi-source data (RGB/depth camera fusion) and network architectures (two-stage/single-stage). Zhong et al. [
26] proposed the YOLO-DLHS-P model by introducing a Dilated Reparameterization Block (C2f-DRB) into the YOLOv8n baseline network, achieving a 52.49% parameter reduction while improving localization accuracy by 1.16%. Moreover, deep learning-based behavior-detection methods have achieved outstanding performance in group-housed animals such as sheep [
27] and cattle [
28].
Notably, recent studies have demonstrated that various advanced methods not only achieve high-accuracy pig posture recognition but also exhibit strong adaptability to environmental disturbances commonly encountered in real-world farming conditions. However, in complex herd environments, these environmental factors remain key challenges that significantly constrain detection accuracy. Kim et al. [
29] developed angular refinement modules integrated with YOLOv3/v4 architectures to enable robust identification of feeding behavior in group-housed weaned pigs under intensive farming conditions. Zhang et al. [
30] developed a collaborative tracking framework combining CNN detectors with correlation filter trackers, achieving 87.6% tracking accuracy under lighting variations and partial occlusion scenarios. Mao et al. [
31] proposed the DM-GD-YOLO model, which integrates deformable convolution and attention mechanisms, and dynamically models non-rigid deformation features (e.g., body collisions/posture variations) through C2f-DM modules. Combined with cross-scale feature aggregation-dispersion mechanisms, this 6 MB parameter model achieves synchronous detection of seven behaviors (including three anomalies) in high-density group housing (30 pigs/pen) with 95.3% mAP, providing a lightweight real-time monitoring solution for intensive farming. However, fundamental challenges remain in complex herd environments. Camera positions are often insufficient to capture fine details of distant or small targets. Additionally, during multi-scale processing, the upsampling and downsampling of feature maps can introduce semantic gaps, which adversely affect detection accuracy. In group pig farming, particularly under non-orthogonal viewing angles, the head and tail of an individual pig may appear spatially separated. Traditional convolutional layers struggle to model such long-range spatial dependencies, making it difficult to associate relevant features and often leading to segmentation errors.
The challenge of modeling long-range dependencies has shown significant progress in subsequent research efforts. Recent advances in state space models (SSMs) provide new insights. Mamba-based SSM architectures demonstrate linear-time complexity for long-range dependency modeling [
32,
33], significantly improving computational efficiency. Fazzari et al. [
34] proposed the Mamba-MSQNet model, achieving 74.6 mAP in animal behavior detection with 2.3M parameters (90% computational reduction) through Transformer-to-Mamba block replacement for selective state space modeling. Inspired by this, Mamba was integrated into the target-detection framework, enabling efficient feature modeling and resource optimization in complex breeding environments.
To address the aforementioned challenges in intensive animal farming and enhance the detection accuracy of four key behavioral states—eating, lying on the belly, lying on the side, and standing—this study proposes a novel Mamba-YOLO hybrid architecture.
The main contributions of this paper include:
An efficient multi-behavior-recognition algorithm for pigs, named Mamba-driven Adaptive Cross-layer Attention Network (MACA-Net), capable of recognizing various pig behaviors in group-housing environments.
An Adaptive Multi-Path Attention mechanism (AMPA), which effectively constructs attention maps across spatial and channel dimensions, significantly enhancing the model’s focus. This mechanism can serve as a valuable reference for other detection tasks.
The Mamba Global–Local Extractor (MGLE) module is proposed to enhance the model’s global modeling capabilities while mitigating Mamba’s tendency to overlook fine-grained details in visual tasks. This module may also serve as a reference for extending Mamba to other vision-related applications.
The Cross-layer Feature Pyramid Transformer (CFPT) is integrated into the proposed framework, effectively mitigating the semantic gap in multi-scale feature transmission. This enhancement significantly improves the aggregation capability of multi-scale features for pig behavior recognition.
2. Materials and Methods
2.1. Animals, Housing and Management
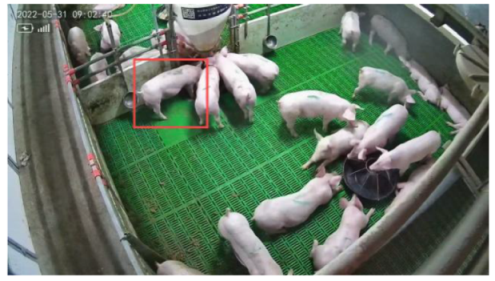
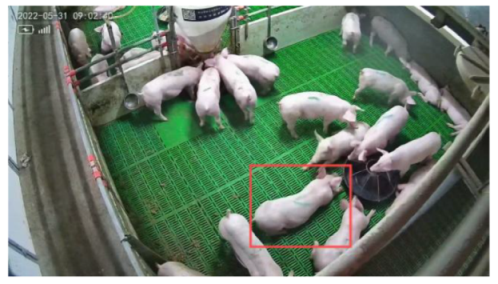
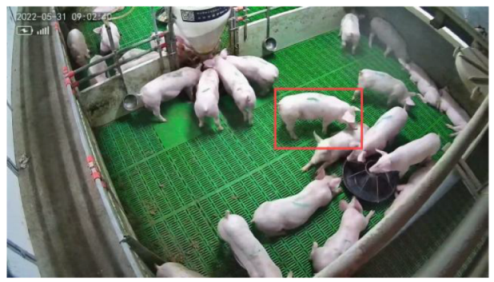
All dataset collection for this study was conducted between May and June 2022 at a large-scale commercial pig farm in Wenshan City, Yunnan Province, which is a real-world production facility engaging in standard commercial pig-farming practices. Each pen in the facility measured 3.5 m in length and 2.2 m in width, equipped with plastic slatted floors. The standard pen configuration included one feeding trough and two drinking nozzles, with each unit housing 20 pigs of the hybrid variety (Large White × Landrace × Duroc). The quantity of feed was adjusted according to the age specifications for pigs, with twice-daily feedings administered at 8:00 a.m. and 3:00 p.m. All observed pigs were managed under unaltered commercial husbandry conditions, ensuring that the behavioral data reflect authentic production environments.
The video data was captured using RGB cameras (Zhongwo CWT003, Shenzhen, China), mounted at the lower-left corner of each pen with a 50-degree downward angle. This setup follows the original installation position and angle of surveillance equipment in commercial pig farms. Compared to conventional orthogonal monitoring angles, this configuration enables full spatial coverage without relying on the installation height of the equipment, making it more consistent with the objectives of this study. To enhance data diversity and model robustness, we performed recordings under both high-intensity and low-intensity illumination conditions. The video streams captured during this process were then transmitted simultaneously via a wireless network to cloud servers for subsequent storage. The footage was stored in the Transport Stream format on hard drives, resulting in approximately 162 h of footage at a resolution of 2304 × 1296.
2.2. Image Acquisition and Data Preprocessing
The construction of the dataset followed a six-stage process initiated through the observation of group-housed pig behaviors via video pre-screening. To capture behavioral diversity, videos with a relatively balanced range of pig activities were selectively chosen, resulting in a total of 84 video samples. Using FFmpeg, frames were extracted at one-second intervals, with the original resolution preserved as JPG files. Excessively distorted data were manually filtered through quality screening, resulting in a curated dataset of 5159 images with well-defined foreground-background separation. This final collection comprised 1250 low-light condition samples and 3909 standard-illumination specimens.
In the annotation phase, Labelme implemented strict inclusion criteria: excluded individuals with >60% occlusion or non-target pen origins, while classifying behaviors into four discrete categories (lying on belly, lying on side, feeding, standing). Identification criteria with corresponding examples are formalized in
Table 1. JSON-formatted labels were converted to YOLO format prior to dataset partitioning.
In order to mitigate the occurrence of data leakage from behavioral consistency in consecutive frames, source-based splitting was implemented at the video clip level. Based on empirical observations, the final dataset was partitioned into training, validation, and test sets using a stratified 8:1:1 ratio. Since each image contains multiple instances, the instance count for each behavioral category is summarized in
Table 2.
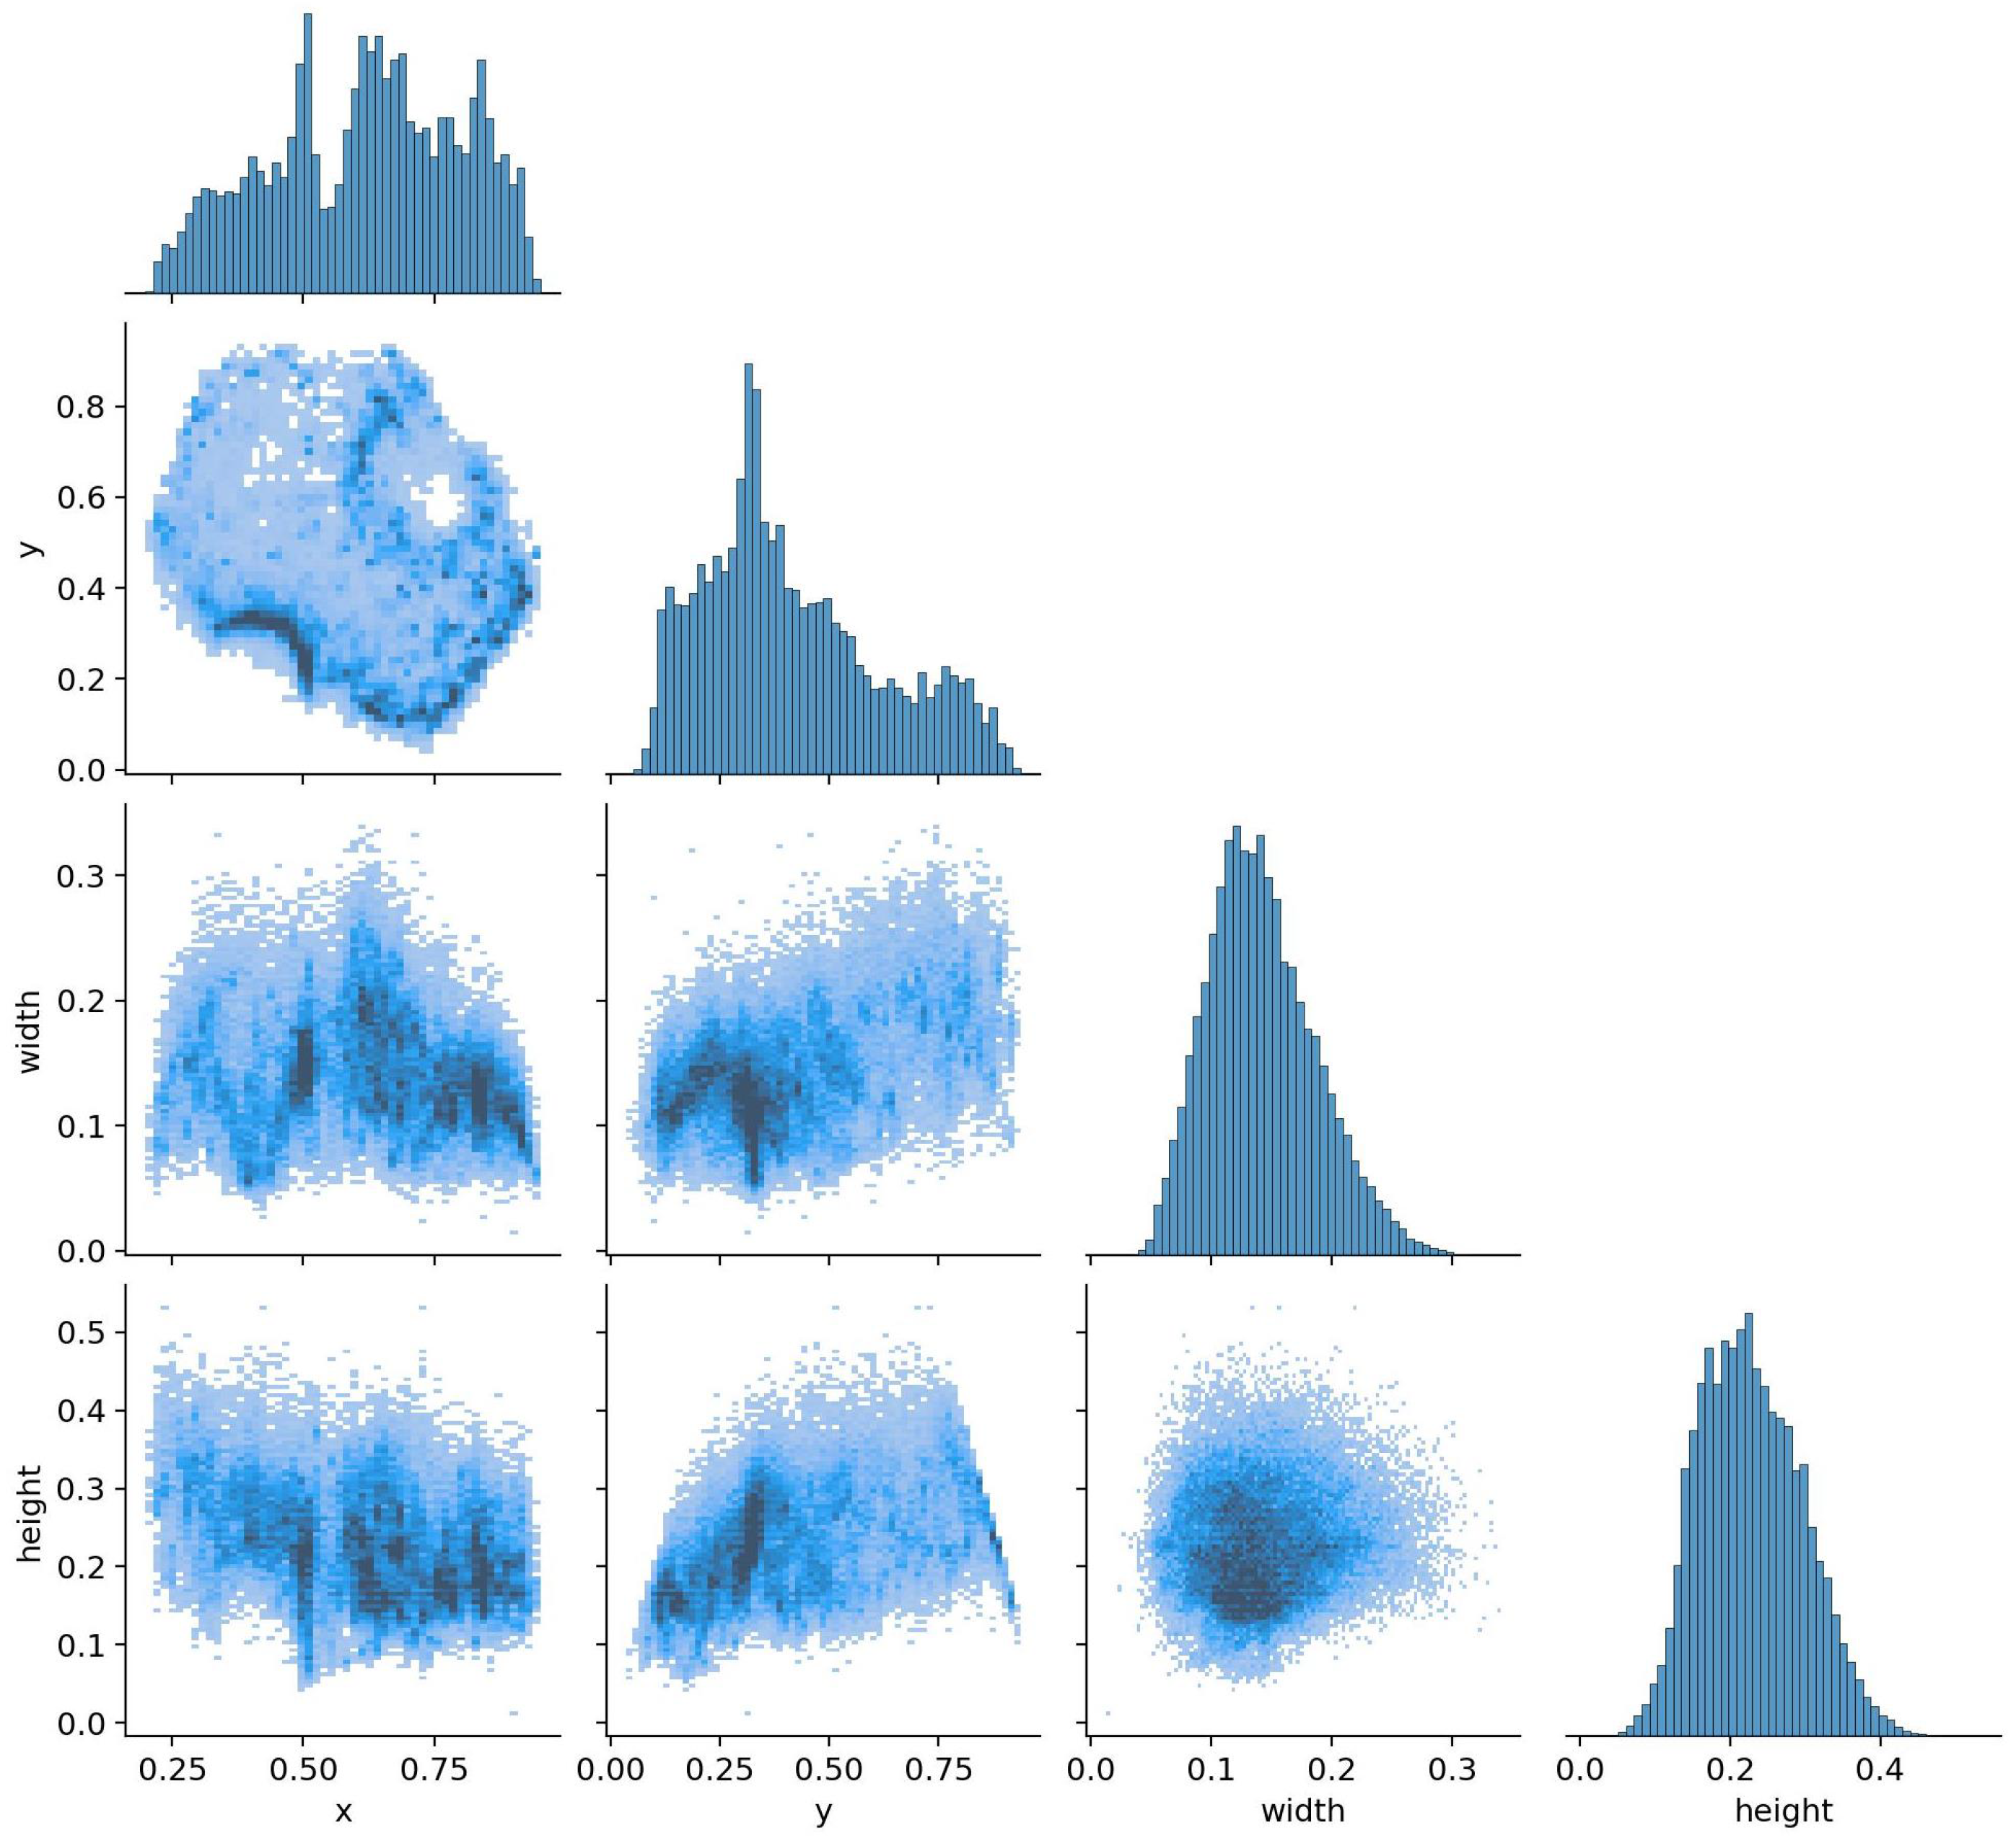
Figure 1 illustrates the spatial distribution of bounding boxes and the variation in target scales, both of which are critical factors for effective model training.
To enhance the robustness of the model, this study employs Mosaic Data Augmentation (MDA) [
35] for online data augmentation. Specifically, it incorporates Mosaic augmentation, Mixup augmentation, random perspective transformation, and HSV augmentation, effectively increasing data diversity.
2.3. Mamba-Driven Adaptive Cross-Layer Attention Network
In group-housed pig-farming environments, significant positional variations are exhibited by the pigs, and camera orientations often deviate from perfect perpendicular alignment with the ground plane (top-down view), leading to significant scale variations in the visual representation of pigs across image sequences. This inherent scale variability poses substantial challenges for conventional models in effectively extracting and fusing multiscale spatial information. While the YOLOv8 model has been shown to be proficient in behavior classification and mitigates certain information loss through its architecture, it exhibits limitations in three critical aspects: (1) modeling long-range dependencies in spatial-temporal contexts while maintaining computational economy, (2) adaptive fusion of multiscale features under perspective distortion, and (3) efficient detection of small distant targets. To address these challenges, we propose MACA-Net (Mamba-Driven Adaptive Cross-Layer Attention Network), a efficient model that integrates state space models with cross-layer attention mechanisms. The overall architecture of the proposed MACA-Net in this paper is depicted in
Figure 2.
The MACA-Net follows the architectural composition of the YOLO series, comprising three integral components: the Backbone, Neck, and Head. The Backbone inherits the primary framework of YOLOv8, but it replaces the C2f module with the Mamba Global–Local Extractor (MGLE) module to capture gradient-rich information flows. The MGLE-Module employs a three-branch architecture that enhances long-range dependency modeling while preserving local details. This module is integrated with an Adaptive Multi-Path Attention (AMPA) mechanism to suppress redundant features. The Backbone processes input images to generate three multi-scale feature maps , which encapsulate hierarchical features from fine to coarse resolutions. These features are then directed into the Neck.
For the Neck, we abandon the original bidirectional flow structure of PAN [
36] and instead adopt a Transformer-based CFPT [
37] module. This design facilitates cross-layer feature interaction across spatial and channel dimensions, thereby strengthening information aggregation capabilities. Finally, the model utilizes general YOLO detection heads for classification and localization tasks. The proposed architecture maintains efficient learning and inference capabilities while becoming more lightweight through structural optimization.
2.4. State Space Models
Mamba [
32] is predicated on state space models (SSMs), which were developed from the Kalman filter [
38]. Compared to Transformer-based architectures, Mamba exhibits comparable proficiency in long-sequence modeling while sustaining a linear time complexity, a substantial advantage in terms of data handling efficiency. SSMs map an input sequence
to an output sequence
through a hidden state
, showcasing significant potential in complex sequence modeling tasks. The core mathematical formulation of SSMs is defined as follows:
where
represents the state transition matrix,
denotes the input projection matrix, and
is the output projection matrix. In order to adapt SSMs for deep learning applications and enable efficient computation on modern hardware, a discretization step with input resolution
(step size) is introduced. This converts the continuous-time system into a discrete-time system via the zero-order hold (ZOH) method, parameterized as
. The discretized matrices
and
are defined as:
where
denotes the matrix exponential and
is the identity matrix. After discretization, the model leverages two distinct computation modes to accommodate training and inference requirements:
where ∗ denotes the convolution operation and
L is the sequence length. This kernel formulation enables hardware-optimized parallel computation during training.
2.5. Mamba Global–Local Extractor Module
In large-scale pig farm monitoring, the significant variation in pixel occupancy of individual pigs, attributable to perspective distortions and spatial distribution, in conjunction with the presence of semantically analogous features dispersed across distant regions in intricate herd environments, significantly complicates image modeling. This predicament underscores the need for augmented global receptive field expansion and enhanced long-range dependency modeling as pivotal research directions.
To address the limitations of global representation in vision tasks, VMamba [
39] introduces the 2D-Selective-Scan (SS2D) module (
Figure 3), which adapts state space models to visual processing. SS2D employs a novel spatial traversal strategy—Cross-Scan—that unfolds input patches into 1D subsequences along four distinct scanning directions. This multi-directional scanning reorganizes image regions to construct enriched feature representations. Each sequence is independently processed by dedicated S6 blocks [
32], and their outputs are aggregated into 2D feature maps. This design enables each pixel to integrate contextual information from all directions through parameterized pathways, effectively establishing a global receptive field while preserving long-range dependencies—addressing the core limitations of conventional convolutional operations.
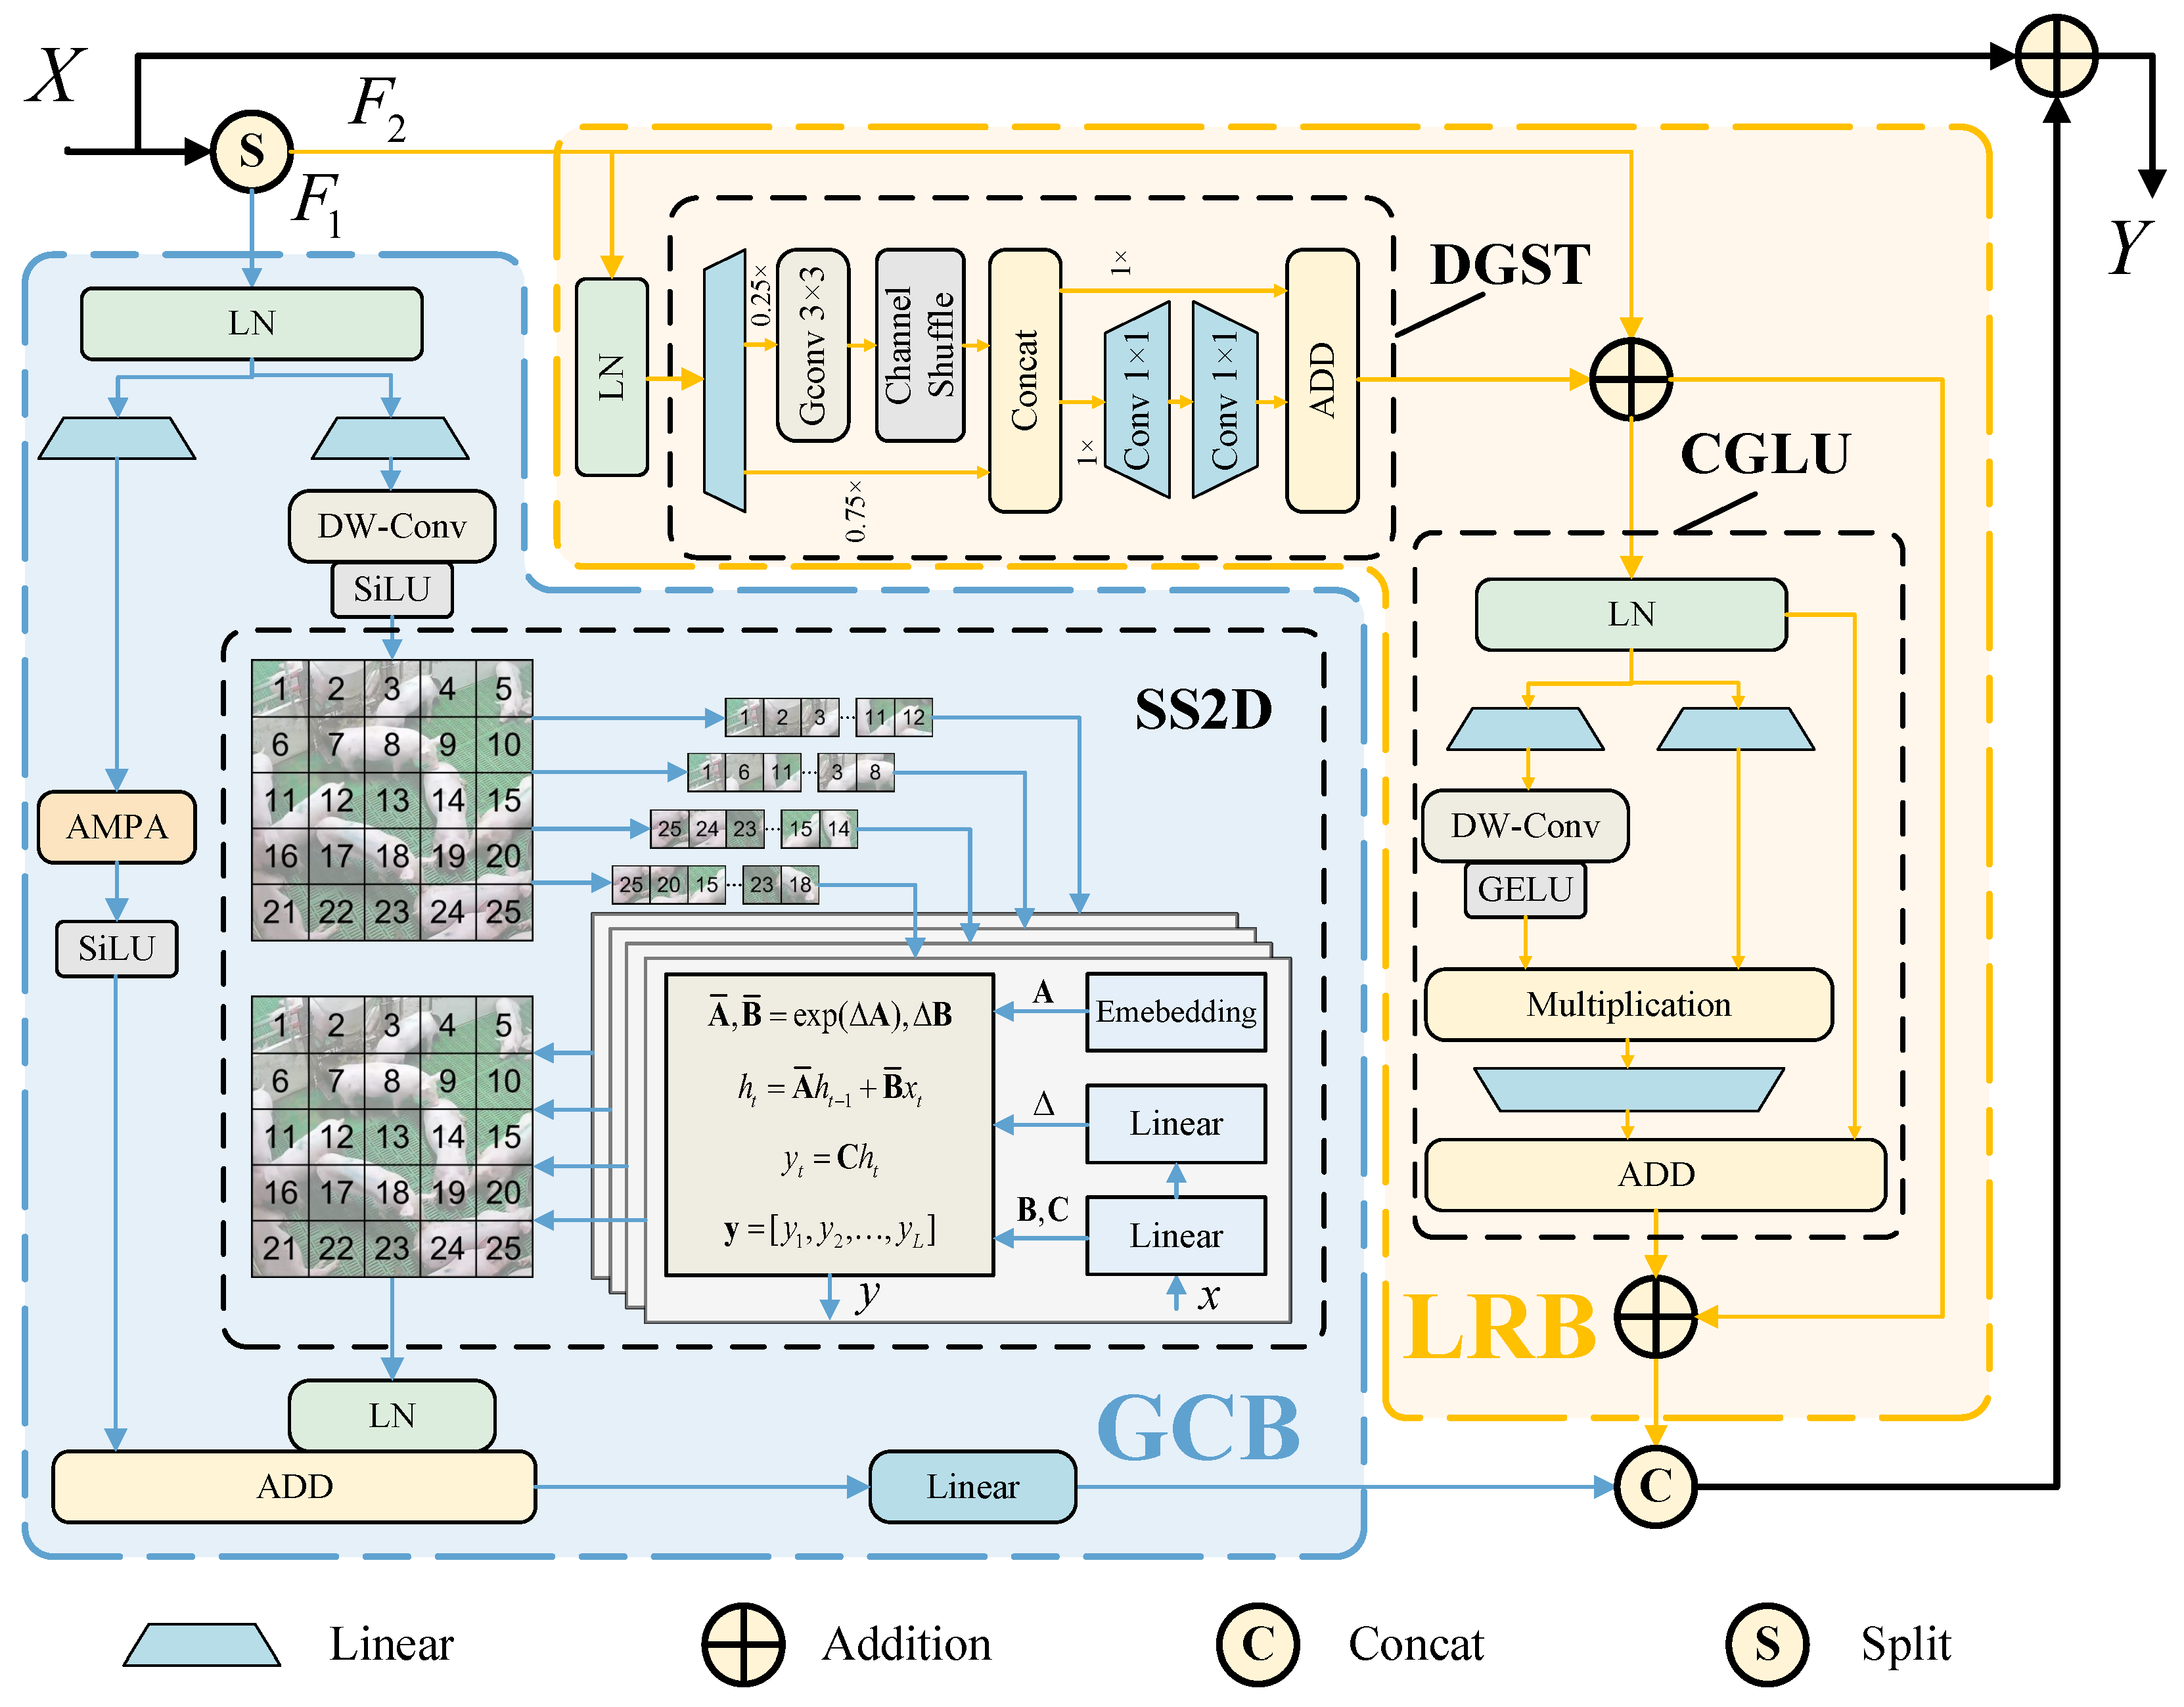
The Mamba framework has been demonstrated to exhibit remarkable efficiency in the domain of sequence modeling. However, it is confronted with significant challenges in the extraction of discriminative local features when processing visual tasks characterized by complex scale variations. In order to address this critical limitation, we propose the Mamba Global–Local Extractor Module (MGLE-Module), as illustrated in
Figure 3. Specifically, given an input tensor
, the module first splits the feature maps along the channel dimension into two equal partitions:
and
. These partitions are processed through two specialized branches: the Global Contextualization Branch (GCB) extracts rich multi-scale contextual information, while the Local Refinement Branch (LRB) preserves spatial details. The processed features are concatenated and enhanced with a residual connection to facilitate gradient flow, yielding the final output
. This operation is formally expressed as:
where
and
denote the global and local processing branches, respectively.
2.5.1. Global Contextualization Branch
The Global Contextualization Branch employs a dual-path architecture based on SSMs to enhance feature representation. The input features first undergo layer normalization before being split into two parallel sub-paths. The first sub-path sequentially applies Depthwise Separable Convolution (DW-Conv) [
40] and activation functions to learn deeper feature representations, followed by the SS2D module for global context modeling, and concludes with a linear projection layer. The second sub-path integrates an Adaptive Multi-Path Attention (AMPA) mechanism (detailed in
Section 2.6) with activation functions to refine feature dependencies.
For feature fusion, while gated mechanisms such as Gated MLP [
41] demonstrated efficacy in natural language processing (NLP). However, our observations indicate that the application of gating mechanisms to selectively filter output features based on shallow-level representations could compromise the long-range dependencies systematically constructed by SS2D’s directional scanning paradigm. To preserve these dependencies while incorporating attention-guided refinements, we adopt a simple yet effective additive fusion strategy.
2.5.2. Local Refinement Branch
The LRB architecture is inspired by the Transformer’s abstract design, which has shown remarkable potential in visual tasks, as evidenced by the empirical success of MetaFormer [
42]. For computational efficiency, we employ DGST [
43] as the core feature extraction component. DGST innovatively combines the channel shuffle technique from ShuffleNetV2 [
44] with group convolution principles. The module first expands channel dimensions via 1 × 1 convolutions before splitting features into primary and auxiliary branches. The primary branch utilizes GConv [
45] to explicitly model spatial locality within individual channels, capturing fine-grained patterns without cross-channel interference. The channel shuffle operation dynamically recombines grouped features through tensor reshaping and permutation, enabling cross-region interaction while preserving spatial coherence. Simultaneously, the auxiliary branch integrates the remaining three-quarters of channels into the primary branch to preserve global contextual information. DGST achieves computationally efficient localized feature extraction while balancing parameter reduction.
It has been demonstrated that the Multi-Layer Perceptron (MLP) architecture in Long Short-Term Memory (LSTM) networks, which also follows the Transformer design, lacks selectivity in processing input information. In contrast, the Gated Linear Unit (GLU) [
41,
46], has been shown to outperform traditional MLP across various natural language processing tasks. Related work [
47] has shown that integrating gating mechanisms into MLP structures and embedding them within RG Blocks following the Transformer’s abstract architecture leads to significant improvements in visual tasks, suggesting a promising potential in combining the Transformer’s abstract architecture with gating mechanisms. Inspired by these findings, we propose the replacement of the conventional ConvFFN [
48] with ConvGLU [
49], a gating-based architecture enhanced with channel attention. When configured with an expansion ratio
R and a convolution kernel size
, the computational complexities of ConvGLU and ConvFFN are, respectively:
Notably, ConvGLU exhibits lower computational complexity than ConvFFN, while employing a gating mechanism to generate input-specific control signals based on nearby fine-grained features. This design allows LRB to effectively preserve local detail features from the output of DGST, while simultaneously maintaining channel attention capabilities. As a result, it achieves a favorable balance between computational efficiency and feature representation quality.
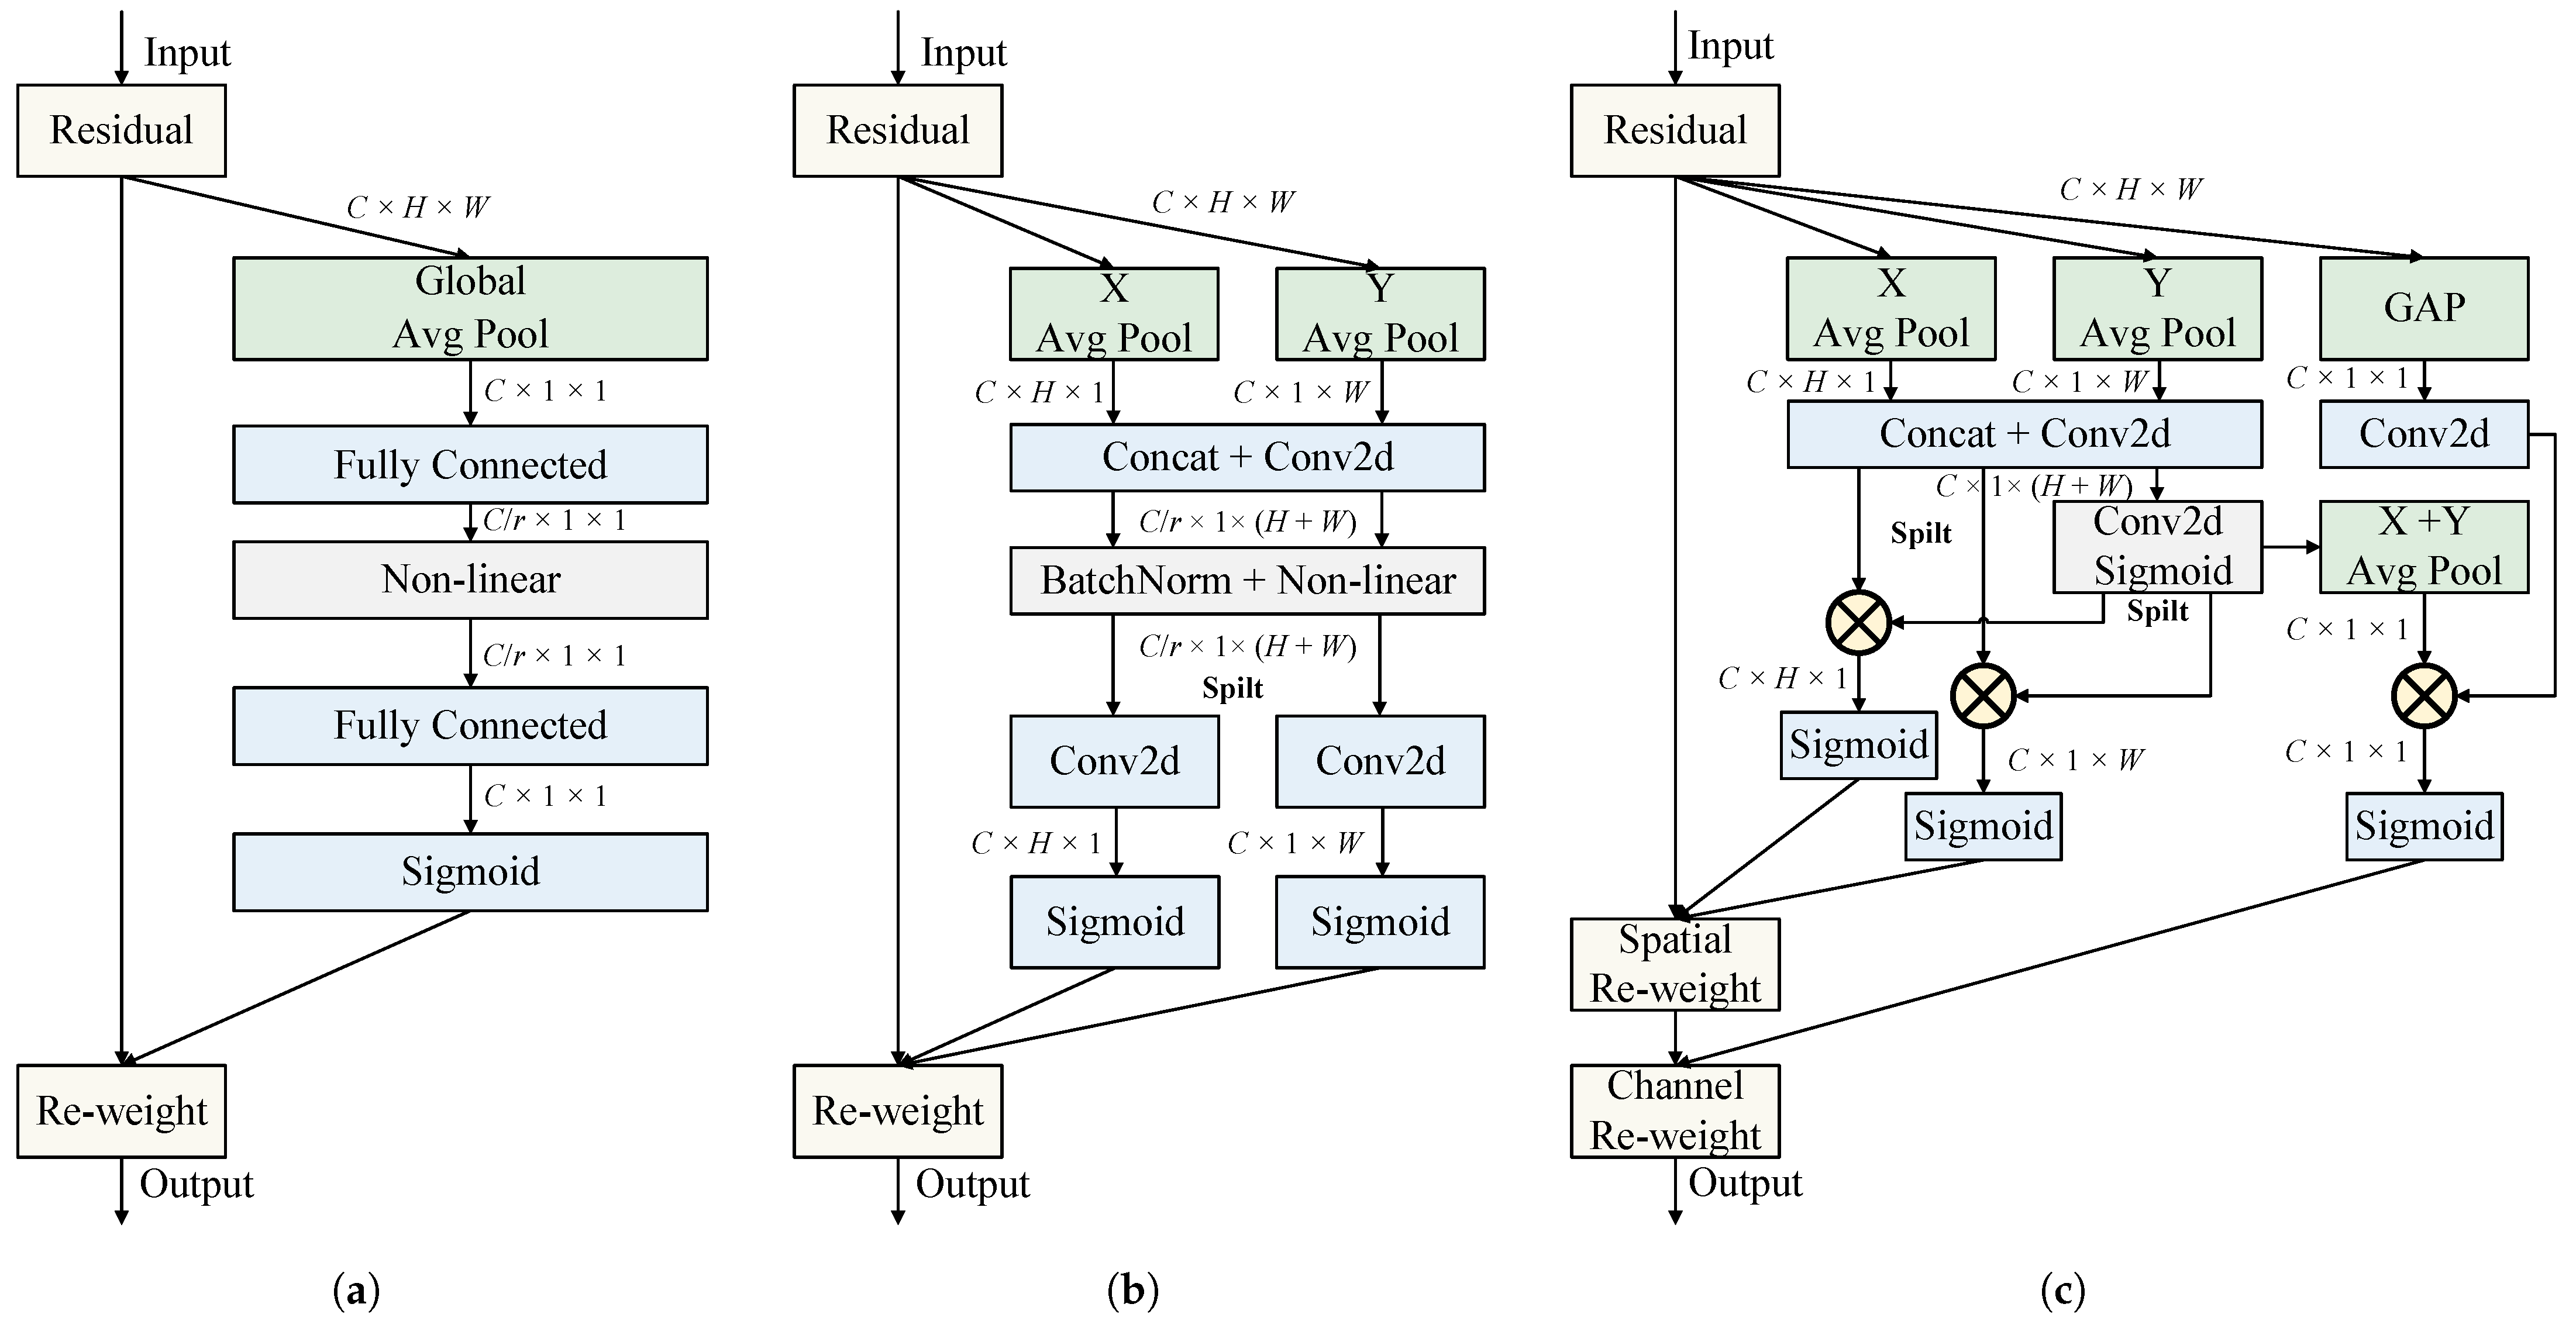
2.6. Adaptive Multi-Path Attention
The proposed Adaptive Multi-Path Attention (AMPA) is illustrated in
Figure 4c. Given an input feature map
, inspired by the Squeeze-and-Excitation (SE) [
50] block (
Figure 4a), which pioneered channel attention mechanisms in visual tasks, we employ global average pooling to improve sensitivity to informative channels. The squeeze operation for the
c-th channel is formulated as:
where
denotes the squeezed output for channel
c. Subsequently, a 1×1 convolution generates the channel attention map
:
To address the lack of spatial attention modeling, we incorporate coordinate information embedding from the Coordinate Attention (
Figure 4b) [
51] mechanism. Specifically, we use two spatial pooling kernels
and
to aggregate features along vertical and horizontal directions, respectively, to capture long-range spatial interactions. The outputs for the
c-th channel at height
h and width
w are computed as:
Relevant research [
52] indicates that the constrained receptive field of 1 × 1 convolutional kernels in CA adversely hinders both the modeling of local cross-channel interactions and the effective utilization of contextual information. To mitigate this, we replace the 1 × 1 convolutions with 3 × 1 shared convolutional layers when processing the concatenated directional features
:
where
. This spatial feature map is subsequently split into
and
.
To enhance adaptability to varying inputs, we employ a simple gating mechanism with sigmoid activation. Specifically, a
convolutional layer is applied to process and activate the intermediate feature map
, generating spatial weights
:
where
denotes the sigmoid function. The spatial weights
are divided into
and
, serving as gating signals for
and
, respectively. Considering that using global pooling to squeeze spatial information into channels makes its channel attention lack flexibility and become too coarse-grained, we aggregate the deeply stacked spatial weight information
into the channel. Specifically, we compute channel weights
through spatial squeezing. The outputs for the
c-th channel are computed as:
The final output is obtained through adaptive fusion of three attention components:
This multi-path architecture enables simultaneous improvement of channel-wise and position-wise feature responses while maintaining computational efficiency.
2.7. CFPT
To effectively represent and process multi-scale features, feature pyramid networks have been widely integrated into various detection frameworks, and have demonstrated superior performance in handling objects of different scales. The conventional FPN [
53] employs top-down unidirectional information flow to propagate semantic features into shallow layers, which inherently suffers from inevitable information loss due to its constrained single-directional pathways that prevent comprehensive multi-scale feature integration. To mitigate this limitation, PAN [
36] introduces a complementary bottom-up path augmentation.
Building upon this structure, YOLOv8’s neck employs Conv, C2f, and Upsample modules within a PAN architecture. Despite its multi-scale fusion capability, two critical limitations persist. First, the prevalent use of nearest-neighbor interpolation in upsample layers leads to blurred feature maps and progressive semantic misalignment during multi-layer propagation. Second, small object features may be lost or suppressed by larger ones during convolution. Together, these limitations hinder detection performance in behavior-recognition tasks that require accurate multi-scale analysis.
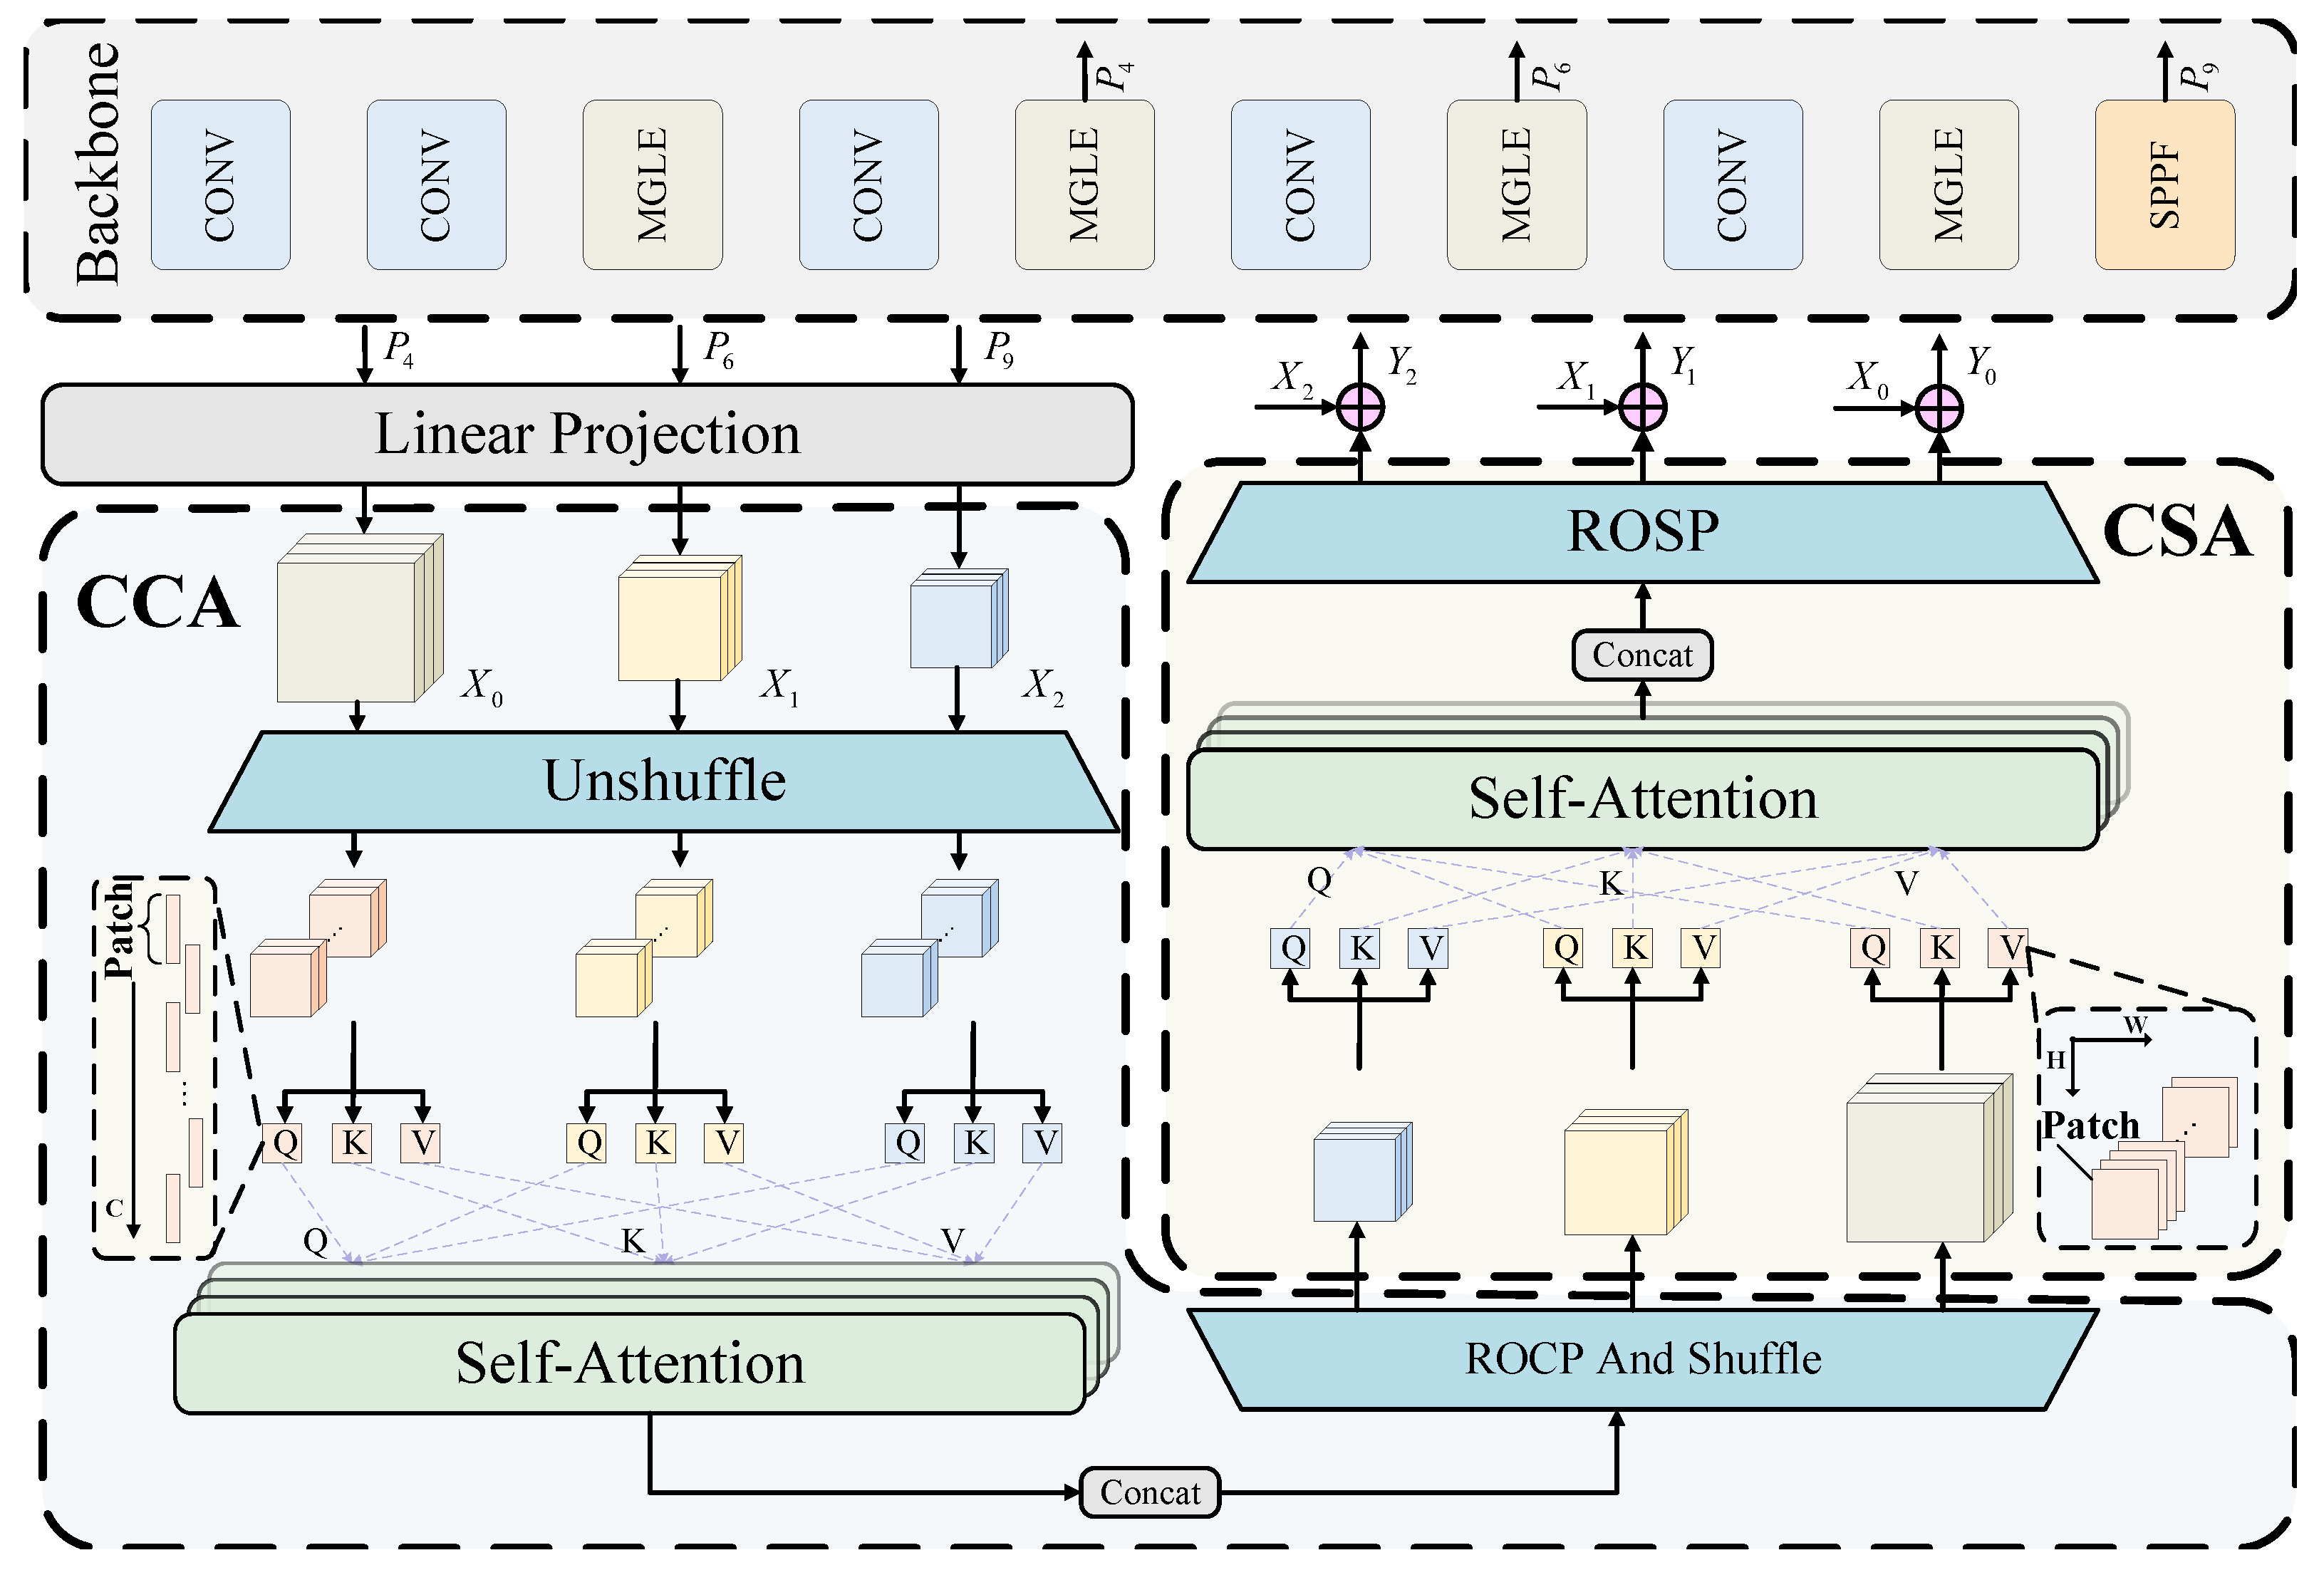
In this work, we utilize a Cross-layer Feature Pyramid Transformer (CFPT) [
37] to address multi-scale feature-fusion challenges. The CFPT framework eliminates upsampling operations, thereby avoiding computational overhead and blurred feature artifacts. It leverages two transformer blocks with linear computational complexity: (1) Cross-layer Channel-wise Attention (CCA), enabling inter-scale channel dependency modeling, and (2) Cross-layer Spatial-wise Attention (CSA), capturing spatial correlations across pyramid levels. By adaptively aggregating features through learnable weights, CFPT mitigates semantic misalignment caused by uniform supervision across scales while maximizing cross-layer feature integration.
As shown in
Figure 2, our framework processes multi-scale inputs
through linear projection via 1 × 1 convolutions. This design achieves computational efficiency while establishing channel dimension unification across feature hierarchies.Assume that the feature map of each scale after the linear projection can be represented as
, where
denotes the number of input layers,
represent the spatial dimensions at the
i-th scale, and
C indicates the unified channel depth across all scales. The CCA and CSA modules establish global feature dependencies across channel and spatial dimensions through patch group interactions, while shortcut branches enhance gradient flow throughout the pyramid hierarchy. The above process can be described as
where the output
maintains the identical shape as the corresponding input feature maps.
2.7.1. CCA
The CCA employs spatial unshuffling to redistribute spatial variations into channel dimensions, reformulating multi-scale features into alignment as
with unified resolution. Next, the Overlapped Channel-wise Patch Partition (OCP) organizes channel-aligned features into hierarchical groups where adjacent feature maps exhibit channel scaling factors of 4. To enhance cross-group interactions, we introduce bias parameters
that construct overlapped adjacent groups, resulting in transformed features
. The above process can be described as
where overlapping parameters
are empirically configured as
for
, respectively.
The CCA captures global dependencies through multi-head attention across patch groups: Hierarchical outputs
are generated by first computing
where
are linear projection matrices. Cross-level interactions are modeled via
where
denotes the cross-level contextual positional encoding for the
i-th layer, and
h represents the number of attention heads. Finally, feature reconstruction is performed using Reverse OCP (ROCP) and spatial shuffling to restore channel-spatial configurations:
Here,
merges multi-scale features with coefficients
, while
ensures spatial consistency.
2.7.2. CSA
Similarly, the CSA module processes the input features
through three steps: First, Overlapped Spatial-wise Patch Partition (OSP) with channel-aligned features generates spatial patch groups via
where
for
controls sliding-window overlaps. Cross-layer interactions are then modeled through
where
and
h share similar meanings as defined in
Section 2.7.1. The final output
is obtained by applying Reverse OSP (ROSP) to restore the original hierarchical configurations:
3. Results
3.1. Evaluation Metrics
In this study, the evaluation metrics include Precision (P), Recall (R), Average Precision (AP), Mean Average Precision (mAP), number of parameters (Params), and floating point operations (FLOPs), which are computed as shown in Equations (
29)–(
33):
where true positives (TP) denotes the count of correctly identified positive samples, false positives (FP) represents negative samples erroneously classified as positive, and false negatives (FN) indicates positive samples incorrectly predicted as negative.
refers to the
score of the
i-th class, and
N denotes the total number of classes in the dataset. Here,
K denotes the kernel size, while
and
represent the number of input and output feature channels, respectively.
3.2. Experimental Environment and Parameter Setting
To ensure a fair evaluation of algorithm performance, this study employs identical experimental platforms and hyperparameter settings. The experiments were run on an Ubuntu 22.04 system equipped with an Intel® Xeon® Platinum 8362 CPU (2.80 GHz), two NVIDIA GeForce RTX 3090 GPUs (24 GB each), Python 3.10.14, PyTorch 2.2.2, and CUDA 12.1, with a maximum RAM allocation of 90 GB. The hyperparameters used in the experiments are detailed in
Table 3.
3.3. Comparative Experiments of Different Models
A total of eight state-of-the-art models were selected to evaluate the performance of the models on the same dataset, with the same experimental setup (see
Section 3.2) and hyperparameter settings (see
Table 3), including Faster R-CNN [
54], FCOS [
55], RT-DETR [
56], YOLOv5n [
57], YOLOv8n [
58], YOLOv10n [
59], YOLOv11n [
60], and MACA-Net.
Table 4 presents the performance of these models, with evaluation metrics encompassing precision, recall, mean average precision (mAP50 and mAP50-95), number of parameters, and floating point operations (FLOPs).
The comparative results in
Table 4 show that Faster R-CNN, FCOS, and RT-DETR have significantly higher FLOPs and number of parameters compared to other models. Specifically, the FLOPs of Faster R-CNN, FCOS, and RT-DETR are 33.9G, 20.47G, and 103.4G, respectively, while their parameter counts are 25.5 times, 19.8 times, and 19.7 times that of our proposed MACA-Net. However, considering the practical conditions of pig farms, large-scale facilities often require the monitoring of multiple pens, where the deployment of relatively large models can significantly increase server costs. In addition, their mAP50 performance lags behind that of MACA-Net, especially for Faster R-CNN and FCOS. These characteristics make it difficult for these three models to operate efficiently in resource-constrained environments.
The proposed MACA-Net, demonstrates superior performance compared to the YOLO series models (YOLOv5n, YOLOv8n, YOLOv10n, and YOLOv11n) across multiple metrics. Specifically, MACA-Net achieves 1.62M parameters, 5.3G FLOPs, 83.1% precision, 78.8% recall, 85.1% mAP50, and 55.4% mAP50-95, exhibiting outstanding detection performance with high parameter efficiency and compact model size. A comparison with YOLOv5n and YOLOv8n reveals that MACA-Net is more lightweight yet still delivers superior detection performance. MACA-Net also outperforms YOLOv10n, which has the fewest parameters in the contrast models, with 28.6% fewer parameters, 18.4% fewer FLOPs, and a 7.4% improvement in recall. In addition, MACA-Net has a significant computational cost advantage over the recently released YOLOv11n. Despite a slight decrease in recall of 0.2%, MACA-Net exhibits superior performance in other metrics, in particular achieving a 6.6% improvement in precision.
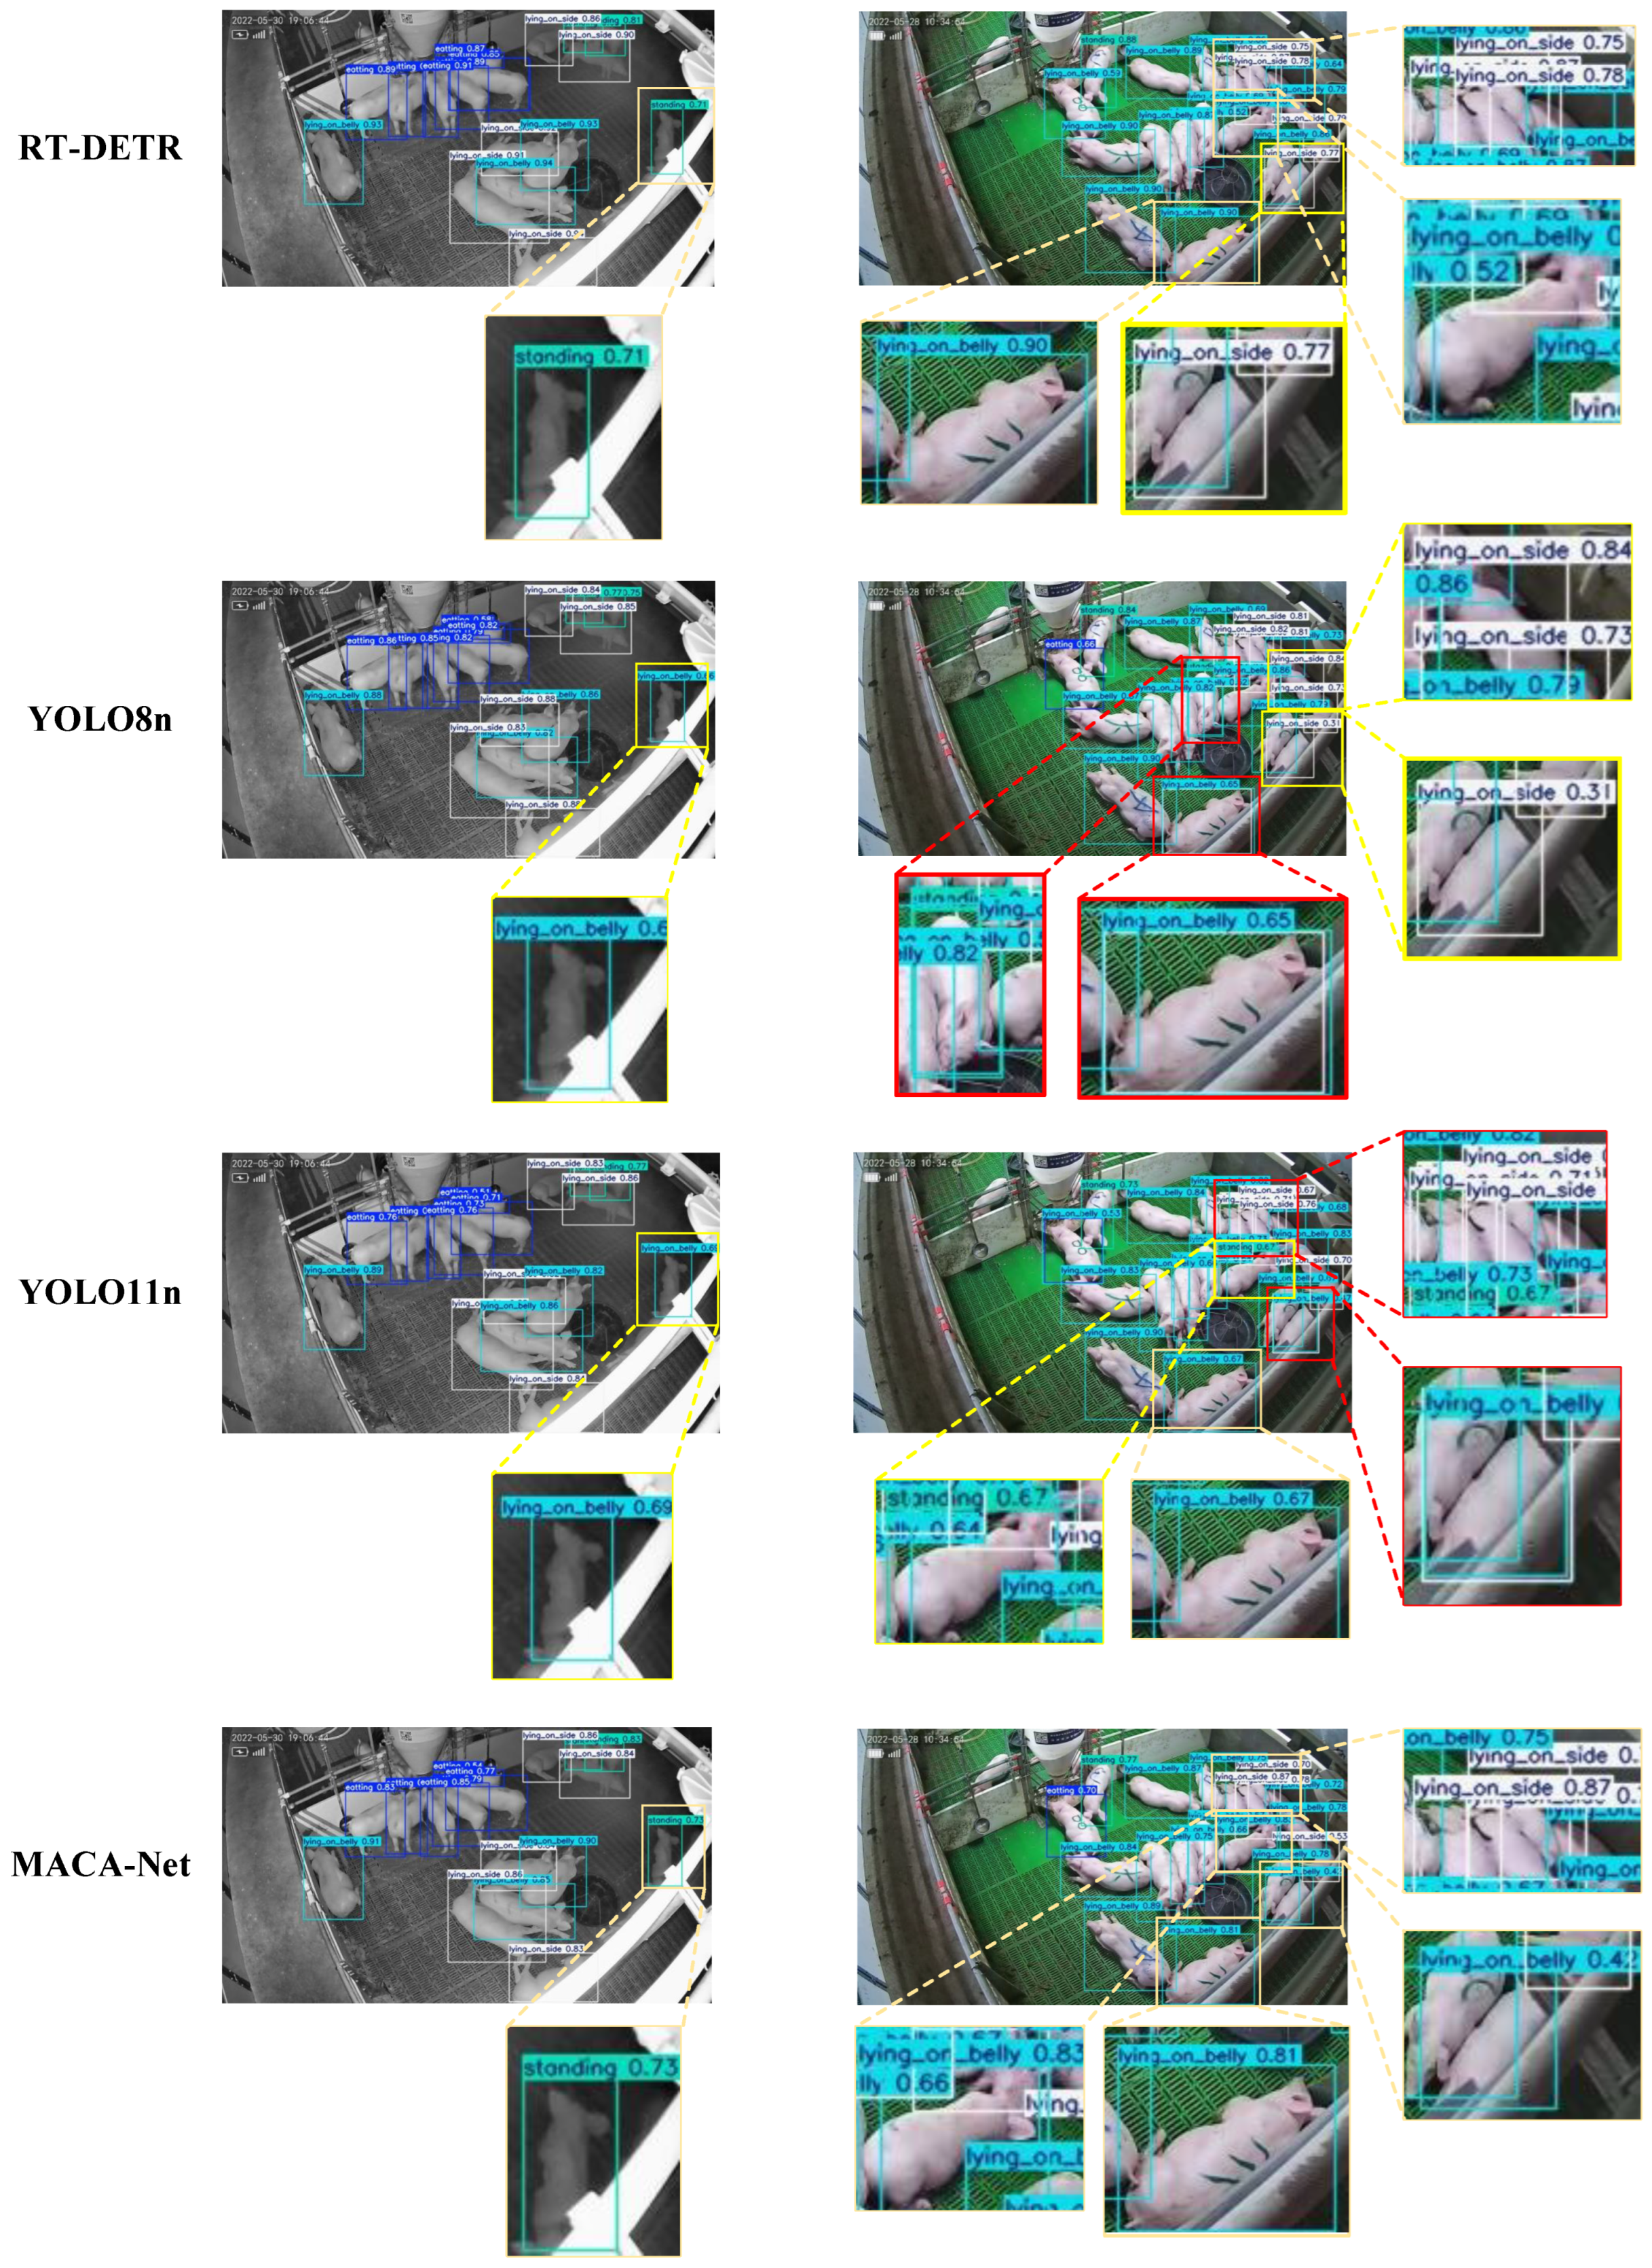
To visually compare the performance of different models, a random selection of images captured during the day and at night was made for the purpose of testing, including prediction models including RT-DETR, YOLOv8n, and YOLOv11n.
Figure 5 shows the prediction results of various models, demonstrating that the improved model achieves more reliable performance in pig behavior recognition.
In daytime scenarios with severe pig occlusion and stacking, YOLOv8n and YOLOv11n exhibited instances of erroneous behavior detection (highlighted by bright yellow boxes in the figure) and duplicate detection of the same pig (marked with red boxes in the figure). Additionally, RT-DETR also showed cases of incorrect behavior identification. Under low-light nighttime conditions, YOLOv8n and YOLOv11n generated false detections in regions with dispersed pig distributions. In contrast, through network optimization, the improved model effectively preserves local detail features and aggregates contextual information. This enhancement enables more efficient and accurate detection, demonstrating greater robustness compared to existing models.
3.4. Comprehensive Comparison with Baseline YOLOv8n
In this section, we provide a detailed explanation of the improvements of MACA-Net compared to YOLOv8n. In
Figure 6, we compare the performance of the two models on four behaviors (“eating,” “lying_on_belly,” “lying_on_side,” “standing”) across four performance metrics (precision, recall, mAP50, mAP50-95), as well as the average performance of the four behaviors on these metrics. Experimental results demonstrate that MACA-Net consistently outperforms YOLOv8n in all behavioral categories. Detailed quantitative comparisons in
Table 5 reveal that the proposed framework achieves average improvements of 8.9% in precision (74.2% to 83.1%), 4.4% in mAP50 (80.7% to 85.1%), and 3.7% in the more stringent mAP50-95 metric (51.7% to 55.4%) across all behaviors. Notably, the most significant improvement occurs in the “standing” category, where precision increases by 16%, mAP50 by 11.9%, and mAP50-95 by 8.5%. Furthermore, the proposed framework demonstrates superior detection capabilities compared to other behavioral categories, with the “eating” class attaining 90.3% mAP50 and “lying_on_belly” achieving 60.3% mAP50-95.
Constructing subsets under different conditions within the validation set allows for targeted evaluation of the model’s performance in specific scenarios. We created three subsets within the validation dataset: the Standard Condition (SC) subset (365 images), the Low-Light (LL) subset (122 images), and the High Occlusion (HO) subset (198 images). The enhanced model was rigorously evaluated across four key performance metrics (Precision, Recall, mAP50, mAP50-95) on three validation subsets. As demonstrated in
Table 6, MACA-Net consistently outperforms the baseline model across all metrics in every subset. Notably, mAP50 improvements of 9.0% (SC subset), 9.7% (LL subset), and 6.6% (HO subset) were achieved, demonstrating the robustness of the proposed model.
In practical intelligent farming scenarios, centralized management and modular specialization are commonly adopted—where edge devices are primarily responsible for data acquisition, while data processing is typically performed on centralized cloud servers. Consequently, deploying models on cloud platforms has become the predominant approach in such systems. To validate the practical value of the proposed model, we conducted efficiency comparison experiments before and after optimization on a cloud server. The server configuration is detailed in
Section 3.2. The evaluated metrics include the number of parameters, FLOPs, model size, and the per-image time required for preprocessing (Pre-t), inference (Inf-t), postprocessing (Post-t), and total processing (Tot-t). The experimental results are summarized in
Table 7.
Specifically, the improved model achieves a 48.4% reduction in parameters, 39.5% reduction in FLOPs, and 41.9% reduction in model size compared to the baseline, significantly reducing computational demands for server-side deployment. Although the SSM-based MGLE adopts an autoregressive inference strategy via recurrence—leading to a predictable increase in inference time per image—it generates higher-quality outputs, thereby alleviating the burden on postprocessing. As a result, the overall processing time per image remains approximately the same as that of the baseline.
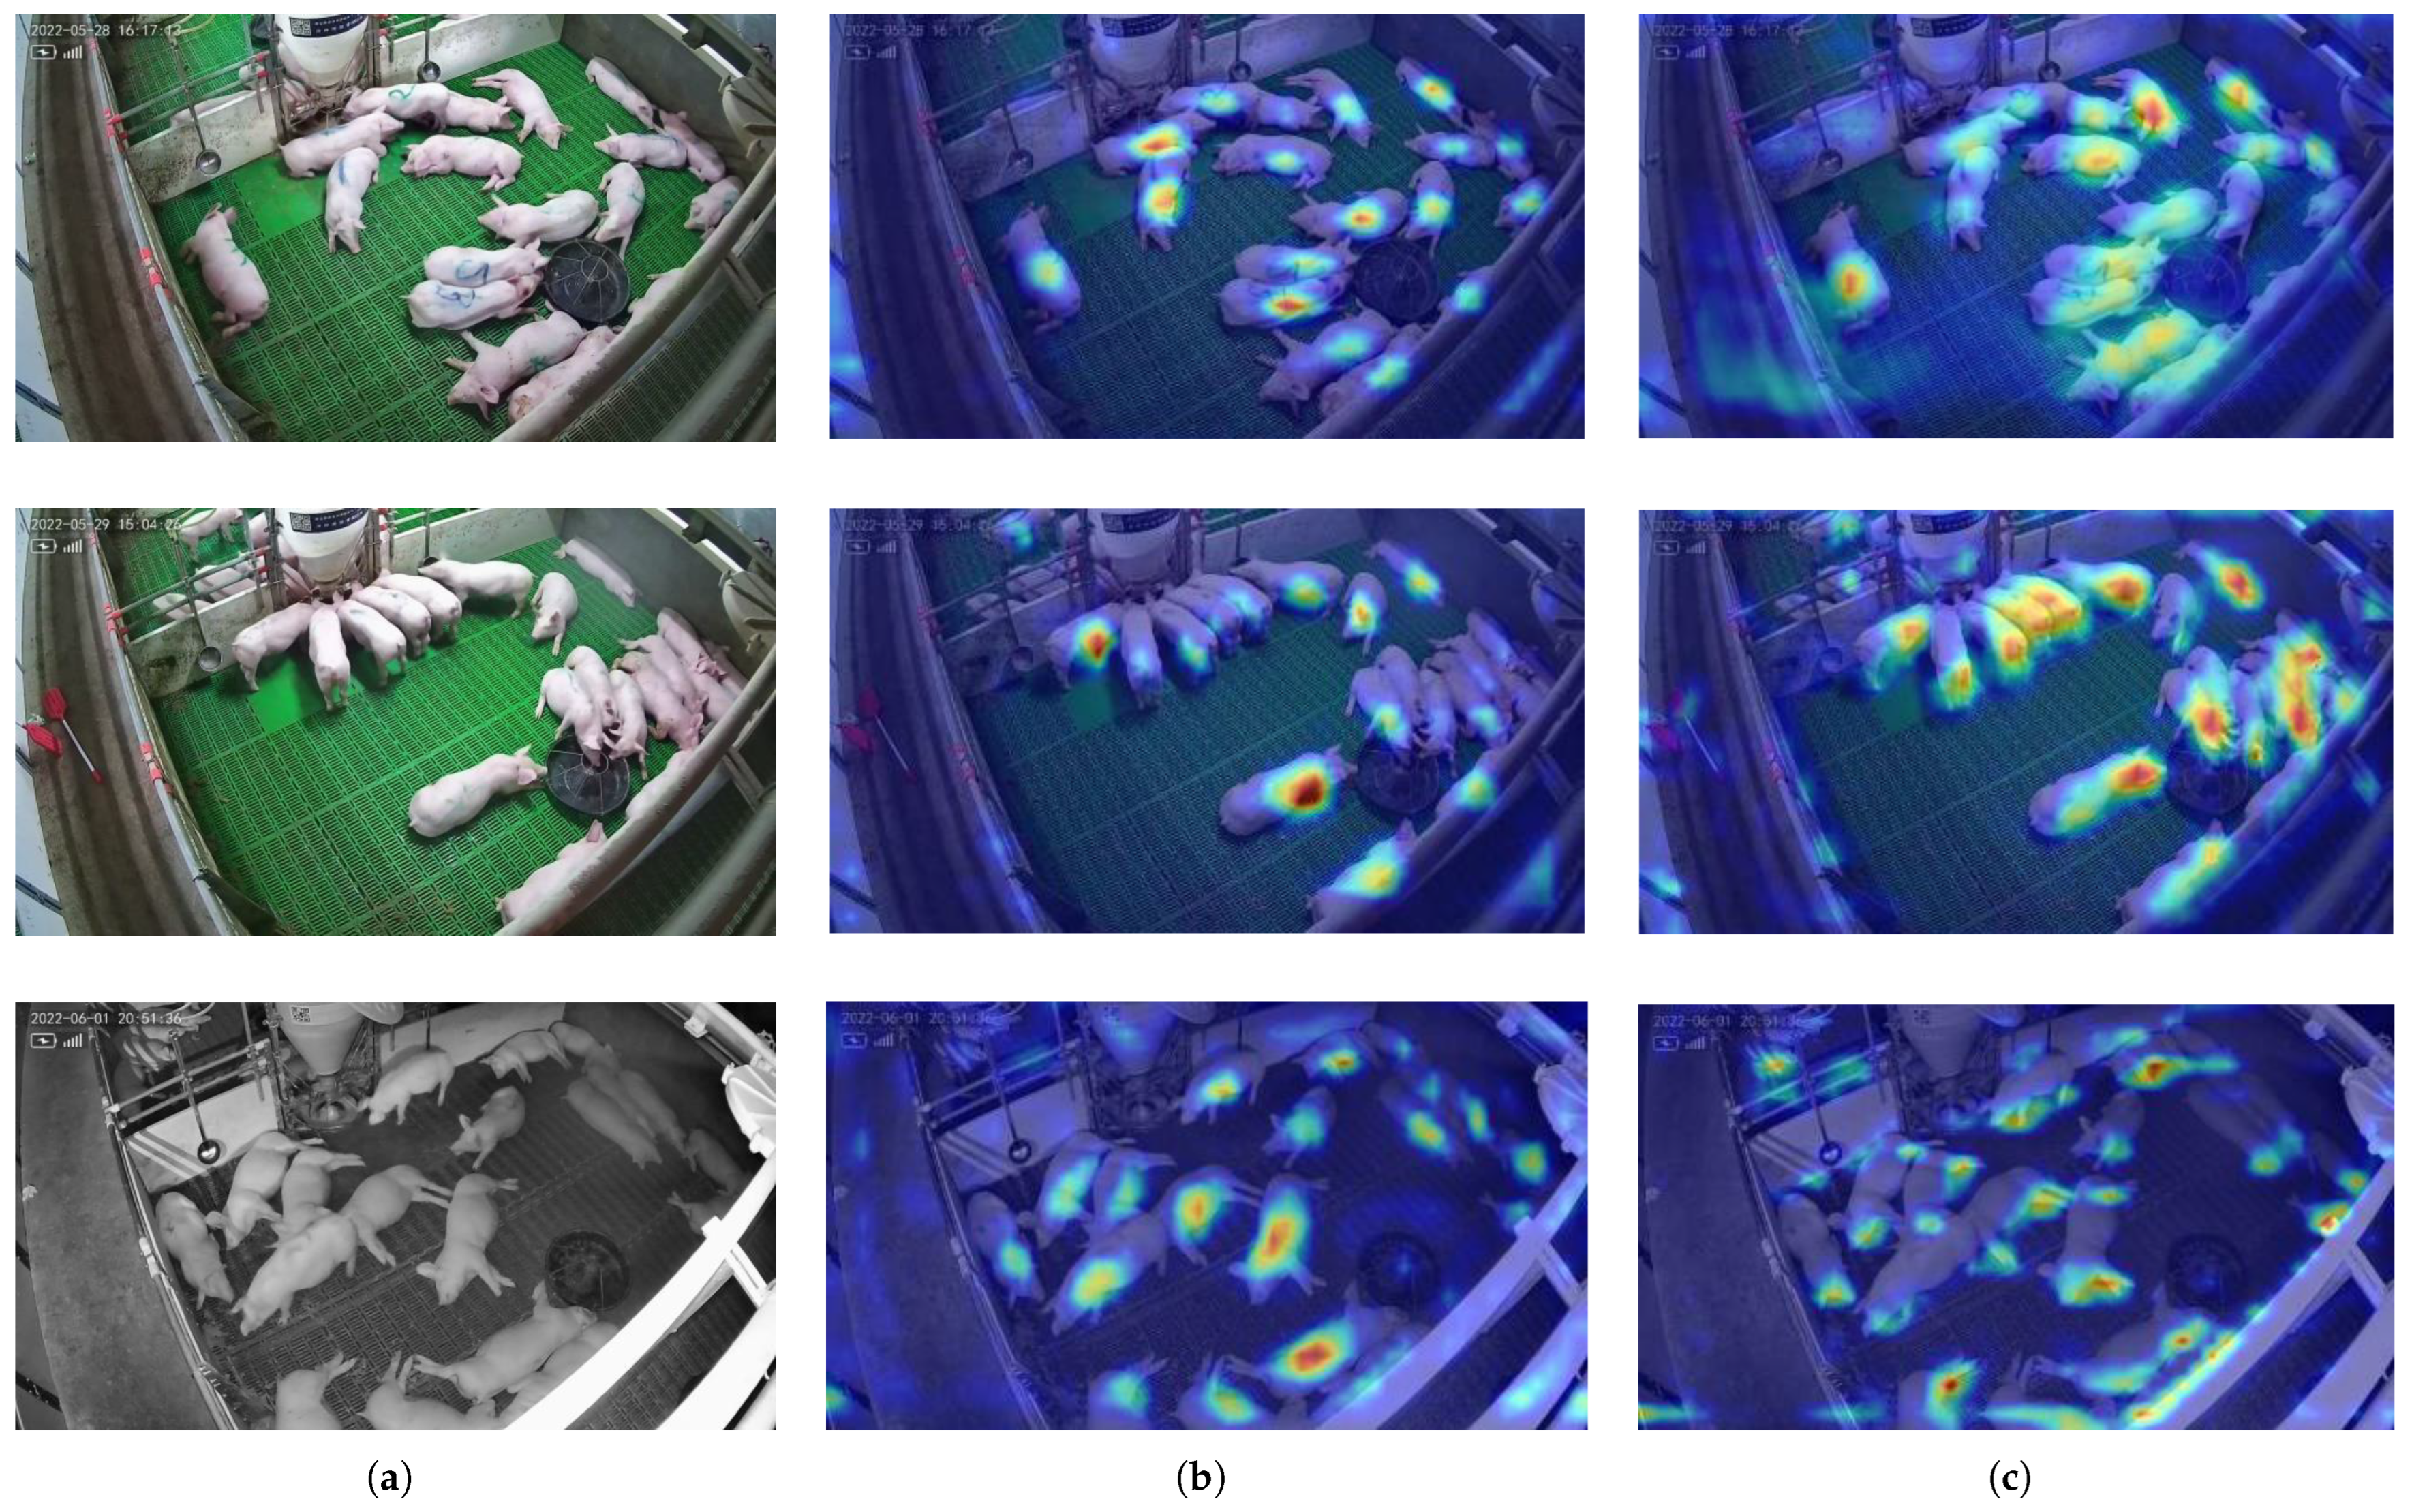
To visualize the improvement of the model, the Gradient-weighted Class Activation Mapping (Grad-CAM) method [
61] was applied to the output layers of YOLOv8n and MACA-Net. Grad-CAM determines the importance weights of feature maps by analyzing gradients of target class scores relative to the final convolutional layer’s feature maps. These weights are then combined with the feature maps through weighted summation to generate heatmaps that highlight regions critical for decision-making.
Figure 7 displays the class activation maps of YOLOv8n and the improved model, where deeper red hues indicate higher values corresponding to stronger model responses and greater contributions to final predictions.
In the first comparison group (first row of
Figure 7), while YOLOv8n successfully locates pig regions, its attention remains constrained by the inherent limitations of CNN architectures, capturing only limited local information. In contrast, guided by the Mamba mechanism, MACA-Net effectively establishes global dependencies and captures more detailed regions. The second comparison group (second row) further validates these observations. In particular, MACA-Net shows superior focus on heavily occluded areas with dense pig clusters, while YOLOv8n exhibits deficiencies in handling such challenging scenarios. Under low-light nighttime conditions (third row), MACA-Net shows enhanced attention to critical behavioral features in pigs’ limbs and head, while the baseline model predominantly focuses on torso regions. These visual comparisons comprehensively reveal MACA-Net’s advantages in global perception, fine-grained feature extraction, and robustness to complex scenarios.
3.5. Ablation Experiment
3.5.1. Overall Ablation Experiment of MACA-Net
To validate the effectiveness of individual improvements, we conduct ablation experiments using the controlled variable method, with results detailed in
Table 8.
When the C2f module in the backbone was replaced with MGLE, a slight reduction in recall was observed compared to the baseline YOLOv8n. However, precision and mAP50 improved by 2.5 % and 0.6 %, respectively, and FLOPs decreased by 16%. Subsequently, the abstract architecture of CFPT was introduced in the neck network, though only the CSA module was implemented. This modification enhanced the model’s spatial aggregation capability, further improving detection precision while achieving global optimization in both parameter count and FLOPs. Finally, the CCA module was incorporated to strengthen multi-scale feature interaction across channels. Notably, MACA-Net achieves globally optimal performance across all experimental configurations in precision (83.1%), recall (78.8%), mAP50 (85.1%), and mAP50-95 (55.4%), establishing comprehensive metric superiority. Compared to MGLE+CSA with the minimal parameter quantity, this performance leadership is maintained while requiring only 0.071M additional parameters.
The experimental observations revealed that the combination of MGLE and CCA demonstrated particularly outstanding performance. Specifically, the MGLE+CCA and MGLE+CCA+CSA (MACA-Net) configurations achieved mAP50 scores of 84.4% and 85.1%, respectively (the top two performers in the experiment), while maintaining a low number of parameters and computational complexity. This indicates that the MGLE module, integrated with spatial Selective Scan mechanisms, effectively enhances spatial modeling capabilities. Furthermore, the CCA module further facilitates multi-path cross-layer interactions across channels. Such a unified framework, combining spatial feature extraction and cross-channel mixing mechanisms, demonstrates clear advantages and significant potential for future development.
Critically, our analysis shows that under the more stringent mAP50-95 performance metric, the MGLE+CCA configuration performed relatively modestly (51.4%), showing a 4% deficit compared to MGLE+CCA+CSA. This suggests that feature pyramid structures relying solely on channel-wise fusion face inherent limitations in handling demanding detection tasks. A comparative evaluation of recall and precision metrics further indicates that MGLE+CCA exhibits degraded performance across both measures compared to MGLE+CCA+CSA, particularly with a notable 4.5% precision reduction. These observations lead us to hypothesize that the absence of multi-scale spatial fusion mechanisms may increase false positive samples, consequently significantly degrading the performance of mAP50-95.
3.5.2. Ablation Experiment of the MGLE
To systematically evaluate the individual contributions of MGLE’s components, we conducted ablation experiment whose results are summarized in
Table 9. The key distinctions among variants lie in four design dimensions:
GCB: presence/absence of the Global Contextualization Branch;
LRB: presence/absence of the Local Refinement Branch;
FA: fusion approach between main and auxiliary branches in GCB;
AMPA: whether the Adaptive Multi-Path Attention is applied to GCB’s auxiliary branch.
Table 9 demonstrates that the M9 model, which integrates GCB and LRB with additive integration of AMPA-based attention guidance in GCB, achieves the globally highest mAP50 score while maintaining relatively low computational overhead. This highlights the ensemble’s robust performance and computational efficiency in the swine-recognition dataset. The high recall and precision, respectively, underscore MGLE’s superior capability in distinguishing the majority of positive cases and reducing false positives, reflecting its balanced effectiveness in comprehensive detection tasks.
When employing a gating-based fusion strategy in GCB, the model variants M1-M4 (with progressively integrated components) achieved mAP50 scores of 81.6%, 82.6%, 84.0%, and 81.7%, respectively. Notably, despite the introduction of an attention mechanism in M4 compared to M3, M4 exhibited a 2.3% decline in mAP50. This motivated replacing gating with additive fusion in M9, which achieved the highest mAP50.
To rigorously evaluate fusion strategies in MGLE, we conducted ablation studies comparing gated fusion (original) and additive fusion variants in four model pairs: (M1, M5), (M2, M6), (M4, M8), and (M3, M7). The additive approach improved mAP50 by 2%, 1.2%, and 4.4% in the first three pairs but caused a minor degradation in M7 compared to M3. Further analysis revealed that models combining GCB and LRB (M3/M7) underperformed relative to LRB-only counterparts (M8), suggesting that gains from local feature embedding may mask the inherent flaws in the fusion strategy. We speculate that gating mechanisms relying on shallow features could disrupt the global dependencies established by the Mamba block integrated with a selective scan mechanisms.
Furthermore, compared to M7 without AMPA, M9 with the attention mechanism achieved improvements of 1.1% in precision, 4.2% in recall, and 2.0% in mAP50, while maintaining the model’s lightweight design. This demonstrates that AMPA effectively suppresses redundant information and improves model focus in the complex environment of pig farms.
3.6. Targeted Experiments for AMPA
Inspired by SE [
50] and CA [
51], we propose AMPA to enhance feature representation in pig behavior recognition. To validate the effectiveness of AMPA, experiments are conducted by replacing AMPA with mainstream attention modules at the same position in MACA-Net. As shown in
Table 10, AMPA demonstrates superior performance compared to existing attention mechanisms, achieving the highest recall, mAP50, and mAP50-95 metrics. Specifically, AMPA outperforms CBAM [
62], CA, ELA [
63], EMA [
52], and SE by improvements of 2.1%, 1.7%, 3.2%, 1.9%, and 1.5% in mAP50, respectively. For mAP50-95, the corresponding improvements reach 1.6%, 2.2%, 2.4%, 2.5%, and 1.5%. Furthermore, the six attention modules exhibit negligible differences in computational cost, with the maximum variation in FLOPs being only 0.1G. These results indicate that the proposed multi-path attention mechanism can effectively integrate both spatial and channel information without introducing significant computational overhead. Overall, the experimental findings demonstrate that our design achieves a favorable balance between accuracy and efficiency, offering clear advantages in object-detection tasks related to animal behavior recognition.
To further assess the robustness of the AMPA mechanism, comparative experiments were conducted across three challenge-specific validation subsets (SC, LL, HO) as detailed in
Section 3.4. The quantitative results summarized in
Table 11 demonstrate that Model 2 (with AMPA) consistently outperformed Model 1 (without AMPA) across all evaluation metrics. Notably, on the LL subset, which represents low-light conditions, Model 2 achieved improvements of 6.0% in accuracy, 4.5% in recall, 4.8% in mAP50, and 3.6% in mAP50–90. These results demonstrate that AMPA effectively enhances the model’s performance under challenging environmental conditions.
4. Discussion
To effectively detect pig behaviors while maintaining cost efficiency, vision-based approaches for 24-h monitoring of pig activities have become mainstream, given the critical significance of behavioral data for disease prevention and growth management. In traditional image analysis, previous research [
64] recognized drinking behavior by measuring the distance between pigs’ snouts and drinkers. Another study [
65] proposed a feeding behavior-recognition method for sows based on feeder positions and body orientations. Within deep learning technologies, one study [
66] achieved feeding behavior detection through grayscale video frames and modified GoogLeNet architecture, while another [
67] utilized a convolutional neural network (CNN) combined with long short-term memory (LSTM) to recognize feeding patterns in nursery pig, demonstrating improved robustness over predecessors. With the maturation of deep learning technologies, deep learning-based methods have emerged as more effective solutions for pig behavior recognition.
Distinct from existing works, this study is dedicated to overcoming detection challenges caused by perspective distortions resulting from non-orthogonal camera installations relative to pig pens. These perspective distortions introduce significant pixel-scale variations of pigs across images, demanding enhanced multi-scale feature extraction and fusion capabilities.
To address this challenge, we propose MACA-Net, which achieves state-of-the-art performance in pig behavior-recognition benchmarks, demonstrating superior capability in handling scale variations and illumination challenges compared to existing methods.
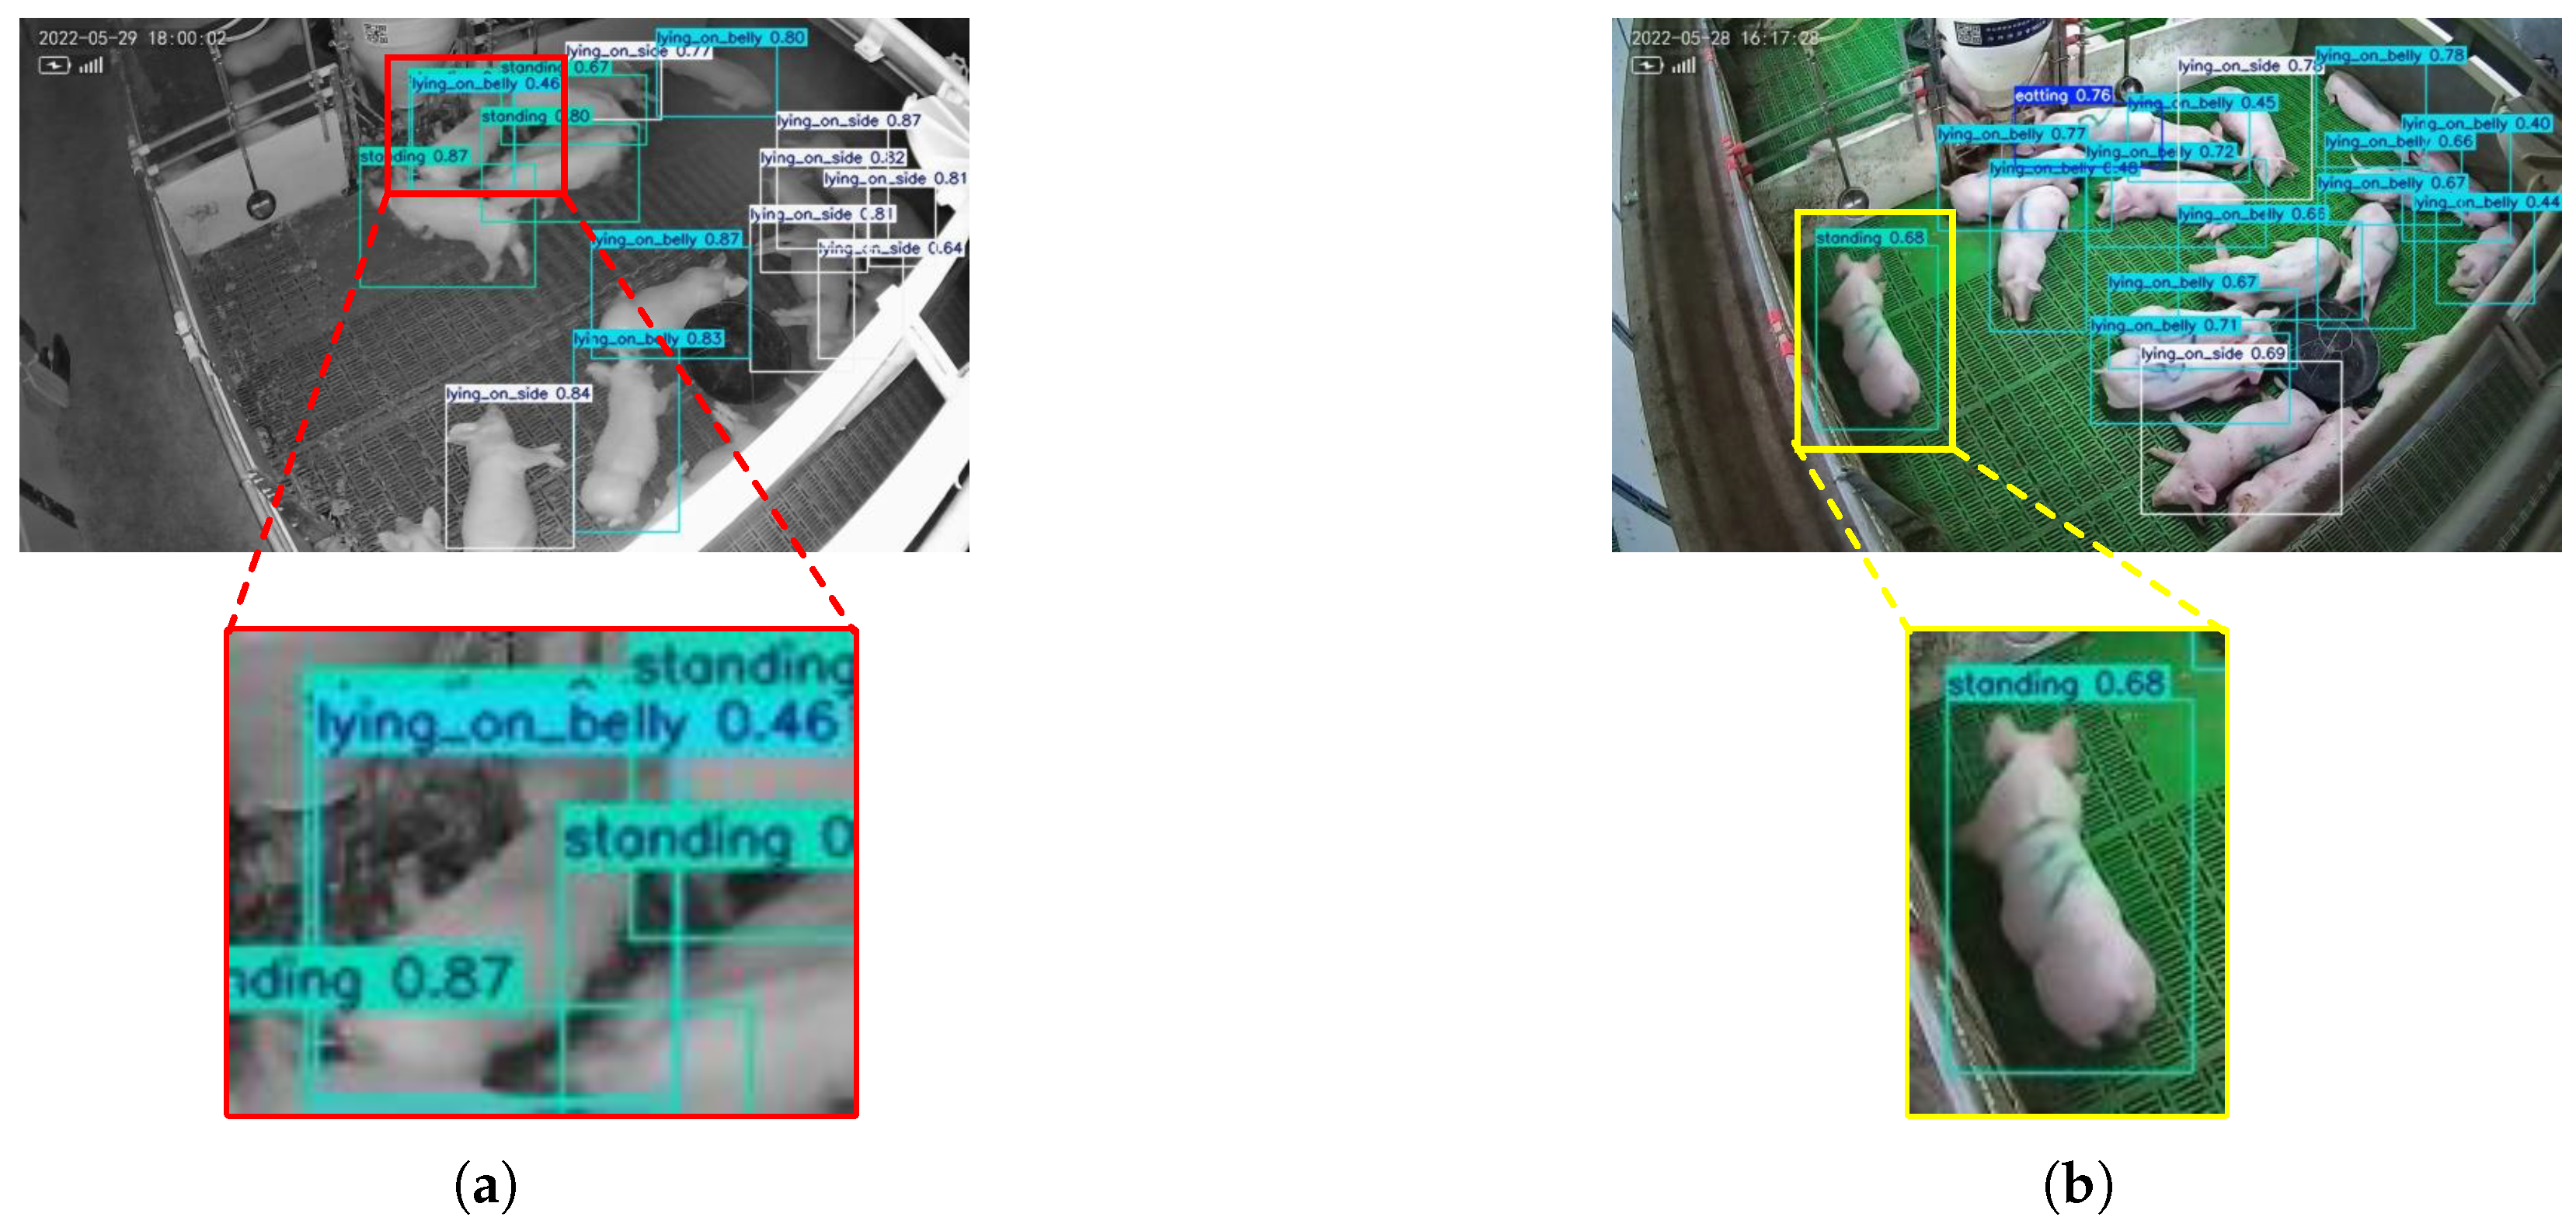
While our developed pig behavior detector, MACA-Net, has achieved success, we acknowledge the limitations of this work.
Figure 8 illustrates representative failure cases. Specifically, in
Figure 8a, a standing pig is simultaneously misclassified as both “lying_on_belly” and “standing” due to severe occlusion of its limbs by surrounding pigs, and the inherent constraints of single-frame behavior recognition. These factors create ambiguous visual cues, leading to conflicting predictions. To address this challenge, future research will focus on developing temporal sequence-sensitive detection models that extract and fuse behavioral features across multiple time points, enabling dynamic behavior tracking to improve classification robustness.
In
Figure 8b, a piglet lying on its belly is erroneously detected as standing. This error results from the limited viewing angle, where the hind legs are completely occluded and only partial forelimbs are visible, resulting in nearly identical visual patterns for “lying_on_belly” and “standing” under this perspective. To overcome such viewpoint-related ambiguities, our subsequent work will implement multi-view detecting systems to capture complementary spatial and mitigate single-view limitations. These enhancements aim to improve feature discriminability for posture recognition under complex scenarios.
5. Conclusions
This study proposes a more efficient detector named MACA-Net to identify pig behaviors in group-housed environments, addressing limitations of traditional models including high computational costs, insufficient attention to key porcine features, and challenges in multi-scale behavior recognition under perspective distortions. Specifically, we introduce a triple-branch feature extraction module (MGLE) that effectively models global features while preserving local details. The Global Contextualization Branch (GCB) based on Mamba architecture alleviates the restricted receptive field issue inherent in CNN models. To compensate for Mamba’s local information deficiency in perspective tasks, we design a dedicated Local Refinement Branch (LRB) for local feature aggregation. By replacing conventional C2f modules in YOLOv8n with MGLE, we enhance model performance while reducing parameter count. Furthermore, we develop an Adaptive Multi-Path Attention (AMPA) mechanism integrating spatial and channel attention weights, which effectively suppresses redundant feature representations to meet the demands of complex farm environments. AMPA demonstrates performance improvements of 1.6%, 2.2%, and 1.5% in mAP50-95 compared to CBAM, CA, and SE modules, respectively. Finally, we utilize CFPT without upsampling for feature fusion, which mitigates contextual semantic loss and enhances multi-scale feature processing capability while further reducing model parameters.
Through these improvements, the proposed model reduces parameters by 48.4% and FLOPs by 39.5% compared to the baseline YOLOv8n, while achieving a 4.4% improvement in mAP50 to 85.1%. In comprehensive comparisons with state-of-the-art models including Faster R-CNN, RT-DETR, and YOLOv11n, MACA-Net maintains leading performance in both computational efficiency and detection accuracy. The experimental results demonstrate that MACA-Net enables more efficient swine behavior recognition, providing reliable detection data for farm operators to support health assessment and growth monitoring. Furthermore, this work validates the application potential of Mamba architectures in object-detection tasks, offering valuable references for extending its use to other vision downstream applications.


 ,
, 

