Article

Identification of Cotton Defoliation Sensitive Materials Based on UAV Multispectral Imaging

by
Yuantao Guo
1,†,
Hu Zhang
1,†,
Wenju Gao
1,
Quanjia Chen
1,
Qiyu Chang
1,
Jinsheng Wang
1,
Qingtao Zeng
2,
Haijiang Xu
3 and
Qin Chen
1,*
1
Key Laboratory of Xinjiang Crop Biological Breeding, College of Agronomy, Xinjiang Agricultural University, Wulumuqi 830052, China
2
The 7th Division of Agricultural Sciences Institute, Xinjiang Production and Construction Corps, Kuitun 833200, China
3
Cotton Research Institute of Xinjiang Uyghur Autonomous Region Academy of Agricultural Sciences, Wulumuqi 830091, China
*
Author to whom correspondence should be addressed.
These authors contributed equally to this work.
Agriculture 2025, 15(9), 965; https://doi.org/10.3390/agriculture15090965 (registering DOI)
Submission received: 17 March 2025 / Revised: 25 April 2025 / Accepted: 26 April 2025 / Published: 29 April 2025
(This article belongs to the Section Digital Agriculture)

Abstract

:
(1) Background: This study aims to analyze the defoliation and boll opening performance of 123 upland cotton germplasm resources after spraying defoliant, using multispectral data to select relevant vegetation indices and identify germplasm resources sensitive to defoliants, providing methods for cotton variety improvement and high-quality parental resources. (2) Methods: 123 historical upland cotton germplasm resources from Xinjiang were selected, and the defoliation and boll opening of cotton leaves were investigated at 0, 4, 8, 12, 16, and 20 days after defoliant application. Simultaneously, multispectral digital images were collected using drones to obtain 12 vegetation indices. Based on defoliation rate, the optimal vegetation index was selected, and defoliant-sensitive germplasm resources were identified. (3) Results: The most significant difference in defoliation rate of cotton germplasm resources occurred 16 days after application. Cluster analysis grouped the 123 breeding materials into three categories, with Class I showing the best defoliation effect. Among the 12 vegetation indices, the Plant Senescence Reflectance Index (PSRI) has the highest correlation coefficient with the defoliation rate; and when the PSRI value is higher, the defoliation effect of the material is better. By comparing the traditional investigation method with the unmanned aerial vehicle multispectral technology, 15 cotton materials sensitive to defoliants were determined, with a defoliation rate of over 85%, a lint percentage ranging from 76.67% to 98.04%, and a PSRI value ranging from 0.1607 to 0.1984. (4) Conclusions: The study found that the vegetation index with sensitive response can be used as an effective indicator to evaluate the sensitivity of cotton breeding materials to defoliants. Using an unmanned aerial vehicle (UAV) equipped with vegetation indices for screening shows a high consistency with the manual investigation and screening method in screening excellent defoliation materials; it proves that it is feasible to screen cotton breeding materials with excellent defoliation effects using UAV multispectral technology.

1. Introduction

Cotton is an important global economic crop. Xinjiang is the largest cotton-producing area in China. In 2024, the national cotton output was 6.164 million tons. Of this total, the cotton output in Xinjiang was 5.686 million tons, accounting for 92.2% of the national total cotton output [1]. With rising costs and the development of agricultural mechanization, the area planted with machine-harvested cotton in Xinjiang has expanded, forming a new planting model that integrates equipment and technology. The mechanization rate of plowing, sowing, and harvesting has reached 97%, effectively ensuring a high cotton yield [2]. During the cotton harvesting stage, there are issues such as increased labor costs, low harvesting efficiency, and extended harvesting time due to labor shortages [3]. With the development of mechanized cotton-picking technology, machine-picked cotton has greatly alleviated the labor pressure.The mature mechanized cotton-picking technology has promoted the rapid development of the whole-process mechanization and precision agriculture of cotton production in China. Popularizing machine-picked cotton has become the trend of the future development of the cotton industry, and chemical defoliation and ripening is one of the key technologies to ensure the smooth completion of machine-picked cotton [4].
Currently, agricultural monitoring is gradually achieving an integrated approach that combines space, air, and ground, focusing on comprehensive monitoring of resources, environment, and crop growth status, aimed at providing strong support for the smart development of agriculture. Unmanned aerial vehicle (UAV) remote sensing, with its advantages of short cycle, simple operation, dynamic data acquisition and low cost [5], has become a new trend and research hotspot in agricultural monitoring. In recent years, remote sensing technology has been applied in the inversion research of physiological and biochemical parameters such as crop biomass [6], chlorophyll content [7], and water and nitrogen content [8]. In terms of characterizing leaf changes, spectral reflectance and vegetation indices have their own characteristics. The spectral reflectance index based on the green and red wavelength regions can more precisely reveal the continuous changes in pigment composition and its quantity during the leaf senescence process [9]. Zhang [10] used the spectral indices and texture features extracted from the UAV remote sensing image and cotton FPAR measurement data to construct a machine learning model, and evaluated the performance of the model.
In the early stages of cotton harvesting, defoliants are used to promote ripening and address the problem of late-maturing cotton with excessive green growth. Scientific and reasonable field management measures, along with the correct use of defoliants, are fundamental to achieving high yield and quality cotton [11]. During the mechanized cotton harvesting process, the application of defoliants for defoliation and ripening is an indispensable key step. The innovation of machine-harvested cotton germplasm resources and the breeding of new varieties are critical for the development of the industry. Defoliant sensitivity, as an important breeding index, has placed higher demands on breeding work. In the study of cotton defoliation and ripening, the evaluation of defoliation effect mainly relies on the traditional manual fixed-point investigation [12], which is time-consuming, inefficient and the results are accidental.In contrast, unmanned aerial vehicle remote sensing has the advantages of high resolution and real-time monitoring, and its application in agricultural monitoring is increasingly widespread [13], which provides new thinking and research directions for the monitoring of cotton defoliation rate and material screening. Yan et al. [14] used a quadcopter UAV to collect multispectral images of cotton before and after spraying defoliants, calculated vegetation indices, and extracted cotton leaf coverage information. Ma et al. [15] used UAV RGB images as the data source to extract 14 different visible light vegetation indices, then constructed a fast and accurate cotton defoliation rate monitoring model. Ma et al. [16] found that RF is more effective in screening features to monitor defoliation and boll opening rates. Using the model results, a comprehensive evaluation index of defoliation effect can be constructed, and the defoliation effect index can quickly determine the harvest time of cotton. Based on the previous research results, due to the characteristics of UAV images being easy to obtain, low cost, and relatively simple processing process, coupled with the high applicability of related vegetation indices, it provides a new idea and direction for using UAV multispectral technology to monitor and screen excellent breeding materials for cotton defoliation effect.
At present, there are relatively few studies on using unmanned aerial vehicle (UAV) remote sensing technology to monitor the defoliation effect of cotton and screen materials. In this experiment, 123 upland cotton germplasm resources after spraying defoliant were screened for defoliation sensitivity, and combined with UAV multispectral data, the feasibility of UAV multispectral technology in monitoring, classifying and screening germplasm resources was evaluated. Moreover, the traditional investigation method and the UAV multispectral technology method were compared to screen out defoliation-sensitive cotton germplasm resources, further improving the application of UAV multispectral technology and vegetation index in the evaluation of cotton defoliation sensitivity, providing a theoretical basis and technical reference for screening cotton germplasm resources with suitable defoliant sensitivity for mechanized harvesting.The main contributions of this study are as follows:
(1)
The vegetation indices selected, which are related to cotton defoliation, can serve as evaluation indicators for assessing the effectiveness of cotton defoliation, providing a reference for subsequent research.
(2)
A framework for evaluating materials using drone-based multispectral technology has been established, offering theoretical foundations and technical references for selecting cotton germplasm resources with superior defoliation effects suitable for mechanized harvesting.
(3)
The effectiveness of cotton defoliation was assessed and selected using drone-based multispectral technology, and a comparison and analysis was conducted with traditional manual screening of cotton materials sensitive to defoliation. The results indicate that the use of drone-mounted vegetation indices for screening is highly consistent with the manual survey and selection methods in identifying defoliation-effective materials. This further enhances the application of drone multispectral technology and vegetation indices in evaluating cotton defoliation sensitivity.

2. Materials and Methods

2.1. Materials and Geographical Location

In this experiment, 123 cotton germplasm resources were selected, all of which were collected and provided by the Key Laboratory of Crop Breeding and Biotechnology of Xinjiang (Table 1). These materials include 48 from the Northwest Inland Cotton Area, 19 from the Yellow River Basin Cotton Area, 14 from the Yangtze River Basin Cotton Area, 8 from overseas, 20 from self-bred materials by Xinjiang regional seed companies, 11 from self-bred materials by the research team, and 3 other materials. The experiment was conducted in 2024 at the Huyanghe City Experimental Base of the Agricultural Science Research Institute of the Seventh Division of the Xinjiang Production and Construction Corps (Latitude 44°20′–47°04′, Longitude 83°51′–85°51′). The base has a continental arid climate with long sunshine hours, scarce precipitation, high evaporation, a frost-free period of 170 days, and an average annual temperature of 11 °C. The temperature change in September is shown in Figure 1. The average temperature is approximately 20 °C, the minimum temperature is 9 °C, and the maximum temperature is 31 °C.

2.2. Experimental Design and Treatments

The experiment was designed with two treatments: one with defoliant spraying (DT) and one without defoliant spraying (CK), each with two replicates. Protective rows were also set up. The plot length was 2 m, with 30 membranes per zone, and each membrane covering three rows. Mechanical mulching with hole punching and manual seeding were applied. One membrane was planted with one cotton material. Drip irrigation was applied beneath the film, and other field management was the same as in the field. The defoliant was a 540 g/L thiabendazole diuron suspension (containing 180 g/L diuron and 360 g/L thiabendazole) and a special additive (This defoliant is produced and provided by Jiangsu Ruibang Agrochemical Co., Ltd.). On 5 September, the defoliant treatment was carried out. When the treatment group (DT) unmanned aerial vehicle sprayed the defoliant for the first time, 13–15 mL of 540 g/L thidiazuron + diuron suspension concentrate was used per mu, with an additive added at a ratio of 1:4. The dosage of ethephon was 70–100 mL per mu, and it was sprayed with 30–40 L of water. On 13 September, the defoliant was sprayed for the second time, and 10–12 mL of 540 g/L thidiazuron + diuron suspension concentrate was used per mu, with an additive added at a ratio of 1:4. The control group (CK) did not spray the defoliant but sprayed the same amount of clear water.

2.3. Investigation Contents and Measurement Methods

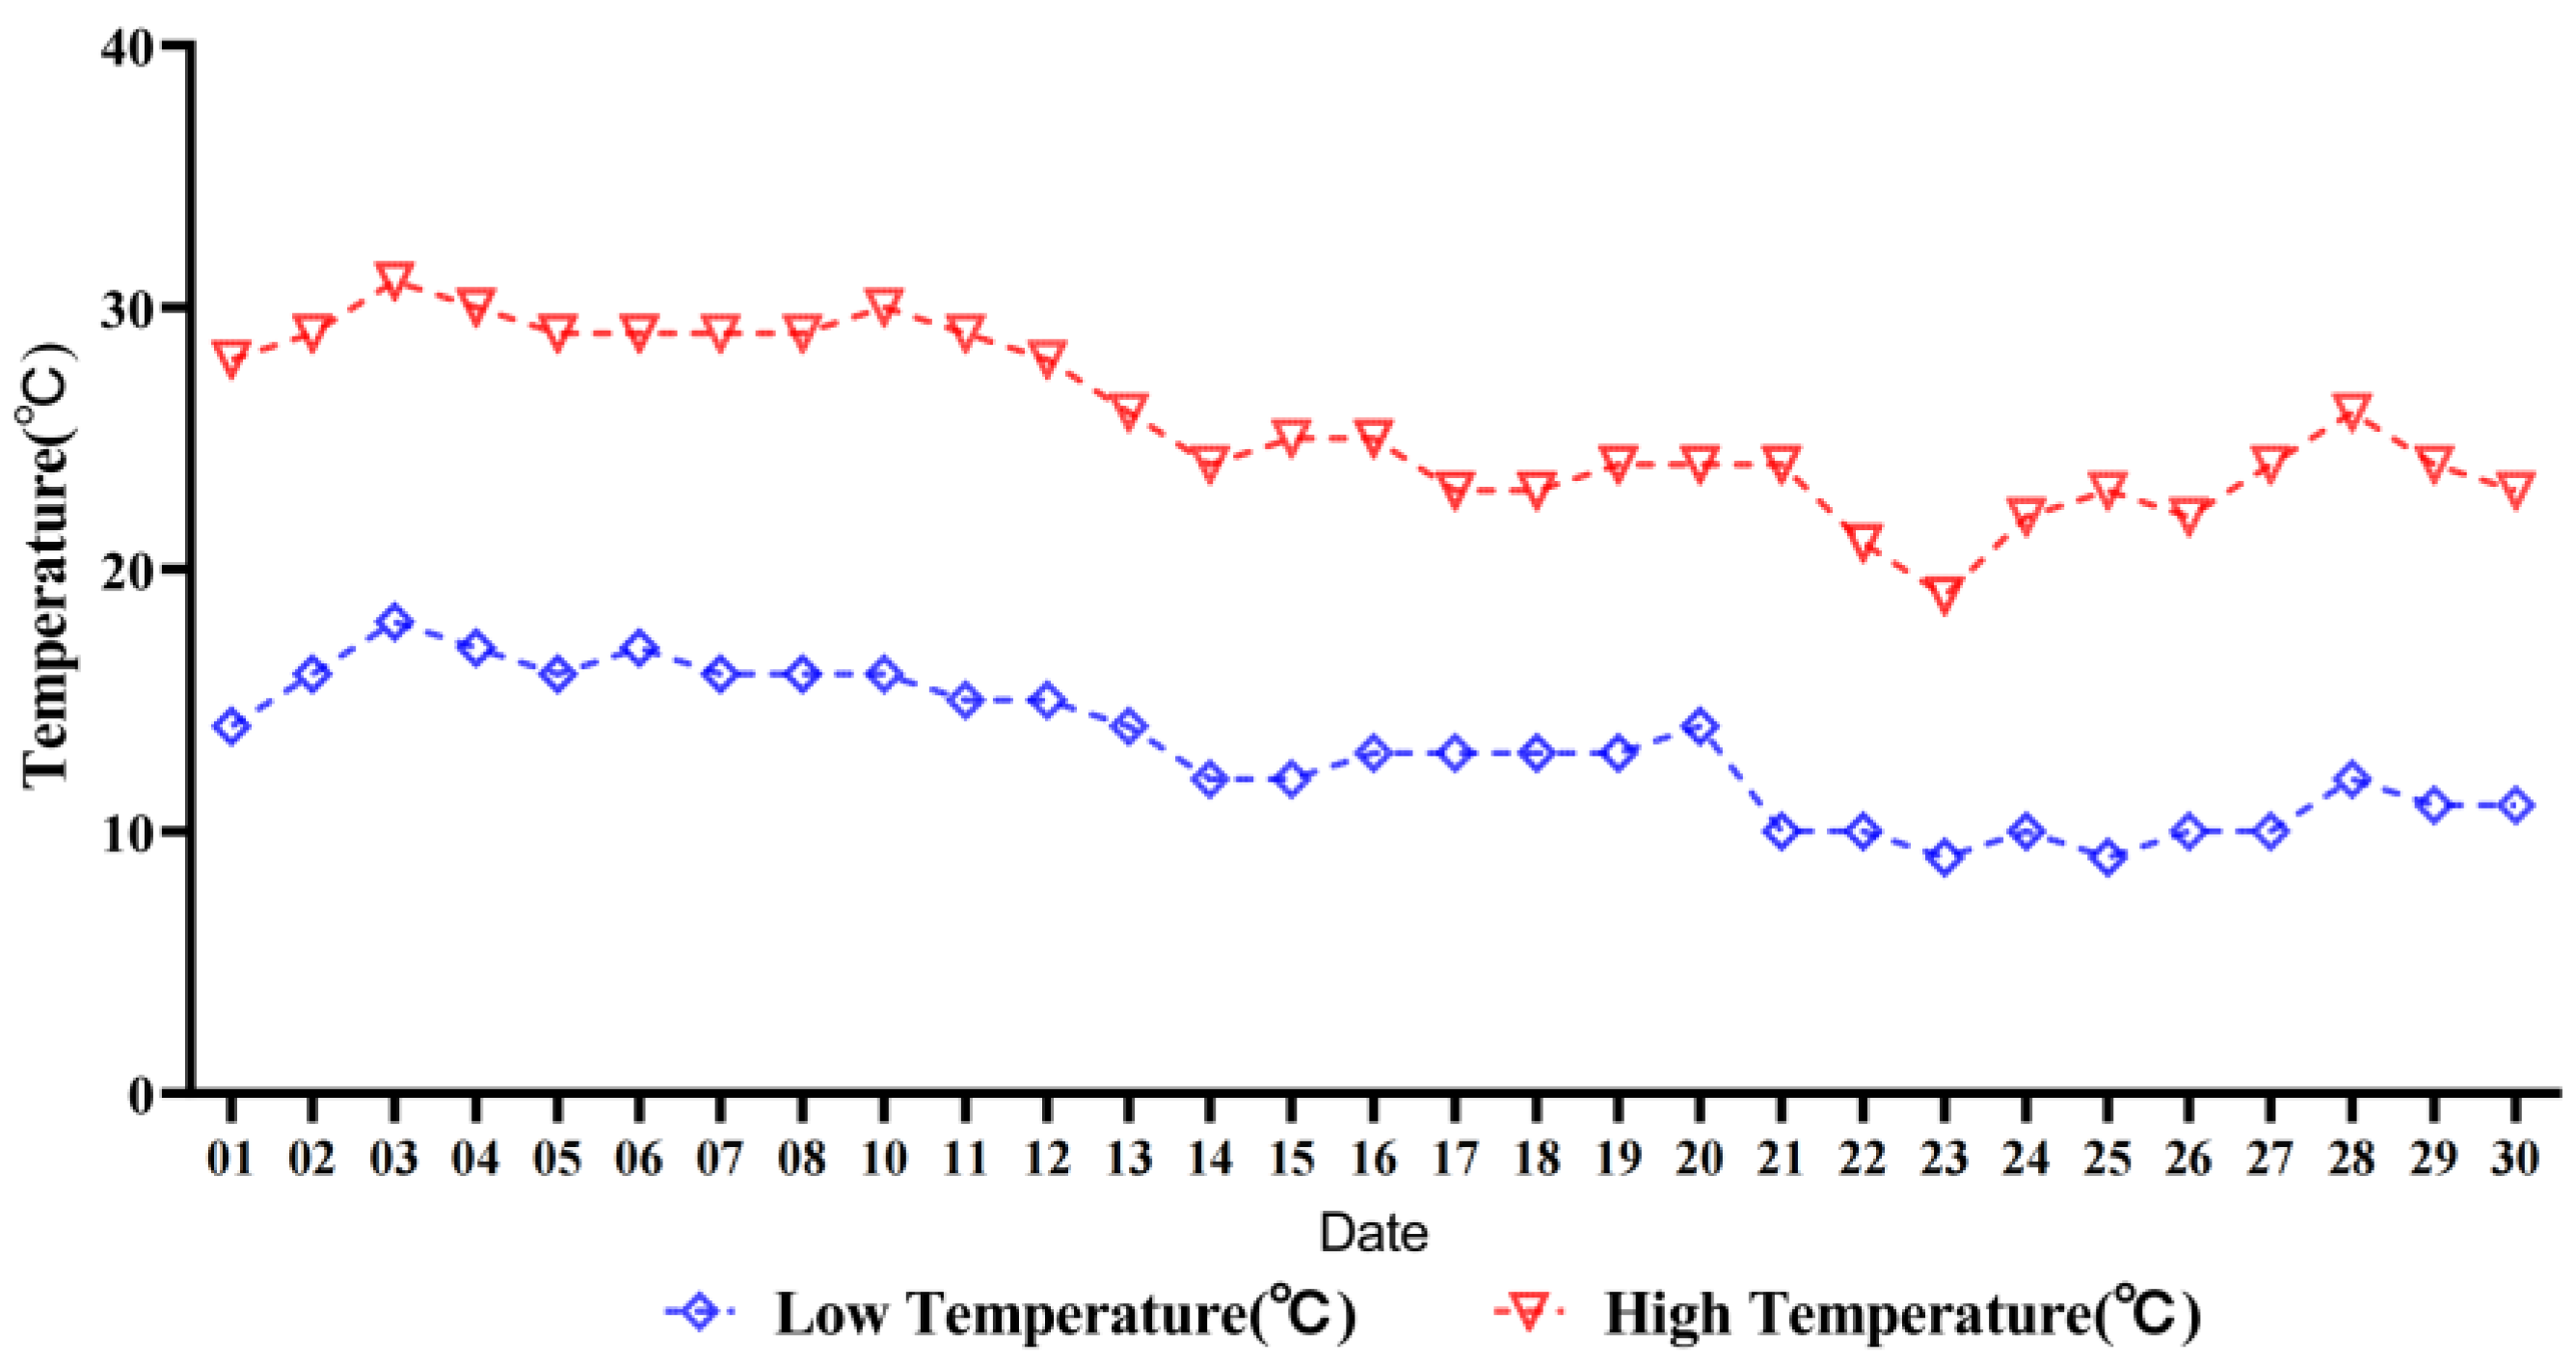
2.3.1. Field Data Acquisition in Datian

Five consecutive and uniformly growing cotton plants were selected in each plot for tagging. According to “Descriptors and Data Standard for Cotton Germplasm Resources” edited by Du Xiongming et al. [17], the agronomic traits were investigated. Before and after the spraying of defoliant, the number of cotton plant leaves and boll opening numbers of the CK and DT groups at the fixed points and plants were investigated on the 0th day of spraying defoliant and 4 days, 8 days, 12 days, 16 days, and 20 days after spraying defoliant. When conducting the investigation of the ground defoliation rate, cotton leaves smaller than 2 cm2 were not calculated. When conducting the last field data investigation, the number of effective bolls were investigated.

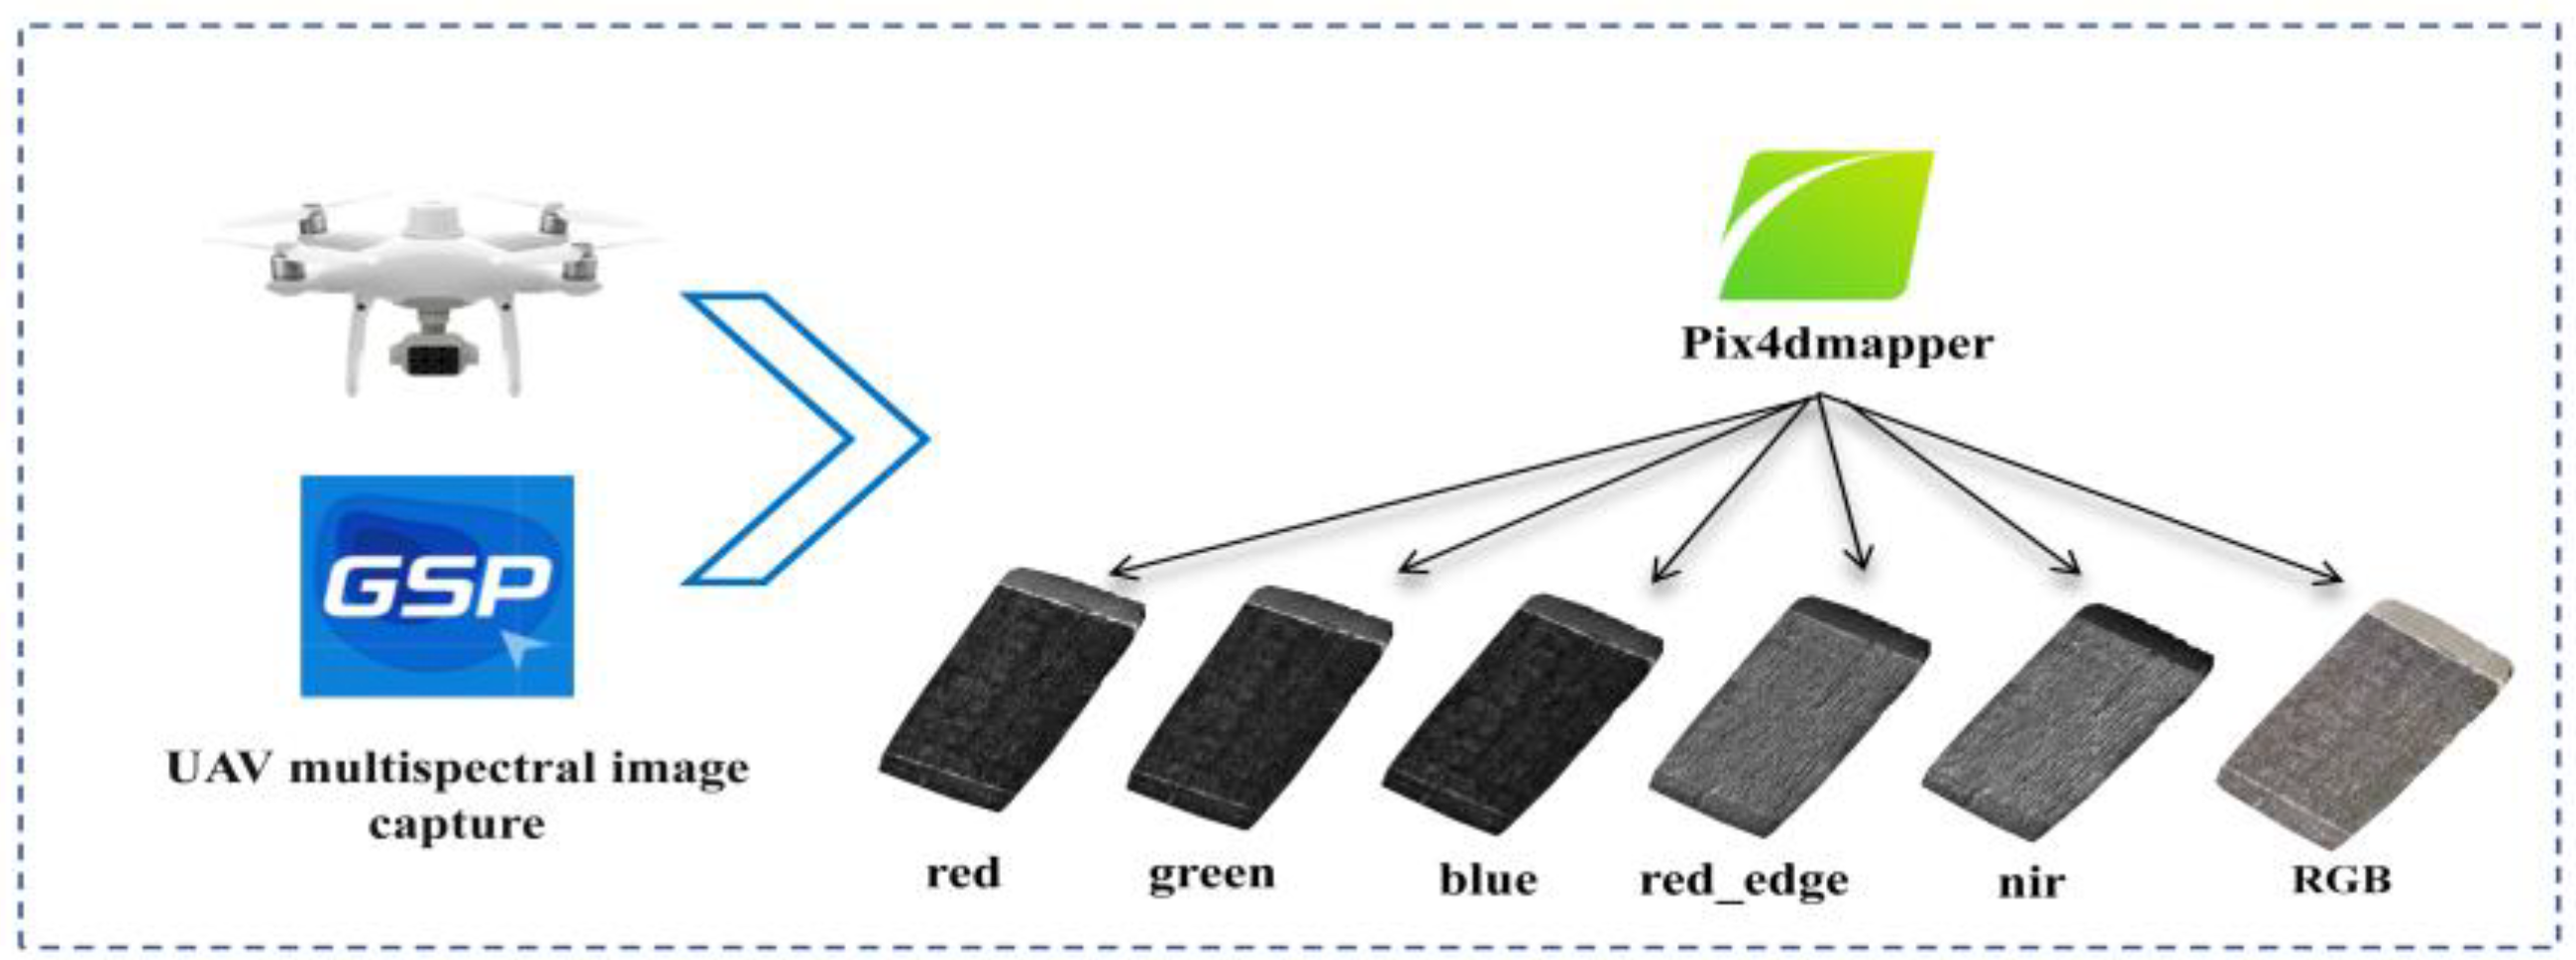
2.3.2. UAV Multispectral Data Acquisition

The DJI Phantom 4 quadcopter multispectral unmanned aerial vehicle was used for the acquisition of digital images. The DJI Phantom 4 Multispectral Edition has 6 1/2.9-inch CMOS sensors, including 1 color sensor for visible light imaging and 5 monochrome sensors for multispectral imaging. The effective pixels of a single sensor are 2.08 million (total pixels are 2.12 million). Before and after spraying the defoliant, a manual investigation was conducted, and simultaneously image acquisition work was carried out. The shooting time period was between 12:30 and 14:00. The flight altitude of the unmanned aerial vehicle was set at 20 m. The DJI GS Pro Ground Station Professional Edition was used to plan the fixed-point flight route for the target cotton field, and the flight speed was set at 1 m/s, with an image overlap rate of 80%. Before the flight, a multispectral sensor was used to shoot the radiation calibration plate to facilitate the subsequent radiation calibration of the images. Digital image data were collected at the same intervals as the manual investigation, with UAV data acquisition performed at 0 d, 4 d, 8 d, 12 d, 16 d, and 20 d after the first spraying of defoliant. The multispectral camera bands and wavelength ranges of the DJI Phantom 4 Multispectral Edition UAV are shown in Table 2.

2.4. Data Processing

The data were statistically analyzed using EXCEL 2010, IBM SPSS Statistics 20 software, GraphPsd Prism 8.0.1 software, and R 4.3.1 software; Pix4Dmapper 4.4.12 software was used for UAV digital image stitching and preprocessing, and the ArcGIS 10.2 software platform was used for extracting multispectral image data.

2.4.1. Calculation of Defoliation Rate and Boll Opening Rate

The defoliation rate (RD) was calculated using the following formula:
RD(%) = (N0 − N1)/N0 × 100%,
In the equation, N0 is the number of leaves before the defoliant treatment and N1 is the number of leaves after the defoliant treatment.
The boll shedding rate (RB) was calculated using the formula:
RB(%) = B1/B0 × 100%,
In the equation, B1 is the number of bolls that are opening and B0 is the number of effective bolls.

2.4.2. Unmanned Aerial Vehicle Data Processing

The processing of UAV high-definition digital images was carried out using Pix4D software. The UAV digital images containing location information (including latitude and longitude coordinates and altitude information) were imported into Pix4D to complete image stitching. The output result generate a multispectral image. The system automatically performed image stitching according to the settings. Once the stitching was successful, an image quality report was generated, and the image quality was evaluated through the empty three-ray point cloud. The index calculator module was used to generate the reflection map of the test site, and the obtained digital orthophoto map and 5 index map files in TIFF format of different bands were exported and stored (Figure 2).
The ArcGIS software platform was used for analysis. First, a new folder was created for the digital orthophoto map stitched by Pix4D software and 5 index maps in TIFF format of different bands; the digital orthophoto map was imported into ArcMAP 10.2 software to create a pyramid, and the pyramid resampling technique was selected to be the nearest neighbor method; a new Shapefile feature file was created in the working directory, the rectangular surface was used to divide the sampling points in the community, and finally a Shapefile feature file was obtained containing multiple-point rectangular surfaces of the sampling community; the average reflectance of the research area of each cotton material as the reflectance value of the sample were extracted and exported. Finally, the vegetation index was calculated (Figure 3). (Without further dividing the pixel semantics, regardless of the pixel semantics (pixels representing leaf area, cotton bolls, or other things), it was averaged for all pixels within the red box.

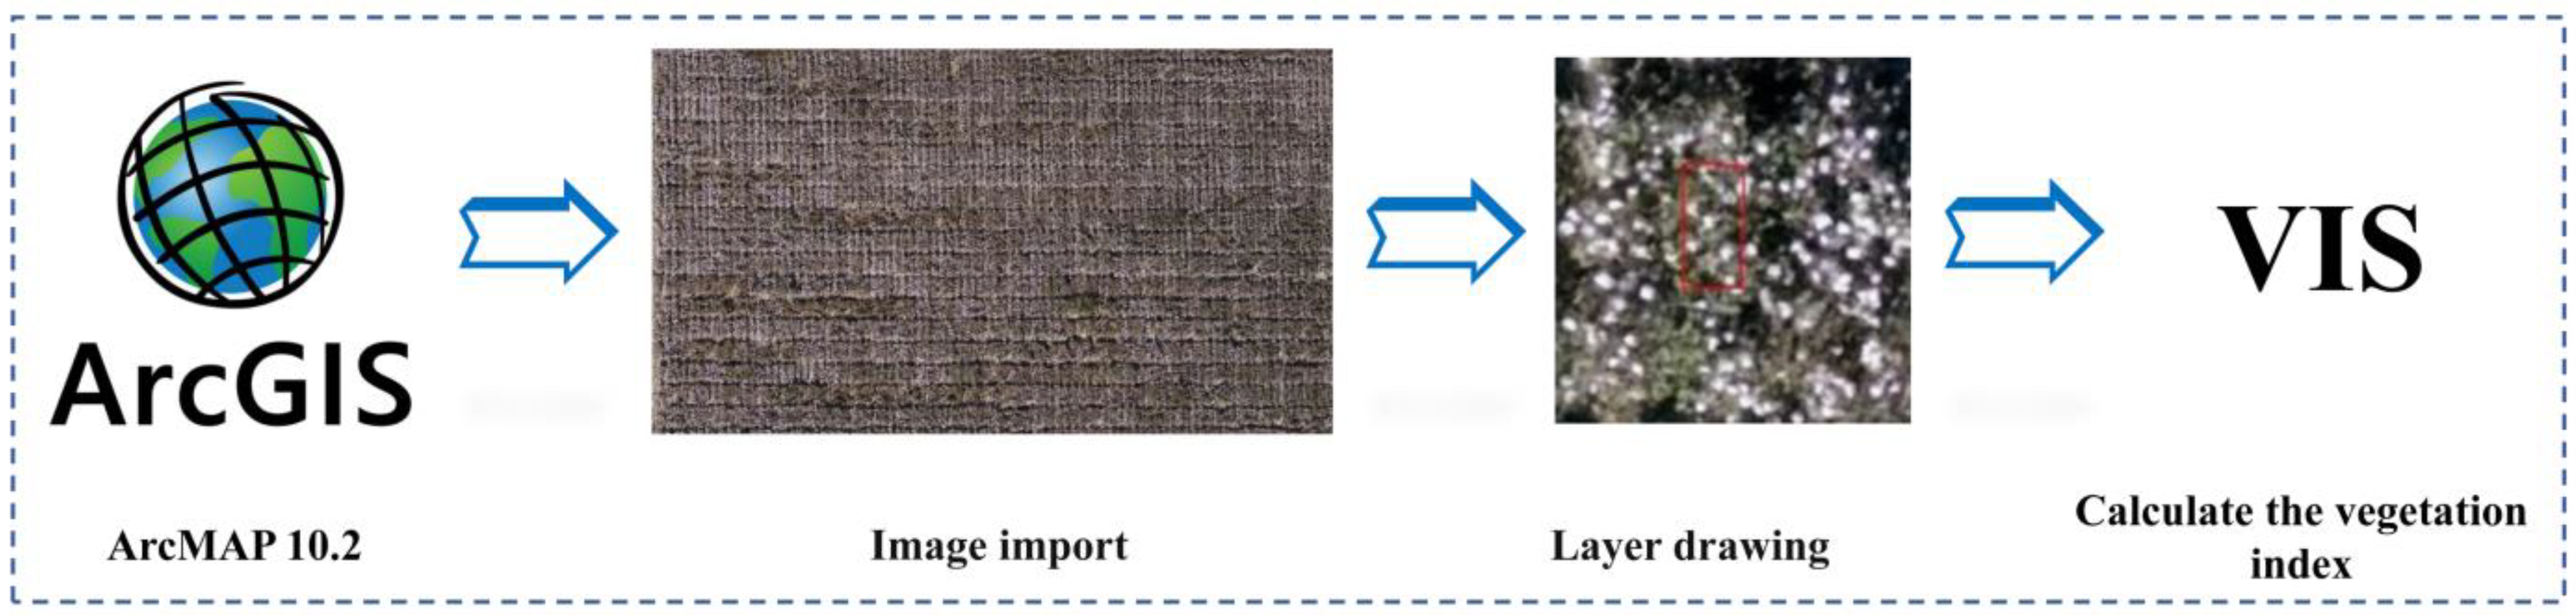
2.4.3. Vegetation Index

The vegetation index is a key parameter for evaluating the growth status of crops. Through in-depth discussion and analysis of the existing literature, this study screened out 12 vegetation indices closely related to the leaf abscission characteristics (Table 3). These vegetation indices cover multiple aspects from chlorophyll content to vegetation water status, and can reflect the growth status of cotton and its leaf abscission characteristics, thereby providing a scientific basis for the subsequent material screening and variety improvement.

3. Results and Analysis

3.1. Descriptive Statistical Analysis of Phenotypic Traits of 123 Upland Cotton Germplasm Resources

The agronomic traits of 123 upland cotton germplasm resources were statistically analyzed. The results showed that the plant height of the germplasm materials was 59.20–120.80 cm, the height of the first fruiting branch was 5.80–38.00 cm, the number of fruiting branches was 5.80–13.75, the number of effective fruiting branches was 3.60–12.00, and the number of bolls per plant was 4.80–14.20. The coefficient of variation of each trait exceeded 10% (Table 4). The coefficient of variation and extreme values of the agronomic traits of cotton germplasm materials indicated that there were significant differences in each trait among different materials, revealing the rich genetic variation in the 123 upland cotton germplasm resources, which provided a basis for the comparison and screening of planting materials.

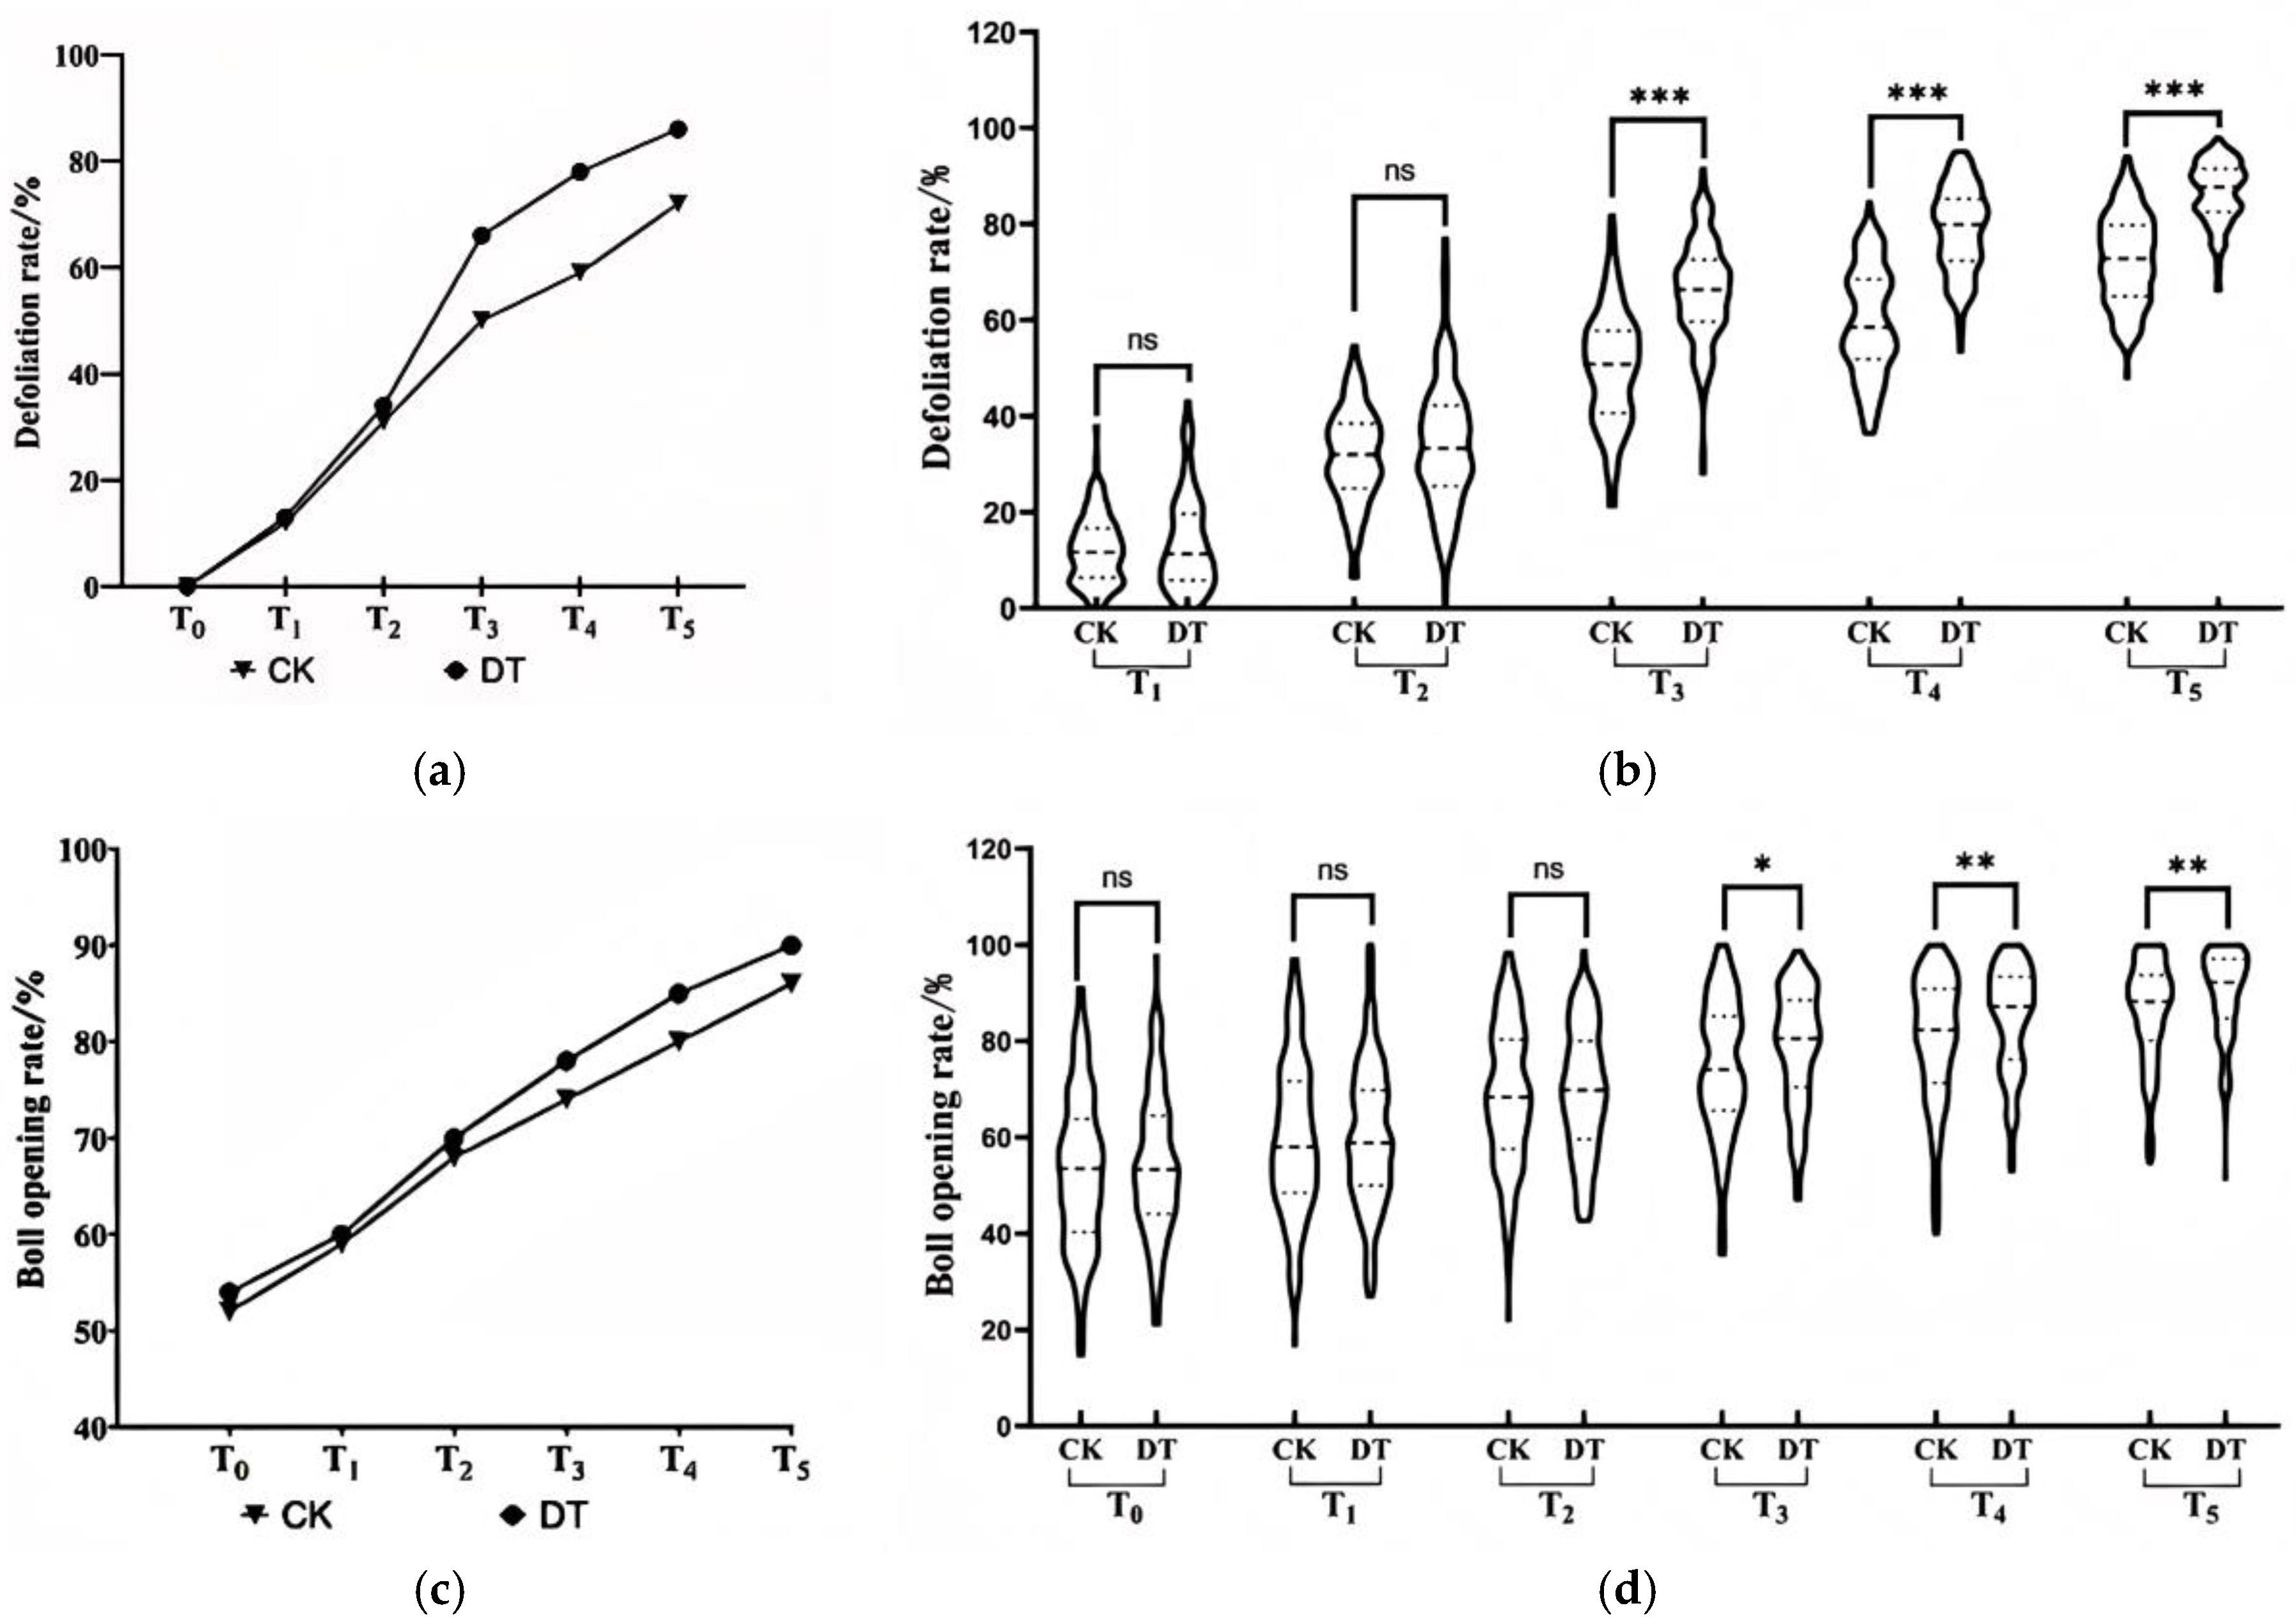
3.2. The Effect of Defoliants on the Defoliation Rate and Boll Opening Rate of Cotton Germplasm Resources

To study the defoliation effect of cotton after the application of defoliants, the defoliation rate after the application of defoliants was statistically analyzed (Figure 4a), and a significant t-test was conducted on the defoliation rate at the corresponding time points (Figure 4b). The results show that the defoliation rate continues to rise with the increase of days after application, indicating that the defoliant effectively promotes the defoliation process of cotton. Extreme value analysis shows that the defoliation effects of 123 germplasm resources are significantly different, and the defoliation rate change in the treatment group at the T4 period (16 d) is the most significant, providing a basis for the in-depth analysis of subsequent defoliation-sensitive materials.
In addition, the analysis of the change in the boll opening rate of cotton after spraying defoliants (Figure 4c) and the significant t-test of the boll opening rate at different investigation times (Figure 4d) found that the boll opening rate shows an increasing trend over time, and the boll opening rate in the experimental area where defoliants are sprayed increases more rapidly. Increasing the proportion of boll opening is beneficial to the improvement of fiber quality and the increase of yield. Compared with the control CK group, the boll opening rate in the experimental area treated with defoliants increased significantly, indicating that spraying defoliants has a significant promoting effect on the boll opening of upland cotton germplasm resources.

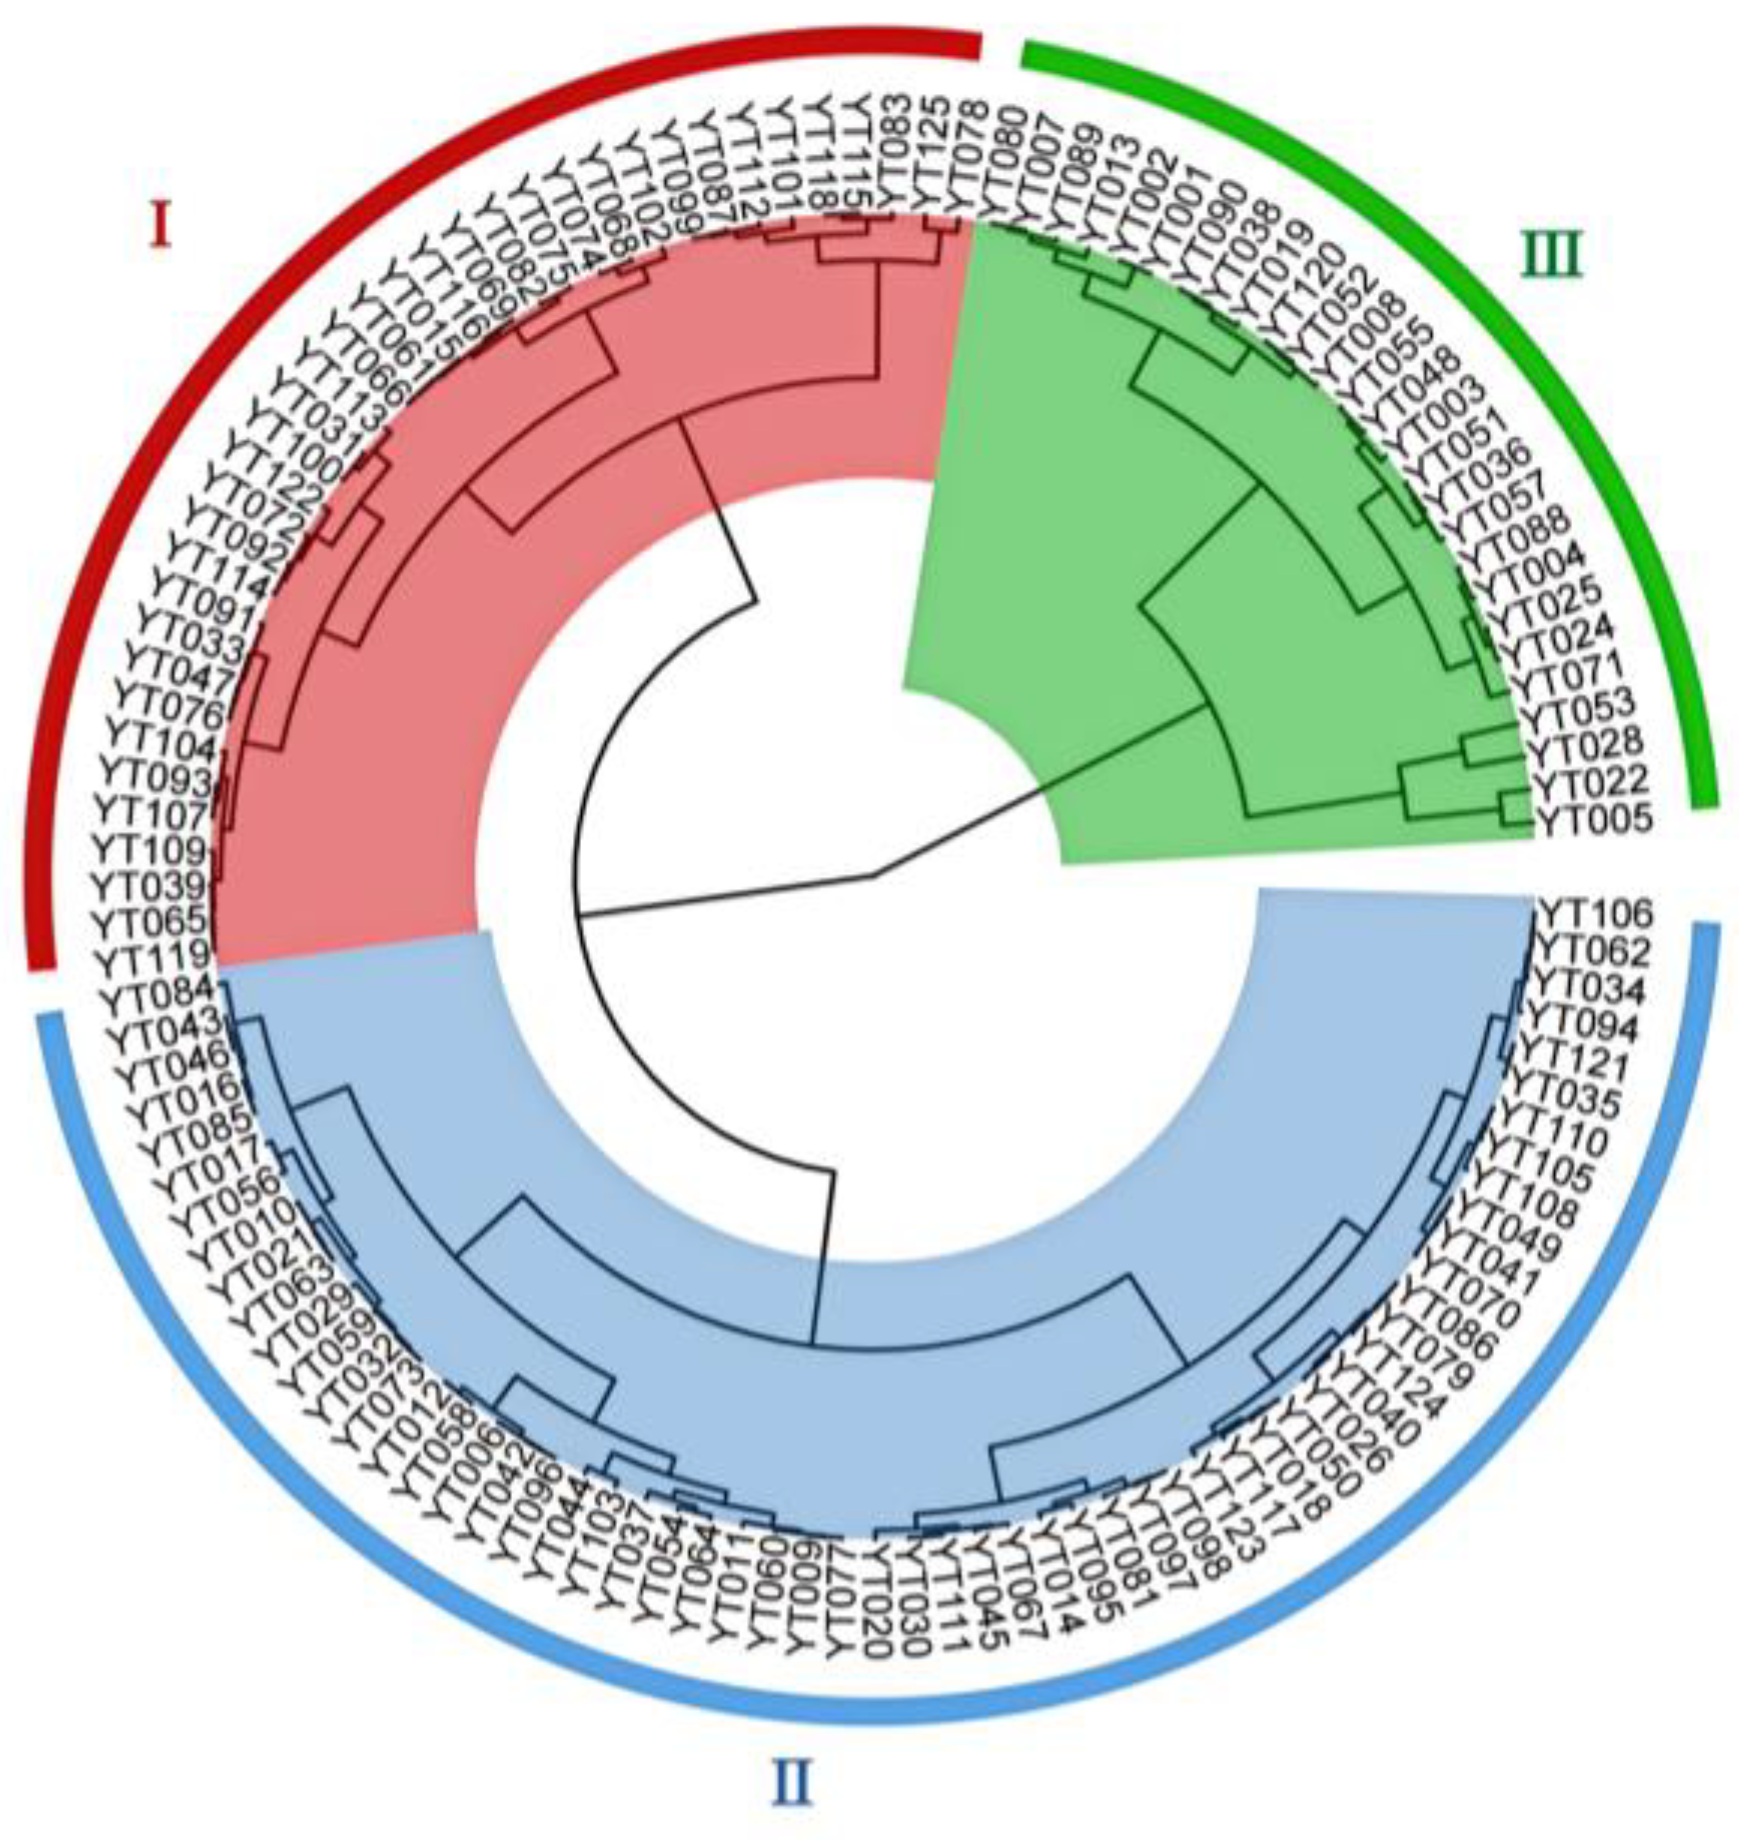
3.3. Screening of Defoliation-Sensitive Varieties Based on Defoliation Rate

The change trend of the defoliation rate of cotton materials after spraying defoliant shows (Figure 4) that a significant difference in the defoliation rate occurs in the T4 period, which is convenient for screening materials with good defoliation effects. Therefore, a cluster analysis of the defoliation rate in the T4 period (Figure 5) is conducted, and 123 germplasm resources are divided into three categories. Among them, category I belongs to the defoliation-sensitive germplasm resources, with 37 copies (Table 5), accounting for approximately 30%, and the defoliation rate is between 84.76% and 95.12%; category II belongs to the moderately defoliation-sensitive intermediate materials, with 53 copies, accounting for approximately 48%, and the defoliation rate is between 72.22% and 84.10%; category III belongs to the defoliation-insensitive germplasm resources, with 27 copies, accounting for approximately 22%, and the defoliation rate is between 53.50% and 71.34%.

3.4. Screening of Defoliation-Sensitive Materials of Cotton Based on Multispectral

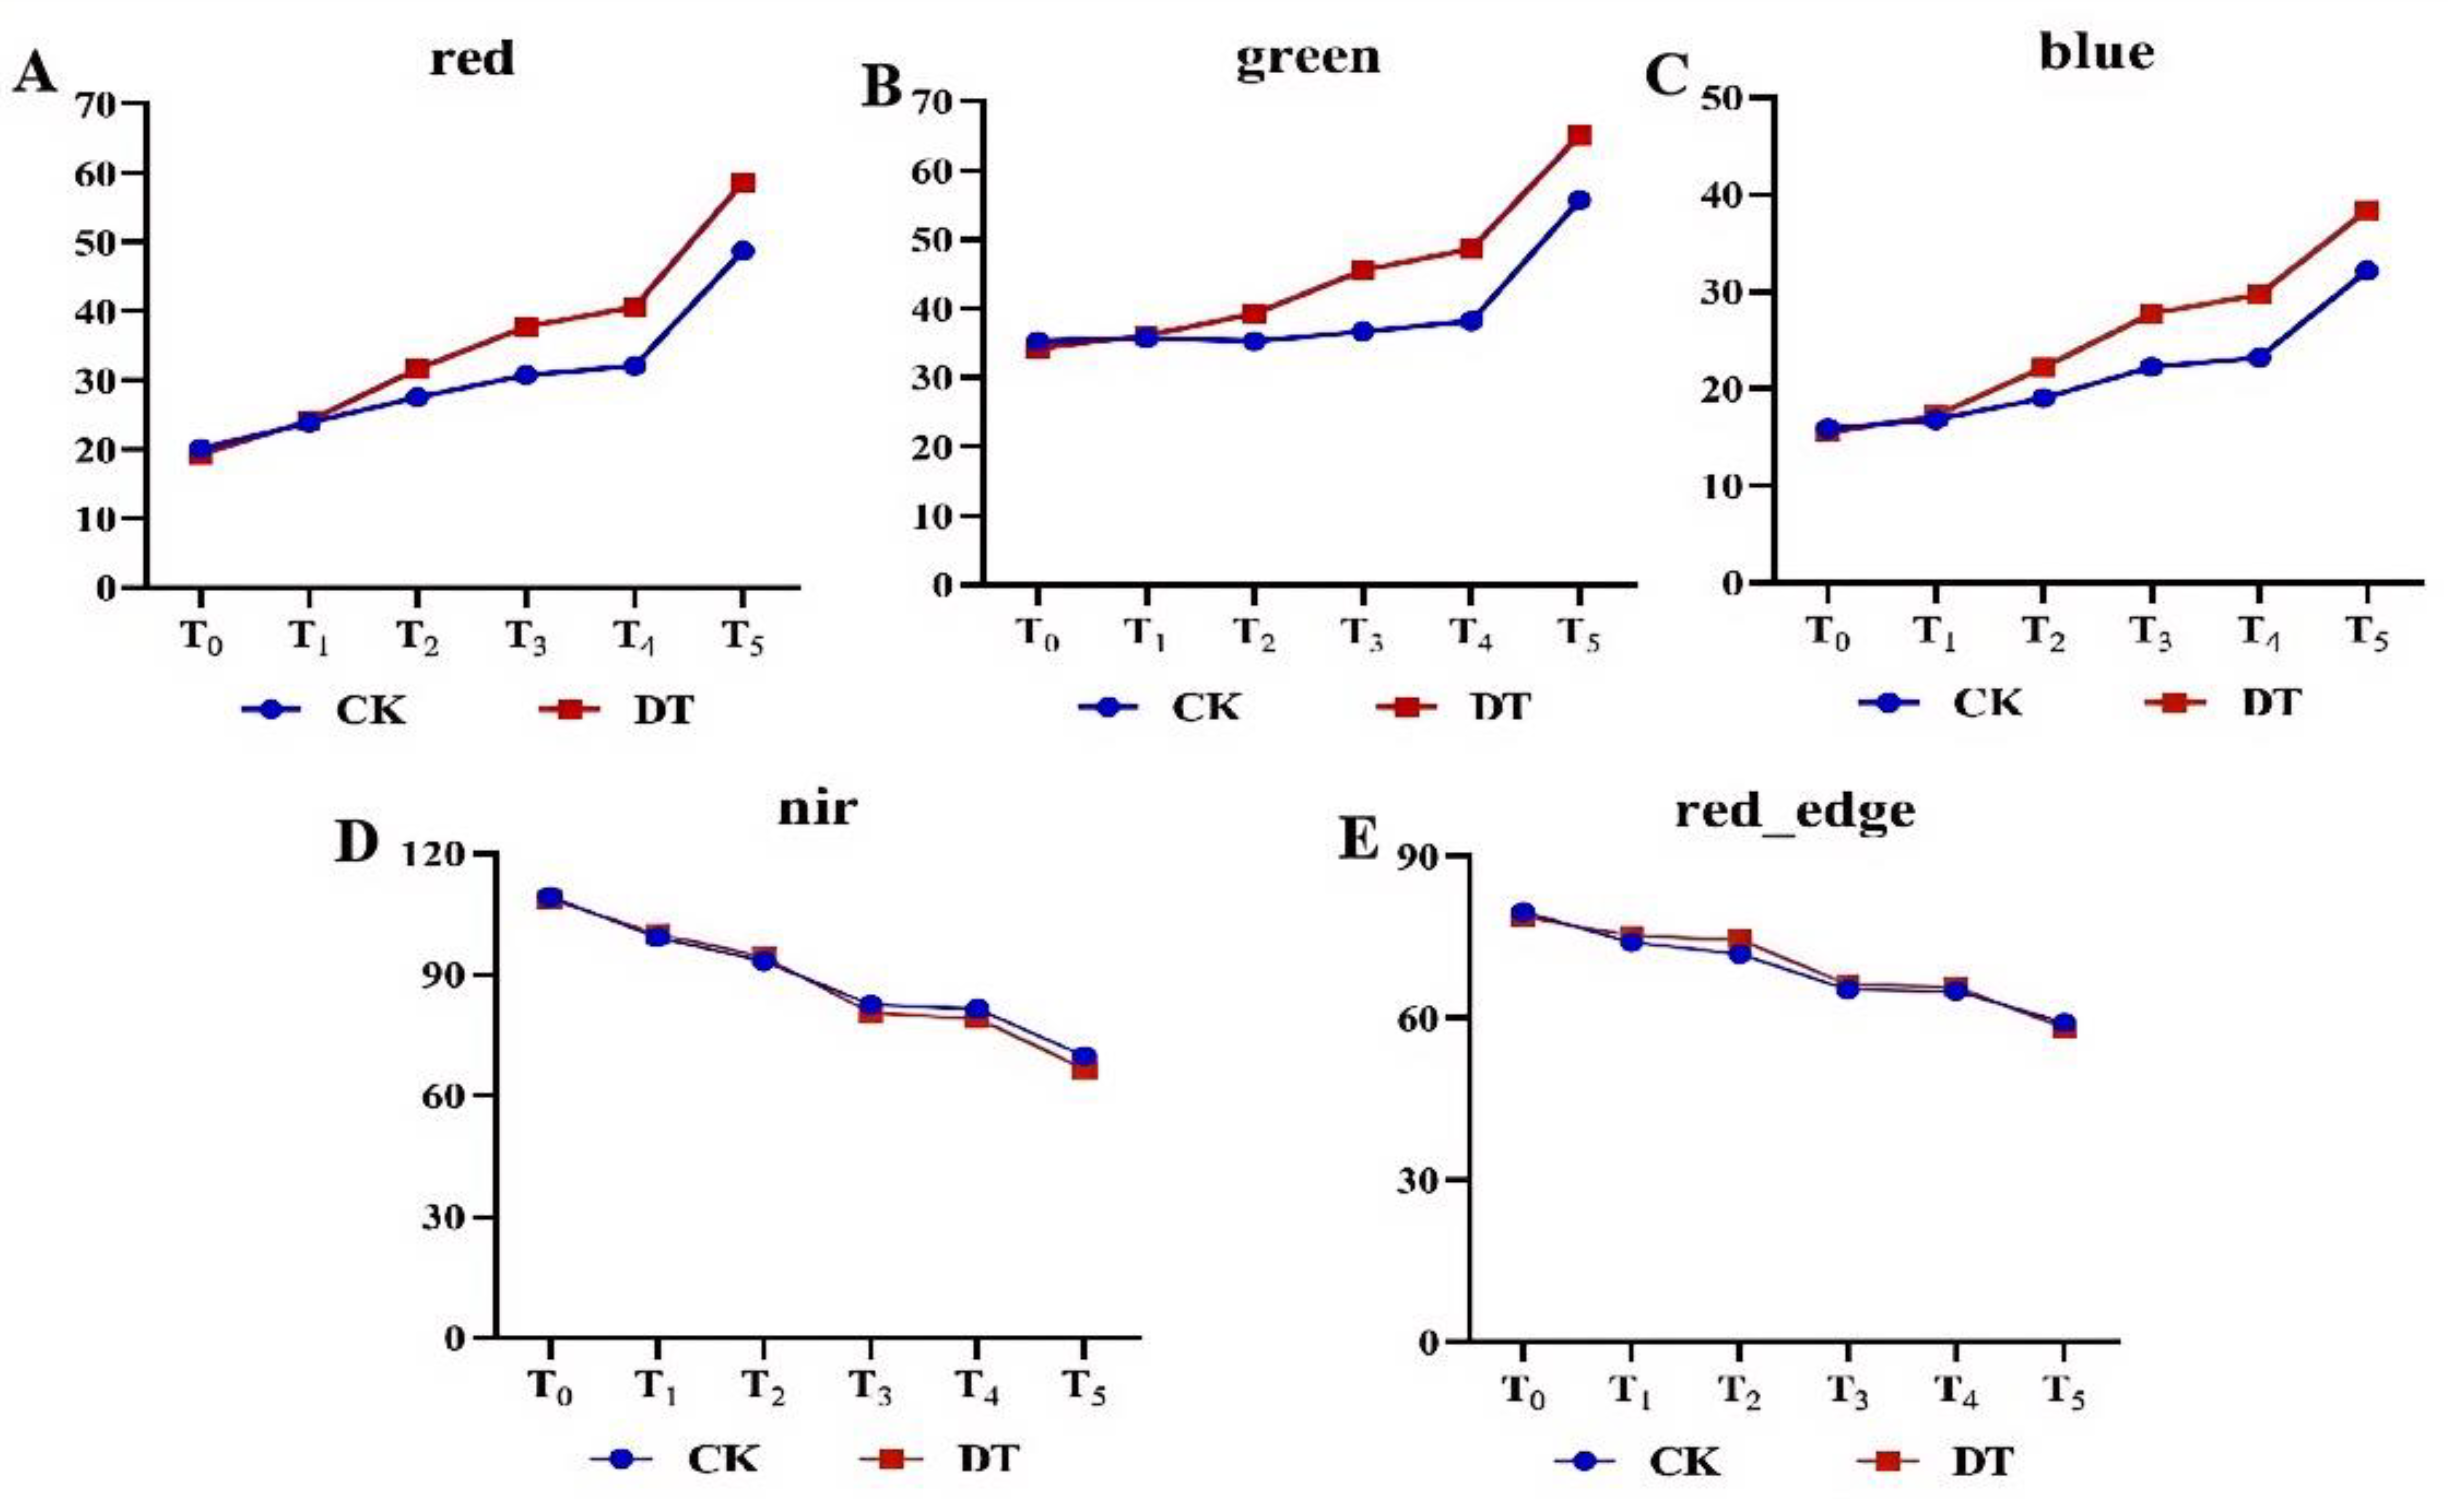
3.4.1. Changes in Multispectral Reflectance Values

Through the stitching and processing of unmanned aerial vehicle (UAV) multispectral images, the values of five bands were extracted, and their variation is shown in Figure 6. It is found that the values of the red, green, and blue bands show an upward trend with the shedding of cotton leaves, while the values of the near-infrared (nir) and red-edge (red_edge) bands show a downward trend with the shedding of cotton leaves. Through the investigation of field experiment data, it is found that there is a significant difference in the defoliation situation at 16 days (T4) after the application of the defoliant. Therefore, the multispectral values at 16 days (T4) after the application of the pesticide are selected for the subsequent study.

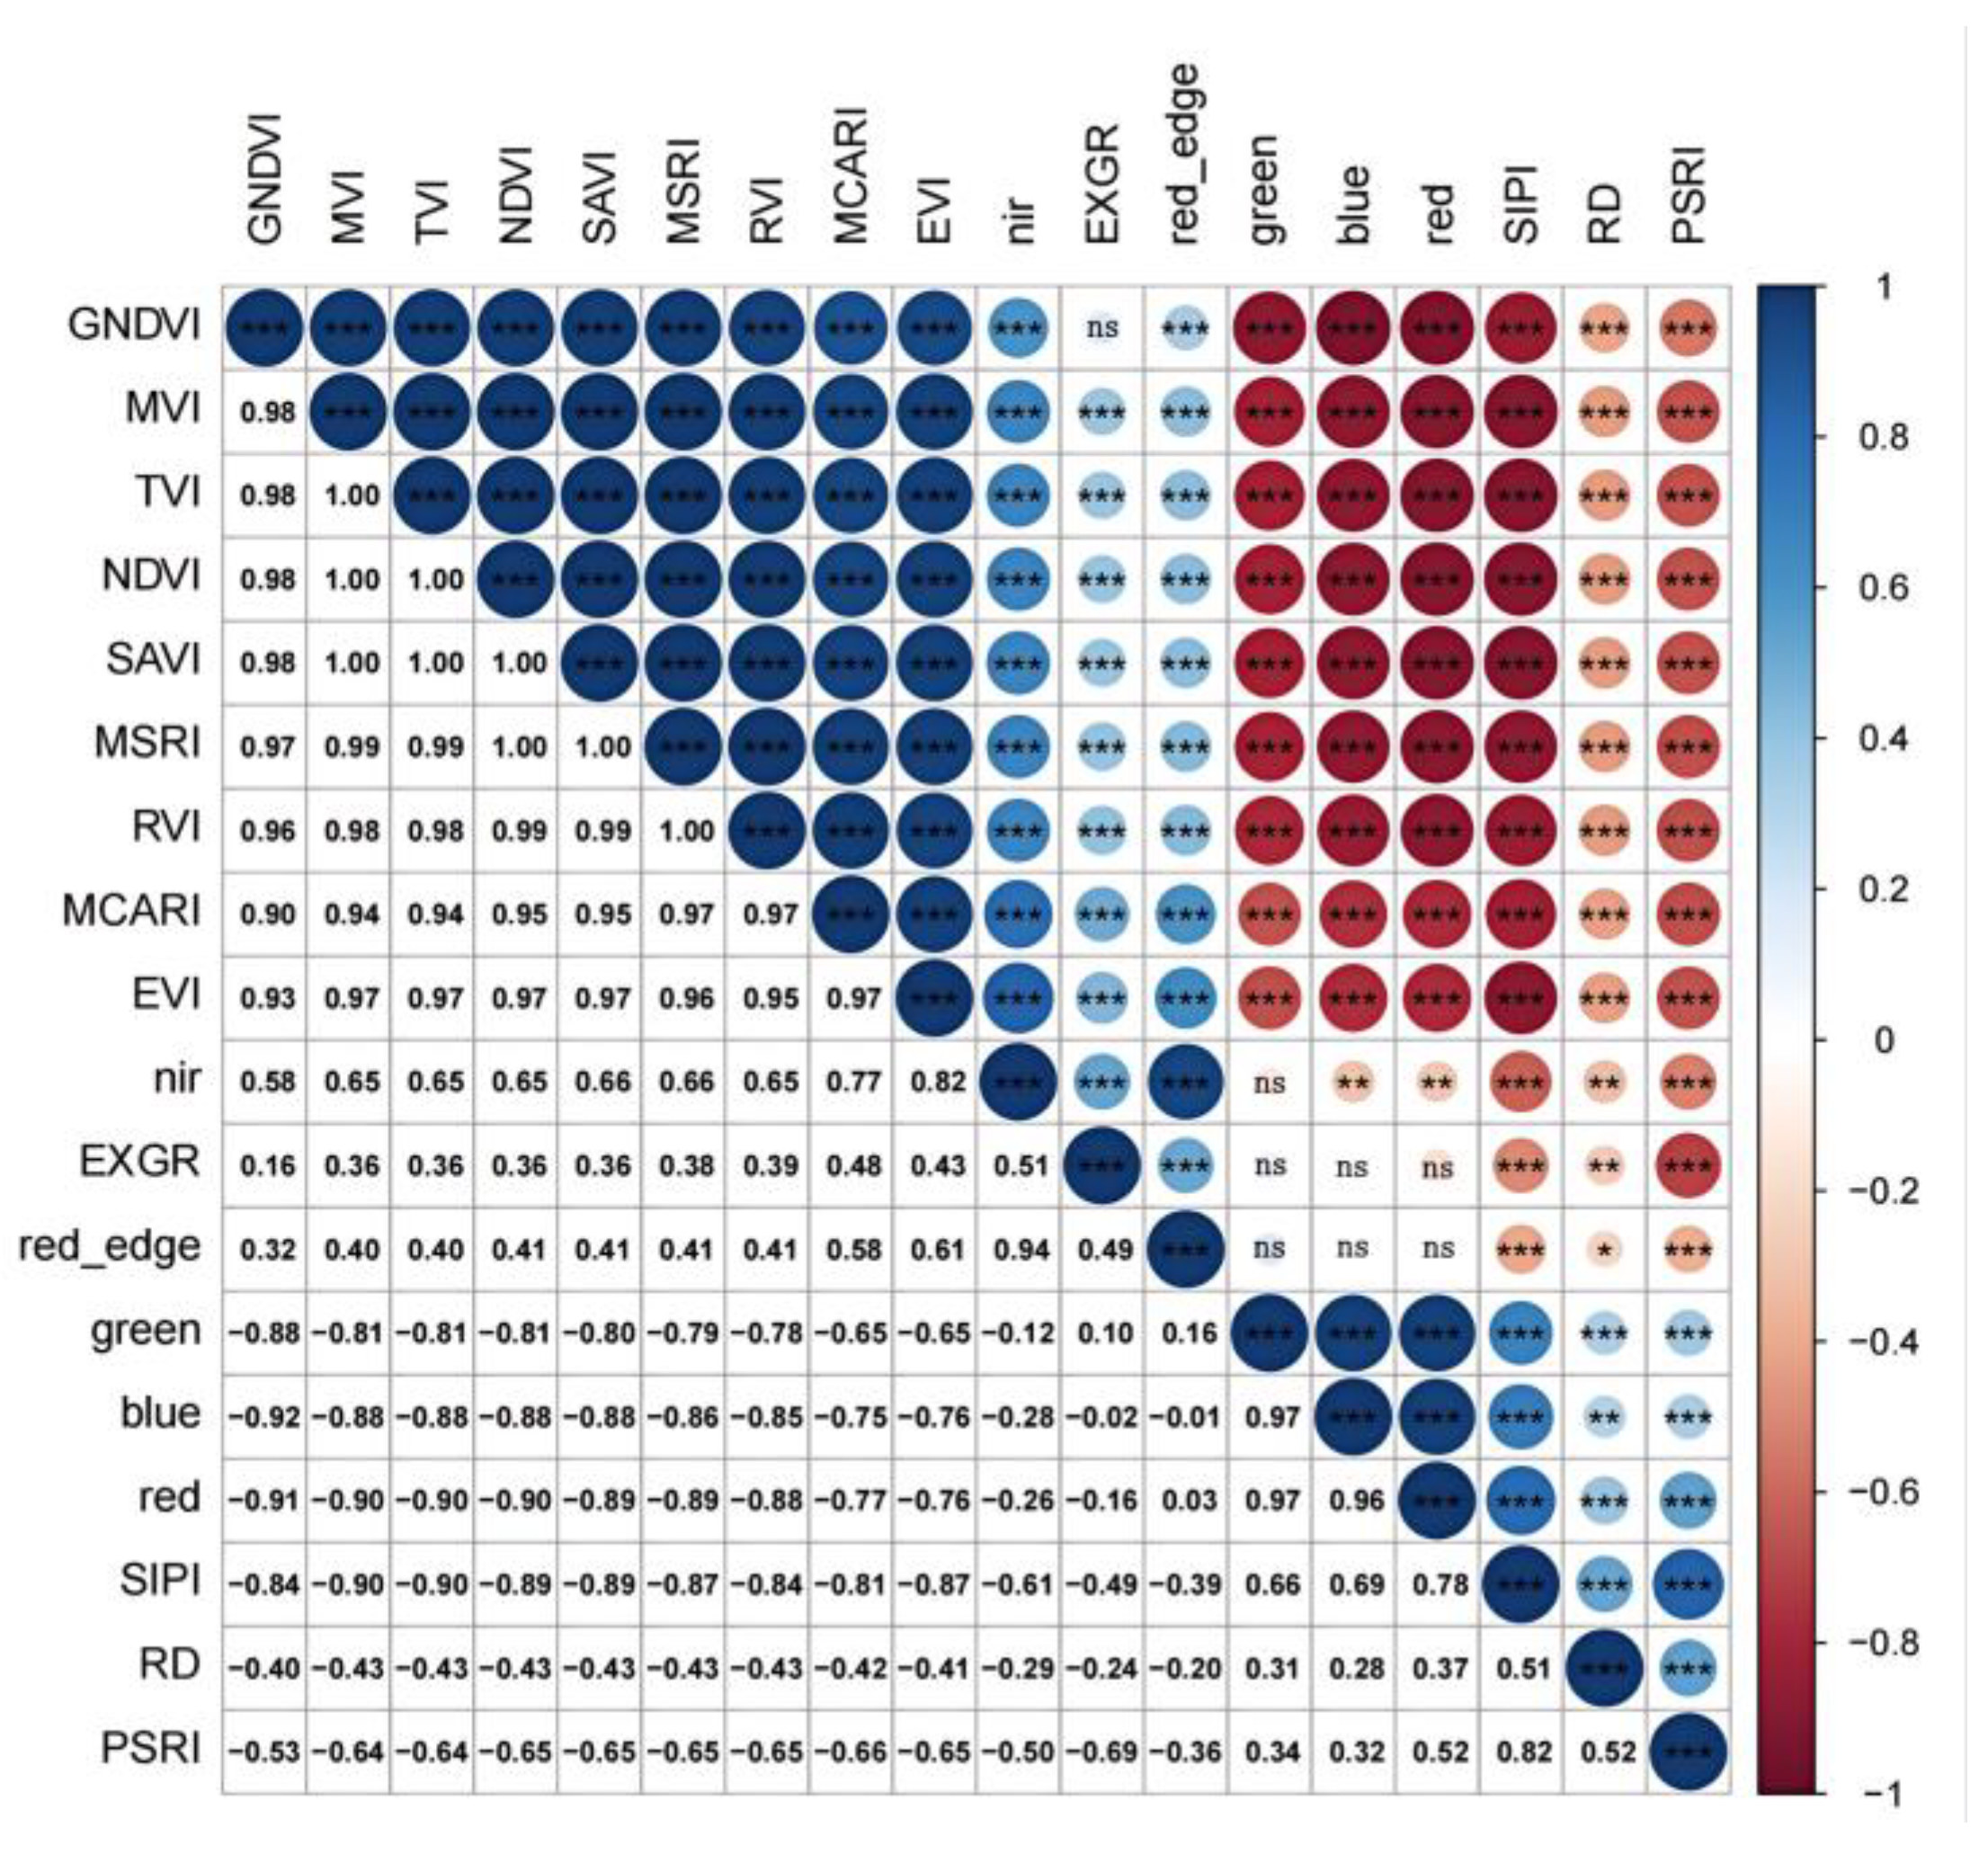
3.4.2. Analysis of the Correlation Between Multi-Spectral Bands and Vegetation Indexes and Defoliation Rate

A correlation analysis was conducted on the defoliation rate, multispectral bands, and vegetation indices on the 16th day after pesticide application (Figure 7). PSRI shows a significant positive correlation with the defoliation rate, and the highest correlation coefficient reaches 0.52; an increase in the PSRI value indicates an increase in canopy pressure, the beginning of vegetation senescence, and the maturity of plant fruits. This index is commonly used to monitor vegetation health, vegetation physiological stress, and crop yield analysis. The SIPI vegetation index is often used to monitor plant health in areas with highly variable canopy structure or LAI, mainly to identify the early signs of crop diseases or other stress causes. When screening vegetation indices, the correlation between PSRI and defoliation rate is higher than that of SIPI. Therefore, the PSRI vegetation index is finally selected for the next step of analysis. Among them, MSRI, RVI, NDVI, SAVI, TVI, MVI, MCARI, EVI, and GNDVI show a significant negative correlation with the defoliation rate, and the correlation coefficient reaches more than −0.40. These several vegetation indices have a significant correlation with the defoliation rate and can be used as relevant indicators to evaluate the defoliation of cotton.

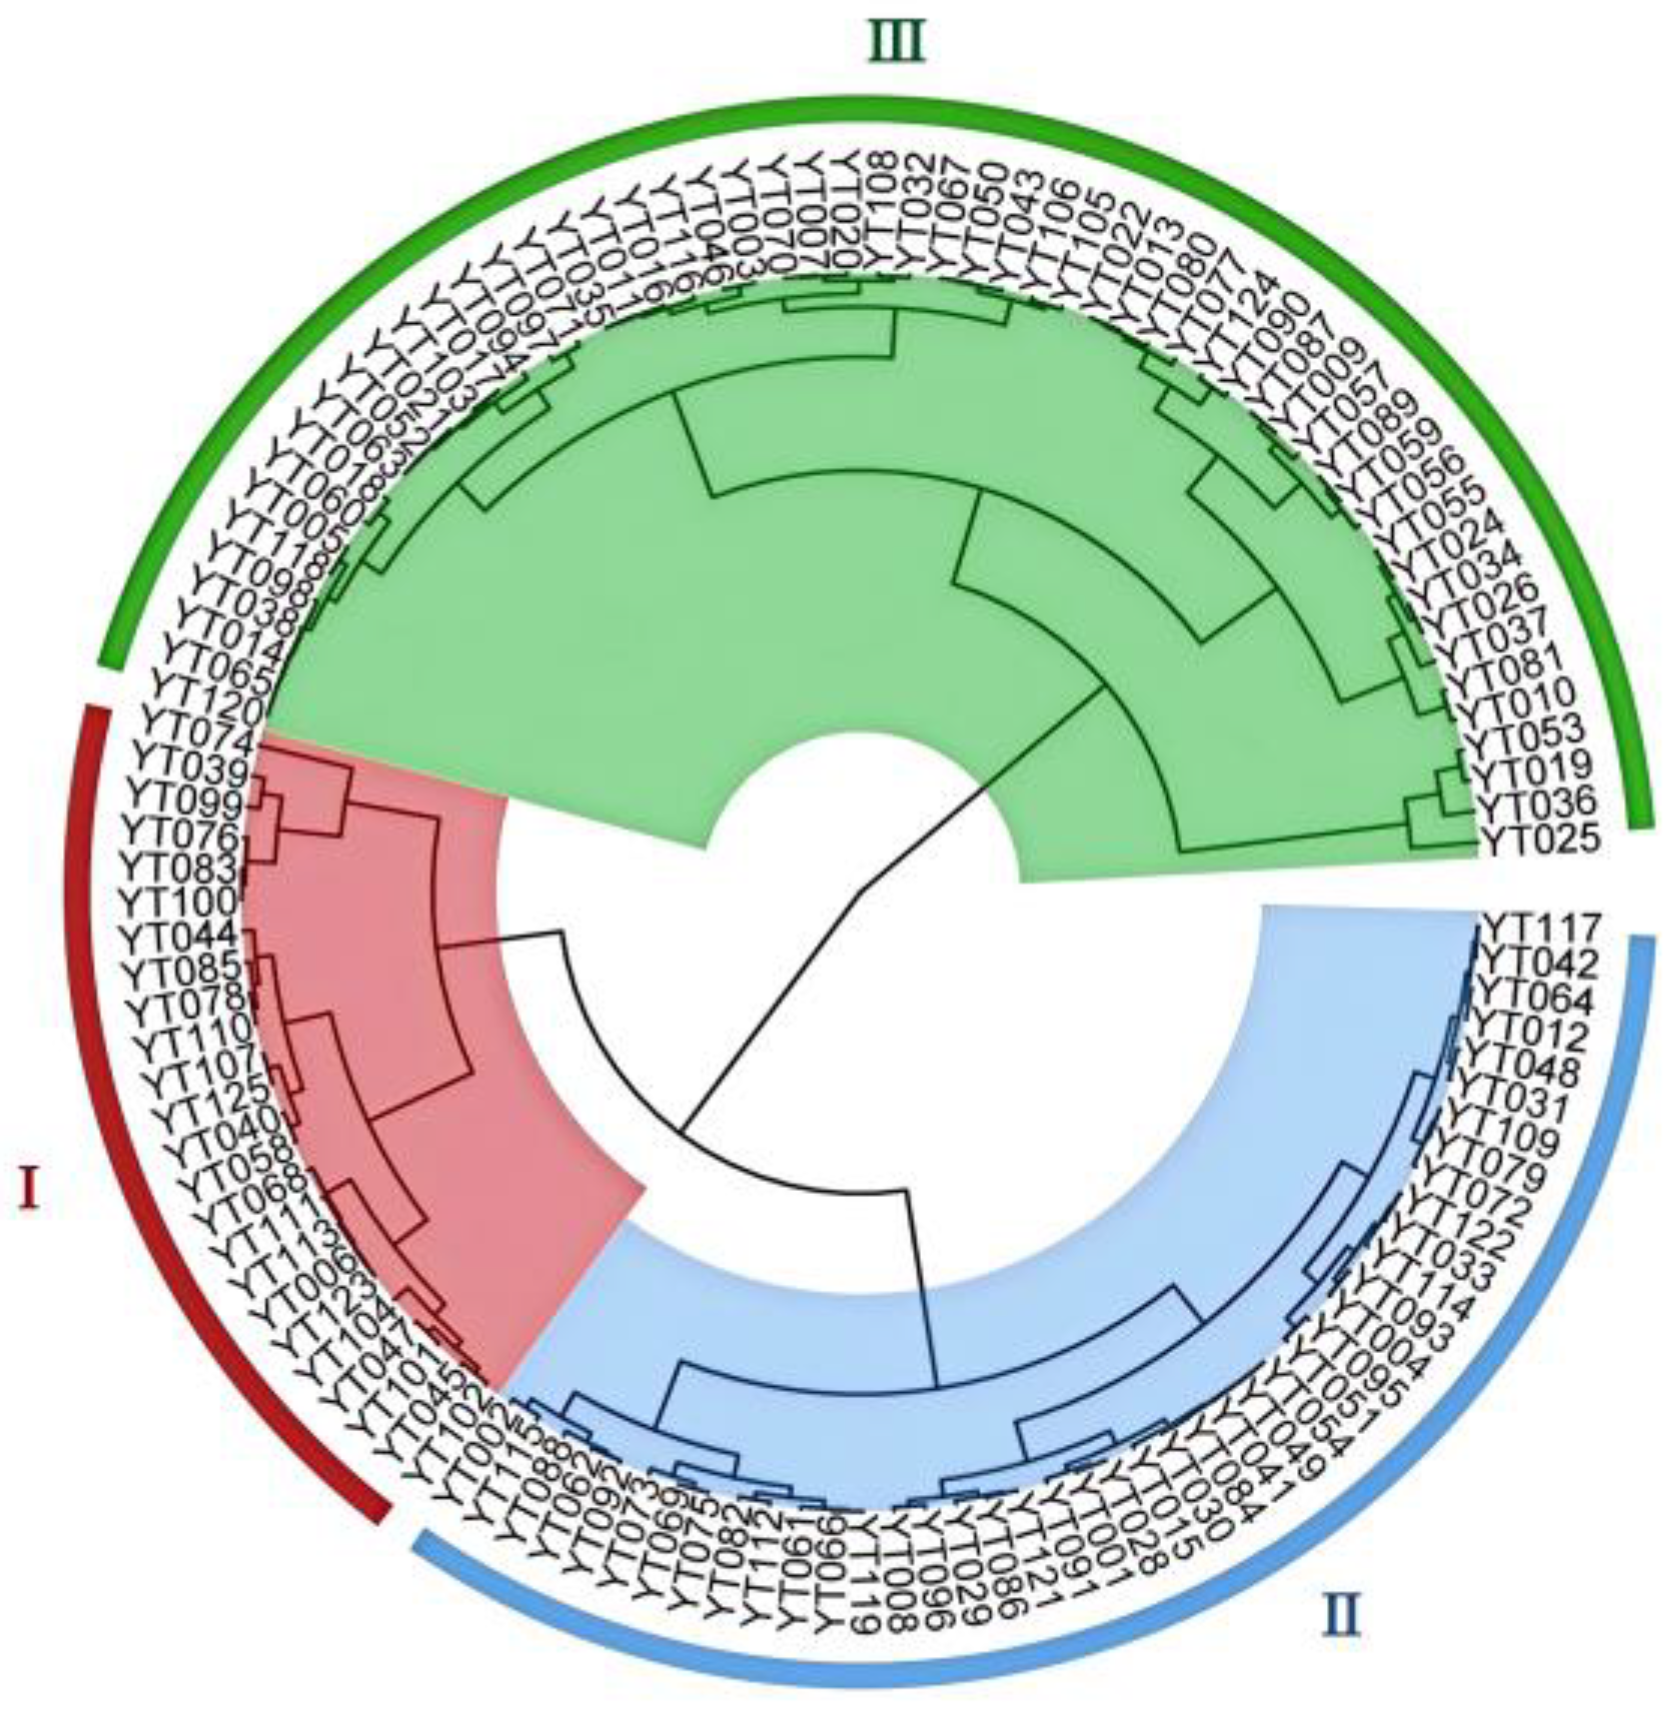
3.4.3. PSRI Clustering Screening for Defoliation-Sensitive Upland Cotton Germplasm Resources

Relevance analysis found that the correlation between PSRI and defoliation rate is the highest. Therefore, 123 germplasm resources are divided into three categories using the PSRI value (Figure 8). Among them, 24 germplasm resources with excellent defoliation effect are classified as Type I (Table 6), accounting for approximately 19.5%, with PSRI values ranging from 0.1607 to 0.1984; 43 germplasm resources with a general defoliation effect are classified as Type II, accounting for approximately 35.0%, with PSRI values ranging from 0.1358 to 0.1588; and 56 germplasm resources with a poor defoliation effect are classified as Type III, accounting for approximately 45.5%, with PSRI values ranging from 0.0763 to 0.1350.

3.5. Defoliation Rate Classification and PSRI Classification Screening Materials Consistency Evaluation

During the field investigation of the cotton defoliation rate, due to human factors such as the movement and touching of the investigators, the leaves often fall unnaturally, thereby affecting the accuracy of the investigation data. This study employed the traditional manual investigation method of defoliation rate and the classification and screening method of vegetation index PSRI to select cotton materials that are sensitive to defoliants. During the experiment, cluster analysis was conducted through the vegetation index PSRI, and 24 materials with significant defoliation effects were successfully screened out. These were compared with the 37 defoliation-sensitive materials obtained by the traditional manual investigation screening method, and finally 15 materials in Table 7 were determined. The defoliation rates of these 15 cotton materials range from 85.81% to 95.12%, the cotton boll cracking rates range from 76.67% to 98.04%, and the PSRI values range from 0.1607 to 0.1984.
Among them, seven materials showed excellent defoliation effects (>85%) and high cotton boll cracking rates (>90%), specifically including Liaomian 9, Xinluzao 10, Yuan 247-31, J206-5, Xinluzao 11, Guomian 614, and Xinluzao 73. These materials can be used as valuable resources for the subsequent genetic improvement and breeding of cotton varieties. The research results indicate that using unmanned aerial vehicles equipped with vegetation indices for screening shows a high consistency with the manual investigation screening method in screening excellent defoliation materials. This proves that it is feasible to screen cotton breeding materials with excellent defoliation effects using unmanned aerial vehicle multispectral technology.

4. Discussion

4.1. Defoliation Effect Evaluation

The main cotton-producing areas in Xinjiang generally adopt mechanized harvesting, but the residue of leaves will increase the impurity rate of seed cotton and reduce the fiber quality. Cotton varieties sensitive to defoliants have a good defoliation effect, with rapid leaf shedding, promoting boll opening, and reducing mechanical harvesting impurities. The defoliation effect is crucial to the mechanical harvesting efficiency and cotton quality. Therefore, it is necessary to screen breeding materials sensitive to defoliants. In this study, different cotton germplasm resources were treated with defoliants and control experiments. The results showed that defoliants can effectively promote cotton leaf shedding and boll opening, significantly improving the defoliation and boll opening speed of cotton. This indicates that defoliants can effectively promote cotton leaf shedding and boll opening, which is consistent with the research results of Chen et al. [29] and Gao et al. [30].

4.2. Comparison Between Traditional Survey Methods and UAV Multispectral Technology

On the traditional investigation method, the evaluation of cotton defoliation effect relies on manual investigation, including counting the number of cotton plant leaves and bolls before and after pesticide application. This method is time-consuming and error-prone. Moreover, when evaluating large cotton fields, due to vision limitations and subjective factors, it is difficult to accurately assess. The combination of high spatial resolution remote sensing and intelligent agricultural machinery provides a strong technical support for the acquisition of precise cultivated land information [31]. The method of using unmanned aerial vehicle (UAV) remote sensing as a data acquisition platform for crop monitoring can combine other auxiliary information. Previous studies have used UAV-related technologies to obtain relevant information such as crop water content [32], crop nitrogen content [33], radiation use efficiency [34], crop height information, and crop chlorophyll content. Currently, the monitoring research related to green leaves based on UAV is mainly focused on aspects such as leaf area index, biomass, and vegetation coverage. This study integrates UAV multispectral technology and vegetation index to evaluate the defoliation sensitivity of cotton, effectively overcoming the shortcomings of the traditional screening method, and providing a reference for the application of UAV multispectral technology in the field of cotton defoliation effect evaluation research.By quantitatively describing the growth indicators of crops, we can fully understand the growth status of cotton, providing a scientific basis for the development of precision agriculture.With the development of digital photography technology, obtaining crop growth information using digital images has become a more convenient and efficient method [35,36].

4.3. Discussion on the Application of Multi-Spectral Bands and Vegetation Indices

The study found that with the shedding of cotton leaves, the values of the red, green, and blue bands show an upward trend, while the values of the near-infrared (nir) and red-edge (red_edge) bands show a downward trend. When extracting spectral data in the field experiment, it was found that the reflectance of the green light band shows an upward trend. We guess that the possible reason for this phenomenon is that when cotton is in the boll opening stage, the water content of the leaves decreases and begins to fall off, which will lead to an increase in the reflectance of the green light by the leaves; and the reduction of water makes the medium that scatters the green light inside the leaves decrease, and more green light can be reflected. From the spectral curve, the reflection peak of the green light band may become more obvious. However, in addition to this physiological change, environmental factors may also be the cause of this phenomenon. When extracting data, we use the average value of all pixels within the selected range, and do not divide the cotton leaves or cotton bolls, etc., so this may lead to the change of this phenomenon. Therefore, in future experiments, the experiment can be further improved and perfected: 1. Using multi-scale spectroscopy for analysis, hyperspectral imaging technology can be added to analyze the spectral characteristics of different tissues in more detail; 2. Optimization of data acquisition methods, using image segmentation techniques or extracting texture features, such as through deep learning, to achieve precise distinction of leaves, cotton bolls [37], and background soil in UAV images; 3. Verifying through multiple environments to improve the application of UAV technology in the agricultural field.
Vegetation index is calculated through the reflectance of specific bands. It helps to reduce the interference of external factors such as soil and climate, thereby improving the accuracy and sensitivity of the target parameters. The shedding of cotton leaves is usually closely related to indicators such as chlorophyll content, leaf water status, and leaf area index (LAI); during the process of leaf shedding, chlorophyll degrades, and the photosynthetic capacity weakens, resulting in a decrease in the reflectance of the near-infrared band and an increase in the reflectance of the red light band. The shedding of cotton leaves leads to a reduction in the number of green leaves in the canopy. Researchers such as Yi [38] used remote sensing technology to monitor this change. For example, Li [39] diagnosed the premature senescence degree of cotton through different color spaces and eigenvalues, and achieved a good fitting effect. Yan [14] and the team used a quad-rotor unmanned aerial vehicle to collect multispectral images of cotton before and after spraying, combined with the maximum entropy and vegetation index threshold method to extract cotton leaf information, used the support vector machine to classify the cotton after spraying, and constructed a model through the comparison of field data to verify the application potential of unmanned aerial vehicle remote sensing technology in monitoring cotton defoliation. Previous studies have also confirmed the accuracy of the vegetation index as an indicator for monitoring changes in the cotton canopy. This study found that there is a significant positive correlation between PSRI and SIPI in the vegetation index and the defoliation rate, with the correlation coefficients exceeding 0.50; while MSRI, RVI, NDVI, SAVI, TVI, MVI, MCARI, EVI, and GNDVI show a significant negative correlation with the defoliation rate; indicating that the vegetation index can indicate the situation of cotton defoliation by reflecting the changes in the vegetation canopy.

4.4. Outlook

Looking forward to the future, with the continuous progress of unmanned aerial vehicle (UAV) remote sensing technology, data analysis methods, and artificial intelligence algorithms, the application of UAV technology in the field of precision agriculture is expected to provide more efficient solutions and promote agricultural production towards refined and intelligent management. Compared with the traditional manual observation and sampling methods, UAV remote sensing technology can achieve large-scale, real-time, and non-contact monitoring of the growth status of cotton plants. Traditional methods may be limited by the insufficient representativeness of samples and human errors, while UAV multispectral data provides a high spatial resolution and high-frequency data acquisition capability. Using this technology can effectively make up for the deficiencies of traditional investigation methods. UAV-related technologies provide a powerful technical support for screening sensitive materials suitable for cotton defoliation. To verify the stability and reliability of these screened sensitive materials, multi-point field experiments should be conducted in future studies to further evaluate their defoliation effect and boll opening rate performance. Meanwhile, continue to exploration of more vegetation indices and remote sensing technologies should be continued to improve a more accurate and efficient screening method for cotton defoliation-sensitive materials; in the future, it can cooperate with international agricultural research institutions to establish a global cotton defoliation sensitivity database using multispectral technology and promote the construction of a standardized evaluation system. This not only helps to promote the progress of cotton genetic improvement and breeding work, but also provides a strong technical support for the sustainable development of cotton production.

5. Conclusions

The test results show that the defoliant can significantly increase the defoliation rate and boll opening rate of cotton. After spraying the defoliant, there are significant differences in the leaf spectral characteristics of different cotton varieties. Through clustering analysis using the vegetation index PSRI, 24 materials with significant defoliation effects were screened out. A total of 37 defoliation-sensitive materials were obtained through the traditional manual investigation and screening method. A comparison of germplasm resources screened by these two methods was conducted. Finally, 15 breeding materials with excellent defoliation effects were determined. The defoliation rate and boll opening rate were between 85.81–95.12% and 76.67–98.04% respectively, and the PSRI value was within the range of 0.1607–0.1984, which verifies the effectiveness of the unmanned aerial vehicle multispectral technology in screening cotton breeding materials sensitive to defoliation.
Among the fifteen germplasm resources screened out, seven materials have a defoliation rate of over 85.00% and a boll opening rate of over 90%, including Liaomian 9 and Xinluzao 10, etc., showing good defoliation and boll opening characteristics, and are suitable as the preferred materials for germplasm resource improvement. The cracking rate of cotton bolls can be used as a relevant reference for yield prediction and harvest. Therefore, in subsequent experiments, we can continue to explore the potential changes in yield and quality of the materials with significant defoliation effects; by evaluating the cracking situation of these materials’ cotton bolls, we can further understand their practical production application value in cultivating and improving high-quality varieties.
In future studies, multi-point ecological zone verification experiments can be carried out, including cotton planting data under different geographical, climatic and soil conditions, to improve the accuracy of UAV multispectral technology. In addition, subsequent experiments can integrate texture features and temporal analysis in the multispectral data processing algorithm, which is expected to further improve the application of UAV technology in agriculture; the relevant models of boll opening rate and yield and quality can be further analyzed and constructed, thereby helping to select excellent breeding materials.
The results indicate that the use of drones equipped with the vegetation index for screening shows high consistency with manual survey methods in identifying superior defoliation materials. This confirms that using drone-based multispectral technology to select cotton breeding materials with excellent defoliation effects is a feasible approach. The drone multispectral screening technology based on the vegetation index effectively compensates for the limitations of traditional survey methods in investigating and selecting cotton defoliation, offering a more convenient and faster way to assess cotton defoliation status. This technology provides a more scientific and streamlined method for field management and germplasm selection. With high application value, it can offer technical support to agricultural producers for optimizing breeding selection and data surveys.

Author Contributions

Y.G. and H.Z. contributed equally to this paper. Conceptualization, Q.C. (Qin Chen); Data curation, H.Z.; Formal analysis, Y.G.; Funding acquisition, Q.C. (Quanjia Chen); Investigation, Y.G., H.Z., Q.C. (Qiyu Chang) and J.W.; Methodology, Y.G. and H.Z.; Project administration, Q.C. (Quanjia Chen); Resources, Q.Z.; Supervision, H.X. and Q.C. (Qin Chen); Visualization, J.W.; Writing—original draft, Y.G. and H.Z.; Writing—review and editing, W.G. and Q.C. (Qin Chen). All authors have read and agreed to the published version of the manuscript.

Funding

Funding was provided by the National Key R&D Program of China (2024YFD1200300); National Natural Science Foundation of China Regional Fund Project (32260503); and the “Tianshan Talent” Young Science and Technology Top-notch Talent Project—Grassroots Scientific and Technological Backbone Talent (2022TSYCJC0061).

Institutional Review Board Statement

Not applicable.

Data Availability Statement

If necessary, the data of this study can be obtained from the corresponding author upon request. The data are part of an ongoing study, and due to privacy restrictions, they are not publicly available.

Conflicts of Interest

We declare that this article does not have any competitive interest conflicts.

References

  1. Zhang, Y. The Technological Power Behind Cotton Yield Increase in Xinjiang. China Agricultural Mechanization Herald, 20 February 2025. (In Chinese) [Google Scholar]
  2. Liang, L. The Technological Code for High Yield of Xinjiang Cotton. Science and Technology Daily, 25 December 2024. (In Chinese) [Google Scholar]
  3. Tian, R.Y.; Mao, Y.Q.; Jia, W.M. Analysis on Costs and Benefits of Manual and Mechanical Harvesting of Cotton in Xinjiang. Agric. Technol. 2015, 35, 249. (In Chinese) [Google Scholar]
  4. Li, H.B. Comparative Analysis of Defoliation Effects of Different Formula Defoliants Sprayed on Cotton. Xinjiang Farm. Res. Sci. Technol. 2013, 36, 39–40. (In Chinese) [Google Scholar]
  5. Xiang, B. Application Research of Low-altitude Remote Sensing Images from UAVs. Low Carbon World 2017, 89–90. (In Chinese) [Google Scholar]
  6. Haldar, D.; Dave, V.; Misra, A.; Bhattacharya, B. Radar Vegetation Index for assessing cotton crop condition using RISAT-1 data. Geocarto Int. 2020, 35, 364–375. [Google Scholar] [CrossRef]
  7. Xie, Q.; Dash, J.; Huete, A.; Jiang, A.; Yin, G.; Ding, Y.; Peng, D.; Hall, C.C.; Brown, L.; Shi, Y.; et al. Retrieval of crop biophysical parameters from Sentinel-2 remote sensing imagery. Int. J. Appl. Earth Obs. Geoinf. 2019, 80, 187–195. [Google Scholar] [CrossRef]
  8. Ma, Y. Estimation of Water and Nitrogen Parameters in Cotton Canopy Based on Hyperspectral Remote Sensing. Master’s Thesis, Chinese Academy of Agricultural Sciences, Beijing, China, 2020. (In Chinese). [Google Scholar]
  9. Junker, L.V.; Ensminger, I. Relationship between leaf optical properties, chlorophyll fluorescence and pigment changes in senescing Acer saccharum leaves. Tree Physiol. 2016, 36, 694–711. [Google Scholar] [CrossRef]
  10. Zhang, L.; Sun, B.; Zhao, D.; Shan, C.; Wang, G.; Song, C.; Chen, P.; Lan, Y. Prediction of cotton FPAR and construction of defoliation spraying prescription map based on multi-source UAV images. Comput. Electron. Agric. 2024, 220, 108897. [Google Scholar] [CrossRef]
  11. Liang, F.R.; Long, Y.L.; Du, X.; Tan, Y.; Tao, Z.; Li, L.; Ye, P.; Kurban, W.; Ai, X. Research Progress on Cotton Defoliation and Ripening Agents and Their Application Technologies. China Cotton 2024, 51, 1–7. (In Chinese) [Google Scholar]
  12. Chen, B.; Zhang, G.; Wang, J.; Liu, J.; Li, S.; Yu, Y.; Wang, F.; Han, H. Effect of Different Defoliants on Machine—Picked Cotton under Equal spacing and Dense Planting Model. J. Acta Agric. Boreali-Occident. Sin. 2019, 28, 1594–1601. (In Chinese) [Google Scholar]
  13. Maes, W.H.; Steppe, K. Perspectives for remote sensing with unmanned aerial vehicles in precision agriculture. Trends Plant Sci. 2019, 24, 152–164. [Google Scholar] [CrossRef]
  14. Yan, C.Y.; Li, W.H.; Lan, Y.B.; Hu, C.; Lu, L.; Zhao, J. Monitoring Cotton Defoliation Effects and Prescription Map Generation Based on UAV Multispectral Remote Sensing. J. Nanjing Agric. Univ. 2022, 45, 799–808. (In Chinese) [Google Scholar]
  15. Ma, Y.; Lü, X.; Qi, Y.; Zhang, Z.; Yi, X.; Chen, X.; Yan, T.; Hou, T. Construction of a Monitoring Model for Defoliation Rate of Machine-Harvested Cotton Based on UAV Digital Images. Cotton Sci. 2021, 33, 347–359. (In Chinese) [Google Scholar]
  16. Ma, Y.; Chen, X.; Huang, C.; Hou, T.; Lv, X.; Zhang, Z. Monitoring defoliation rate and boll-opening rate of machine-harvested cotton based on UAV RGB images. Eur. J. Agron. 2023, 151, 126976. [Google Scholar] [CrossRef]
  17. Du, X.M.; Zhou, Z.L. Descriptive Specifications and Data Standards for Cotton Germplasm Resources; China Agriculture Press: Beijing, China, 2005. (In Chinese) [Google Scholar]
  18. Rouse J., W.; Haas, R.H.; Deering, D.W.; Schell, J.A.; Harlan, J.C. Monitoring the Vernal Advancement and Retrogradation (Green Wave Effect) of Natural Vegetation NASA/GSFC Type III Final Report; NASA: Greenbelt, MD, USA, 1974.
  19. Daughtry, C.; Gallo, K.; Goward, S.; Prince, S.; Kustas, W. Spectral estimates of absorbed radiation and phytomass production in corn and soybean canopies. Remote Sens. Environ. 1992, 39, 141–152. [Google Scholar] [CrossRef]
  20. Pearson, R.L.; Miller, L.D. Remote mapping of standing crop biomass for estimation of the productivity of the shortgrass prairie, Pawnee National Grasslands, Colorado. In Proceedings of the Eighth International Symposium on Remote Sensing of Environment, Ann Arbor, MI, USA, 2–6 October 1972. [Google Scholar]
  21. Huete, A.R. A soil-adjusted vegetation index (SAVI). Remote Sens. Environ. 1988, 25, 295–309. [Google Scholar] [CrossRef]
  22. Miura, T.; Huete, A.R.; Yoshioka, H. Evaluation of sensor calibration uncertainties on vegetation indices for MODIS. IEEE Trans. Geosci. Remote Sens. 2000, 38, 1399–1409. [Google Scholar] [CrossRef]
  23. Meyer, G.E.; Neto, J.C. Verification of color vegetation indices for automated crop imaging applications. Comput. Electron. Agric. 2008, 63, 282–293. [Google Scholar] [CrossRef]
  24. Daughtry, C.S.T.; Walthall, C.L.; Kim, M.S.; De Colstoun, E.B.; McMurtrey, J.E., III. Estimating corn leaf chlorophyll concentration from leaf and canopy reflectance. Remote Sens. Environ. 2000, 74, 229–239. [Google Scholar] [CrossRef]
  25. Chen, J.M.; Cihlar, J. Retrieving leaf area index of boreal conifer forests using Landsat TM images. Remote Sens. Environ. 1996, 55, 153–162. [Google Scholar] [CrossRef]
  26. Jin, Y.E.; Liu, C.S.; Zhang, W.Z. A Method of Calculating Surface Moisturefrom GMS and AVHRR. J. Appl. Meteorol. Sci. 1998, 9, 70–77. (In Chinese) [Google Scholar]
  27. Penuelas, J.; Baret, F.; Filella, I. Semi-empirical indices to assess carotenoids/chlorophyll a ratio from leaf spectral reflectance. Photosynthetica 1995, 31, 221–230. [Google Scholar]
  28. Merzlyak, M.N.; Gitelson, A.A.; Chivkunova, O.B.; Rakitin, V.Y. Non-destructive optical detection of pigment changes during leaf senescence and fruit ripening. Physiol. Plant. 1999, 106, 135–141. [Google Scholar] [CrossRef]
  29. Chen, B.B.; Li, P.; Li, Z.Y.; Xiao, H.B.; Dong, H.Q. Screening of Defoliant Formulas for Machine-Picked Cotton Fields in Southern Xinjiang. J. Tarim. Univ. 2017, 29, 64–69. (In Chinese) [Google Scholar]
  30. Gao, L.L.; Li, G.; Xu, X.X.; Zheng, H.; Zhang, J. Comparative Study on Defoliation Efficacy of Four Cotton Defoliants. J. Xinjiang Agric. Univ. 2016, 39, 35–39. (In Chinese) [Google Scholar]
  31. Zhuang, J.Y.; Bao, W.J.; Su, W.Z. Current Status and Prospects of Agricultural Remote Sensing Applications. Agric. Outlook 2024, 20, 68–74. (In Chinese) [Google Scholar]
  32. Cozzolino, D.; Fassio, A.; Gimenez, A. The use of near-infrared reflectance spectroscopy (NIRS) to predict the composition of whole maize plants. J. Sci. Food Agric. 2001, 81, 142–146. [Google Scholar] [CrossRef]
  33. Serrano, L.; Filella, I.; Peñuelas, J. Remote sensing of biomass and yield of winter wheat under different nitrogen supplies. Crop Sci. 2000, 40, 723–731. [Google Scholar] [CrossRef]
  34. Tewes, A.; Schellberg, J. Towards remote estimation of radiation use efficiency in maize using UAV-based low-cost camera imagery. Agronomy 2018, 8, 16. [Google Scholar] [CrossRef]
  35. Olson, D.; Anderson, J. Review on unmanned aerial vehicles, remote sensors, imagery processing, and their applications in agriculture. Agron. J. 2021, 113, 971–992. [Google Scholar] [CrossRef]
  36. Song, P.; Wang, J.; Guo, X.; Yang, W.; Zhao, C. High-throughput phenotyping: Breaking through the bottleneck in future crop breeding. Crop J. 2021, 9, 633–645. [Google Scholar] [CrossRef]
  37. Wang, Y.; Xiao, C.; Wang, Y.; Li, K.; Yu, K.; Geng, J.; Li, Q.; Yang, J.; Zhang, J.; Zhang, M.; et al. Monitoring of Cotton Boll Opening Rate Based on UAV Multispectral Data. Remote Sens. 2024, 16, 132. [Google Scholar] [CrossRef]
  38. Yi, Q.X. Estimation of Cotton Leaf Area Index Based on Sentinel-2 Multispectral Data. Trans. Chin. Soc. Agric. Eng. 2019, 35, 189–197, (In Chinese with English Abstract). [Google Scholar]
  39. Li, Y.B.; Mao, S.C.; Wang, X.H.; Han, Y.C.; Liu, W.; Wang, G.P.; Fan, Z.Y. Study on Digital Imaging Indices for Diagnosing Cotton Premature Senescence Severity. Cotton Sci. 2006, 160–163. (In Chinese) [Google Scholar]
Figure 1. Temperature change curve in Huyanghe City in September.
Agriculture 15 00965 g001
Figure 2. Flowchart of UAV Multispectral image acquisition.
Agriculture 15 00965 g002
Figure 3. Flowchart for extracting UAV multispectral image data.
Agriculture 15 00965 g003
Figure 4. Changes in defoliation rate and boll opening rate of cotton materials. T0, T1, T2, T3, T4, and T5 respectively indicate 0 days, 4 days, 8 days, 12 days, 16 days, and 20 days after spraying defoliant; ns indicates not significant, * represents p < 0.05; ** represents p < 0.01; *** represents p < 0.001; significance test method is two-tailed t-test. (a): changes in average defoliation rate in different time periods; (b): analysis of difference in defoliation rate in different time periods; (c): changes in average boll opening rate in different time periods; (d): analysis of difference in boll opening rate in different time periods.
Agriculture 15 00965 g004
Figure 5. Clustering diagram of defoliation rate. Category I refers to defoliation-sensitive germplasm resources, category II refers to moderately defoliation-sensitive germplasm resources, and category III refers to defoliation-insensitive germplasm resources. Clustering methods are hierarchical clustering.
Agriculture 15 00965 g005
Figure 6. Changes in multispectral of defoliant treatment and control in different time periods. (A): Shows the changing trend of the mean value of red light (red); (B): Shows the changing trend of the mean value of green light (green); (C): Shows the changing trend of the mean value of blue light (blue); (D): Shows the changing trend of the mean value of near-infrared (nir); (E): Shows the changing trend of the mean value of red edge (red_edge).
Agriculture 15 00965 g006
Figure 7. Correlation analysis between defoliation rate and multispectral bands/vegetation indices at 16 days after defoliant application. RD denotes defoliation rate; ns indicates no significant correlation; * indicates p < 0.05; ** indicates p < 0.01; *** indicates p < 0.001.
Agriculture 15 00965 g007
Figure 8. PSRI clustering diagram. Type I are the germplasm resources with excellent defoliation conditions, Type II are germplasm resources with average defoliation conditions, and Type III are germplasm resources with poor defoliation conditions. Clustering methods are hierarchical clustering.
Agriculture 15 00965 g008
Table 1. Names of 123 cotton breeding materials used for testing.
No.NameSourceNo.NameSourceNo.NameSourceNo.NameSourceNo.NameSource
YT001Liaomian 25The Yellow River BasinYT028Xinluzao 74Northwest InlandYT053Ari971AbroadYT078Simian 2The Yangtze River BasinYT103Source Cotton 8Northwest Inland
YT002Liaomian 35The Yellow River BasinYT029Xinluzao 75Northwest InlandYT054BP52AbroadYT079Simian 3The Yangtze River BasinYT104J206-5Northwest Inland
YT003Shengmian 6Other SourcesYT030Xinluzao 76Northwest InlandYT055Si-1470AbroadYT080Xinluzao 42Northwest
Inland
YT105Guanmian 678Self-bred Promotion
YT004Xinmian 3Northwest InlandYT031Xinluzao 78Northwest InlandYT056J02-247The Yangtze River BasinYT081Xinluzao 33Northwest
Inland
YT106Baijin 3045Self-bred Promotion
YT005Xinshi K18Northwest InlandYT032Xinluzao 79Northwest InlandYT057Z37lessAbroadYT082Xinluzao 23Northwest
Inland
YT107Guanmian 614Self-bred Promotion
YT006Xinshi K24Northwest InlandYT033Xinluzao 84Northwest InlandYT058Bamian 1The Yangtze River BasinYT083Xinluzao 10Northwest
Inland
YT108Kang 41Self-bred Promotion
YT007Chuangmian 512The Yellow River BasinYT034Xinluzhong 38Northwest InlandYT059ChangkangmianThe Yangtze River BasinYT084Xinluzao 8Northwest
Inland
YT109Feng HaimianSelf-bred Promotion
YT008Longmian 10Northwest InlandYT035Xinluzhong 50Northwest InlandYT060Chuan 169-6The Yangtze River BasinYT085Tu 83-161Northwest
Inland
YT110Fengze 7Self-bred Promotion
YT009Jinken 1441Northwest InlandYT036Mutant1Self-bred MaterialsYT061Jingzhou Degenerated CottonThe Yangtze River BasinYT086Xinluzao 47Northwest
Inland
YT111Huimin 52Self-bred Promotion
YT010Jinken 1565Northwest InlandYT037Mutant2Self-bred MaterialsYT062Jing 55173The Yellow River BasinYT087Xinluzao 48Northwest
Inland
YT112Huimin 4Self-bred Promotion
YT011Jinken 1643Northwest InlandYT038Mutant3Self-bred MaterialsYT063Jinmian 36The Yellow River BasinYT088Xinluzao 49Northwest
Inland
YT113Guanmian V5Self-bred Promotion
YT012Jiumian NE01Other SourcesYT039Mutant4Self-bred MaterialsYT064Jinzimian KingAbroadYT089Xinluzao 52Northwest
Inland
YT114Genesis 8Self-bred Promotion
YT013W8225The Yellow River BasinYT040Mutant5Self-bred MaterialsYT065Jiangsu Cotton 1The Yangtze River BasinYT090Xinluzao 61Northwest
Inland
YT115Hexin Seed Industry 14Self-bred Promotion
YT014Xinniumian 206Other SourcesYT041Mutant6Self-bred MaterialsYT066Jimian 8The Yellow River BasinYT091Xinluzhong 6Northwest
Inland
YT116Guanmian 648Self-bred Promotion
YT015Zhongmiansuo 115The Yellow River BasinYT042Mutant7Self-bred MaterialsYT067Jijiaohongye MianAbroadYT092Xinluzhong 14Northwest
Inland
YT117Genesis 5Self-bred Promotion
YT016Xinluzao 27Northwest InlandYT043Mutant8Self-bred MaterialsYT068Han 241The Yellow River BasinYT093Xinluzhong 36Northwest
Inland
YT118Zhongya Huijin 6Self-bred Promotion
YT017Xinluzao 50Northwest InlandYT044Mutant9Self-bred MaterialsYT069Ganmian 12The Yangtze River BasinYT094Xinluzhong 41Northwest
Inland
YT119Fengdekang 4Self-bred Promotion
YT018Xinluzao 51Northwest InlandYT045Mutant10Self-bred MaterialsYT070Ferganskaya 175AbroadYT095Xinluzhong 54Northwest
Inland
YT120Genesis 7Self-bred Promotion
YT019Xinluzao 54Northwest InlandYT046R22-46Self-bred MaterialsYT071Miaohua in Judian Township, Lijiang County, YunnanThe Yangtze River BasinYT096Zhongmiansuo 17The Yellow River BasinYT121Genesis 8Self-bred Promotion
YT020Xinluzao 55Northwest InlandYT047Xinluzao 11Northwest InlandYT072DaihongdaiThe Yangtze River BasinYT097Zhongmiansuo 12The Yellow River BasinYT122Genesis 3Self-bred Promotion
YT021Xinluzao 57Northwest InlandYT048Zhongmian Institute 43The Yellow River BasinYT073Kuche 96515Northwest InlandYT098Zhong 203016The Yellow River BasinYT123Xiangsui Seed Industry 2Self-bred Promotion
YT022Xinluzao 60Northwest InlandYT04970-1437The Yangtze River BasinYT074Liaomian 9The Yellow River BasinYT099Yuan 247-31The Yellow River BasinYT124Jike Huayu 1Self-bred Promotion
YT024Xinluzao 64Northwest InlandYT05073-184The Yellow River BasinYT075Zhongmiansuo 23The Yellow River BasinYT100Yumian 1The Yellow River BasinYT125Xinluzao 73Northwest Inland
YT025Xinluzao 68Northwest InlandYT051AC321AbroadYT076Shaan 416The Yellow River BasinYT101Xinluzhong 68Northwest
Inland
YT026Xinluzao 69Northwest InlandYT052Ari3697The Yellow River BasinYT077Shen 547The Yangtze River BasinYT102Xinluzhong 75Northwest
Inland
Table 2. Multispectral Camera Band Parameters.
BandCentral Wavelength (nm)Bandwidth (nm)
blue45016
green56016
red65016
red_edge73016
nir84026
Table 3. Summary of vegetation indices.
No.Vegetation IndexAbbreviationFormulaSource
1Normalized Difference Vegetation IndexNDVI n i r r e d / n i r r e d [18]
2Normalized Green Difference Vegetation IndexGNDVI n i r g r e e n / n i r + g r e e n [19]
3Transformed Vegetation IndexTVI N D V I + 0.5 [18]
4Ratio Vegetation IndexRVI n i r / r e d [20]
5Soil-Adjusted Vegetation IndexSAVI n i r r e d × 1 + L / n i r + r e d + L [21]
6Enhanced Vegetation IndexEVI 2.5 × n i r r e d [22]
7Excess Green Minus RedEXGR 2 × g r e e n 2.4 × r e d [23]
8Modified Chlorophyll Absorption Reflectance IndexMCARI red_edge r e d 0.2 × red_edge g r e e n × red_edge / r e d [24]
9Modified second ratio indexMSRI n i r / r e d 1 / n i r / r e d + 1 [25]
10Moisture Vegetation IndexMVI n i r r e d / n i r + r e d + 0.5 [26]
11Structure Independent Pigment IndexSIPI n i r b l u e / n i r r e d [27]
12Plant Senescence Reflectance IndexPSRI r e d b l u e / n i r [28]
Table 4. Descriptive statistics of agronomic traits of germplasm resources.
TraitsAverageStandard DeviationMinMaxCoefficient of Variation (%)
Plant height (cm)87.309.6459.20120.8011.04
Height of the first fruiting branch (cm)20.414.705.8038.0023.00
Number of fruiting branches10.171.195.8013.7511.66
Number of effective fruiting branches6.581.153.6012.0017.47
Number of bolls per plant8.19 1.654.8014.2020.16
Table 5. Defoliant-sensitive germplasm resources.
No.Material NameDefoliation Rate (%)Lint Percentage (%)No.Material NameDefoliation Rate (%)Lint Percentage (%)
YT015Zhongmiansuo 11584.76 89.29 YT092Xinluzhong 1489.36 61.84
YT031Xinluzao 7890.59 86.60 YT093Xinluzhong 3688.32 88.31
YT033Xinluzao 8487.35 88.24 YT099Yuan 247-3192.57 94.20
YT039Mutant 488.03 78.48 YT100Yumian 190.48 84.88
YT047Xinluzao 1187.41 91.43 YT101Xinluzhong 6892.15 87.04
YT061Jingzhou Degenerated Cotton84.80 90.00 YT102Xinluzhong 7586.52 88.00
YT065Jiangsu Cotton 188.10 75.29 YT104J206-588.56 91.86
YT066Jimian 884.82 95.35 YT107Guomian 61488.31 94.20
YT068Han 24185.81 86.32 YT109Fenghaimian87.91 86.25
YT069Ganmian 1284.92 81.36 YT112Huimin 492.82 96.59
YT072Daihongdai89.17 77.17 YT113Guamian V590.97 88.06
YT074Liaomian 985.95 97.08 YT114Genesis 889.47 96.15
YT075Zhongmiansuo 2385.16 80.85 YT115Hexin Seed Industry 1493.08 93.42
YT076Shan 41687.43 76.67 YT116Guanmian 64884.95 95.51
YT078Simian 295.12 82.72 YT118Zhongya Huijin 693.05 97.89
YT082Xinluzao 2385.28 91.57 YT119Fengdekang 488.11 100.00
YT083Xinluzao 1093.43 93.24 YT122Genesis 389.73 90.65
YT087Xinluzao 4892.67 81.91 YT125Xinluzao 7394.23 98.04
YT091Xinluzhong 687.57 89.81
Table 6. PSRI screening of germplasm resources sensitive to defoliants.
No.Material NameDefoliation Rate (%)Lint Percentage (%)PSRINo.Material NameDefoliation Rate (%)Lint Percentage (%)PSRI
YT006New Stone K2475.3484.540.1696YT085Tu 83-16172.4992.310.1640
YT039Mutant488.0378.480.1795YT099Yuan 247-3192.5794.200.1819
YT040Mutant583.2373.420.1628YT100Yumian 190.4884.880.1852
YT044Mutant978.3470.830.1662YT101Xinluzhong 6892.1587.040.1723
YT045Mutant1079.5158.460.1738YT102Xinluzhong 7586.5288.000.1733
YT047Xinluzao 1187.4191.430.1720YT104J206-588.5691.860.1756
YT058Bamian 175.7695.100.1632YT107Guanmian 61488.3194.200.1607
YT068Han 24185.8186.320.1690YT110Fengze 782.4696.150.1650
YT074Liaomian 985.9597.080.1984YT111Huimin 5279.3798.570.1700
YT076Shan 41687.4376.670.1859YT113Guanmian V590.9788.060.1694
YT078Simian 295.1282.720.1649YT123Xiangsui Seed Industry 283.6295.890.1697
YT083Xinluzao 1093.4393.240.1852YT125Xinluzao 7394.2398.040.1609
Table 7. Defoliation-sensitive materials jointly screened by defoliation rate and PSRI.
No.Material NameDefoliation Rate (%)Lint Percentage (%)PSRINo.Material NameDefoliation Rate (%)Lint Percentage (%)PSRI
YT039Mutant488.0378.480.1795YT100Yumian 190.4884.880.1852
YT047Xinluzao 1187.4191.430.1720YT101Xinluzhong 6892.1587.040.1723
YT068Han 24185.8186.320.1690YT102Xinluzhong 7586.5288.000.1733
YT074Liaomian 985.9597.080.1984YT104J206-588.5691.860.1756
YT076Shaan 41687.4376.670.1859YT107Guanmian 61488.3194.200.1607
YT078Simian 295.1282.720.1649YT113Guanmian V590.9788.060.1694
YT083Xinluzao 1093.4393.240.1852YT125Xinluzao 7394.2398.040.1609
YT099Yuan 247-3192.5794.200.1819
Disclaimer/Publisher’s Note: The statements, opinions and data contained in all publications are solely those of the individual author(s) and contributor(s) and not of MDPI and/or the editor(s). MDPI and/or the editor(s) disclaim responsibility for any injury to people or property resulting from any ideas, methods, instructions or products referred to in the content.

