

Ventilation Fans Offset Potential Reductions in Milk Margin from Heat Stress in Wisconsin Dairy Farms


Abstract
1. Introduction
2. Materials and Methods
2.1. Historical Weather Data
2.2. Income over Feed Cost
2.3. Estimate Ventilation Fan Electricity Costs
3. Results
3.1. Heat Stress Days in Madison, WI
3.2. Milk Margin Reduction
3.3. Ventilation Fan Electricity Costs
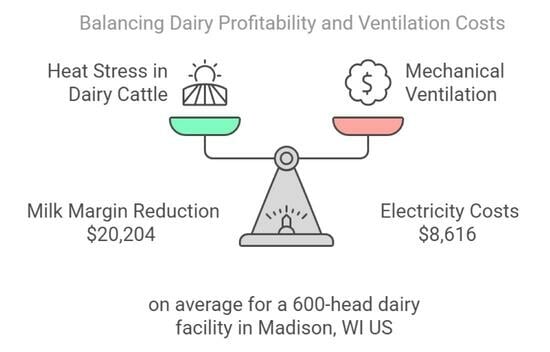
3.4. Comparison of Margin Reductions to Electricity Costs
4. Discussion
5. Conclusions
Author Contributions
Funding
Institutional Review Board Statement
Data Availability Statement
Acknowledgments
Conflicts of Interest
Abbreviations
| BESS | Bioenvironmental and Structural Systems |
| CFM | Cubic feet per minute |
| CWT | Hundredweight |
| DMC | Dairy margin coverage |
| THI | Temperature humidity index |
References
- Antanaitis, R.; Džermeikaitė, K.; Krištolaitytė, J.; Ribelytė, I.; Bespalovaitė, A.; Bulvičiūtė, D.; Tolkačiovaitė, K.; Baumgartner, W. Impact of Heat Stress on the In-Line Registered Milk Fat-to-Protein Ratio and Metabolic Profile in Dairy Cows. Agriculture 2024, 14, 203. [Google Scholar] [CrossRef]
- Țogoe, D.; Mincă, N.A. The Impact of Heat Stress on the Physiological, Productive, and Reproductive Status of Dairy Cows. Agriculture 2024, 14, 1241. [Google Scholar] [CrossRef]
- Cortus, E.; Janni, K.A.; Salfer, J.; Carroll, H.; Erickson, T.; Paulson, J.; Pohl, S. Evaluating Energy Use and Conservation on Dairies in the Northern Great Plains—Outreach Efforts and Needs for Periods of Heat Stress. In Proceedings of the ASABE Annual International Meeting, New Orleans, LA, USA, 26–29 July 2015; p. 152188605. [Google Scholar]
- Jiang, L.; Yi, Y.; Akdeniz, N. CFD simulations of supplemental cooling techniques in cross-ventilated dairy buildings and associated greenhouse gas emissions. Comp. Electron. Agric. 2024, 216, 108480. [Google Scholar] [CrossRef]
- Jiang, L.; Yi, Y.; Akdeniz, N. Energy-saving cooling strategies in tunnel-ventilated dairy buildings: Computational fluid dynamics (CFD) simulations and validation. Smart Agric. Technol. 2024, 9, 100576. [Google Scholar] [CrossRef]
- Cerrato, M.; Iasi, A.; Di Bennardo, F.; Pergola, M. Evaluation of the Economic and Environmental Sustainability of Livestock Farms in Inland Areas. Agriculture 2023, 13, 1708. [Google Scholar] [CrossRef]
- Yan, G.; Shi, Z.; Li, H. Critical Temperature-Humidity Index Thresholds Based on Surface Temperature for Lactating Dairy Cows in a Temperate Climate. Agriculture 2021, 11, 970. [Google Scholar] [CrossRef]
- Armstrong, J.; Janni, K.A. Heat Stress in Dairy Cattle. Available online: https://extension.umn.edu/dairy-milking-cows/heat-stress-dairy-cattle (accessed on 17 February 2025).
- Smith, R. Heat Stress: Getting Prepared. Available online: https://agriculture.vic.gov.au/about/media-centre/media-releases/2024-releases/heat-stress-getting-prepared (accessed on 17 February 2025).
- Berman, A. Estimates of heat stress relief needs for Holstein dairy cows. J. Anim. Sci. 2005, 83, 1377–1384. [Google Scholar] [CrossRef] [PubMed]
- Mondaca, M.R.; Cook, N.B. Modeled construction and operating costs of different ventilation systems for lactating dairy cows. J. Dairy Sci. 2019, 102, 896–908. [Google Scholar] [CrossRef] [PubMed]
- J&D-Manufacturing. Let Your Barn Breathe. Available online: https://jdmfg.com/applications/dairy/ (accessed on 20 February 2025).
- Underground-Weather-History. Underground Weather History for Madison, WI. Available online: https://www.wunderground.com/history/monthly/us/wi/madison/KMSN/ (accessed on 20 February 2025).
- Chen, L.; Thorup, V.M.; Kudahl, A.B.; Ostergaard, S. Effects of heat stress on feed intake, milk yield, milk composition, and feed efficiency in dairy cows: A meta-analysis. J. Dairy Sci. 2024, 107, 3207–3218. [Google Scholar] [CrossRef]
- NRC. A Guide to Environmental Research on Animals; National Academy of Sciences: Washington, DC, USA, 1971. [Google Scholar]
- FSA-USDA. Dairy Margin Coverage (DMC) Program Updates and Prices. Available online: https://www.fsa.usda.gov/resources/programs/dairy-margin-coverage-program-dmc/prices-updates (accessed on 20 February 2025).
- ERS-USDA. Milk Cost of Production Estimates. Available online: https://www.ers.usda.gov/data-products/milk-cost-of-production-estimates (accessed on 20 February 2025).
- NASS-USDA. Milk Production Per Cow, Wisconsin. Available online: https://www.nass.usda.gov/Statistics_by_State/Wisconsin/Publications/Dairy/Historical_Data_Series/mkpercow.pdf (accessed on 21 February 2025).
- Akdeniz, N.; McCarville, J.; Schlesser, H.; Seefeldt, L.; Sterry, R. Ventilation in Dairy Buildings. Available online: https://dairy.extension.wisc.edu/articles/ventilation-in-dairy-buildings/ (accessed on 21 February 2025).
- Dairyland-Inititiative. Heat Abatement and Ventilation of Adult Cow Facilities. Available online: https://thedairylandinitiative.vetmed.wisc.edu/home/housing-module/adult-cow-housing/ventilation-and-heat-abatement/ (accessed on 20 February 2025).
- BESS-Lab. Agricultural Ventilation Fans, BioEnvironmental and Structural Systems Laboratory. Available online: http://bess.illinois.edu/pdf/12792.pdf (accessed on 23 February 2025).
- EIA-US. Electric Sales, Revenue, and Average Price, Commercial Average Monthly Bill by Census Division, and State. Available online: https://www.eia.gov/electricity/sales_revenue_price/ (accessed on 20 February 2025).
- Wolf, C.A.; Karszes, J. Financial risk and resiliency on US dairy farms: Measures, thresholds, and management implications. J. Dairy Sci. 2023, 106, 3301–3311. [Google Scholar] [CrossRef] [PubMed]

| THI | Heat Stress Levels | Effects on Cows | Months | Days Recorded in Madison, WI | ||||
|---|---|---|---|---|---|---|---|---|
| 2020 | 2021 | 2022 | 2023 | 2024 | ||||
| <68 | No heat stress | Normal behavior, no impact on feed intake | May | 28 | 25 | 23 | 29 | 30 |
| June | 14 | 8 | 16 | 15 | 13 | |||
| July | 1 | 12 | 7 | 8 | 8 | |||
| August | 13 | 9 | 11 | 13 | 12 | |||
| September | 29 | 26 | 21 | 23 | 23 | |||
| Total | 85 | 80 | 78 | 88 | 86 | |||
| 68–72 | Mild heat stress | Slight decrease in milk production | May | 1 | 6 | 3 | 2 | 1 |
| June | 13 | 15 | 8 | 13 | 13 | |||
| July | 14 | 10 | 14 | 14 | 18 | |||
| August | 9 | 11 | 16 | 12 | 11 | |||
| September | 1 | 4 | 8 | 4 | 7 | |||
| Total | 38 | 46 | 49 | 45 | 50 | |||
| 72–78 | Moderate heat stress | Noticeable drop in milk production | May | 2 | 0 | 5 | 0 | 0 |
| June | 3 | 7 | 6 | 2 | 4 | |||
| July | 16 | 9 | 10 | 9 | 5 | |||
| August | 9 | 11 | 4 | 4 | 6 | |||
| September | 0 | 0 | 1 | 3 | 0 | |||
| Total | 30 | 27 | 26 | 18 | 15 | |||
| >78 | Severe heat stress | Significant drop in milk yield | May | 0 | 0 | 0 | 0 | 0 |
| June | 0 | 0 | 0 | 0 | 0 | |||
| July | 0 | 0 | 0 | 0 | 0 | |||
| August | 0 | 0 | 0 | 2 | 2 | |||
| September | 0 | 0 | 0 | 0 | 0 | |||
| Total | 0 | 0 | 0 | 2 | 2 | |||
| Year | Month | All Milk Price (USD/cwt) | Final Feed Costs for DMC (USD/cwt) | Income Over Feed Costs (USD/cwt) | Adjusted Milk Margin for Wisconsin (USD/cwt) | Wisconsin Milk Production (lbs per Cow per Day) | Milk Margin (USD per Cow per Day) | Estimated Economic Losses (USD per Cow) |
|---|---|---|---|---|---|---|---|---|
| 2024 | May | 22.0 | 11.48 | 10.52 | 11.26 | 74.0 | 8.33 | 0.42 |
| June | 22.8 | 11.14 | 11.66 | 12.48 | 70.7 | 8.82 | 9.26 | |
| July | 22.8 | 10.47 | 12.33 | 13.19 | 69.8 | 9.21 | 12.89 | |
| August | 23.6 | 9.88 | 13.72 | 14.68 | 69.0 | 10.13 | 14.69 | |
| September | 25.5 | 9.93 | 15.57 | 16.66 | 69.2 | 11.53 | 4.04 | |
| 2023 | May | 19.3 | 14.47 | 4.83 | 5.17 | 72.8 | 3.76 | 0.38 |
| June | 17.9 | 14.25 | 3.65 | 3.91 | 71.0 | 2.77 | 2.36 | |
| July | 17.4 | 13.88 | 3.52 | 3.77 | 70.3 | 2.65 | 4.24 | |
| August | 19.7 | 13.24 | 6.46 | 6.91 | 69.5 | 4.80 | 6.25 | |
| September | 21.0 | 12.56 | 8.44 | 9.03 | 69.2 | 6.25 | 3.12 | |
| 2022 | May | 27.3 | 14.79 | 12.51 | 13.64 | 72.0 | 9.82 | 6.38 |
| June | 26.9 | 14.98 | 11.92 | 12.99 | 70.0 | 9.09 | 9.09 | |
| July | 25.7 | 15.78 | 9.92 | 10.81 | 69.4 | 7.50 | 12.76 | |
| August | 24.3 | 16.22 | 8.08 | 8.81 | 69.2 | 6.09 | 7.31 | |
| September | 24.4 | 15.78 | 8.62 | 9.40 | 68.7 | 6.45 | 3.23 | |
| 2021 | May | 19.2 | 12.53 | 6.67 | 8.27 | 71.5 | 5.91 | 1.77 |
| June | 18.4 | 12.37 | 6.03 | 7.48 | 69.0 | 5.16 | 7.48 | |
| July | 17.9 | 12.43 | 5.47 | 6.78 | 68.9 | 4.67 | 6.54 | |
| August | 17.7 | 12.67 | 5.03 | 6.24 | 68.1 | 4.25 | 7.01 | |
| September | 18.4 | 11.71 | 6.69 | 8.30 | 67.8 | 5.62 | 1.12 | |
| 2020 | May | 13.6 | 8.44 | 5.16 | 6.86 | 68.7 | 4.71 | 1.18 |
| June | 18.1 | 8.27 | 9.83 | 13.07 | 68.0 | 8.89 | 8.45 | |
| July | 20.5 | 8.21 | 12.29 | 16.35 | 66.8 | 10.92 | 25.11 | |
| August | 18.8 | 8.11 | 10.69 | 14.22 | 67.1 | 9.54 | 12.88 | |
| September | 17.9 | 8.64 | 9.26 | 12.32 | 66.8 | 8.23 | 0.41 |
| Year | Month | Number of Days Ambient T Above 20 °C | Electricity Rates in WI (USD/kWh) | Estimated Electricity Costs (USD per Cow) | |
|---|---|---|---|---|---|
| @18.9 cfm/Watt | @16.0 cfm/Watt | ||||
| 2024 | May | 2 | USD 0.1285 | 0.33 | 0.39 |
| June | 19 | 3.10 | 3.66 | ||
| July | 26 | 4.24 | 5.01 | ||
| August | 22 | 3.59 | 4.24 | ||
| September | 11 | 1.79 | 2.12 | ||
| 2023 | May | 4 | USD 0.1276 | 0.65 | 0.77 |
| June | 21 | 3.40 | 4.02 | ||
| July | 26 | 4.21 | 4.98 | ||
| August | 19 | 3.08 | 3.64 | ||
| September | 10 | 1.62 | 1.91 | ||
| 2022 | May | 8 | USD 0.1185 | 1.20 | 1.42 |
| June | 16 | 2.41 | 2.84 | ||
| July | 28 | 4.21 | 4.98 | ||
| August | 16 | 2.41 | 2.84 | ||
| September | 11 | 1.66 | 1.96 | ||
| 2021 | May | 8 | USD 0.1095 | 1.11 | 1.31 |
| June | 24 | 3.34 | 3.94 | ||
| July | 24 | 3.34 | 3.94 | ||
| August | 25 | 3.48 | 4.11 | ||
| September | 6 | 0.83 | 0.99 | ||
| 2020 | May | 4 | USD 0.1075 | 0.55 | 0.65 |
| June | 20 | 2.73 | 3.23 | ||
| July | 30 | 4.10 | 4.84 | ||
| August | 23 | 3.14 | 3.71 | ||
| September | 2 | 0.27 | 0.32 | ||
| Months | Estimated Milk Margin Reduction for a 600-Head Farm (USD) | ||||
|---|---|---|---|---|---|
| 2020 | 2021 | 2022 | 2023 | 2024 | |
| May | 707 | 1064 | 3829 | 226 | 250 |
| June | 5067 | 4489 | 5457 | 1414 | 5557 |
| July | 15,068 | 3926 | 7654 | 2542 | 7735 |
| August | 7727 | 4205 | 4388 | 3747 | 8813 |
| September | 247 | 675 | 1936 | 1875 | 2421 |
| Total | 24,776 | 9804 | 23,265 | 14,359 | 28,817 |
| Months | Estimated Fan Electricity Costs for a 600-Head Farm (USD) | ||||
| 2020 | 2021 | 2022 | 2023 | 2024 | |
| May | 387 | 788 | 853 | 459 | 231 |
| June | 1935 | 2365 | 1706 | 2412 | 2197 |
| July | 2903 | 2365 | 2986 | 2986 | 3007 |
| August | 2225 | 2464 | 1706 | 2182 | 2544 |
| September | 194 | 591 | 1173 | 1148 | 1272 |
| Total | 7643 | 8574 | 8425 | 9187 | 9252 |
Disclaimer/Publisher’s Note: The statements, opinions and data contained in all publications are solely those of the individual author(s) and contributor(s) and not of MDPI and/or the editor(s). MDPI and/or the editor(s) disclaim responsibility for any injury to people or property resulting from any ideas, methods, instructions or products referred to in the content. |
© 2025 by the authors. Licensee MDPI, Basel, Switzerland. This article is an open access article distributed under the terms and conditions of the Creative Commons Attribution (CC BY) license (https://creativecommons.org/licenses/by/4.0/).
Share and Cite
Akdeniz, N.; Polzin, L. Ventilation Fans Offset Potential Reductions in Milk Margin from Heat Stress in Wisconsin Dairy Farms. Agriculture 2025, 15, 955. https://doi.org/10.3390/agriculture15090955
Akdeniz N, Polzin L. Ventilation Fans Offset Potential Reductions in Milk Margin from Heat Stress in Wisconsin Dairy Farms. Agriculture. 2025; 15(9):955. https://doi.org/10.3390/agriculture15090955
Chicago/Turabian StyleAkdeniz, Neslihan, and Leonard Polzin. 2025. "Ventilation Fans Offset Potential Reductions in Milk Margin from Heat Stress in Wisconsin Dairy Farms" Agriculture 15, no. 9: 955. https://doi.org/10.3390/agriculture15090955
APA StyleAkdeniz, N., & Polzin, L. (2025). Ventilation Fans Offset Potential Reductions in Milk Margin from Heat Stress in Wisconsin Dairy Farms. Agriculture, 15(9), 955. https://doi.org/10.3390/agriculture15090955