Article

The Role of Agricultural Socialized Services in Unlocking Agricultural Productivity in China: A Spatial and Threshold Analysis

1
School of Economics, Shandong Women’s University, Jinan 250300, China
2
College of Economics, Guangxi Minzu University, Nanning 530006, China
3
School of Economics, Shandong University of Finance and Economics, Jinan 250014, China
*
Author to whom correspondence should be addressed.
Agriculture 2025, 15(9), 957; https://doi.org/10.3390/agriculture15090957 (registering DOI)
Submission received: 16 March 2025 / Revised: 14 April 2025 / Accepted: 24 April 2025 / Published: 28 April 2025

Abstract

:
Amid global economic transformation, a persistent productivity gap exists between developed and developing nations in agriculture sector, shaped by technological advancements and shifting resource allocation patterns. Agricultural socialized services (ASS), defined as organized systems providing technical support, mechanization assistance, information services, market linkages, and resource optimization to farmers, have emerged as critical mechanisms for agricultural development. In developing economies, these services catalyze gains in agricultural labor productivity through the integration of advanced technologies and the mechanization of farming practices. Using panel data from 30 Chinese provinces during 2011 to 2022, this study investigates the relationship between ASS and ALP, focusing on regional heterogeneity, threshold effects, and spatial spillovers. The combination of spatial econometric methods and threshold analysis was selected for its unique capacity to capture both the geographic interdependencies and nonlinear relationships that characterize agricultural development processes. These thresholds at 5.254 and 8.478 represent critical points where the impact of ASS on ALP significantly changes in magnitude, revealing a nonlinear relationship that evolves across different stages of agricultural development. The study highlights notable regional disparities in the impact of ASS. Specifically, ASS is more effective on ALP in eastern, central and key food-producing regions, while its impact is relatively weak in western and non-food-producing regions. Spatial spillover analysis indicates that advancements in ASS create positive externalities, extending beyond their immediate implementation zones and facilitating inter-provincial agricultural cooperation and development. These findings provide crucial guidance for policymakers and agricultural service providers to optimize resource allocation and service delivery strategies. By identifying critical development thresholds and regional variations, this research offers evidence-based support for government officials designing targeted agricultural policies and enterprises developing region-specific service models to foster sustainable agricultural growth across diverse regional landscapes.

1. Introduction

1.1. Background

The global agricultural sector is undergoing unprecedented transformation, driven by technological advancements, altered resource allocation, and socioeconomic shifts. This evolution is shaping a new agricultural development model. However, a productivity gap persists between developed and developing countries, with average agricultural labor productivity in developing nations being significantly lower [1]. As global food demand is projected to rise by 70% by 2050, this imbalance poses severe challenges to food security and the global food supply system. Improving agricultural labor productivity and ensuring food security are key to addressing the challenges brought by the transformation of global agricultural development and the increase in market demand. The enhancement of agricultural productivity is pivotal to the development of modern agriculture, however, at the present stage, the conflict between small-scale farmers and the centralized production model has led to a decline in agricultural productivity and exacerbated rural inequality [2]. This tension is particularly acute in regions characterized by fragmented landholdings, where economies of scale are difficult to achieve and technological adoption remains limited [3]. Research indicates that transformative approaches emphasizing sustainable intensification, agricultural diversification, and inclusive development are essential for achieving sustainable agricultural growth [4]. These approaches must balance productivity gains with environmental sustainability and social equity considerations to create resilient agricultural systems [5]. As an intensive and efficient way of agricultural production and service provision, agricultural socialized services have great potential to effectively boost agricultural productivity and promote sustainable agricultural development.
In the context of modern agricultural development, Agricultural socialized services (ASS) have emerged as a critical mechanism for enhancing agricultural labor productivity (ALP). By creating a comprehensive support system that encompasses technological assistance, equipment sharing, market linkages, and resource optimization [6], ASS can effectively reduce operational costs, enhance resource utilization efficiency, facilitate technology dissemination, and tackle environmental problems, thus advancing sustainable agricultural practices [7]. These integrated services not only contribute to narrowing the productivity gap between small-scale and commercial farming, but also strengthen agricultural resilience, while simultaneously improving labor efficiency, increasing crop yields, and raising farmers’ incomes. As demonstrated by Lowder et al. [8], regions with well-established ASS networks have experienced up to 40% higher ALP compared to areas with limited service access. Nevertheless, challenges such as information asymmetry, limited financing, infrastructural inadequacies, and slow technology diffusion continue to impede the widespread implementation of ASS [9]. Therefore, research on how ASS can effectively strengthen agricultural productivity through context-specific implementation strategies is vital for promoting sustainable agricultural development and achieving broader rural revitalization goals.
Since the 1970s, agricultural socialized services has grown from simple tech help to a full platform that combines advanced technologies, shared knowledge, and resource management [10], offering key support for boosting farm productivity. In China, ASS has had a big impact, with over 950,000 service providers managing 1.133 billion hectares of farmland and supporting more than 780 million smallholder farmers by 2021 [11]. This shows ASS’s key role in helping small farmers grow, stabilizing farming, and aiding rural development, as well as its potential to improve ALP. Empirical studies further emphasize the indispensable role of agricultural extension services, a core component of ASS, in rural development by promoting technology adoption, improving production efficiency, and significantly raising agricultural labor productivity [12,13]. Moreover, the incorporation of digital technologies has revitalized ASS by enabling scientific decision-making through real-time weather, market, and agricultural data analysis, further improving production efficiency. Addressing existing challenges remains paramount to fully realizing the potential of ASS. Particularly within the framework of spatial econometric and threshold analyzes, this approach will furnish essential insights for more precise and effective policy formulation, ultimately aimed at comprehensively improving agricultural productivity.

1.2. Objective

Existing research suggests that agricultural labor productivity development frequently encounters diminishing returns and threshold effects [14]. In this study, “threshold effect” refers to critical productivity values where the relationship between agricultural socialized services and labor productivity undergoes significant change, indicating different developmental stages with varying responses to service interventions. Accurate identification of these turning points is pivotal for enhancing ALP and optimizing policies [15]. Within the context of technology adoption, agricultural socialized services are anticipated to boost labor productivity by achieving economies of scale, lowering transaction costs, and fostering advanced agricultural practices. When the critical threshold is reached, ASS’s productivity gains are particularly evident, especially in areas transitioning from traditional to mechanized agriculture. However, while spatial distribution and agglomeration economies significantly impact ALP, their relationship with ASS remains unclear, hindering sustainable agricultural development.
This study explores the spatial impact of ASS and its nonlinear relationship with labor productivity, focusing on threshold effects. The objectives are to: (1) analyze how ASS improves labor productivity through scale expansion, cost reduction, and technology diffusion; (2) provide empirical evidence for spatial heterogeneity and threshold effects in the ASS-productivity relationship; and (3) apply spatial econometric models to detect spillover effects.
Using panel data from 30 Chinese provinces (2011–2022), this empirical case study investigates how ASS enhances ALP and promotes sustainable development, informing targeted policies. Understanding the spatial dynamics and impact thresholds of these services helps allocate resources efficiently, improve production efficiency, narrow regional productivity gaps, and foster balanced agricultural growth.
The remainder of this paper is organized as follows: Section 2 presents the literature review and theoretical framework; Section 3 describes the research design and methodology; Section 4 presents the empirical results and analysis; Section 5 discusses the findings and concludes with policy implications and recommendations.

2. Literature Review

2.1. Review of Agricultural Socialized Services

Agricultural socialized services refer to the full-spectrum services provided by service organizations and individuals to agricultural producers and operators throughout the entire agricultural production process, including the supply of agricultural inputs, technical services, financial services, and production operations, as well as the processing, transportation, packaging, and marketing of agricultural products [16]. Agricultural socialized services systematically integrate resources and information, thereby enhancing farming productivity. This, in turn, promotes sustainable agricultural development, boosts rural economic competitiveness, and contributes to comprehensive community revitalization. Poulton et al. [17] classify these services into five primary categories: technology extension, market intelligence, input supply, financial support, and infrastructure development. From an institutional economics and technology adoption perspective, ASS play a pivotal role in minimizing transaction costs, optimizing resource allocation, and facilitating the adoption of new technologies. In developing regions, ASS address structural challenges, modernize agricultural practices, and significantly improve rural well-being. ASS also enable smallholder farmers to integrate efficiently into the agricultural value chain, thereby driving rural economic development. Moreover, the synergy between cooperatives and technological innovation further enhances the productivity of ASS. The cooperative model takes advantage of economies of scale, streamlines the commercialization process, and reduces the barriers faced by smallholder farmers [18,19,20].
The conceptualization and implementation of agricultural socialized services differ across global contexts. In the United States, agricultural extension services have evolved from a traditional transfer-of-technology model to a more participatory approach focused on sustainable farming systems, as documented by Baumgart-Getz et al. [21]. The European model, particularly prevalent in countries like the Netherlands and Denmark, emphasizes public-private partnerships in service delivery, with Klerkx and Leeuwis [22] highlighting how these collaborative approaches have significantly enhanced farm innovation and productivity. In developing economies, particularly in Africa, Wossen et al. [23] have demonstrated how mobile-based agricultural services have transformed smallholder farming by providing critical market information and technical advice, substantially improving agricultural productivity and household welfare.
The rapid spread of digital technologies, especially mobile platforms, has transformed the delivery of ASS. These technologies break down information barriers, expand market access, and promote financial inclusion [24]. The integration of cooperatives with digital technologies generates powerful synergies, making cooperatives function as central hubs for modern agricultural practices and market coordination. This technological transformation is particularly significant in regions with dispersed agricultural populations, where traditional extension methods have proven costly and inefficient [25]. Furthermore, the evolution of ASS increasingly incorporates sustainable and climate-resilient approaches to agricultural development. This integration is crucial as climate change poses significant threats to agricultural productivity and rural livelihoods [26].
In China, agricultural socialized services have undergone significant evolution in response to government policies aimed at agricultural modernization. The government has gradually introduced a series of policy measures to support the development of effective agricultural services, which has affirmed the critical role of effective agricultural services in the development of modern agriculture [27], further improved and enriched the connotation of productive agricultural services [28], and provided necessary policy support and the basis for the development of effective agricultural services [29]. The digital services, as highlighted by Wang et al. [30], have been particularly effective in bridging information asymmetries and enhancing the efficiency of resource allocation in rural areas.

2.2. Agricultural Labor Productivity: Drivers and Development Impacts

Agricultural labor productivity serves as the foundation for rural economic vitality and sustainable development strategies. Its enhancement is profoundly influenced by three interconnected and mutually reinforcing factors. The first is technological progress. It includes mechanization and digital transformation. Mechanization, with efficient equipment, optimizes the use of land, water, and labor. Digital transformation, using technologies like the Internet of Things, enables intelligent control of farming. These innovations disrupt traditional practices, boosting agricultural productivity and quality, and unlocking new economic growth points [31]. Second, human capital development is crucial for boosting productivity. Through targeted agricultural education and skills training, farmers can master modern production technologies, manage risks, and adapt to market changes [32,33,34]. These measures foster a skilled workforce and promote technology dissemination, ensuring the practical implementation and maximization of technological progress. Lastly, institutional framework improvement provides necessary support and guarantees for agricultural productivity growth. A stable land tenure system encourages long-term investment and innovation in agricultural production And sound agricultural systems and mechanisms reduce transaction costs, enhance market competitiveness, and optimize product distribution [35,36].These institutional arrangements also promote agricultural cooperatives, fostering resource-saving collaborative production. In conclusion, technological progress, human capital development, and institutional improvement work in tandem. They are the core drivers of agricultural labor productivity, supporting rural economic vitality and sustainable development goals.
The differential impacts of these drivers on agricultural labor productivity have been extensively studied across various global contexts. In developed economies, Pardey and Alston [37] have mapped the evolution of agricultural productivity growth, highlighting the central role of knowledge stocks in research and development. For transition economies, studies by Swinnen and Vranken [38] in Eastern Europe have shown how institutional reforms, particularly land privatization and market liberalization, have created conditions for rapid productivity growth when accompanied by appropriate service structures. In emerging economies, Owens et al. [39] documented the varying degrees of success in agricultural productivity enhancement across South Asia, finding that regions with integrated service systems consistently outperform those with fragmented approaches. This body of international research offers critical context for understanding the pathways through which agricultural socialized services influence productivity outcomes in China and globally.

2.3. The Nexus Between Agricultural Socialized Services and Agricultural Labor Productivity

Supported by extensive empirical research, the relationship between the agricultural socialized service and agricultural labor productivity exhibits significant nonlinear and spatial characteristics [10,40,41]. In China, the impact of ASS on agricultural productivity varies markedly across regions, influenced by socioeconomic and environmental factors. Notably, in eastern and central regions, ASS effectively enhances agricultural productivity due to improved institutional support, infrastructure, and market systems [42]. These favorable conditions facilitate better resource utilization, accelerate technology adoption, and strengthen market connectivity. Similar patterns have been observed in Turkey, where İmrohoroğlu et al. [43] demonstrated that regional variations in agricultural productivity are significantly influenced by differences in service accessibility and institutional quality. As a result, agricultural productivity continues to grow in regions with well-established service networks.
Moreover, the impact of ASS on agricultural labor productivity exhibits a threshold effect. Empirical evidence suggests that significant productivity gains are achieved only when regional economic and social development reaches a certain level [18]. This finding is consistent with international evidence from studies in developing economies, where Niftiyev [44] identified critical turning points in the relationship between support services and productivity in Azerbaijan’s fruit and vegetable subsectors. This body of evidence highlights a critical turning point in agricultural transformation and emphasizes the nonlinear relationship between ASS and productivity. Consequently, emphasis should be placed on both the universal applicability and regional adaptability of ASS to ensure precise policy implementation. As demonstrated by Takahashi et al. [45], localized adaptation of agricultural services significantly enhances their effectiveness and sustainability compared to standardized approaches. Such an approach maximizes agricultural potential and fosters sustainable development.
The international literature further highlights emerging research frontiers in this field. A multi-country study by López-Ridaura et al. [46] developed spatial typologies of agricultural productivity across different service environments, identifying key thresholds for effective intervention. Suri and Udry [47] review evidence on the differential impacts of agricultural services across farmer typologies. Kassie et al. [48] explore how social network effects influence the productivity benefits of agricultural services, identifying important spillover mechanisms that complement direct service impacts. These studies highlight the evolving nature of the relationship between agricultural services and productivity in a rapidly changing global agricultural landscape.
Despite substantial research on ASS and ALP, key gaps remain. First, longitudinal studies are needed to assess the long-term impacts of ASS on productivity and rural livelihoods, especially concerning sustainability and resilience. Second, ecological aspects of ASS, such as sustainable intensification and climate resilience, require deeper exploration. Understanding how ASS contributes to environmental practices and stabilizes agroecosystems is vital. Third, the role of ASS in promoting inclusive development, particularly regarding gender equality and empowering marginalized communities, is underexplored. Addressing these gaps will improve the effectiveness of ASS in supporting high-quality agricultural development.
This study contributes to the literature by addressing key gaps in the understanding of ASS and their impact on agricultural labor productivity. The novel theoretical framework developed in this study integrates institutional economics and spatial analysis to capture the multifaceted nature of ASS and their direct and indirect effects on productivity. The incorporation of spatial econometric techniques enables the identification of geographical spillover effects, demonstrating the broader impact of ASS beyond their immediate areas of implementation. Furthermore, the application of a threshold model enables examination of the nonlinear relationship between ASS and ATP, revealing critical stages where ASS effectiveness undergoes qualitative shifts. This approach helps identify optimal intervention points for targeted policy implementation [49]. These methodological innovations advance the understanding of the complex dynamics underlying the ASS-productivity relationship and inform the design of evidence-based policies for agricultural development.

3. Materials and Methods

3.1. Data Description

This study examines panel data from 30 Chinese provinces during 2011 to 2022, a period marked by significant agricultural transformation. These provinces, with varied economic levels and diverse agricultural systems, represent a substantial portion of national agricultural output and rural population. By including regions with distinct agricultural characteristics, the study comprehensively captures China’s agricultural diversity. The chosen timeframe aligns with China’s crucial agricultural transformation stage, characterized by rapid socialized service popularization and model shifts. During this period, policies aimed at agricultural modernization, infrastructure enhancement, and mechanization-informatization integration were implemented. These measures address traditional agriculture’s inefficiencies, aiming to boost production efficiency and propel modernization. Table 1 presents the descriptive statistics of the primary variables used in this study. The data shows that the mean agricultural labor productivity (ALP) across provinces was 3.311, with substantial regional variation (standard deviation of 1.829). Agricultural socialized services (ASS) averaged 0.236, indicating moderate development of service systems across the country. The control variables display notable differences: the urban-rural income gap (GAP) averaged 2.547, agricultural land transfer (AFT) showed extensive variability with a mean of 32.105, openness (OPEN) averaged 0.266, agricultural finance level (AFL) was relatively low at 0.031, and cultivated land management scale (CMS) averaged 0.060, reflecting the predominantly small-scale nature of Chinese agriculture. This provides valuable insights and research directions, aiding in exploring agricultural development laws and deepening agricultural research.
The data sources include the China Rural Statistical Yearbook, China Environmental Statistical Yearbook, China Science and Technology Statistical Yearbook, China Urban and Rural Construction Statistical Yearbook, and provincial statistical yearbooks. These sources provide comprehensive coverage of agricultural metrics, encompassing labor productivity indicators, environmental parameters, technological adoption rates, and socioeconomic variables at the provincial level.

3.2. Variable Selection

3.2.1. Explained Variable

Agricultural labor productivity (ALP) measures production efficiency relative to labor input. Following Zhang et al. [50], this study defines ALP as the ratio of primary industry value-added to sector employment. This approach accounts for both direct output and intermediate inputs. It allows for a systematic evaluation of agricultural efficiency disparities across regions.

3.2.2. Explanatory Variables

The main explanatory variable in this study is Agricultural Socialized Services (ASS). To quantify ASS comprehensively, this paper develops a composite index that captures the multidimensional nature of agricultural service provision. The ASS index integrates seven key dimensions: management, operation, information technology, infrastructure, technology, marketing, and ecology. These 26 sub-dimensions reflect unique Chinese agricultural characteristics, including a vast rural population, dispersed land ownership, and regional disparities [9,51,52].
Integrating traditional and modern agricultural concepts, the composite index captures the complexity of Chinese agriculture and aligns with national development priorities. Its core value resides in informing precise policymaking and targeted interventions. In terms of indicator selection and weight determination, reference was made to institutional economics and technology adoption theory. Variables such as rural broadband coverage and land trusteeship embody theoretical constructs like transaction cost reduction and technology diffusion. To ensure evaluation objectivity, the entropy method was employed to calculate the weights of indicators, minimizing subjective bias in weight assignment, enhancing model explanatory power and accurately representing key agricultural socialized service dimensions. This methodological approach follows established practices in multi-criteria decision analysis for agricultural systems [53]. Table 2 provides a comprehensive overview of the indicator system used to measure agricultural socialized services, including primary categories, secondary indicators, their interpretation, units of measurement, calculated weights, and expected effects on agricultural labor productivity.

3.2.3. Control Variables

This study selects control variables based on established theoretical frameworks and empirical research to mitigate potential confounding effects in the analysis [54,55,56]. The model incorporates five control variables, capturing key socioeconomic and structural dimensions that influence agricultural productivity: urban-rural income gap (GAP), agricultural land transfer (ATF), openness (OPEN), agricultural finance level (AFL), and cultivated land management scale (CMS). Each variable represents an important factor that previous literature has identified as influential in agricultural development outcomes. Descriptive statistics of these control variables are shown in Table 1, providing a comprehensive overview of their distribution across the studied provinces during the research period.
The urban-rural income gap (GAP), measured as the ratio of urban to rural per capita disposable income, reflects socioeconomic inequality. Greater income disparity limits rural investment in infrastructure and technology, thereby constraining productivity. This variable helps isolate the effects of agricultural socialized services by accounting for regional differences in resource distribution and market access.
Agricultural land transfer (ATF), defined as the total amount of family-contracted arable land transferred within a province, serves as a proxy for land market activity and agricultural modernization. Land consolidation supports economies of scale and promotes the adoption of advanced technologies, making ATF essential for distinguishing structural improvements from ASS-driven productivity changes.
Openness (OPEN), calculated as the ratio of total trade volume to gross regional product, reflects a region’s integration into global markets. Trade facilitates access to advanced agricultural technologies and inputs, enhancing productivity. This variable controls for external economic factors that could influence regional performance beyond ASS interventions.
Agricultural finance level (AFL), represented by the ratio of agricultural, forestry, and water-related expenditures to gross regional product, captures public investment in agriculture. These expenditures support infrastructure, research, and credit access, directly impacting productivity. AFL ensures that observed effects are not conflated with variations in public spending.
Cultivated land management scale (CMS), measured as the proportion of large-scale farms relative to total farm households, reflects structural agricultural transformation. Larger farms benefit from mechanization and technology adoption, which enhance productivity. Controlling for CMS ensures that these inherent advantages do not obscure the impact of ASS.

3.3. Calculation Method of Entropy Value Method for Agricultural Socialized Services

Entropy value method is chosen for its ability to objectively quantify the weight of each indicator, reducing subjective bias in the measurement process. This method effectively captures the contribution of diverse dimensions within ASS, ensuring a robust and accurate evaluation of its comprehensive impact on agricultural productivity. To quantify the overall level of agricultural socialized services, the indicators were standardized using the min-max method, scaling all values to a range between 0 and 1. This eliminates scale and value range differences, ensuring comparability in the subsequent analysis.
X i j 1 = x i j m i n ( x i j ) m a x ( x i j ) m i n ( x i j ) + 0.0001 , P o s i t i v e   i n d e x
X i j 2 = m a x ( x i j ) x i j m a x ( x i j ) m i n ( x i j ) + 0.0001 , N e g a t i v e   i n d e x
In Equations (4) and (5), x i j is the value of the ith indicator in a province, m i n   ( x i t ) and m a x ( x i t ) denote the minimum and maximum values of the ith indicator in the province, respectively, X i j 1 and X i j 2 is the standardized value of the ith indicator in the province. Next, the weight of each indicator after standardization is calculated:
q i j = y i j / i = 1 m y i j ( 0 q i j 1 )
Additionally, the entropy of each indicator is analyzed to measure data uncertainty. A smaller entropy value indicates greater information content, while a larger value suggests more evenly distributed data and less information.
e j = ( 1 l n m ) i = 1 m q i j × l n q i j
The calculated entropy value ( e j ) is used to further derive the coefficient of variation ( g j ) for the jth indicator:
g j = 1 e j
The original entropy values were corrected by the coefficient of variation to obtain the final weights of the indicators. Calculate the weight of the jth indicator ( w j ):
w j = g j / j = 1 n g j
Calculate the composite score of each indicator in the agricultural socialized service evaluation system using a weighted sum formula.
S i = j = 1 n w j × X i j  

3.4. Modeling

This section develops the modeling framework to empirically analyze the relationship between agricultural socialized services and agricultural labor productivity, addressing the study’s core objectives. Specifically, the models aim to (1) quantify the direct effects of ASS on ALP, (2) identify nonlinear dynamics and thresholds in this relationship, and (3) capture spatial spillover effects across provinces.

3.4.1. Benchmark Model

The benchmark regression model establishes the baseline relationship between ASS and ALP while controlling for key socioeconomic factors. This model is specified as:
A L P i t = α 0 + α 1 A S S i t + α 2 X i t + μ i + ν t + ε i t
where A L P i t denotes the level of Chinese agricultural socialized services in province i in year t , A S S i t denotes agricultural labor productivity in province i in year t , X i t denotes the control variable such as the urban-rural income gap, land transfer rate, openness, agricultural finance, and farm scale at the provincial level. The terms μ i and ν t account for province-specific and time-fixed effects, respectively, while ε i t captures the random error term. This model provides the foundation for testing the overall impact of ASS on ALP while accounting for time-invariant regional characteristics.

3.4.2. Threshold Effect Model

Agricultural socialized services and labor productivity exhibit complex nonlinear relationships that necessitate comprehensive empirical investigation. Building on the research by Cai et al. [57], which identified significant threshold effects in the implementation of agricultural services, a threshold model is developed utilizing ALP as the primary variable. This approach identifies specific productivity levels where ASS impact changes significantly, revealing distinct developmental stages and allowing differential policy responses based on agricultural systems’ maturity. This methodological framework facilitates the precise identification of structural transitions within service-productivity dynamics, thereby informing evidence-based policy formulation and optimizing strategic service delivery. To examine potential nonlinearities in the relationship between ASS and ALP, the threshold regression model is employed:
A L P i t = β 0 + β 1 A S S i t × I   A L P i t T H + β 2 A S S i t × I   ( A L P i t > T H ) + β 3 X i t + μ i + ν t + ε i t
where, A L P i t is the threshold variable, T H is the threshold value to be estimated; I ( · ) is the indicator function, which takes the value of 1 to satisfy the condition in the parentheses, and 0 otherwise.

3.4.3. Spatial Measurement Model

Recognizing the interconnected nature of provincial agricultural systems, a spatial durbin model (SDM) is adopted to explore spatial spillovers of ASS.
A L P i t = C + ρ W A L P i t + δ 1 A S S i t + δ 2 X i t + θ 1 W A S i t + θ 2 W X i t + μ i + ν t + ε i t
where A L P i t denotes the rural residents’ income of province i at year t; W is the spatial weight matrix; ρ represents the spatial lag coefficient; θ is the spatial error factor. This model enables the decomposition of effects into direct (within-province) and indirect (cross-province) impacts, highlighting how ASS improvements in one region influence neighboring areas.
Three spatial weight matrices are utilized to capture different dimensions of spatial dependence:
In practice, W is often row-standardized W = w 11 w 1 n w n 1 w n n , ensuring that each row’s elements sum to 1. Spatial weight matrices, fundamental to spatial econometric analysis, quantify regional interdependencies and agricultural productivity spillovers.
The Adjacency Matrix ( W 1 ): Accounts for direct geographic contiguity between provinces, reflecting resource and policy linkages. The matrix reflects spatial proximity effects, where adjacent regions exhibit stronger interactions through shared resources and institutional frameworks.
The Geographic Distance Matrix ( W 2 ): Weighs interactions inversely by physica distance, emphasizing proximity effects in agricultural networks This matrix assumes that regions located closer to each other have stronger agricultural spillover effects, due to shorter distances facilitating resource flows and market interactions.
The Inverse Geographic Distance Squared Matrix ( W 3 ): Takes the inverse square of the distance. The element in this matrix reflects the square of the reciprocal of the nearest highway mileage between region i and region j . By utilizing the inverse squared distance, it provides a more pronounced spatial influence for nearby regions, while reducing the impact of distant regions on productivity outcomes.
The Nested Weight Matrix ( W 4 ) synthesizes geographic proximity and economic similarity through a weighted combination of geographic distance ( W 2 ) and economic distance ( W 5 ) matrices. The construction follows: W 4 = φ W 2 + ( 1 φ ) W 5 , with the weighting factor φ is set to 0.5, meaning equal weighting is given to both geographic and economic distances. The matrix measured through per capita GDP differentials, which offers a comprehensive framework for conducting spatial correlation analysis within the context of agricultural productivity patterns.
In order to enhance the simulation of spatial correlations between agricultural socialized services and labor productivity, this study employs the Spatial Durbin Model (SDM), which accounts for direct, indirect, and spatial spillover effects, comprehensively considering the impact of multiple factors on agricultural labor productivity. Empirical research highlights SDM’s effectiveness in evaluating cross-regional agricultural policy diffusion [58], offering a comprehensive, multilevel perspective on inter-provincial agricultural dynamics.

4. Results

4.1. Benchmark Regression

The benchmark regression results, presented in Table 3, indicate a significant positive relationship between agricultural socialized services (ASS) and agricultural labor productivity (ALP). The coefficient for ASS, consistently significant at the 1% level, suggests that a one-unit increase in the ASS index results in a 6.87% rise in ALP, demonstrating the importance of ASS in agricultural productivity. The Hausman test confirms the fixed effects model as the preferred specification (p < 0.05), effectively addressing potential endogeneity arising from unobserved provincial heterogeneity, thereby ensuring the robustness of the estimated effects.
The control variables also show significant relationships with ALP. The urban-rural income gap (GAP) shows a negative and significant relationship with productivity. Positive and significant coefficients are observed for openness (OPEN) and agricultural finance level (AFL), while the coefficient for cultivated land management scale (CMS) is negative.
These results indicate that ASS has a statistically and economically significant positive effect on agricultural labor productivity across Chinese provinces during the study period.

4.2. Robustness Test

This study employs a series of robustness tests to validate the accuracy of the benchmark regressions. First, we exclude the four major cities of Beijing, Tianjin, Shanghai, and Chongqing from the analysis due to their unique political and economic characteristics. The regression coefficients remain significantly positive after this exclusion. Second, we mitigate the impact of extreme values by excluding observations corresponding to the top and bottom 1% of agricultural labor productivity. After this adjustment, the coefficients for ASS remain statistically significant. To address potential endogeneity, alternative model specifications are examined. Across all models, the coefficients for agricultural socialized services remain consistently robust, confirming the stability of our findings. Additionally, a time dimension is incorporated to capture the dynamic nature of agricultural productivity and potential delays in service adoption. As shown in Table 4, the results are consistent with the benchmark model, suggesting that our findings are robust to various specification changes.

4.3. Endogeneity Test

This research investigates the issue of endogeneity in assessing the effect of agricultural socialized services on labor productivity. The study employs the instrumental variable (IV) method for parameter estimation, with one-period lagged agricultural labor productivity as the chosen instrument. As presented in Table 4 (columns 6 and 7), the Hansen J test confirms the IVs’ validity, showing no over-identification (p > 0.1). Furthermore, the Durbin-Wu Hausman test detects significant endogeneity (p < 0.05) in the baseline regression, underscoring the necessity of the IV approach in this study. IV estimation results reveal that the coefficient of ASS remains positive and statistically significant after accounting for potential endogeneity. This confirms the robustness of our findings and supports the interpretation of a causal relationship between ASS and agricultural productivity.

4.4. Heterogeneity Analysis

4.4.1. Geographic Location Heterogeneity

The effectiveness of agricultural socialized services exhibits significant regional variation across China, as evidenced by the National Bureau of Statistics’ classification of eastern, central, and western regions. Regression results presented in Table 5, columns (1)–(3), reveal distinct coefficients across regions. The eastern and central regions show strong positive impacts (13.950 and 11.965, respectively, both significant at p < 0.01), while the western region demonstrates a negative effect (−7.019, p < 0.01). These quantitative findings indicate substantial geographic heterogeneity in ASS effectiveness.

4.4.2. Heterogeneity of Grain-Producing Areas

Analysis of major grain-producing areas versus non-grain-producing regions, presented in Table 5, columns (4) and (5), shows marked differences in the effectiveness of ASS. The regression coefficient for major grain-producing regions is 25.128 (p < 0.01), substantially higher than the 8.156 coefficient (p < 0.01) for non-grain-producing areas. This statistical disparity indicates that ASS interventions yield significantly greater productivity gains in regions prioritizing grain production. These findings align with Li et al.’s [59] research.

4.5. Threshold Effect Analysis

Statistical analyses revealed significant threshold effects at ALP values of 5.254 and 8.478, with strong evidence supporting both models. The single threshold model yielded an F-statistic of 175.95 (p < 0.001), while the double threshold model produced an F-statistic of 129.17 (p < 0.01), as shown in Table 6.
The estimated coefficients for each regime, presented in Table 7, demonstrate a progressive increase in the impact of ASS across productivity thresholds. In the initial stage (ALP ≤ 5.254), ASS shows a positive relationship with productivity (coefficient = 10.859, p < 0.01). This effect strengthens in the intermediate stage (5.254 < ALP ≤ 8.478), with a coefficient of 15.102 (p < 0.01). The relationship is most pronounced in the advanced stage (ALP > 8.478), where the coefficient reaches 27.374 (p < 0.01). These empirical findings confirm that the relationship between ASS and agricultural labor productivity exhibits significant nonlinearity across different productivity levels. The findings of this study align closely with the research of Cai et al. [57] and Zhang et al. [60], collectively highlighting the dynamic and evolving relationship between agricultural productivity and the support services required at different development stages.

4.6. Spatial Measurement Models

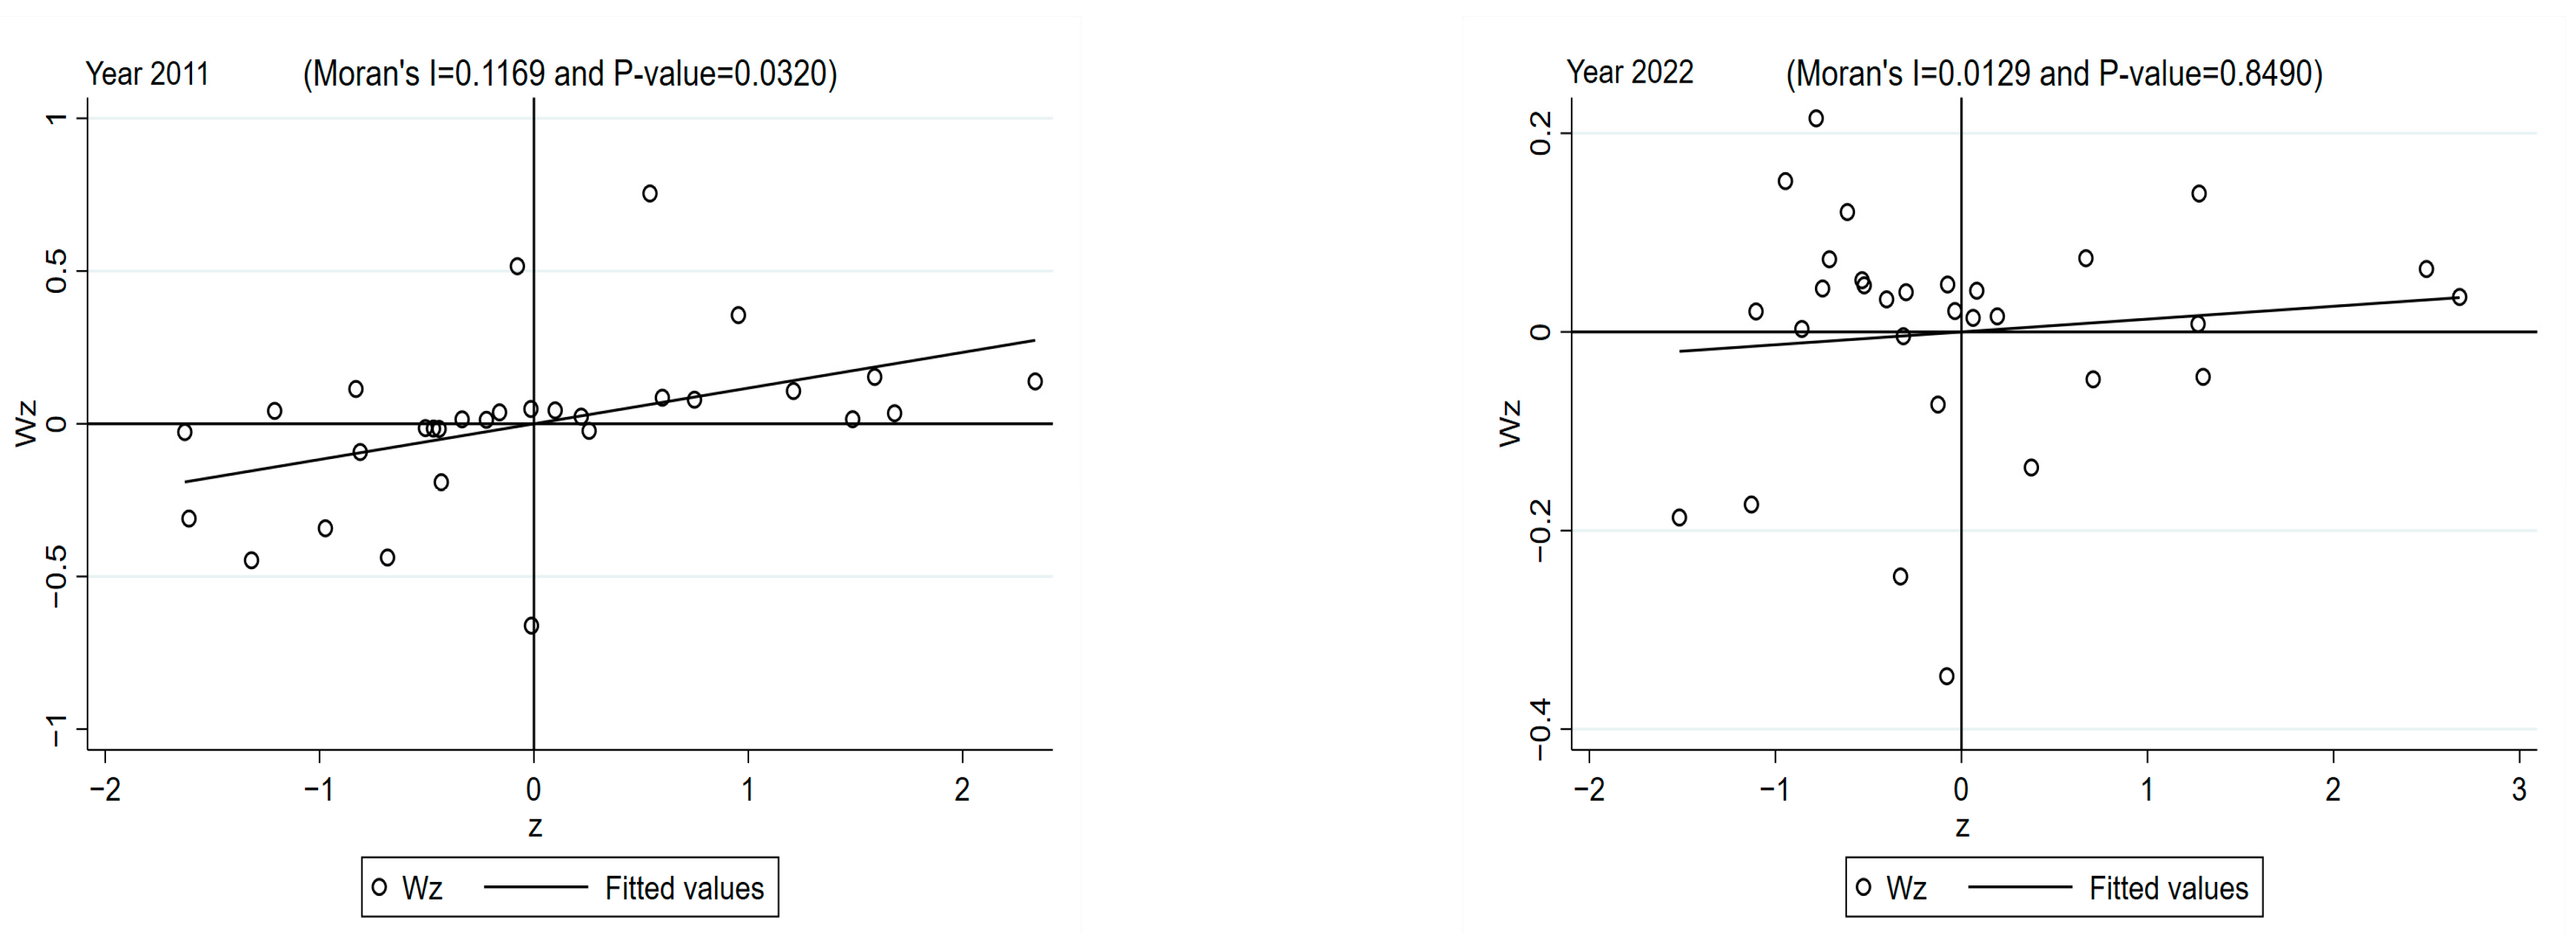
4.6.1. Spatial Correlation Test

In order to conduct a global spatial autocorrelation test to provide a basis for the subsequent construction of the spatial econometric model, a global Moran test was conducted, and the following formula was constructed:
M o r a n s I = i = 1 l j = 1 l W i j Z i Z ̄ Z j Z ̄ S 2 i = 1 l j = 1 l W i j
In Equation (11); Z i represents the observed value of the ith province and city, l is the total number of provinces and cities, and W i j represents the neighboring space matrix. To investigate the spatial distribution and clustering patterns of agricultural labor productivity across Chinese provinces, a global Moran’s I test was conducted. This method assesses the presence of spatial autocorrelation, which indicates whether provinces with similar productivity levels are geographically clustered. Understanding this spatial dynamic is critical for identifying regional disparities and formulating effective policy interventions.
To examine the spatial distribution patterns of agricultural labor productivity across Chinese provinces, we conducted a global Moran’s I test. As shown in Table 8, the Moran I test results reveal that agricultural labor productivity exhibits non-random spatial distribution throughout the study period (2011–2022). In 2011, the Moran index stood at 0.117, indicating moderate spatial agglomeration that is statistically significant at the 1% level. Over time, this value gradually decreased to 0.013 by 2022, suggesting a reduction in spatial dependency. Figure 1 visually demonstrates this spatial distribution pattern through Moran scatterplots for the years 2011 and 2022, illustrating the changing spatial relationships in agricultural labor productivity over the study period.

4.6.2. Spatial Measurement Model Selection

To determine the appropriate spatial econometric model, diagnostic tests were conducted using Lagrange Multiplier (LM) tests. Results in Table 9 confirm significant spatial dependence in the data. The robust LM statistic for the Spatial Autoregressive (SAR) model (25.134, p < 0.01) outperforms the Spatial Error Model (SEM) (9.562, p < 0.01), indicating that productivity levels in one province are directly influenced by neighboring regions.
The SAR model effectively captures these spatial interactions, providing insights into how agricultural innovations and services diffuse across provincial boundaries. These findings highlight the importance of coordinated regional policies for agricultural modernization, as investments in less developed areas can generate positive spillover effects that benefit broader geographic regions.

4.6.3. Spatial Durbin Model

To analyze the spatial spillover effects of agricultural socialized services on agricultural labor productivity, we employed the spatial durbin model with different spatial weight matrices. The model incorporates spatial, temporal, and spatio-temporal double fixed effects, allowing us to comprehensively examine the relationship between ASS and labor productivity within provinces and across neighboring regions.
The regression results, presented in Table 10, indicate significant positive effects of ASS on agricultural labor productivity. The direct effect coefficient (7.038, p < 0.01) shows that enhancing ASS within a province is associated with measurable improvements in local productivity. Meanwhile, the indirect effect coefficient (22.437, p < 0.01) indicates significant positive spatial spillover effects, suggesting that ASS implementation in one province is associated with productivity gains in adjacent provinces.
The spatial coefficient (rho = −0.411, p < 0.1) is negative and statistically significant in the spatio-temporal fixed effect model (column 3), suggesting complex spatial interactions in agricultural productivity across provinces. The model’s R2 value of 0.774 indicates a good fit to the data. These findings align with regional externality theory, benefiting neighboring regions through shared resources and innovations, and are consistent with previous studies by Wang et al. (2024) [58]. Hence, the significant spatial spillovers highlighted here imply important policy implications. Policymakers should adopt coordinated regional strategies, emphasizing cross-regional collaboration to maximize ASS benefits.

4.6.4. Spatial Durbin Model Robustness Test

To validate the spatial spillover effects of agricultural socialized services on agricultural labor productivity, this study employs alternative spatial weight matrices in robustness tests. Three distinct matrices are constructed: a geographic distance matrix, an inverse geographic distance squared matrix, and an economic-geographic nested matrix incorporating both spatial proximity and economic development levels. These matrices capture diverse dimensions of inter-regional spatial correlations. Table 11, columns (1)–(3), presents the spatial durbin model regression results using these alternative matrices. The direct effect coefficient is 0.150 (p < 0.01), while the indirect effect coefficient is 0.095 (p < 0.05), reinforcing the positive impact of agricultural socialized services on agricultural productivity locally and regionally. This consistency validates the robustness of the primary findings, demonstrating that ASS enhances productivity not only within their immediate region but also generates positive externalities in adjacent areas through spatial diffusion mechanisms. These robust results provide a foundation for designing policies aimed at reducing disparities and promoting sustainable agricultural development. Policymakers should focus on leveraging these spillover effects by enhancing inter-regional collaboration and scaling ASS interventions to diverse contexts.

5. Discussion

In this section, we interpret the empirical findings presented in the Results section and discuss their implications.
The benchmark regression results demonstrate that agricultural socialized services significantly enhance agricultural labor productivity in China. This positive relationship can be attributed to several mechanisms. First, ASS likely reduces transaction costs by providing integrated services that connect smallholder farmers to markets, inputs, and technologies. Second, ASS appears to facilitate technology adoption by offering training, demonstration, and extension services that help farmers implement modern agricultural practices. Third, ASS potentially enables resource optimization through shared mechanization, coordinated pest management, and collective marketing.
The regional heterogeneity analysis reveals important spatial patterns in the effectiveness of ASS. The stronger positive impact in eastern and central regions likely reflects better infrastructure, more developed market systems, and institutional advantages in these areas. These regions typically have superior transportation networks, communication systems, and financial services that enhance the delivery and uptake of agricultural socialized services. In contrast, the negative effect observed in western regions may stem from geographical constraints, including diverse and challenging terrain that complicates service delivery, inadequate infrastructure that limits technology adoption, and insufficient financial support for building effective ASS systems.
Similarly, the stronger effect of ASS in major grain-producing areas likely reflects several advantages these regions possess. These include better agricultural infrastructure such as irrigation systems and storage facilities, stronger government policy support focused on ensuring food security, more effective technology dissemination networks, and beneficial agglomeration effects from specialized agricultural production. Non-grain-producing regions, conversely, often face challenges including outdated infrastructure, limited financial resources, and less developed agricultural service markets.
The threshold effect analysis identifies three distinct stages in how ASS influences agricultural productivity:
In the initial stage (ALP ≤ 5.254), agricultural systems likely face fundamental constraints including infrastructural limitations, limited technology access, and low production efficiency. At this stage, ASS appears to address basic needs by providing technical training, strengthening supply chain management, and expanding market access.
In the intermediate stage (5.254 < ALP ≤ 8.478), the increased effectiveness of ASS likely reflects the agricultural system’s transformation through technology adoption and market integration. Services in this stage may focus on precision agriculture, high-value product development, and stronger market linkages.
In the advanced stage (ALP > 8.478), the substantially higher impact of ASS suggests that regions with already high productivity benefit even more from specialized services. These might include risk management services, agricultural insurance, and advanced digital precision agriculture tools that maximize efficiency and resilience.
The spatial analysis results demonstrate significant spillover effects, where ASS improvements in one province generate positive externalities in adjacent areas. These spillovers likely occur through multiple channels: knowledge and innovation diffusion across provincial borders, shared infrastructure that facilitates regional resource flows, and integrated market networks that enhance overall agricultural efficiency. The decline in spatial autocorrelation of agricultural productivity over time (shown by decreasing Moran’s I values from 2011 to 2022) suggests a trend toward regional integration and convergence in agricultural development, possibly reflecting the effectiveness of balanced development policies in narrowing spatial productivity gaps.

6. Conclusions and Suggestions

6.1. Conclusions

Using data at the level of 30 provinces in China from 2011 to 2022, the article examines the impact of agricultural socialization services on agricultural labor productivity. The study shows the following results. First, ASS has a significant promotion effect on ALP, and this finding remains valid after considering the robustness test and the endogeneity test. The nonlinearity test shows that the effect of ASS on ALP increases progressively at the thresholds of 5.254 and 8.478 of ALP, revealing a nonlinear relationship that evolves at different stages of agricultural development. In terms of heterogeneity, the ASS is more effective in boosting agricultural labor productivity in eastern, central, and major food-producing regions, while its impact on western and non-food-producing regions is relatively weak. The spatial measurement results indicated that the progress of ASS generated positive externalities beyond its immediate implementation area, promoting interprovincial agricultural cooperation and development.

6.2. Suggestions

Based on the above research results, the following policy recommendations are proposed:
First, strengthening agricultural socialized services requires targeted investment strategies and service optimization. Services must align with production needs and address key issues like pest control and fertilizer application. Professional training should enhance farmers’ skills through regular expert sessions. These measures will foster innovation, promote region-specific models, and support modernization. Expanding services to processing, storage, and transportation will build efficient agricultural value chains. Policy support should prioritize processing facilities modernization.
Second, reducing regional disparities requires tailored approaches. In eastern, central, and major grain-producing areas, policies should expand and professionalize service institutions. Governments should attract social capital through tax incentives and subsidies. In western and non-major grain-producing regions, priorities should include infrastructure upgrades and technology promotion. Training programs and research collaborations will accelerate technological applications in underdeveloped regions.
Third, promoting sustainable agricultural development requires strategies aligned with productivity levels. Low-productivity areas need infrastructure improvements, while moderately productive regions should adopt precision agriculture and smart management. High-productivity areas should integrate globally and develop high-value industries. Agricultural science advancement requires targeted subsidies, training, and demonstration sites. Cooperation among experts, farmers, and enterprises will accelerate technology transfer and enhance market competitiveness.
Fourth, enhancing spatial spillover effects requires stronger interregional cooperation. A digital platform should facilitate information sharing on services, practices, and technologies. Regions should leverage their unique resources through strategic coordination. Service providers should integrate advanced technologies like IoT, big data, and AI to enable more precise, data-driven services.
This study provides valuable insights into the relationship between agricultural socialization services and agricultural labor productivity in various provinces of China. However, some methodological limitations must be acknowledged.
While provincial aggregate data offers a comprehensive macro overview of agricultural development patterns, it may obscure significant variations at the micro level that are critical to understanding the implementation and effectiveness of agricultural socialization services. The reliance on provincial data limits our ability to capture intra-provincial heterogeneity and potentially masks important local dynamics that affect the adoption and impact of agricultural socialization services. Future research would benefit from incorporating county-level or even village-level data to gain a more nuanced understanding of how agricultural socialization services function across diverse agricultural contexts.

Author Contributions

Conceptualization, Y.B.; methodology, Y.B. and R.L.; software, Y.B. and Y.W.; validation, Y.W.; formal analysis, R.L.; investigation, Y.W., R.L. and J.L.; resources, Y.B., J.L. and R.L.; data curation, Y.W.; writing—original draft preparation, Y.B.; writing—review and editing, Y.W. and R.L.; visualization, J.L.; supervision, Y.B., J.L. and R.L.; Project administration, Y.B., J.L. and R.L.; Funding acquisition, Y.B. All authors have read and agreed to the published version of the manuscript.

Funding

This study was funded by the Guangxi Minzu University (No. 2024MDSKYB01).

Institutional Review Board Statement

Not applicable.

Data Availability Statement

The data presented in this study are available upon request from the corresponding author.

Conflicts of Interest

The authors declare no conflicts of interest.

References

  1. van Dijk, M.; Morley, T.; Rau, M.L.; van Berkum, S.; Bodirsky, B.L.; Schulte, I.; Sartori, M. A meta-analysis of projected global food demand and population at risk of hunger for the period 2010–2050. Nat. Food 2021, 2, 494–501. [Google Scholar] [CrossRef] [PubMed]
  2. Giller, K.E. The Food Security Conundrum of Sub-Saharan Africa. Glob. Food Secur. 2020, 26, 100431. [Google Scholar] [CrossRef]
  3. Ricciardi, V.; Ramankutty, N.; Mehrabi, Z.; Jarvis, L.; Chookolingo, B. How Much of the World’s Food Do Smallholders Produce? Glob. Food Secur. 2018, 17, 64–72. [Google Scholar] [CrossRef]
  4. Godfray, H.C.J.; Garnett, T. Food Security and Sustainable Intensification. Philos. Trans. R. Soc. B Biol. Sci. 2014, 369, 20120273. [Google Scholar] [CrossRef]
  5. Pretty, J.; Benton, T.G.; Bharucha, Z.P.; Dicks, L.V.; Flora, C.B.; Godfray, H.C.J.; Goulson, D.; Hartley, S.; Lampkin, N.; Morris, C.; et al. Global Assessment of Agricultural System Redesign for Sustainable Intensification. Nat. Sustain. 2018, 1, 441–446. [Google Scholar] [CrossRef]
  6. Zhou, Z.; Zhang, K.; Wu, H.; Liu, C.; Yu, Z. Land Transfer or Trusteeship: Can Agricultural Production Socialization Services Promote Grain Scale Management? Land 2023, 12, 797. [Google Scholar] [CrossRef]
  7. Turner, B.L.; Fuhrer, J.; Wuellner, M.; Menendez, H.M.; Dunn, B.H.; Gates, R. Scientific Case Studies in Land-Use Driven Soil Erosion in the Central United States: Why Soil Potential and Risk Concepts Should Be Included in the Principles of Soil Health. Int. Soil Water Conserv. Res. 2018, 6, 63–78. [Google Scholar] [CrossRef]
  8. Lowder, S.K.; Sánchez, M.V.; Bertini, R. Which Farms Feed the World and Has Farmland Become More Concentrated? World Dev. 2021, 142, 105455. [Google Scholar] [CrossRef]
  9. Foley, J.A.; Ramankutty, N.; Brauman, K.A.; Cassidy, E.S.; Gerber, J.S.; Johnston, M.; Mueller, N.D.; O’Connell, C.; Ray, D.K.; West, P.C.; et al. Solutions for a Cultivated Planet. Nature 2011, 478, 337–342. [Google Scholar] [CrossRef]
  10. Anderson, J.R.; Feder, G. Agricultural Extension: Good Intentions and Hard Realities. World Bank Res. Obs. 2004, 19, 41–60. [Google Scholar] [CrossRef]
  11. Zang, L.; Wang, Y.; Ke, J.; Su, Y. What Drives Smallholders to Utilize Socialized Agricultural Services for Farmland Scale Management? Insights from the Perspective of Collective Action. Land 2022, 11, 930. [Google Scholar] [CrossRef]
  12. Baloch, M.A.; Thapa, G.B. Review of the Agricultural Extension Modes and Services with the Focus to Balochistan, Pakistan. J. Saudi Soc. Agric. Sci. 2019, 18, 188–194. [Google Scholar] [CrossRef]
  13. Emeana, E.M.; Trenchard, L.; Dehnen-Schmutz, K. The Revolution of Mobile Phone-Enabled Services for Agricultural Development (m-Agri Services) in Africa: The Challenges for Sustainability. Sustainability 2020, 12, 485. [Google Scholar] [CrossRef]
  14. Wang, X.; Yamauchi, F.; Otsuka, K.; Huang, J. Wage Growth, Landholding, and Mechanization in Chinese Agriculture. World Dev. 2016, 86, 30–45. [Google Scholar] [CrossRef]
  15. Morris, W.; Henley, A.; Dowell, D. Farm Diversification, Entrepreneurship and Technology Adoption: Analysis of Upland Farmers in Wales. J. Rural Stud. 2017, 53, 132–143. [Google Scholar] [CrossRef]
  16. Zhang, C.; Zhang, J.; Fu, Z.; Tian, M. A Study on the Impact of Population Aging on the Agricultural Socialized Services. Agriculture 2025, 15, 577. [Google Scholar] [CrossRef]
  17. Poulton, C.; Dorward, A.; Kydd, J. The Future of Small Farms: New Directions for Services, Institutions, and Intermediation. World Dev. 2010, 38, 1413–1428. [Google Scholar] [CrossRef]
  18. Ma, W.; Abdulai, A. Does Cooperative Membership Improve Household Welfare? Evidence from Apple Farmers in China. Food Policy 2016, 58, 94–102. [Google Scholar] [CrossRef]
  19. Abebaw, D.; Haile, M.G. The Impact of Cooperatives on Agricultural Technology Adoption: Empirical Evidence from Ethiopia. Food Policy 2013, 38, 82–91. [Google Scholar] [CrossRef]
  20. Fischer, E.; Qaim, M. Linking Smallholders to Markets: Determinants and Impacts of Farmer Collective Action in Kenya. World Dev. 2012, 40, 1255–1268. [Google Scholar] [CrossRef]
  21. Baumgart-Getz, A.; Prokopy, L.S.; Floress, K. Why Farmers Adopt Best Management Practice in the United States: A Meta-Analysis of the Adoption Literature. J. Environ. Manag. 2023, 96, 17–25. [Google Scholar] [CrossRef]
  22. Klerkx, L.; Leeuwis, C. Establishment and Embedding of Innovation Brokers at Different Innovation System Levels: Insights from the Dutch Agricultural Sector. Technol. Forecast. Soc. Change 2024, 76, 849–860. [Google Scholar] [CrossRef]
  23. Wossen, T.; Alene, A.; Abdoulaye, T.; Feleke, S.; Rabbi, I.Y.; Manyong, V. Poverty Reduction Effects of Agricultural Technology Adoption: The Case of Improved Cassava Varieties in Nigeria. J. Agric. Econ. 2023, 70, 392–407. [Google Scholar] [CrossRef]
  24. Aker, J.C. Information from Markets Near and Far: Mobile Phones and Agricultural Markets in Niger. Am. Econ. J. Appl. Econ. 2010, 2, 46–59. [Google Scholar] [CrossRef]
  25. Nakasone, E.; Torero, M.; Minten, B. The Power of Information: The ICT Revolution in Agricultural Development. Annu. Rev. Resour. Econ. 2014, 6, 533–550. [Google Scholar] [CrossRef]
  26. Islam, D.; Berkes, F. Can Small-scale Commercial and Subsistence Fisheries Co-exist? Lessons from an Indigenous Community in Northern Manitoba, Canada. Marit. Stud. 2016, 15, 1. [Google Scholar] [CrossRef]
  27. Zhang, S.; Wolz, A.; Ding, Y. Is There a Role for Agricultural Production Cooperatives in Agricultural Development? Evidence from China. Outlook Agric. 2020, 49, 256–263. [Google Scholar] [CrossRef]
  28. Chen, Z.; Sarkar, A.; Hossain, M.S.; Li, X.; Xia, X. Household Labour Migration and Farmers’ Access to Productive Agricultural Services: A Case Study from Chinese Provinces. Agriculture 2021, 11, 976. [Google Scholar] [CrossRef]
  29. Xu, Q.; Zhu, P.; Tang, L. Agricultural Services: Another Way of Farmland Utilization and Its Effect on Agricultural Green Total Factor Productivity in China. Land 2022, 11, 1170. [Google Scholar] [CrossRef]
  30. Wang, J.; Yang, G.; Zhou, C. Does Internet Use Promote Agricultural Green Development? Evidence from China. Int. Rev. Econ. Financ. 2024, 93, 98–111. [Google Scholar] [CrossRef]
  31. Giannakis, E.; Bruggeman, A. Exploring the Labour Productivity of Agricultural Systems across European Regions: A Multilevel Approach. Land Use Policy 2018, 77, 94–106. [Google Scholar] [CrossRef]
  32. Wang, X.; Yamauchi, F.; Huang, J. Rising Wages, Mechanization, and the Substitution between Capital and Labor: Evidence from Small-Scale Farm Systems in China. Agric. Econ. 2016, 47, 309–317. [Google Scholar] [CrossRef]
  33. Wang, Y.; Zhao, Z.; Xu, M.; Tan, Z.; Han, J.; Zhang, L.; Chen, S. Agriculture–Tourism Integration’s Impact on Agricultural Green Productivity in China. Agriculture 2023, 13, 1941. [Google Scholar] [CrossRef]
  34. Liu, Y.; Barrett, C.B.; Pham, T.; Violette, W. The Intertemporal Evolution of Agriculture and Labor over a Rapid Structural Transformation: Lessons from Vietnam. Food Policy 2020, 94, 101913. [Google Scholar] [CrossRef]
  35. Tiatié, N. Impact of Land Tenure Security through Customary Law on Agricultural Productivity in Burkina Faso: Propensity Score Matching Approaches. Land Use Policy 2023, 134, 106907. [Google Scholar] [CrossRef]
  36. Ortmann, G.F.; King, R.P. Agricultural Cooperatives I: History, Theory and Problems. Agrekon 2007, 46, 40–68. [Google Scholar] [CrossRef]
  37. Pardey, P.; Alston, J. Unpacking the Agricultural Black Box: The Rise and Fall of American Farm Productivity Growth. J. Econ. Hist. 2021, 81, 114–155. [Google Scholar] [CrossRef]
  38. Swinnen, J.F.; Vranken, L. Reforms and Agricultural Productivity in Central and Eastern Europe and the Former Soviet Republics: 1989–2005. J. Prod. Anal. 2023, 33, 241–258. [Google Scholar] [CrossRef]
  39. Owens, T.; Hoddinott, J.; Kinsey, B. The Impact of Agricultural Extension on Farm Production in Resettlement Areas of Zimbabwe. Econ. Dev. Cult. Change 2023, 51, 337–357. [Google Scholar] [CrossRef]
  40. Jin, S.; Ma, H.; Huang, J.; Hu, R.; Rozelle, S. Productivity, Efficiency and Technical Change: Measuring the Performance of China’s Transforming Agriculture. J. Prod. Anal. 2010, 33, 191–207. [Google Scholar] [CrossRef]
  41. Ragasa, C.; Mazunda, J.; Kadzamira, M. The Impact of Farmer Field Schools on Agricultural Productivity and Poverty in Malawi. World Dev. 2016, 78, 57–75. [Google Scholar] [CrossRef]
  42. Cai, B.; Shi, F.; Meseretchanie, A.; Betelhemabraham, G.; Zeng, R. Agricultural socialized services empowering smallholder rice producers to achieve high technical efficiency: Empirical evidence from southern China. Front. Sustain. Food Syst. 2024, 8, 1329872. [Google Scholar] [CrossRef]
  43. İmrohoroğlu, A.; İmrohoroğlu, S.; Üngör, M. Agricultural Productivity and Growth in Turkey. Macroecon. Dyn. 2014, 18, 998–1017. [Google Scholar] [CrossRef]
  44. Niftiyev, I. Performance Evaluation of the Fruit and Vegetable Subsectors in the Azerbaijani Economy: A Combinatorial Analysis Using Regression and Principal Component Analysis. Zagreb Int. Rev. Econ. Bus. 2021, 24, 27–47. [Google Scholar] [CrossRef]
  45. Takahashi, K.; Muraoka, R.; Otsuka, K. Technology Adoption, Impact, and Extension in Developing Countries’ Agriculture: A Review of the Recent Literature. Agric. Econ. 2020, 51, 31–45. [Google Scholar] [CrossRef]
  46. López-Ridaura, S.; Frelat, R.; van Wijk, M.T.; Valbuena, D.; Krupnik, T.J.; Jat, M.L. Climate Smart Agriculture, Farm Household Typologies and Food Security: An Ex-ante Assessment from Eastern India. Agric. Syst. 2023, 159, 57–68. [Google Scholar] [CrossRef]
  47. Suri, T.; Udry, C. Agricultural Technology in Africa. J. Econ. Perspect. 2024, 36, 33–56. [Google Scholar] [CrossRef]
  48. Kassie, M.; Teklewold, H.; Jaleta, M.; Marenya, P.; Erenstein, O. Understanding the Adoption of a Portfolio of Sustainable Intensification Practices in Eastern and Southern Africa. Land Use Policy 2023, 42, 400–411. [Google Scholar] [CrossRef]
  49. Campi, M. The effect of intellectual property rights on agricultural productivity. Agric. Econ. 2017, 48, 327–339. [Google Scholar] [CrossRef]
  50. Zhang, L.; Hong, M.; Guo, X.; Qian, W. How Does Land Rental Affect Agricultural Labor Productivity? An Empirical Study in Rural China. Land 2022, 11, 653. [Google Scholar] [CrossRef]
  51. Chen, X.; An, Y.; Pan, W.; Wang, Y.; Chen, L.; Gu, Y.; Liu, H.; Yang, F. Dynamic Transfer and Driving Mechanisms of the Coupling and Coordination of Agricultural Resilience and Rural Land Use Efficiency in China. J. Geogr. Sci. 2024, 34, 1589–1614. [Google Scholar] [CrossRef]
  52. Liao, R.; Chen, Z.; Sirisrisakulchai, J.; Liu, J. Enhancing Rural Economic Sustainability in China Through Agricultural Socialization Services: A Novel Perspective on Spatial-Temporal Dynamics. Agriculture 2025, 15, 267. [Google Scholar] [CrossRef]
  53. Baležentis, T.; Štreimikienė, D.; Melnikienė, R.; Zeng, S. Agricultural Sustainability Assessment Framework Integrating Sustainable Development Goals and Interlinked Priorities of Environmental, Climate and Agriculture Policies. Sustain. Dev. 2020, 28, 1702–1712. [Google Scholar] [CrossRef]
  54. Liu, Y.; Fang, F.; Li, Y. Key Issues of Land Use in China and Implications for Policy Making. Land Use Policy 2014, 40, 6–12. [Google Scholar] [CrossRef]
  55. Jia, L.; Petrick, M. How Does Land Fragmentation Affect Off-Farm Labor Supply: Panel Data Evidence from China. Agric. Econ. 2014, 45, 369–380. [Google Scholar] [CrossRef]
  56. Huang, J.; Ding, J. Institutional Innovation and Policy Support to Facilitate Small-Scale Farming Transformation in China. Agric. Econ. 2016, 47, 227–237. [Google Scholar] [CrossRef]
  57. Cai, B.; Wangda, L.; Shi, F.; Abate, M.C.; Geremew, B.; Addis, A.K. Agricultural socialized services and Chinese food security: Examining the threshold effect of land tenure change. Front. Sustain. Food Syst. 2024, 8, 1371520. [Google Scholar] [CrossRef]
  58. Wang, L.; Gao, X.; Yuan, R.; Luo, M. Impact and Spatial Effect of Socialized Services on Agricultural Eco-Efficiency in China: Evidence from Jiangxi Province. Sustainability 2024, 16, 360. [Google Scholar] [CrossRef]
  59. Li, R.; Chen, J.; Xu, D. The Impact of Agricultural Socialized Service on Grain Production: Evidence from Rural China. Agriculture 2024, 14, 785. [Google Scholar] [CrossRef]
  60. Zhang, H.; Bai, X.; Zhao, M. How Socialized Services Affect Agricultural Economic Resilience—Empirical Evidence from China. Agriculture 2024, 14, 1773. [Google Scholar] [CrossRef]
Figure 1. Moran scatterplot of agricultural labor productivity, 2011 and 2022.
Agriculture 15 00957 g001
Table 1. Descriptive statistics.
VariableObsMeanStd. Dev.MinMax
Explain variableALP3603.3111.8290.60811.396
Explanatory variablesASS3600.2360.1210.0450.543
Control variablesGAP3602.5470.3791.8273.672
AFT36032.10516.5573.35391.111
OPEN3600.2660.2870.0081.548
AFL3600.0310.0210.0060.110
CMS3600.0600.0920.0020.566
Table 2. Agricultural socialized services Indicator.
Primary
Categories
Secondary IndicatorsInterpretation of IndicatorsUnit (of Measure)WeightsExpected Effects
Agricultural management servicesExtent of Land TrusteeshipProportion of Land Under Trusteeship Relative to Cultivated Area%0.047Positive
Land Productivity Associated with Scaled OperationsRatio of gross agricultural output to area sown to crops%0.038Positive
Agricultural operation servicesProfessionals in Mechanized Agricultural ServicesNumber of specialized households in agricultural mechanization services-0.105Positive
Extent of Agricultural MechanizationTotal area of machine-ploughing, machine-irrigation, machine-planting, machine-harves ting, and machine-sowingKhm20.068Positive
Agricultural Mechanization Service OrganizationNumber of agricultural mechanization service organizations-0.056Positive
Agricultural informatization servicesLevels of Internet Connectivity in Rural AreasNumber of rural Internet broadband accesses-0.080Positive
Rate of Telephone Access in Rural RegionsRural telephone penetration%0.002Positive
Percentage of Villages with Access to Postal ServicesNumber of postal villages as a percentage of villages%0.035Positive
Length of rural postal delivery routesLength of rural postal routeskm0.015Positive
Level of digitization of agricultureRural Digital Financial Inclusion Investment Index%0.053Positive
Agricultural infrastructure servicesDegree of Rural Water Infrastructure DevelopmentEffective irrigated areahm20.070Positive
Efficiency Ratio of Irrigation Water UtilizationRatio of effective irrigated area to area sown to crops%0.031Positive
Total Length of Rural Road InfrastructureLength of rural roadskm0.070Positive
Per capita investment in agriculture, forestry and waterRatio of investment in fixed assets in agriculture, forestry and water to rural populationHundred
million CNY/person
0.022Positive
Reservoir ownershipNumber of reservoirs-0.085Positive
Agricultural technology servicesRural techniciansNumber of R&D persons (GDP of agriculture, forestry and fisheries/GDP of the region)-0.061Positive
Agrometeorological observation stationsNumber of agrometeorological observation stations-0.022Positive
Level of development of agricultural loansTotal agriculture-related loansbillion0.054Positive
Agricultural ecological servicesCapacity for Responding to Natural Disasters1—Affected area/affected area%0.002Positive
Rate of Fertilizer ApplicationRatio of fertilizer application to area sown to cropsTons/km20.010Negative
Rate of Pesticide ApplicationRatio of pesticide application to area sown to cropsTons/km20.004Negative
Amount of agricultural film appliedRatio of the amount of agricultural film applied to the area sown to cropsTons/km20.005Negative
Effectiveness of Soil Erosion Control MeasuresArea of soil and water conservationKm20.049Positive
Table 3. Benchmark Regression Results.
VariablesALP
(1)(2)(3)(4)(5)(6)
ASS7.370 ***7.265 ***7.326 ***6.870 ***6.474 ***6.866 ***
(2.468)(2.476)(2.471)(2.329)(2.319)(2.310)
GAP 1.368 *1.357 *1.794 **2.073 ***2.287 ***
(0.771)(0.753)(0.783)(0.789)(0.793)
AFT 0.0010.0010.0010.001
(0.003)(0.003)(0.003)(0.003)
OPEN 1.122 **1.230 **1.305 **
(0.557)(0.556)(0.556)
AFL 16.199 ***−16.334 ***
(5.943)(6.057)
CMS −4.965
(3.453)
Constant1.575 ***−1.885−1.911−3.221−3.346−3.699 *
(0.580)(1.837)(1.853)(2.053)(2.043)(2.027)
Province/year fixed effectYESYESYESYESYESYES
N360360360360360360
R20.8980.8990.8990.9010.9030.904
Note: *, **, *** denote significant at the 10%, 5%, and 1% levels, with standard errors in parentheses.
Table 4. Robustness test results.
VariablesControl City SamplesExcluding OutliersReplacing the
Regression Model
Lagged Variables2SLS
(1) ALP(2) ALP(3) ALP(4) L.ALP(5) ALP(6) ALP(7) ALP
ASS3.859 *7.561 ***2.206 ***8.638 ***6.087 ** 104.128 ***
(2.147)(2.296)(0.777)(2.616)(2.710) (42.559)
L.ALP 0.011 **
(0.004)
Constant−1.234 ***−3.783 ***10.203 ***−3.414 ***−2.822 ***0.400 ***−41.446 *
(2.257)(2.007)(0.770)(1.990)(0.470)(0.066)(22.028)
ControlsYESYESYESYESYESYESYES
Province/year fixed effectYESYESNOYESYESYESYES
N312360360330330330330
R20.9240.9100.3790.9010.913
Note: *, **, *** denote significant at the 10%, 5%, and 1% levels, with standard errors in parentheses.
Table 5. Results of heterogeneity analysis.
VariablesRegional Heterogeneity AnalysisMain Grain Producing Areas or Not
(1) East(2) Middle(3) West(4) Main Area(5) Not Main Area
ASS13.950 ***11.965 ***−7.019 ***25.128 ***8.156 ***
(4.696)(3.643)(1.775)(4.809)(2.779)
Constant−9.043 ***−2.6429.492 ***−7.601 ***0.650
(5.587)(2.651)(1.599)(3.495)(2.677)
ControlsYESYESYESYESYES
Province/year fixed effectYESYESYESYESYES
N13296132204156
R20.8830.9520.9680.9270.950
Note: *** denote significant at the 1% levels, with standard errors in parentheses.
Table 6. Threshold variable tests.
Threshold TypeFstatProbCrit10Crit5Crit1
Single175.950.00037.82546.49178.541
Double129.170.00231.734942.618166.601
Table 7. Results of threshold effect analysis.
VariablesALP
ASS × I (ALP ≤ 5.254)10.859 ***
(2.172)
ASS × I (5.254 ≤ ALP ≤ 8.478)15.102 ***
(2.222)
ASS × I (ALP ≥ 8.478)27.374 ***
(2.298)
Constant12.552 ***
(1.870)
ControlsYES
N360
R20.866
Note: *** denote significant at the 1% levels, with standard errors in parentheses.
Table 8. Moran Index of agricultural labor productivity 2011–2022.
ALP
YearMoran’s I IndexZ Valuep ValueYearMoran’s I IndexZ Valuep Value
20110.117 ***3.4370.00020170.045 **1.8180.035
20120.128 ***3.6620.00020180.029 *1.4660.071
20130.110 ***3.2630.00120190.022 *1.3130.095
20140.100 ***3.0470.00120200.020 *1.3090.095
20150.085 ***2.7350.00320210.0151.1570.124
20160.057 **2.0170.01820220.0131.1030.135
Note: *, **, *** denote significant at the 10%, 5%, and 1% levels, with standard errors in parentheses.
Table 9. Results of spatial measurement model tests.
Model SelectionStatistical Resultp Value
LM testMoran’s I20.3610.000
LM—test—erorr381.9460.000
Robust_LM—test—erorr20.8900.000
LM—test—lag460.4130.000
Robust_LM—test—lag99.3570.000
Wald testWald—SDM/SAR12.170.033
Wald—SDM/SEM11.930.064
LR testLR—SDM/SAR12.520.051
LR—SDM/SEM11.770.067
LR testLR—both/ind33.000.000
LR—both/time418.330.000
Table 10. Spatial durbin model regression results.
VariablesSpatial Fixed EffectTime Fixed EffectSpatio-Temporal Fixed Effect
(1) ALP(2) ALP(3) ALP
ASS6.480 ***1.0457.451 ***
(2.037)(0.640)(2.037)
W × ASS18.473 ***−3.27733.830 ***
(5.416)(5.880)(10.335)
rho0.462 ***−0.318−0.411 *
(0.100)(0.246)(0.241)
ControlsYESYESYES
Total effect7.328 ***1.119 *7.038 ***
(2.109)(0.626)(2.095)
Indirect effect39.307 ***−2.57622.437 ***
(10.362)(4.879)(8.830)
Direct effect46.635 ***−1.45629.474 ***
(10.937)(5.136)(9.187)
N360360360
R20.8230.5950.774
Note: * and *** denote significant at the 10% and 1% levels, with standard errors in parentheses.
Table 11. Spatial durbin model robustness test regression results.
VariablesGeographic Distance MatrixInverse Geographic Distance Square MatrixEconomic Geography Nested Matrix
(1) ALP(2) ALP(3) ALP
ASS7.519 ***8.078 ***7.881 ***
(1.945)(2.027)(1.888)
W × ASS42.330 ***10.982 **26.461 **
(12.345)(4.974)(11.506)
rho−0.772 ***−0.280 ***−0.706 ***
(0.244)(0.102)(0.220)
ControlsYESYESYES
Total effect6.479 ***7.754 ***7.304 ***
(2.107)(2.173)(2.001)
Indirect effect21.435 ***7.077 *12.494 **
(6.654)(3.954)(6.377)
Direct effect27.915 ***14.831 ***19.798 ***
(6.351)(3.736)(6.210)
N360360360
R20.7210.6630.730
Note: *, **, *** denote significant at the 10%, 5%, and 1% levels, with standard errors in parentheses.
Disclaimer/Publisher’s Note: The statements, opinions and data contained in all publications are solely those of the individual author(s) and contributor(s) and not of MDPI and/or the editor(s). MDPI and/or the editor(s) disclaim responsibility for any injury to people or property resulting from any ideas, methods, instructions or products referred to in the content.

