Article

Investigating Cumin Uprooting Dynamics: The Roles of Taproot Properties and Soil Resistance

1
College of Agricultural Engineering, Jiangsu University, Zhenjiang 212013, China
2
Key Laboratory Equipment of Modern Agricultural Equipment and Technology, Ministry of Education, Jiangsu University, Zhenjiang 212013, China
3
Xinjiang Academy of Agricultural and Reclamation Science, Shihezi 832000, China
*
Authors to whom correspondence should be addressed.
Agriculture 2025, 15(9), 940; https://doi.org/10.3390/agriculture15090940
Submission received: 25 March 2025 / Revised: 22 April 2025 / Accepted: 24 April 2025 / Published: 25 April 2025
(This article belongs to the Section Agricultural Soils)

Abstract

:
Cumin (Cuminum cyminum L. cv.′Xin Ziran 1′), classified within an agricultural crop, necessitates uprooting as a critical harvesting process. In this paper, we tried to study the force dynamics behind direct cumin uprooting by developing mechanical models for field uprooting and taproot–soil friction. A mechanical model for cumin uprooting and a friction model between the cumin taproot and sandy loam soil were built. The coefficient of static friction was determined using laboratory experiments. Pull-out, tensile force, and field uprooting experiments were conducted to validate the model. The physical and mechanical properties of the taproot were also measured. DEM simulation was employed for pull-out analysis. The static coefficient of friction between the cumin taproot and sandy loam soil was found to be approximately 0.766. The mechanical model showed high precision (0.4% and 5% error rates). Measured taproot properties included 80.91% moisture content, 0.40 Poisson’s ratio, 15.95 MPa elastic modulus, 5.70 MPa shear modulus, and 3.49 MPa bending strength. A DEM simulation revealed agreement with experimental observations for maximum frictional resistance at pull-out. The minimum resistance was noted at the extraction angle of 60°. The developed mechanical model for cumin uprooting was satisfactory in accuracy. Overcoming initial soil resistance is the primary factor affecting pull-out force magnitude. The optimized extraction angle had the potential to decrease uprooting resistance, improving harvesting efficiency.

1. Introduction

Cumin is a drought-resistant herbaceous annual crop [1,2,3]. Cumin is an important spice crop with high global demand due to the fact that it possesses known medicinal properties such as purported digestive, antibacterial, and antioxidant activity [4]. Cumin is an important source of different nutrients, vitamins, and minerals [5]. Growing consumer interests in international culinary culture have immensely increased the demand for cumin on the global arena, particularly throughout the process foods industry in Europe and North America. Greater use of cumin in snacking seasoning blends, soup bases, and ready-meal packs drives this rise in demand. Cumin is suited to grow in sandy loam soil, which is well-drained and well-aerated, with an adequate supply of oxygen [6]. The cumin, when fully mature, is harvested and dried to bring down its moisture content; threshing and cleaning operations follow to extract the seeds. Efforts have been made in recent years to modify available grain harvesters for cumin harvesting. Yet, mechanical harvesting machinery developed for grain crops has been inadequate for the delicate cumin [7], since it is a low height crop (30–50 cm) and prone to damage, making it necessary to harvest it manually. This leads to expensive labor, extensive time consumption, and low efficiency at harvest. In China’s Xinjiang cotton-producing areas, an intercropping strategy with cumin in cotton has been used to fully utilize the expansive area that is engaged in machine-harvested cotton. The method is designed to enhance land use efficiency, productivity, and economic gains. Cumin produced under plastic film mulching is of reduced height, allowing for ease of uprooting—the preferred mode of its harvesting. Consequently, comprehending the essential mechanics involved in the cumin uprooting process is vital for guiding the advancement of more efficient harvesting technology [8,9,10,11,12,13,14,15,16].
The force needed to uproot a cumin plant from the soil depends greatly on the interaction of its root system and the adjacent soil [17]. As the main anchorage part, the taproot of cumin resists forces attempting to uproot it [18]. Moreover, the soil nature will greatly affect this interaction [19]. The discrete element method (DEM) has, through the years, become the predominant technique of examining soil dynamics under the influence of the action of tools [20,21]. Macroscopic dynamic characteristics are obtained from microscopic and transient mechanical properties by DEM simulation [22,23]. High experimental evidence confirms the validity of the approach [24,25,26,27,28]. Coupling DEM with other simulation software synergistically improves its accuracy and extends its application [29]. The contact model plays an important role in the precision of discrete element method (DEM) simulations. The manner in which soil beds adhere to each other and can be compressed needs an effective selection of contact models. The Hertz–Mindlin contact model and its various sub-models enable the exhaustive consideration of interactions between soil grains with various characteristics and has been proven to be effective in a wide range of studies concerning the behavior of soils [30].
To further comprehend the process of cumin uprooting, in particular the stage of cumin taproot uprooting from the soil, this research employs a combination of experimental and numerical approaches to characterize systematically the material behavior of the cumin taproot, develop and validate mechanical models of the uprooting process, and employ the discrete element method (DEM) to simulate the micro-scale root–soil particle interactions during removal. This study will give basic information of forces participating in cumin uprooting harvesting, leading to the optimization of harvesting methods and also giving both a reference to research on cumin harvesting machines and a method for cumin harvesting dynamics analysis.

2. Materials and Methods

2.1. Research on the Mechanical Model of the Cumin Uprooting Process

This chapter is concerned with the exploration of the inherent mechanical behaviors associated with the cumin uprooting process. To begin, this section will create a mechanical model pertinent to cumin uprooting, studying the primary force parameters. This will be followed by an in-depth exploration of the cumin roots and soil interaction, with particular focus laid on the establishment of the cumin taproot–soil friction model and the identification of applicable friction coefficients. Additionally, the tensile strength of cumin taproot will be quantified to gain the necessary material properties for mechanical modeling of the cumin uprooting mechanism. Last but not least, the established mechanical model will be verified by field uprooting experiments to evaluate its precision and reliability. The primary objective of this section is to establish a foundation mechanical model that will enable further theoretical research and engineering practices.

2.1.1. Establishing a Mechanical Model of Cumin Field Uprooting

As shown in Figure 1, the external form of cumin (Cuminum cyminum L. cv.′Xin Ziran 1′) can be simply generalized into four parts: the seed portion, the branch portion, the stem, and the taproot. When cumin is pulled up vertically, the taproot is the part that interacts with the soil, and the resistance to uprooting originates precisely from this. The slope protection mechanism of vegetation includes the mechanical effects of the roots and the hydrological effects of the vegetation. According to the type of vegetation, the mechanical effects are divided into the reinforcement effect of herbaceous roots and the anchoring and supporting effects of woody roots. The taproot of cumin is similar to the vertical roots of woody plants; thus, the anchoring effect is used to analyze its mechanical effect. Based on experimental observations, although a small amount of soil adheres to the outer surface of the taproot after cumin is pulled out, a taproot channel is formed in the soil, and no arching phenomenon occurs in the soil near the taproot. Therefore, only the frictional force between the cumin taproot and the soil is considered. In summary, as shown in Figure 2, the mechanical model for cumin uprooting is established.
According to Figure 1, the cumin taproot is largely made up of two components: the root apex and the main root. The main root and root apex were equally thick, but they both had few small lateral roots. When shearing occurs in bare soil, the resulting shear stress is governed by Coulomb’s law. If there are roots in the soil, they will surround the ground like fibers, making a root–soil composite, as indicated by Figure 3. During extraction, the cumin’s single taproot with few small lateral roots results in a comparatively small tensile force of the taproot. The adhesion between the taproot and the soil is therefore not sufficient to induce soil shearing. The resistance model must thus primarily take into account the tensile force associated with the taproot. Since the process of extraction is slow and the cumin has negligible mass, the inertial force Fa can be disregarded. Therefore, as indicated in Figure 2, the force required to pull out the cumin is derived as follows:
F = F 1   + G C + F a   + F 2  
In the formula: F—the cumin pulling-out force ( N ), F1—the frictional force between the cumin taproot and the soil ( N ), GC—the gravitational force of the cumin plant ( N ), Fa—the inertial force of the cumin during the pulling process ( N ), and F2—the tensile force of the taproot ( N ).

2.1.2. Establishing the Cumin Taproot–Soil Friction Model

As shown in the cumin taproot–soil friction model in Figure 4, the cumin taproot is analyzed by approximating it as two cylindrical segments. To calculate the friction force of the entire taproot, a differential element in the form of a disc with radius r and thickness dz is considered at a depth z from the soil surface. The lateral pressure exerted by the soil on this differential element is as follows:
d N = K 0 · γ z · 2 π r d z
The frictional force acting on the differential disc element by the soil is
d F 1 = μ d N
Considering the root tip portion as equivalent to a frustum, the resulting friction force between the entire cumin taproot and the soil is
F 1 = 0 Z 2 π r 1 K 0 μ γ z d z + Z Z + Y 2 π r 1 + r 2 r 1 Y ( z Z ) K 0 μ γ z d z
In the formula: r1—the radii of the cumin taproot’s main root ( m ), r2—the radii of the cumin taproot’s tip end ( m ), K0—the lateral earth pressure coefficient, μ—the static friction coefficient between the cumin taproot and the soil, γ—the unit weight of the soil ( N / m 3 ), z—the distance of the micro-disc from the soil surface ( m ), Z—the length of the cumin taproot’s main root ( m ), and Y—the length of the cumin taproot’s tip ( m ).
The cumin taproot is primarily divided into two parts: the main root and the root tip. Both the main root and the root tip have uniform thickness. Therefore, to measure the radii of the main root and root tip ends, the average value is taken as the magnitude of r1 and r2. The soil bulk density γ is 12 , 250   N / m 3 [31]. The lateral earth pressure coefficient can be approximately calculated using K 0 = 1 sin ϕ . The soil type is sandy loam, and the friction angle φ is 10 ° [32]. The static friction coefficient is measured by the inclined plane friction test, and the average value is taken as the magnitude of μ.

2.1.3. Determination of the Static Friction Coefficient Between the Taproot and Sandy Loam Soil

The coefficient of static friction serves as a fundamental physical parameter for both the uprooting mechanical model and the discrete element method (DEM) analysis. It characterizes the magnitude of the frictional force between different materials. The contacting bodies are the cumin taproot and sandy loam soil. A total of ten tests were performed to quantify the static friction coefficient between the taproot and the soil using an inclined plane method friction coefficient measuring device, as shown in Figure 5. The accuracy and least count of the angle measurement is 0.01°. In the test, the cumin taproot and sandy loam soil were used as the friction pair. Soil was taken from around the taproot, and big clods were broken up manually. The soil was then sieved through the assistance of soil sieves, which were classified into two types and had a total of six layers. These layers, in order from top to bottom, had the following aperture sizes: 2 mm (coarse round-hole), and 1 mm, 0.5 mm, 0.2 mm, 0.1 mm, and 0.05 mm (fine round-hole). The sieving equipment is displayed in Figure 6. Three soil samples each weighing 500 g were taken from different points and numbered as soil sample 1, 2, and 3. To obtain the particle size distribution of the soil, sieving was performed on the samples. This involved shaking the sieves for a period of 15 min, then measuring the soil on each of the sieves and recording the values. The sieved soils were then spread in trays and their surfaces leveled.
The adjustment accuracy of angle α is critical for the experiment. To guarantee the precision of the determined values, an inclinometer was employed to measure angle α. In the experimental procedure, the prepared sandy loam soil tray was affixed to the inclined plane method friction coefficient measuring apparatus. The test specimen was placed on the custom-built sandy loam soil tray. By manipulating the roller, one end of the plane was gradually elevated. The inclinometer reading was recorded at the moment the cumin taproot initiated sliding. Ten replicate measurements were taken for the purpose of calculating the average. The static friction coefficient between the taproot and sandy loam soil can be represented as follows:
f s = tan α
In the formula, fs—the static friction coefficient, and α—the angle of the inclined plane with respect to the horizontal at the initiation of taproot slip ( ).

2.1.4. Determination of the Tensile Force of the Cumin Taproot

Tensile testing was performed to determine the tensile force of the cumin taproot, as illustrated in Figure 7. The experiment utilized a UK TA-XT plus texture analyzer with a pre-test speed of 1 mm/s, a test speed of 0.15 mm/s, and a post-test speed of 1 mm/s. The termination criterion was set to stop when a displacement of 10 mm was reached. To prevent shearing of the taproot by the fixture, the clamped portion of the cumin taproot was wrapped with gauze. The measurement was repeated five times to calculate the average tensile force of the cumin taproot. The TA.XT Plus Texture Analyzer is manufactured by Stable Micro Systems Ltd., located in Godalming, Surrey, UK.

2.1.5. Verification of the Friction Mechanics Model for the Cumin Taproot–Sandy Loam Soil Interface

The uprooting simulation of a single cumin taproot is illustrated in Figure 8. A UK TA-XT plus texture analyzer was employed for the experiment, with the following speed settings: 1 mm/s (pre-test), 0.15 mm/s (test), and 1 mm/s (post-test). The termination criterion was a displacement of 60 mm. The preparation involved tightly securing the upper, thicker end of the cumin taproot with plastic rope, the other extremity of which was connected to the probe.

2.1.6. Verification of the Cumin Uprooting Mechanical Model

The cumin field uprooting experiment was conducted as shown in Figure 9. To more accurately calculate the field pull-out force of a single cumin plant, multiple cumin plants were simultaneously pulled out, and the average of the total pull-out force was calculated. To simulate the process of a cumin harvester clamping and uprooting cumin, two steel plates were used to clamp multiple cumin plants for the pull-out. The plastic rope was connected to points A and B on the two steel plates. The horizontal distances from points A and B to the center point O of the steel plates were equal. The angle between the plastic rope at point A and the horizontal plane was 60 ° , and the angle at point B was 30 ° . The two steel plates were fixed and clamped with bolts to secure the multiple cumin plants without touching the ground. Then, the plastic rope was connected to the hook of the Electronic Digital dynamometer, with the pulling direction of the dynamometer forming a 30 ° angle with the horizontal plane. During the experiment, the dynamometer was first set to real-time mode. Then, the cumin was slowly pulled upwards. The measurement was stopped after the cumin was completely detached from the soil. The maximum value among the real-time readings was selected as the experimental value for the pull-out force.

2.2. Determination of the Physico-Mechanical Properties of Cumin Taproot

To mimic how cumin taproots act properly with EDEM 2024, we need to know their physical and mechanical properties accurately. Thus, this section explains the experimental procedures used to get these important details.

2.2.1. Determination of the Wet-Basis Moisture Content of Cumin Taproot

The wet-basis moisture content of the cumin taproot was determined using the oven-drying method. In the experiment, cumin taproots were placed into an iron bowl. The accuracy and least count of the METTLER TOLEDO electronic balance was 0.001 g. The mass of the iron bowl was measured as 59.933 g using a METTLER TOLEDO electronic balance, as shown in Figure 10. The total mass of the cumin taproot and iron bowl before drying m 0 was then measured. These were subsequently placed in a DHG-9053A forced-air drying oven for drying, as illustrated in Figure 11. The temperature employed for thermostatic drying by DHG-9053A forced-air drying oven was 105 °C. The METTLER TOLEDO electronic balance is manufactured by Mettler-Toledo International Inc., headquartered in Zurich, Switzerland. And the DHG-9053A Electrothermal Constant Temperature Blast Drying Oven is manufactured by Shanghai Yiheng Scientific Instrument Co., Ltd., headquartered in Shanghai, China.
After repeated oven drying until a constant total mass was achieved, the dried mass of the cumin taproot and iron bowl m1 was measured. This measurement was repeated 15 times to determine the average wet-basis moisture content of the cumin taproot. The percentage of wet-basis moisture content of the cumin taproot can be expressed as follows:
ω = m 0 m 1 m 0 m × 100 %
In the formula, ω—moisture content, m0—the total mass of the cumin taproot and iron bowl before drying ( g ), m1—the cumin taproot and iron bowl ( g ), and m—the mass of the iron bowl ( g ).

2.2.2. Measurement of Cumin Taproot Poisson’s Ratio

During the tensile test of the cumin taproot, deformation at the gripping points led to inaccurate measurements of length and width before and after testing. Therefore, ten cumin taproots were selected, and a radial compression test was employed to determine the Poisson’s ratio of the cumin taproot, as shown in Figure 12. Poisson’s ratio could be calculated by measuring the longitudinal and thickness deformation of the cumin taproot after applying a load. The experiment was conducted using a UK TA-XT plus texture analyzer with a pre-test speed of 1 mm/s, a test speed of 0.15 mm/s, and a post-test speed of 1 mm/s. The termination condition was set to stop when 10% strain was reached.
The radial (thickness direction) and axial (length direction) deformation of a cumin taproot were measured using a digital caliper with an accuracy of 0.01 mm. This measurement was repeated 10 times, and the average Poisson’s ratio of the cumin taproot was calculated. The Poisson’s ratio of the cumin taproot can be expressed as follows:
v = ε y ε x = D 2 D 1 L 2 L 1
In the formula, v—Poisson’s ratio, εy-Y—direction deformation ( m ), εx-X—direction deformation ( m ), D1—diameter of the initial taproot ( m ), D2—diameter of the post-loading taproot ( m ), L1—length of the initial taproot ( m ), L2—length of the post-loading stem ( m ).

2.2.3. Determination of the Elastic Modulus and Shear Modulus of Cumin Taproot

The elastic modulus E is an important indicator of the ease with which a material deforms. The elastic modulus of the cumin taproot was calculated from its load–displacement curve. According to Hooke’s Law, within the elastic range, the tensile strain of a material is proportional to the normal stress. Therefore, an axial compression test was employed to determine the elastic modulus of the cumin taproot, as shown in Figure 13. The experiment used a UK TA-XT plus texture analyzer with a pre-test speed of 1 mm/s, a test speed of 0.15 mm/s, and a post-test speed of 1 mm/s. The termination condition was to stop when 10% strain was measured. The clamped portion of the cumin taproot was wrapped with gauze to prevent the taproot from being sheared by the fixture.
To determine the average elastic modulus of the cumin taproot, the elastic modulus was measured repeatedly five times. The cumin taproot elastic modulus can be expressed as follows:
E = F b T 1 S Δ L Δ L = L 1 L 2 S = π D 2 4
In the formula, E—elastic modulus ( MPa ), Fb—maximum bearing load of the taproot ( N ), T1—original length ( m ), S—bearing area ( m 2 ), D—taproot diameter ( m ), and ΔL—deformation ( m ).
When an object is subjected to shear force, relative sliding occurs between its different internal layers, causing deformation of the object. The shear modulus quantifies this relationship between shear strain and shear stress. Based on the values of Poisson’s ratio and the elastic modulus of the cumin taproot obtained from the experiments above, the shear modulus of the cumin taproot can be expressed as follows:
G = E 2 ( 1 + v )
In the formula, G—shear modulus ( MPa ), E—elastic modulus ( MPa ), and v—Poisson’s ratio.

2.2.4. Determination of the Bending Strength of Cumin Taproot

When the cumin taproot is pulled from the soil, it involves a bending action. Bending strength is an important mechanical parameter for evaluating the cumin taproot’s resistance to bending deformation and fracture. A three-point bending test was used to determine the bending strength of the cumin taproot, as shown in Figure 14. The experiment used a UK TA-XT plus texture analyzer with a pre-test speed of 1 mm/s, a test speed of 0.15 mm/s, and a post-test speed of 1 mm/s. The termination condition was to stop when 10% strain was measured. The fixed support span for the three-point bending test was 12 mm.
To determine the average bending strength of the cumin taproot, the bending strength was measured repeatedly five times. The cumin taproot bending strength can be expressed as follows:
σ max = M m a x W Z W Z = π d 3 32 M m a x = P L 4
In the formula, σmax—the bending strength ( MPa ), Mmax—the maximum bending moment ( N · m ), WZ—the bending section modulus ( m 3 ), d—taproot diameter ( m ), P—the maximum bending load ( N ), and L—the fixed support span for three-point bending ( m ).

2.3. Discrete Element Method Analysis of the Taproot–Sandy Loam Soil Interaction Mechanism

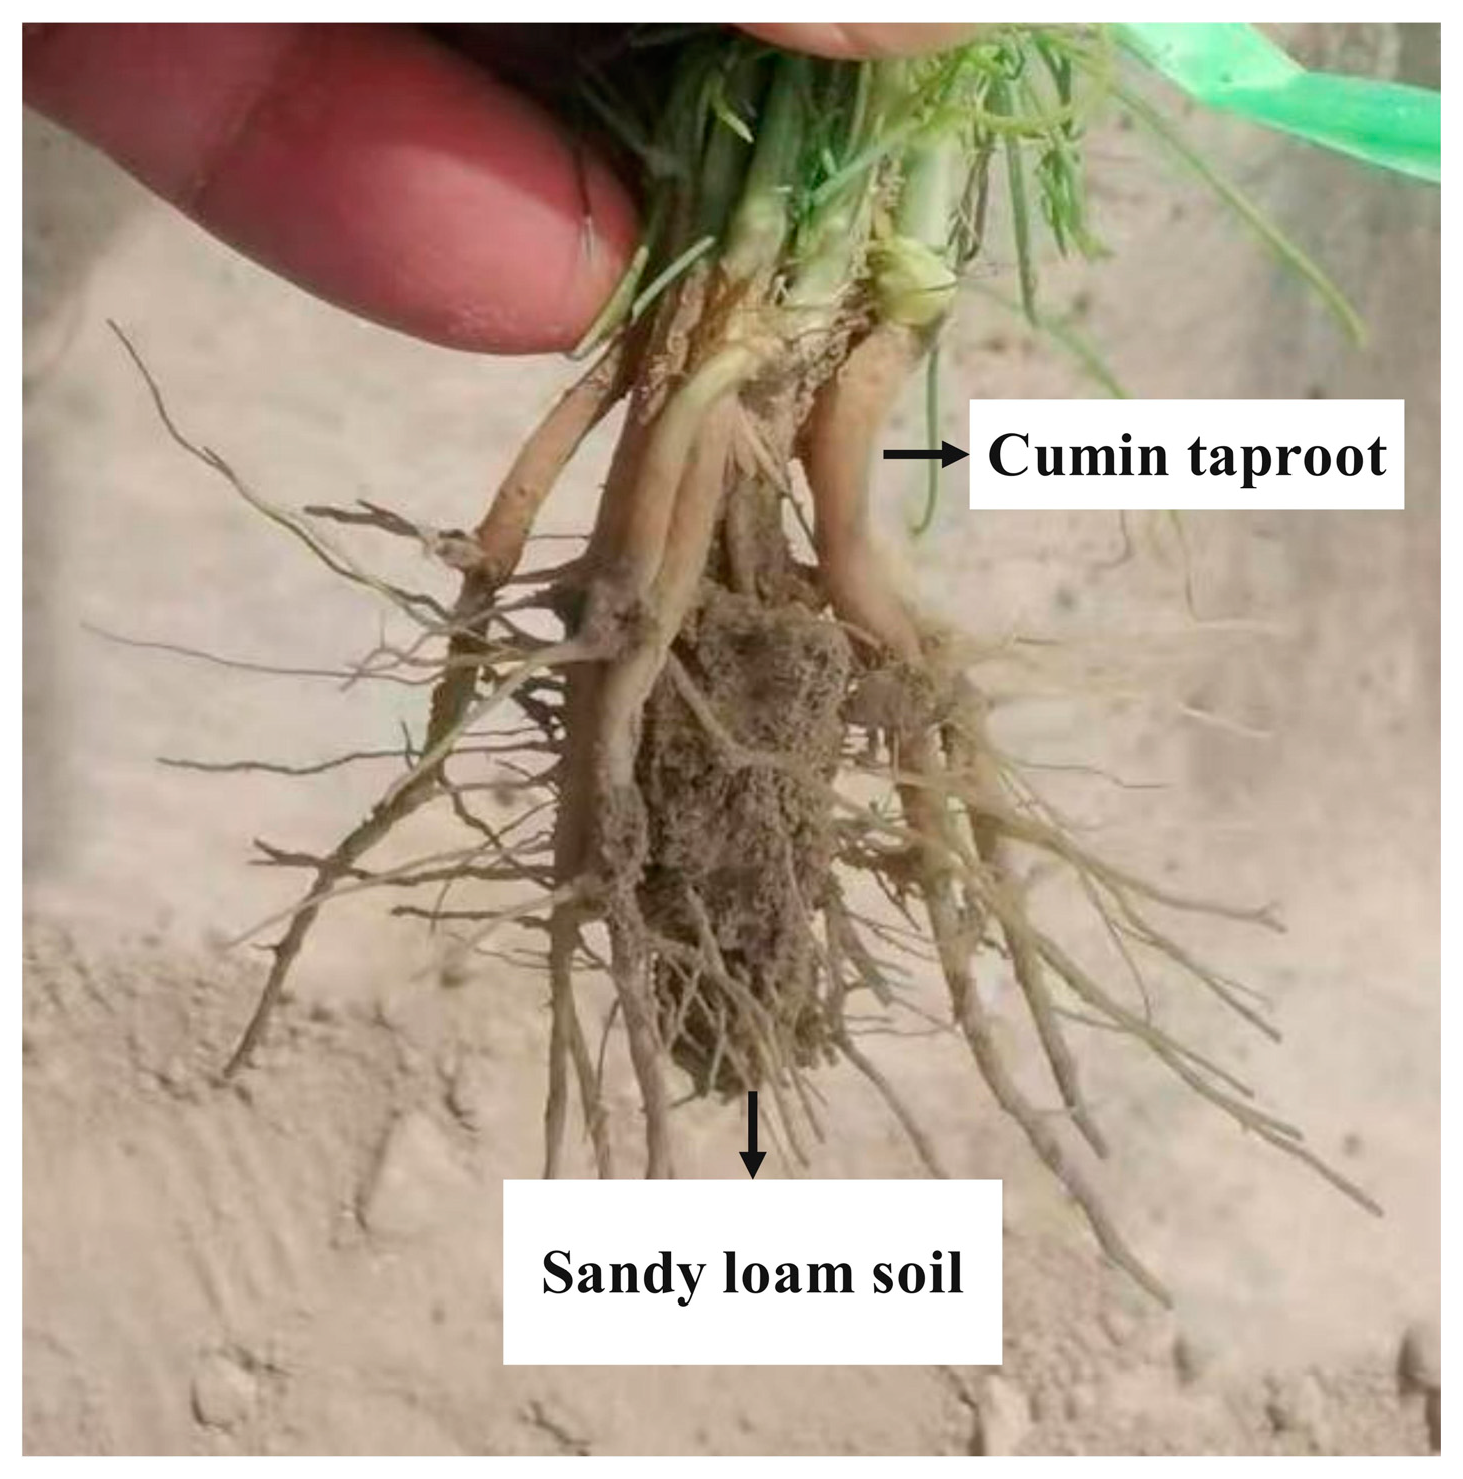
The root–soil complex of cumin is a versatile composite material structure, which is formed through the process of adsorption between cumin taproot and sandy loam soil particles, together with water and air. Due to the influence of the cumin taproot, the interparticle forces within the root–soil complex differ from those in bare soil. Specifically, the cohesive forces between soil particles and the adhesive forces between soil particles and the root are significantly enhanced within the complex, as illustrated in Figure 3. Therefore, the adhesive forces need to be accorded careful consideration during the process of uprooting. The process entails overcoming the interparticle adhesive forces that end up destroying the cohesive bonds and bring about the changes in deformation and movement dynamics in the soil and the root.
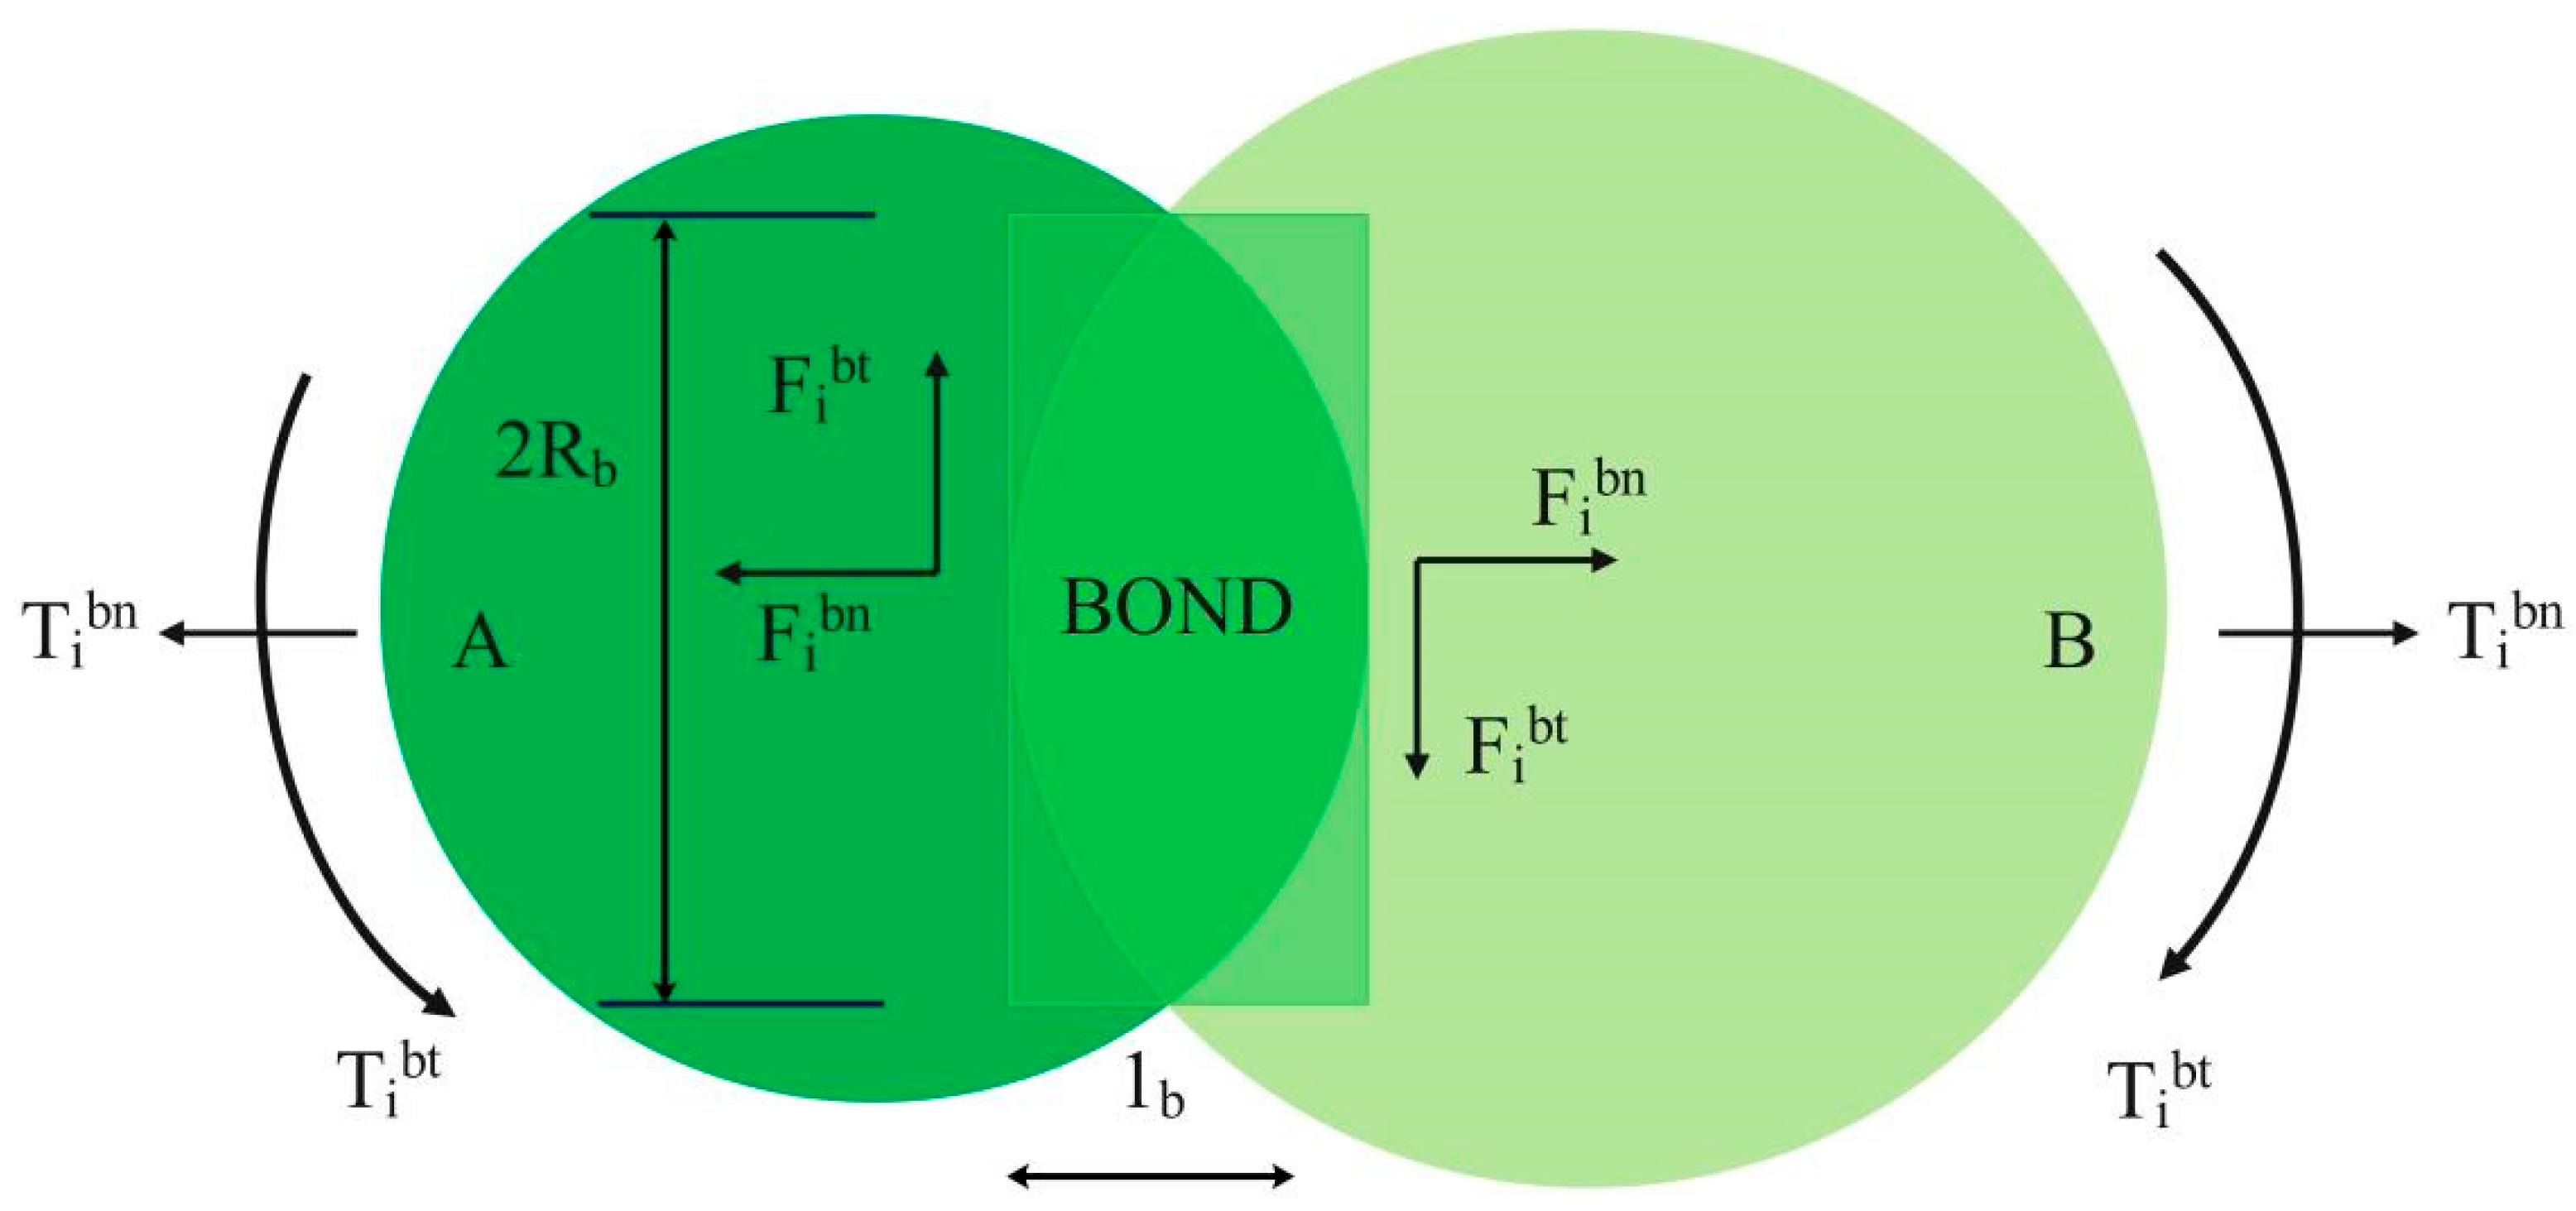
Internal friction force, cohesive force, and adhesive force are significant soil parameters that determine the resistance while performing field operations. The internal friction force is developed due to the relative motion of the soil particles and is a common force inherent in the soil matrix. Cohesive force is the intermolecular force between adjacent particles that is developed due to the liquid bridges between the soil particles. Adhesive force refers to the intermolecular forces that enable mutual adsorption between various materials. The Hertz–Mindlin theoretical contact model includes a range of contact models that can effectively investigate the interaction dynamics between soil particles of varying characteristics. The Hertz–Mindlin model with bonding V2 is particularly valuable in examining the bonding behavior of particles in soil within the root–soil complex, where the particles are held together by bonds that limit their normal and tangential forces, as illustrated in Figure 15. The direction of the force determines the application of the forces on particles. If the normal and tangential forces reach beyond preset threshold values, the bonds will be broken, and interparticle forces can be determined using the typical Hertz–Mindlin contact model, as demonstrated in Figure 16.
According to Newton’s Second Law, the dynamic equation of a soil particle is
m i Δ v Δ T = F i b + F i c + F i h + m i g J i Δ ω Δ T = T i b + T i c
In the formula, mi—the mass of the particle ( kg ), Δv—the increment in particle velocity ( m / s ), Δω—the increment in particle angular velocity ( rad / s ), ΔT—the increment in time ( s ), Ji—the polar moment of inertia of the particle ( m 4 ), Fib—the interparticle bonding force ( N ), Fic—the interparticle contact force ( N ), Fih—the liquid bridge force generated by the presence of water in the soil ( N ), Tic—the contact torque ( N · m ), and Tib—the bonding torque ( N · m ).
Given the prominence of bonding interactions among soil particles within the root–soil composite, the analysis of interparticle bonding forces is of paramount importance. The mobilization of soil particles during cumin extraction induces deformation in both the soil particles and the bonding structures. The mathematical expressions for calculating the bonding force and bonding torque experienced by individual soil particles are presented as follows [33].
F i b = F i b n + F i b t = F i 0 b n + Δ F i b n + F i 0 b t + Δ F i b t T i b = T i b n + T i b t = T i 0 b n + Δ T i b n + T i 0 b t + Δ T i b t Δ F i b n = k n A Δ δ n = k n A v n Δ t Δ F i b t = k t A Δ δ t = k t A v t Δ t Δ T i b n = k t J b Δ θ n = k t J b ω n Δ t Δ T i b t = k n J b 2 Δ θ t = k n J b 2 ω t Δ t A = π R b 2 J b = 1 2 π R b 4
In the formula, ΔFibn—increment of interparticle normal force ( N ), ΔFibt—increment of interparticle tangential force ( N ), ΔTibn—increment of interparticle torsional moment ( N · m ), ΔTibt—increment of interparticle bending moment ( N · m ), vn—interparticle relative normal velocity ( m / s ), vt—interparticle relative tangential velocity ( m / s ), ωn—interparticle relative normal angular velocity ( rad / s ), ωt—interparticle relative tangential angular velocity ( rad / s ), kn—normal stiffness ( N / m 3 ), kt—tangential stiffness ( N / m 3 ), Δt—time step ( s ), Rb—bond radius ( m ), Jb—moment of inertia of the bond cross-section ( kg · m 2 ), and A—interparticle contact area ( m 2 ).
The maximum shear stress and normal stress under adhesive action can be explained by beam theory. If the shear stress and normal stress exceed a pre-selected critical stress value, the adhesive bond will break [34], and the calculation formula is as follows:
τ c = F i b t A + T i b n J b R b τ m a x σ c = F i b n A + 2 T i b t J b R b σ m a x
In the formula, τc—shear stress ( P a ), τmax—maximum shear stress ( P a ), σc—normal stress ( P a ), and σmax—maximum normal stress ( P a ).
In the process of cumin uprooting, the cumin uprooting energy balance equation is established based on the quasi-static fracture energy balance theory:
W P = W C + J s A s + Ω
The less energy WP needed to uproot cumin from the soil, the more easily the cumin can be separated from the soil, hence making the processes of clamping, picking, and conveying easier. Equation (14) indicates that in order to reduce this energy WP need, one must minimize both the total of the soil surface energy and the inelastic strain energy included in the uprooting of cumin. These energies are mainly generated in the process of uprooting. The uprooting of cumin causes the links within the soil to break, leading to the breaking of the soil linked with the root–soil complex, at which point the cumin is pulled out from the soil. The mechanical analysis of soil particles shows that it is necessary to increase the velocity of soil particles to enable the breaking of these bonds. Hence, it is necessary to investigate the influence of soil particle velocity on the process of cumin uprooting.
Since cumin extraction occurs underground and is under the control of intricate interactions between the taproot and sandy loam soil, coupled with constraints on experimental conditions and measurement technology, it is hard to measure precisely the interactive dynamics between the taproot and sandy loam soil, along with the effect of the uprooting process on root–soil movement patterns through conventional methods that blend theoretical analysis and empirical experimentation. Thus, the investigation of the process of uprooting using simulation is of critical importance. The discrete element method (DEM) enables us to investigate root–soil movement dynamics and root–soil interaction on a micro-structural scale. Presently, researchers have utilized the DEM extensively to develop soil models with the aim of examining the interactions between soil and machinery during various operations like subsoiling, excavation, and shoveling. Laboratory tests on soil physical properties indicate that, when as a separate body composed of numerous tiny particles, there exists a definite adhesion force among soil particles. It is quite important for the interaction between the soil and equipment. The Hertz–Mindlin contact model with bonding V2 can simulate the bonding phenomenon between soil particles very well. It includes both normal and tangential contact forces that may result in the agglomeration and bonding of particles. Following bonding, bonds are formed at the interface of the particles, as indicated by Figure 15, which causes the cohesion of small particles into large masses of material. As soon as the externally applied force is greater than the critical value of the bonding force, it will result in the crushing and fracturing of the material.
In order to achieve a correct root–soil composite DEM model, the DEM model parameters need to be calibrated separately for the root, the soil, and the root–soil contact model. The DEM has been widely used in the establishment of soil models, thus, there are a broad variety of relatively well-established research methodologies for calibrating the parameters of the soil DEM model [35,36,37]. Based on the calibration techniques of soil DEM model parameters used by domestic and foreign researchers, the parameters of the soil DEM model can be obtained accurately.
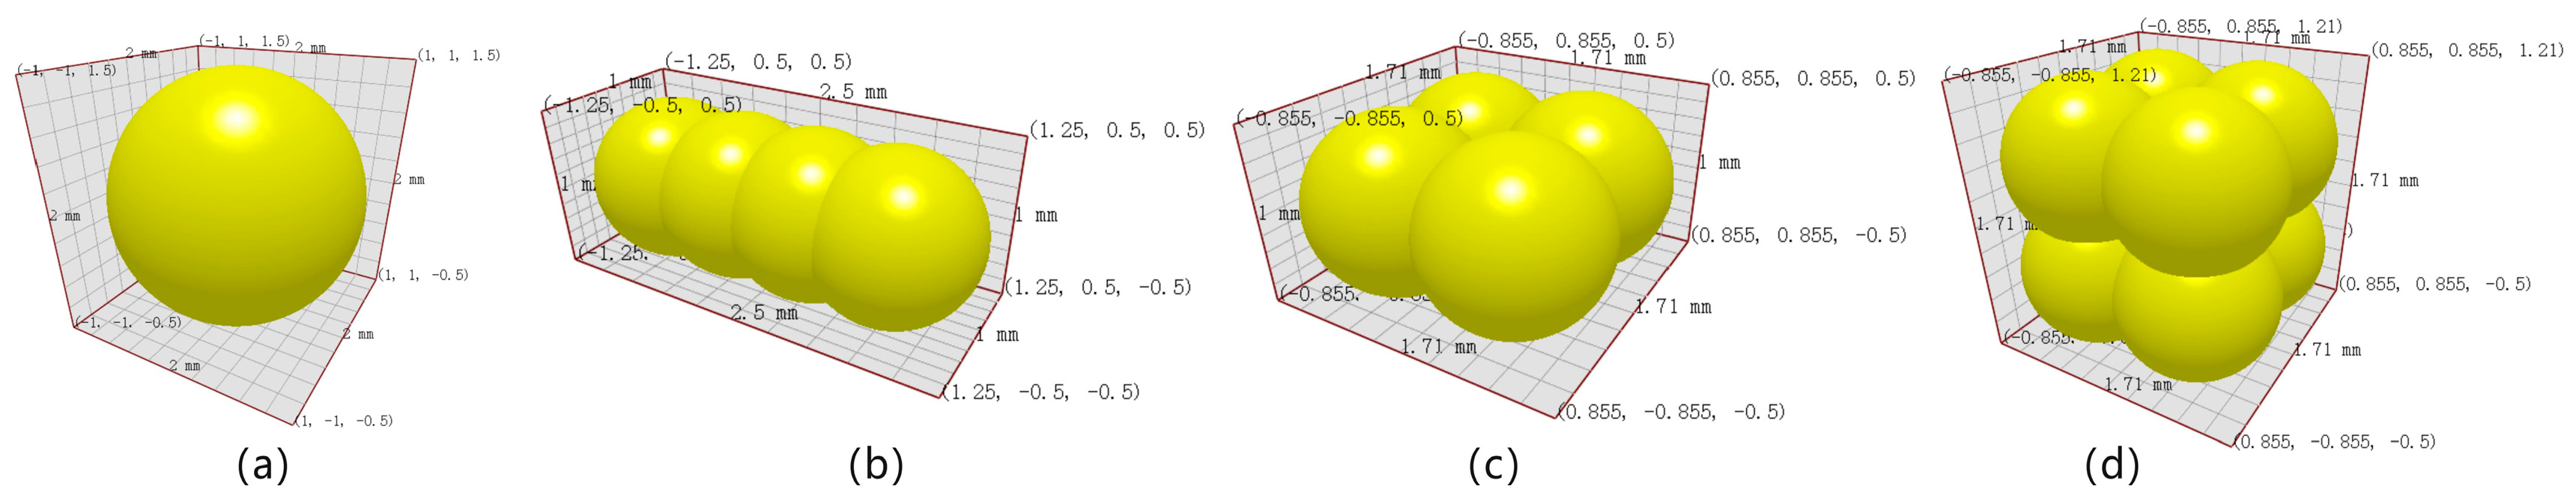
With the non-similar and random shapes of the soil particles, the clumped particle method is adopted in this research to develop four various soil particle models with different shapes as presented in Figure 17; the discrete element method (DEM) parameters of Xinjiang sandy loam soil [31,32] are listed in Table 1.
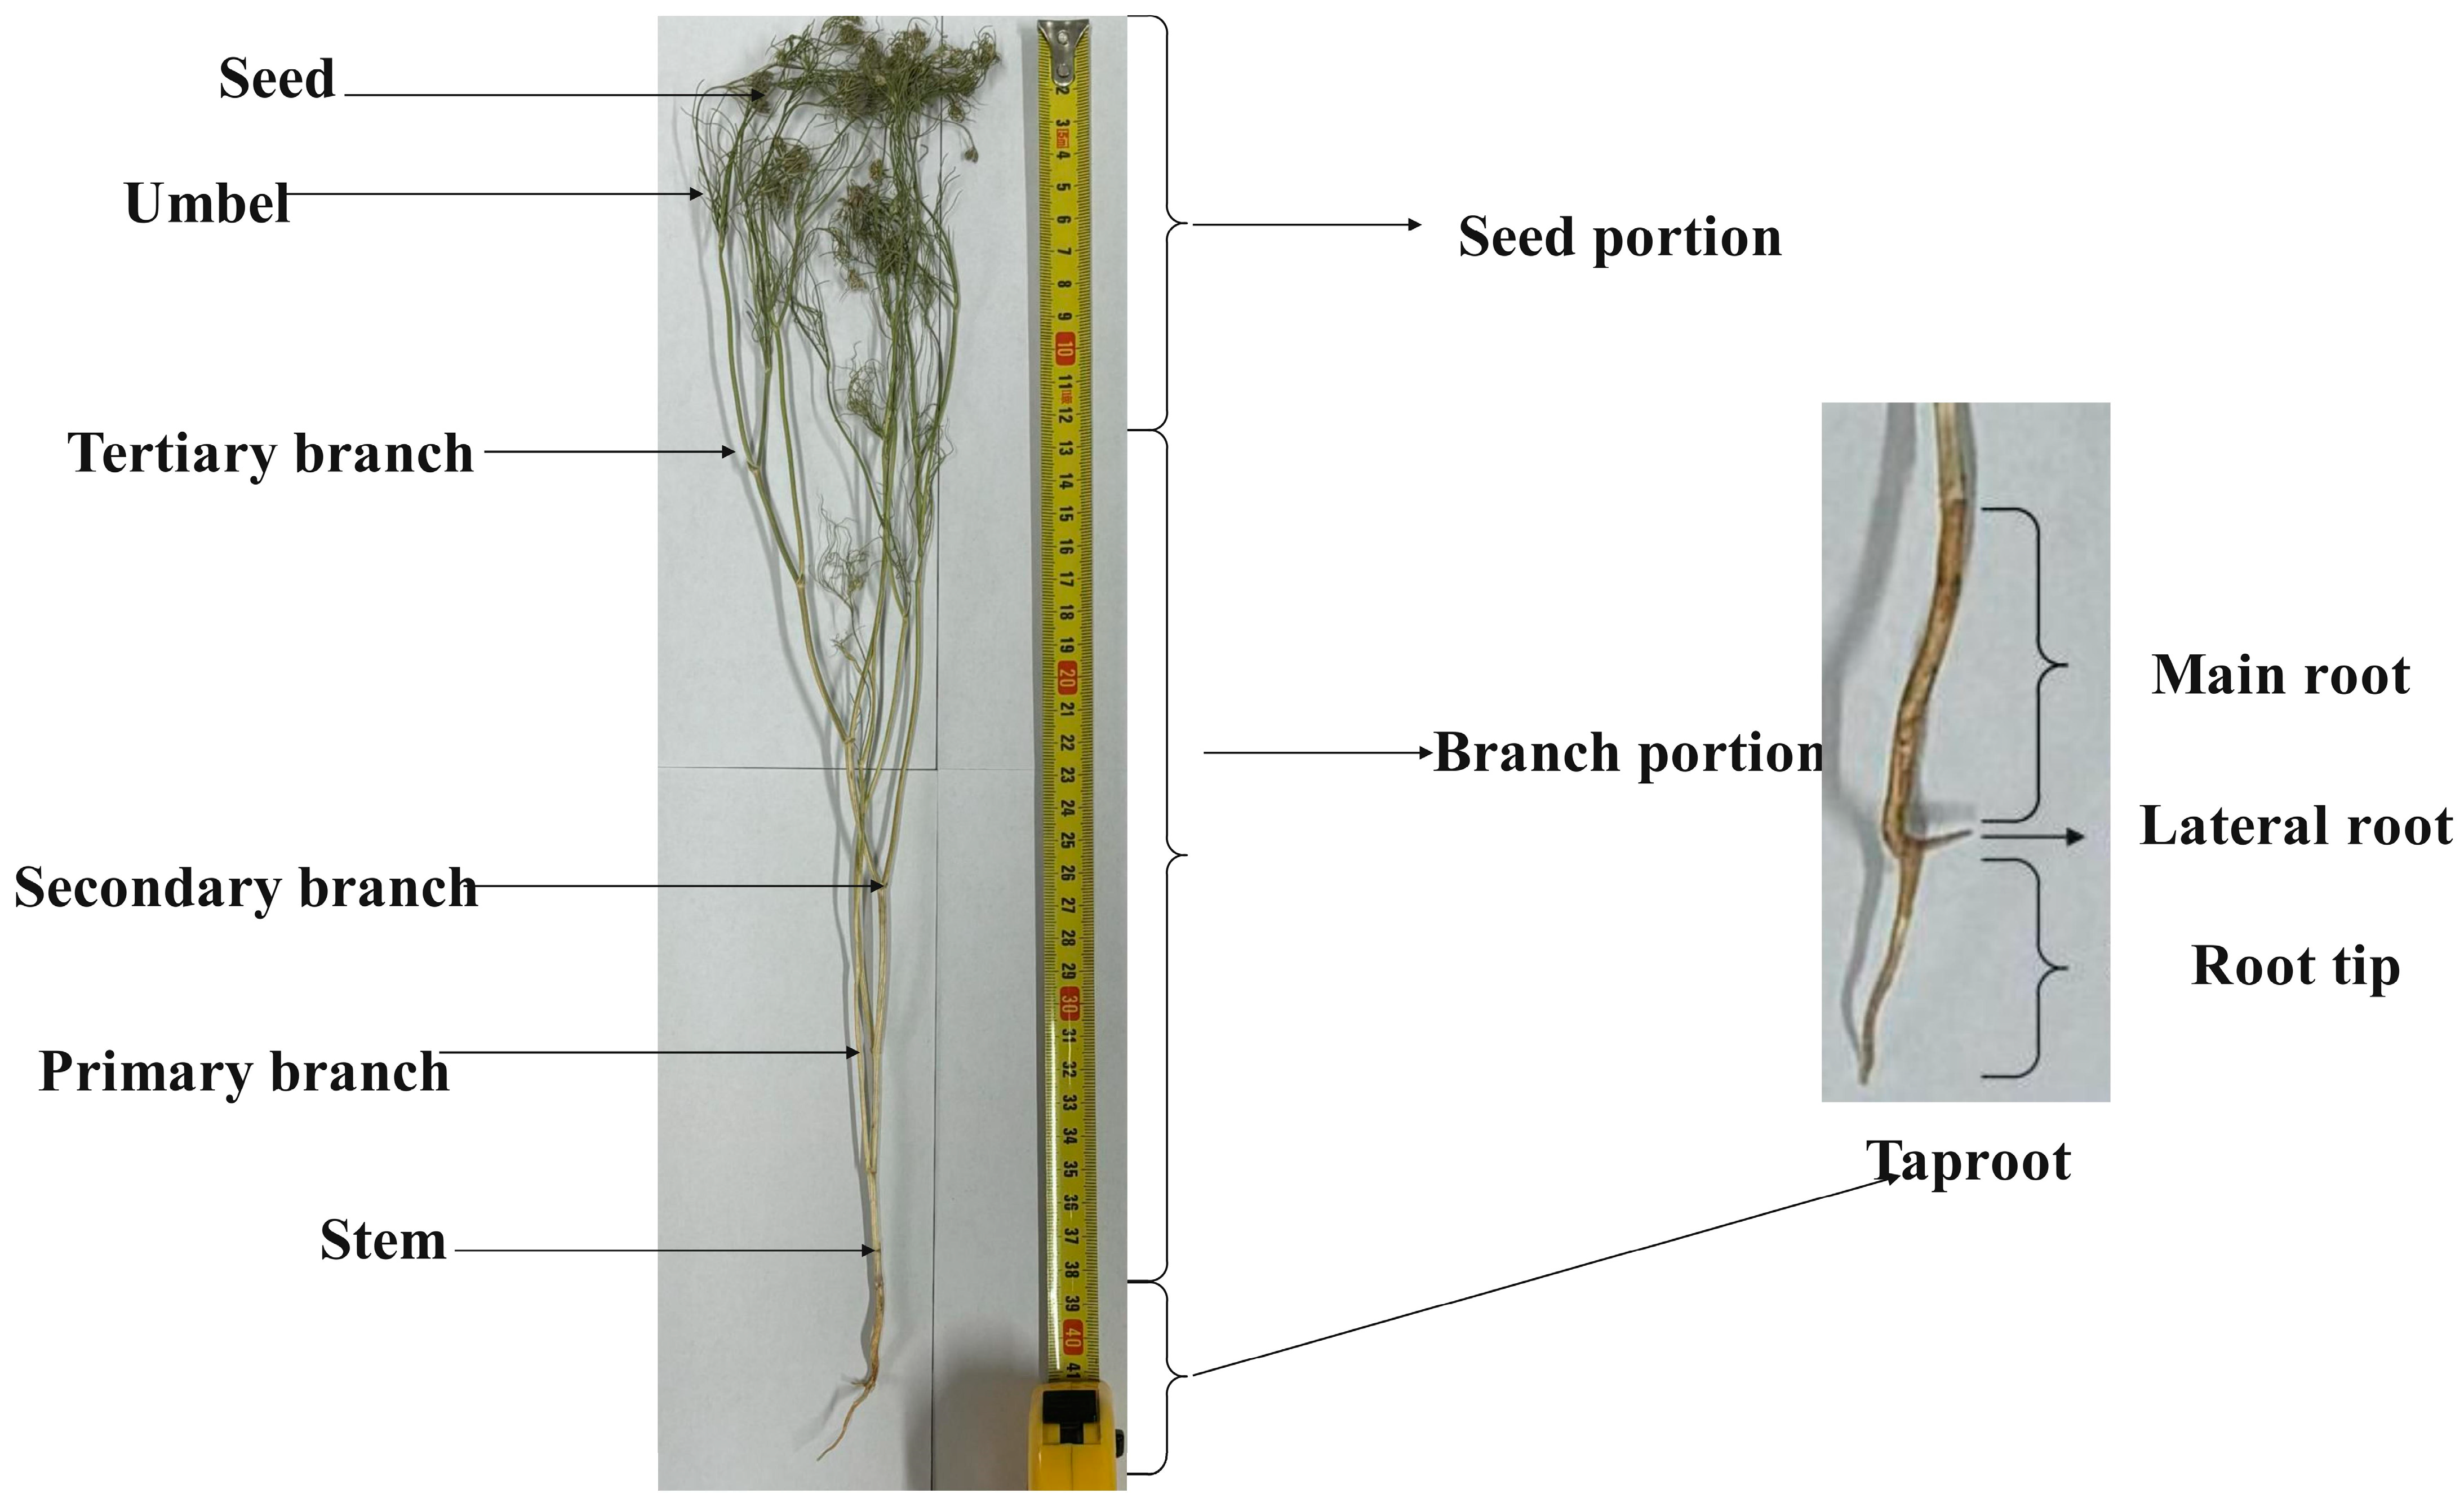
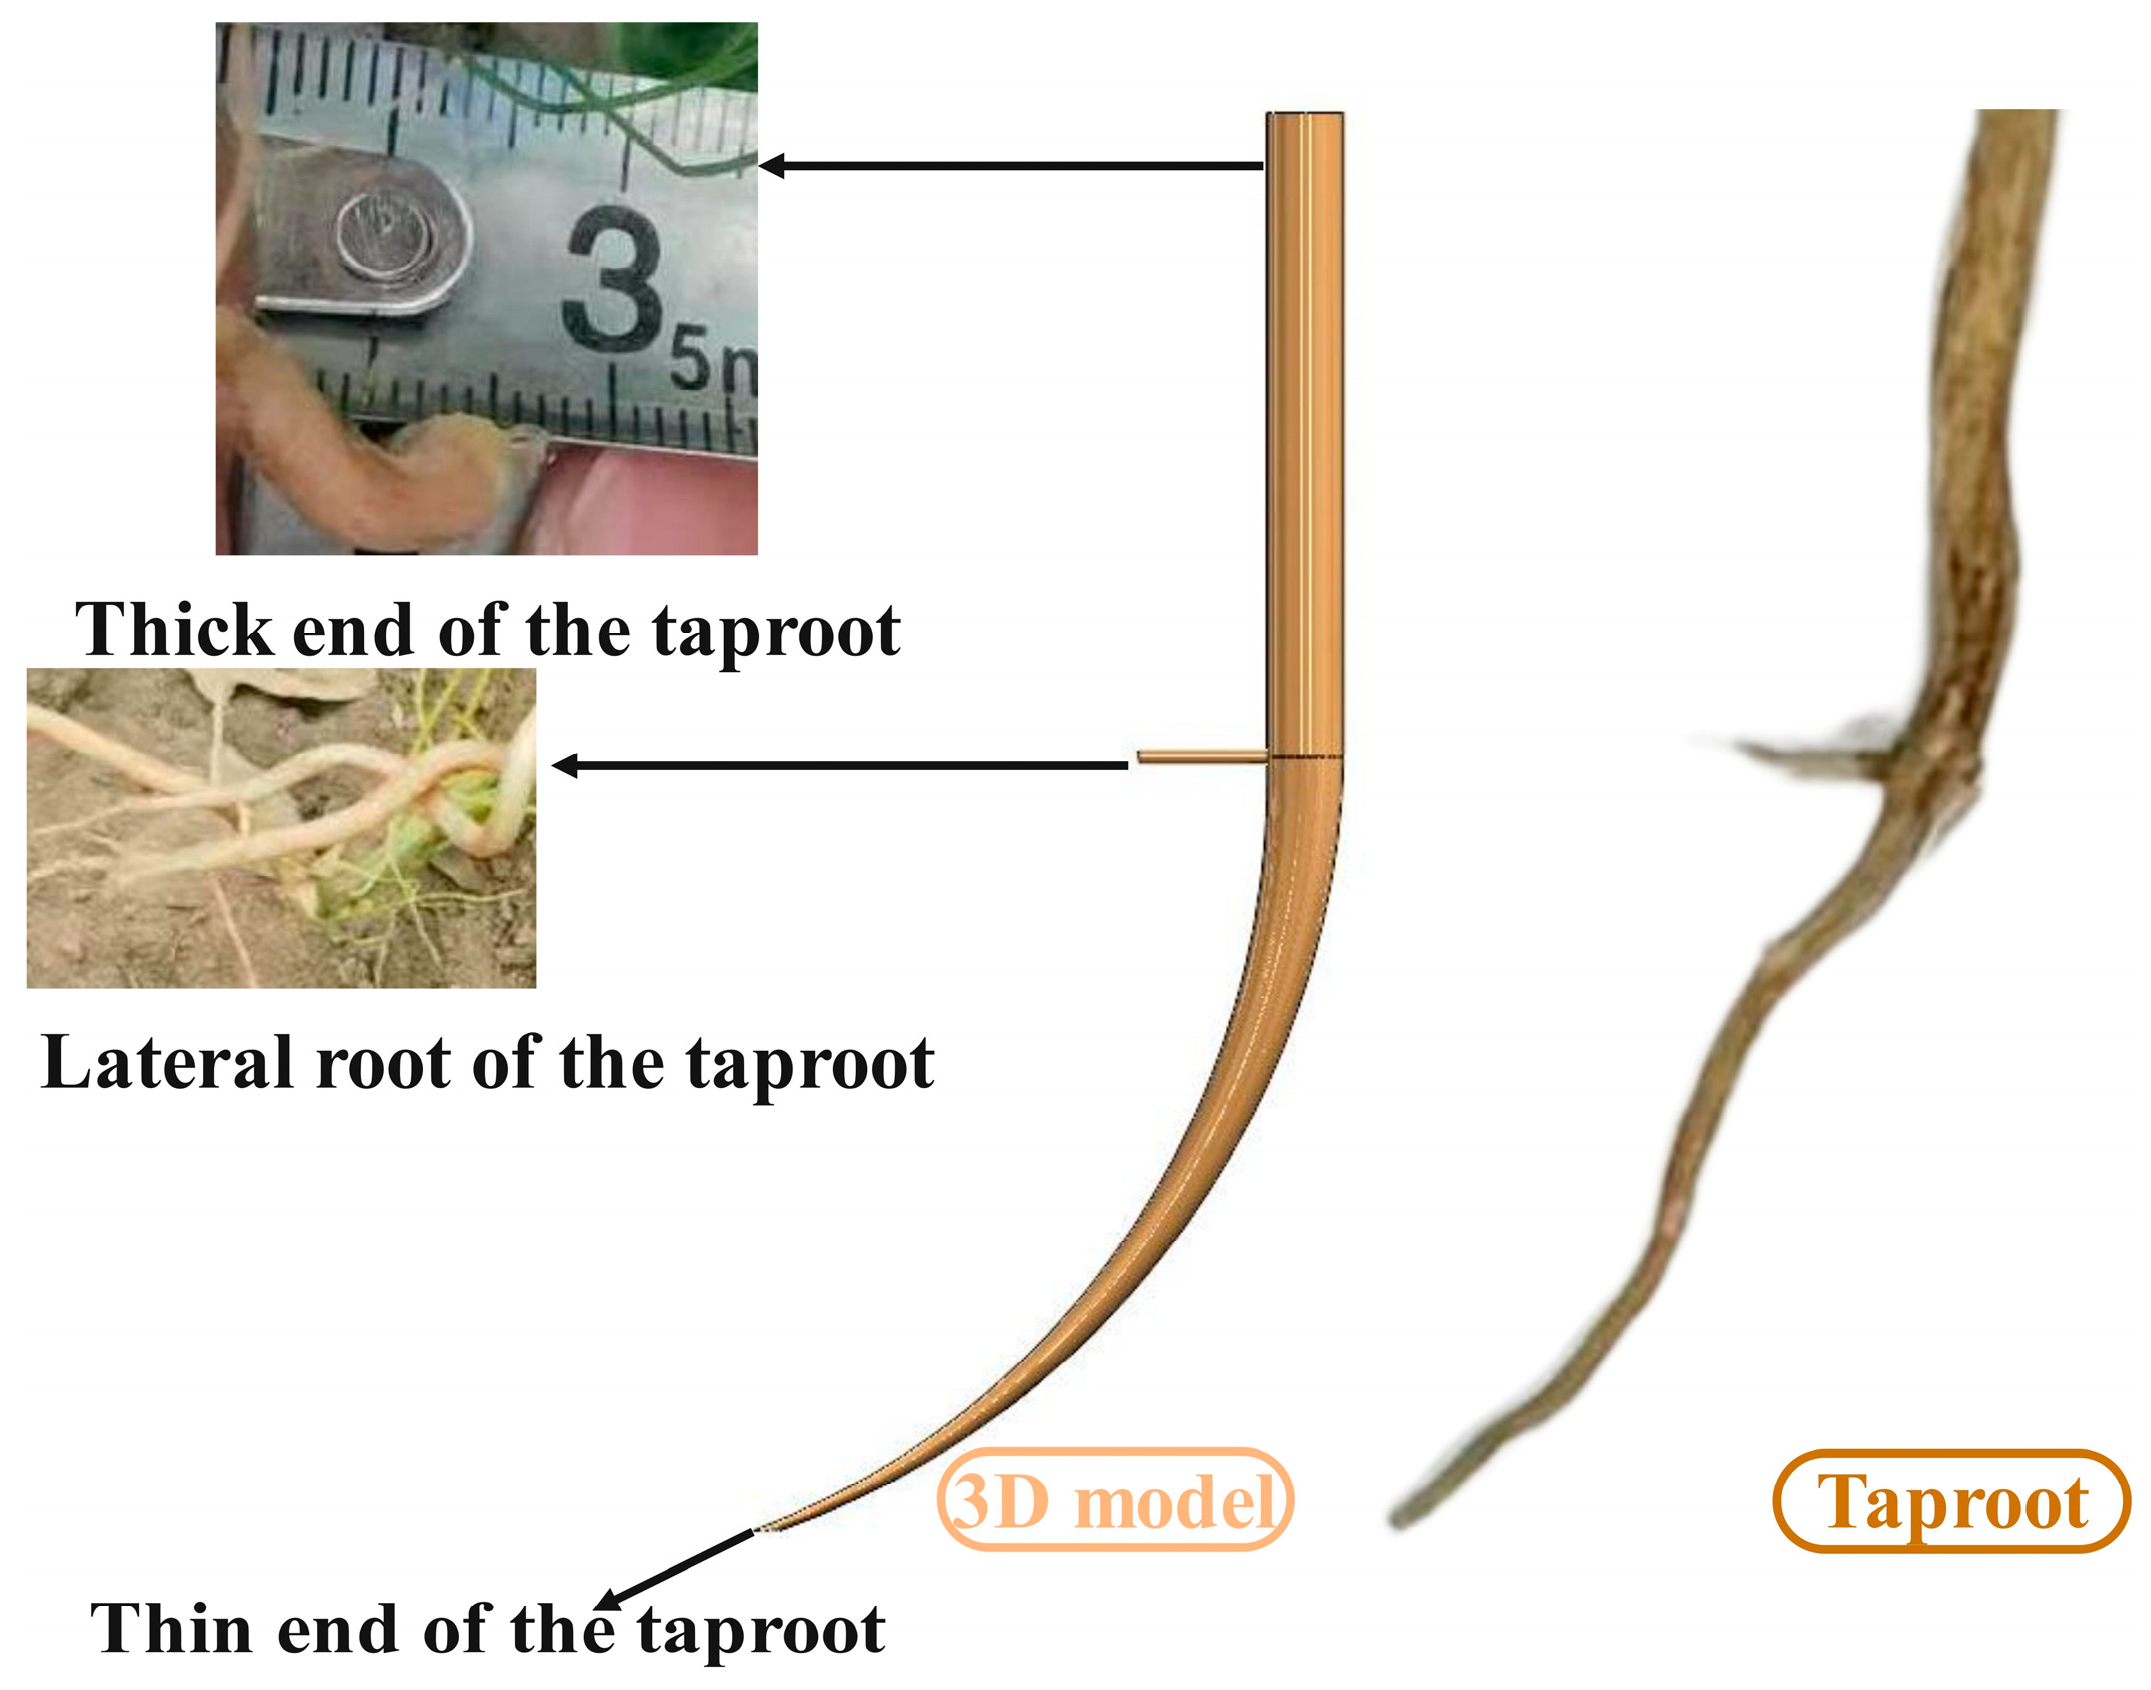
Statistical analysis of the dimensional parameters of mature, ready-to-harvest cumin taproots revealed them to be approximately slender, slightly curved, and tapered cylinders, predominantly featuring a single small lateral root. Specifically, the diameter of the thick end of the taproot is 3 ± 0.5 mm, the diameter of the thin end is 1 ± 0.5 mm, and the diameter of the lateral root is approximately 1 ± 0.5 mm. Consequently, the cumin taproot was treated as a slightly curved cylinder with a thick-end diameter of 3 mm, a thin-end diameter of 1 mm, and a depth of 55 mm. The cumin taproot 3D model was then created using SOLIDWORKS 2023 software based on these dimensions, as shown in 
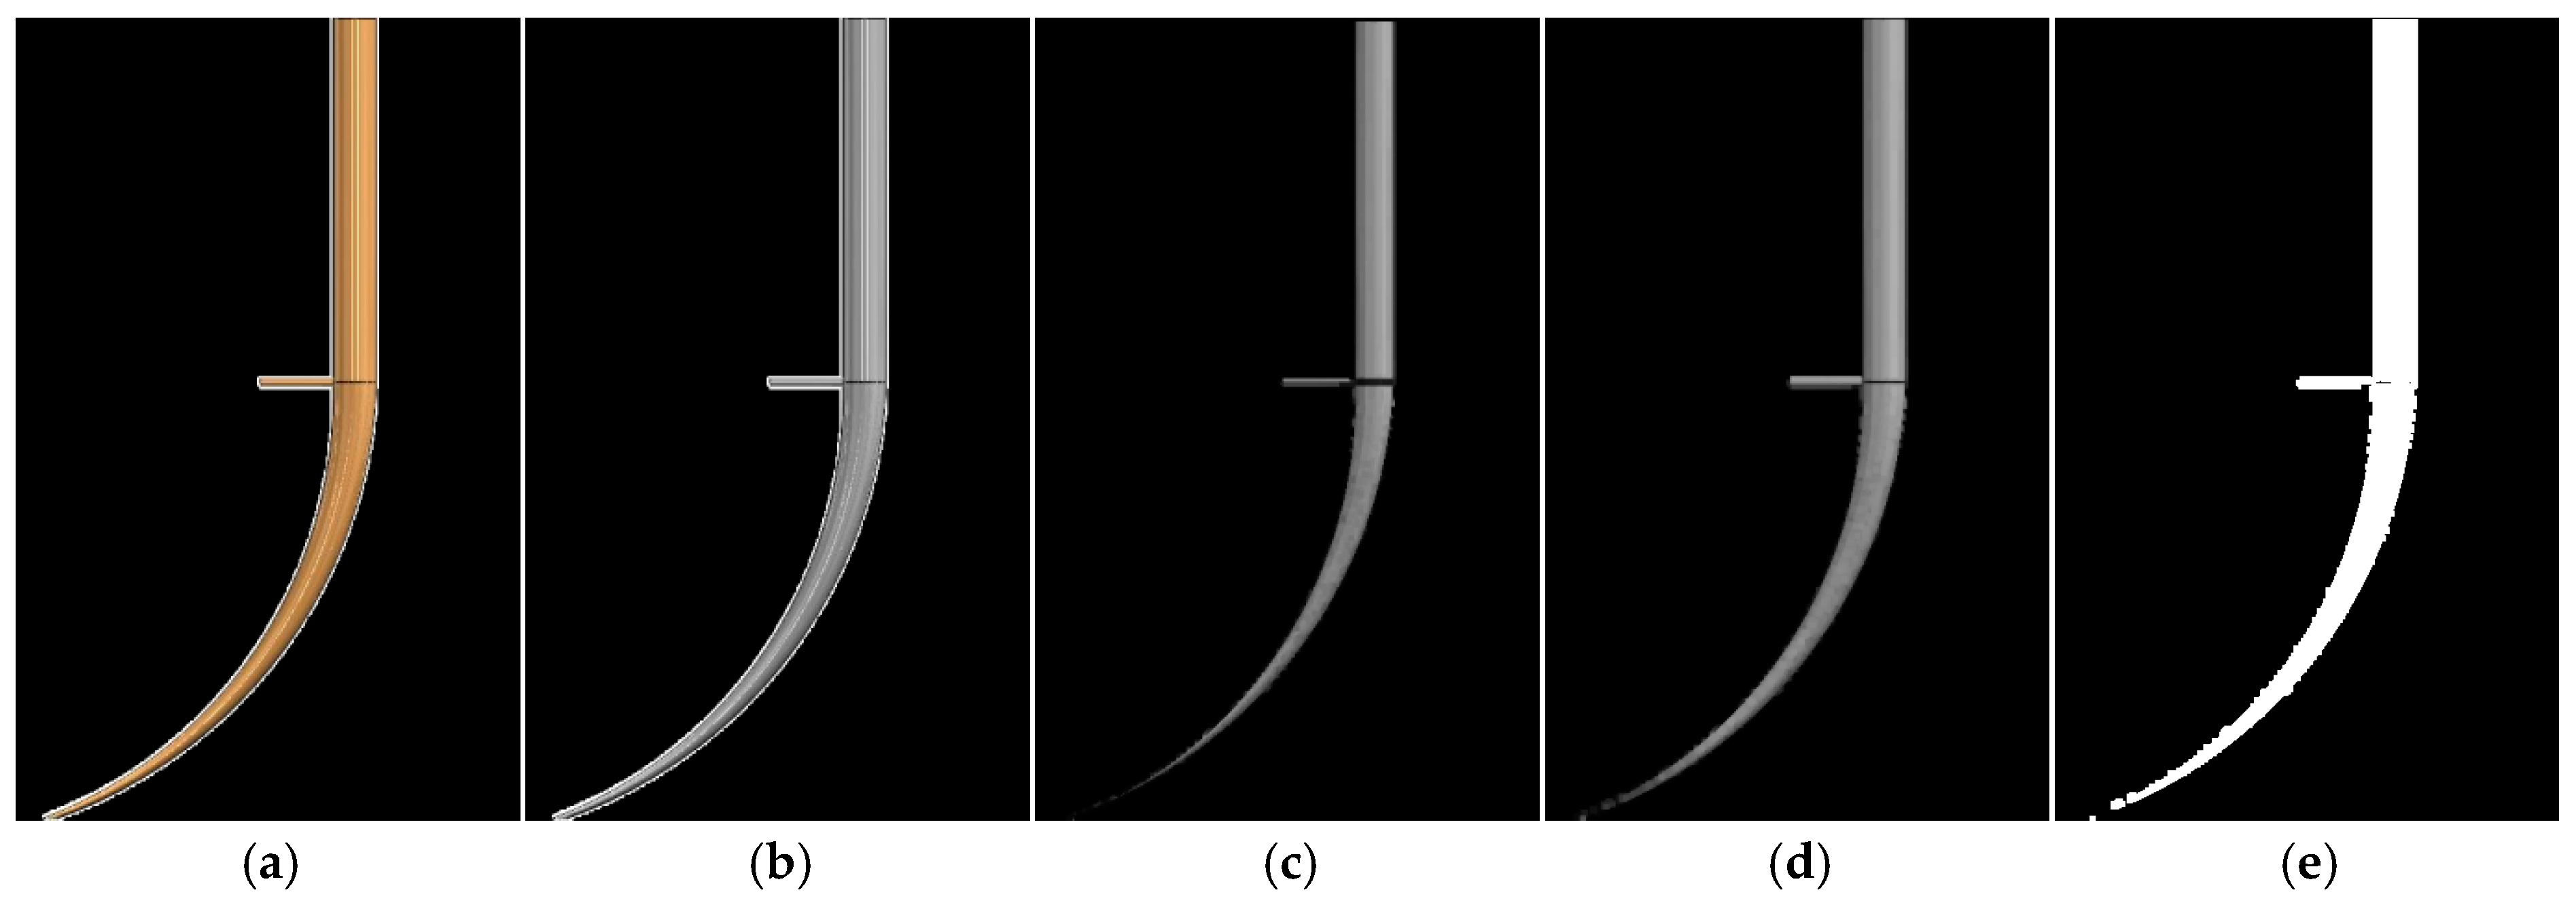
Figure 18. To verify the accuracy of the cumin taproot 3D model, MATLAB R2022a was employed to extract and compare the contour curves of both the 3D model and the actual taproots.
The images were first preprocessed, including grayscale conversion, erosion, dilation, and binarization, as shown in Figure 19 and Figure 20. Subsequently, the contours of the binarized images were extracted, and the coordinates of the points on the contours were obtained. Contour curves of the images were then plotted in Figure 21, and scatter plots of the coordinates of the points on the contours were generated for comparative analysis.
Both the taproot profile curve and the taproot 3D model profile curve show a downward tendency from left to right, and there is a sharp decline for both curves at about X = 270 along the X-axis. There is a relatively stable vertical distance between the taproot profile curve and the taproot 3D model profile curve along most of their lengths, suggesting similar shapes with the same vertical displacement. In spite of the presence of minor local discrepancies in details, the two curves show a high level of similarity and precision, as manifested in their macro trend stability, coincidence of significant feature points, and comparatively stable vertical shift. This observation corroborates a fundamental agreement in their macroscopic structure, prevailing direction, and inherent characteristics.
Through the application of contact detection algorithms together with a cohesive contact model, EDEM software has the capability to calculate the forces on particles [38]. The Hertz–Mindlin with JKR Cohesion model, hereinafter known as the JKR model, is one such cohesive contact model derived from the Hertz contact model. This model considers the effect of cohesive forces between particles in wet conditions on their motion and is particularly appropriate for simulating materials with high adhesion and agglomeration caused by forces such as electrostatic attraction and water, which is suitable for soil and agricultural products. Because of this, the JKR model was selected to represent the contact mechanics between the cumin taproots and sandy loam soil. The JKR model includes surface energy in particle interactions. When the root–soil particle interactions are modeled using the JKR contact model, it is observed from Equation (15) that the force required for detachment of the two types of particles is a function of the liquid surface tension and the wetting angle. Interparticle adhesive forces are significant to model, and surface energy is used by the JKR model for modeling these adhesive forces.
F p = 2 π γ s cos ( τ ) R i R j
In the formula, Fp—the force required for separating the two particles (N), τ—wetting angle ( ), and Ri, Rj—particle radius ( mm ).
Parameter calibration of the established cumin taproot discrete element model (DEM) is crucial for its accurate construction [39,40,41,42,43]. Intrinsic material properties and contact properties, such as elastic modulus and coefficient of friction, were directly measured using the direct measurement method. The final modeling parameters were determined by calibrating the model against real-world experiments using virtual simulations. The calibrated parameters for the cumin taproot DEM are listed in Table 2.
Hertz–Mindlin with the bonding V2 contact model primarily includes seven bonding parameters: normal stiffness per unit area, normal range, shear stiffness per unit area, shear range, normal strength, shear strength, and bonded disk scale. Normal stiffness per unit area represents the bonding strength between sandy loam particles normal to the contact surface. Higher values imply a greater ability of the particles to resist compression and tension. Shear stiffness per unit area indicates the bonding strength between sandy loam particles parallel to the contact surface. Higher values signify a greater resistance of the particles to sliding. Stiffness parameters govern the extent of deformation within the elastic range of the bond. Range parameters define the limits of the bonding force. Strength parameters determine the critical threshold for bond breakage. The bonded disk scale influences the area of the bonding effect. Reliable bonding parameter settings employed in the DEM simulation are detailed in Table 3.
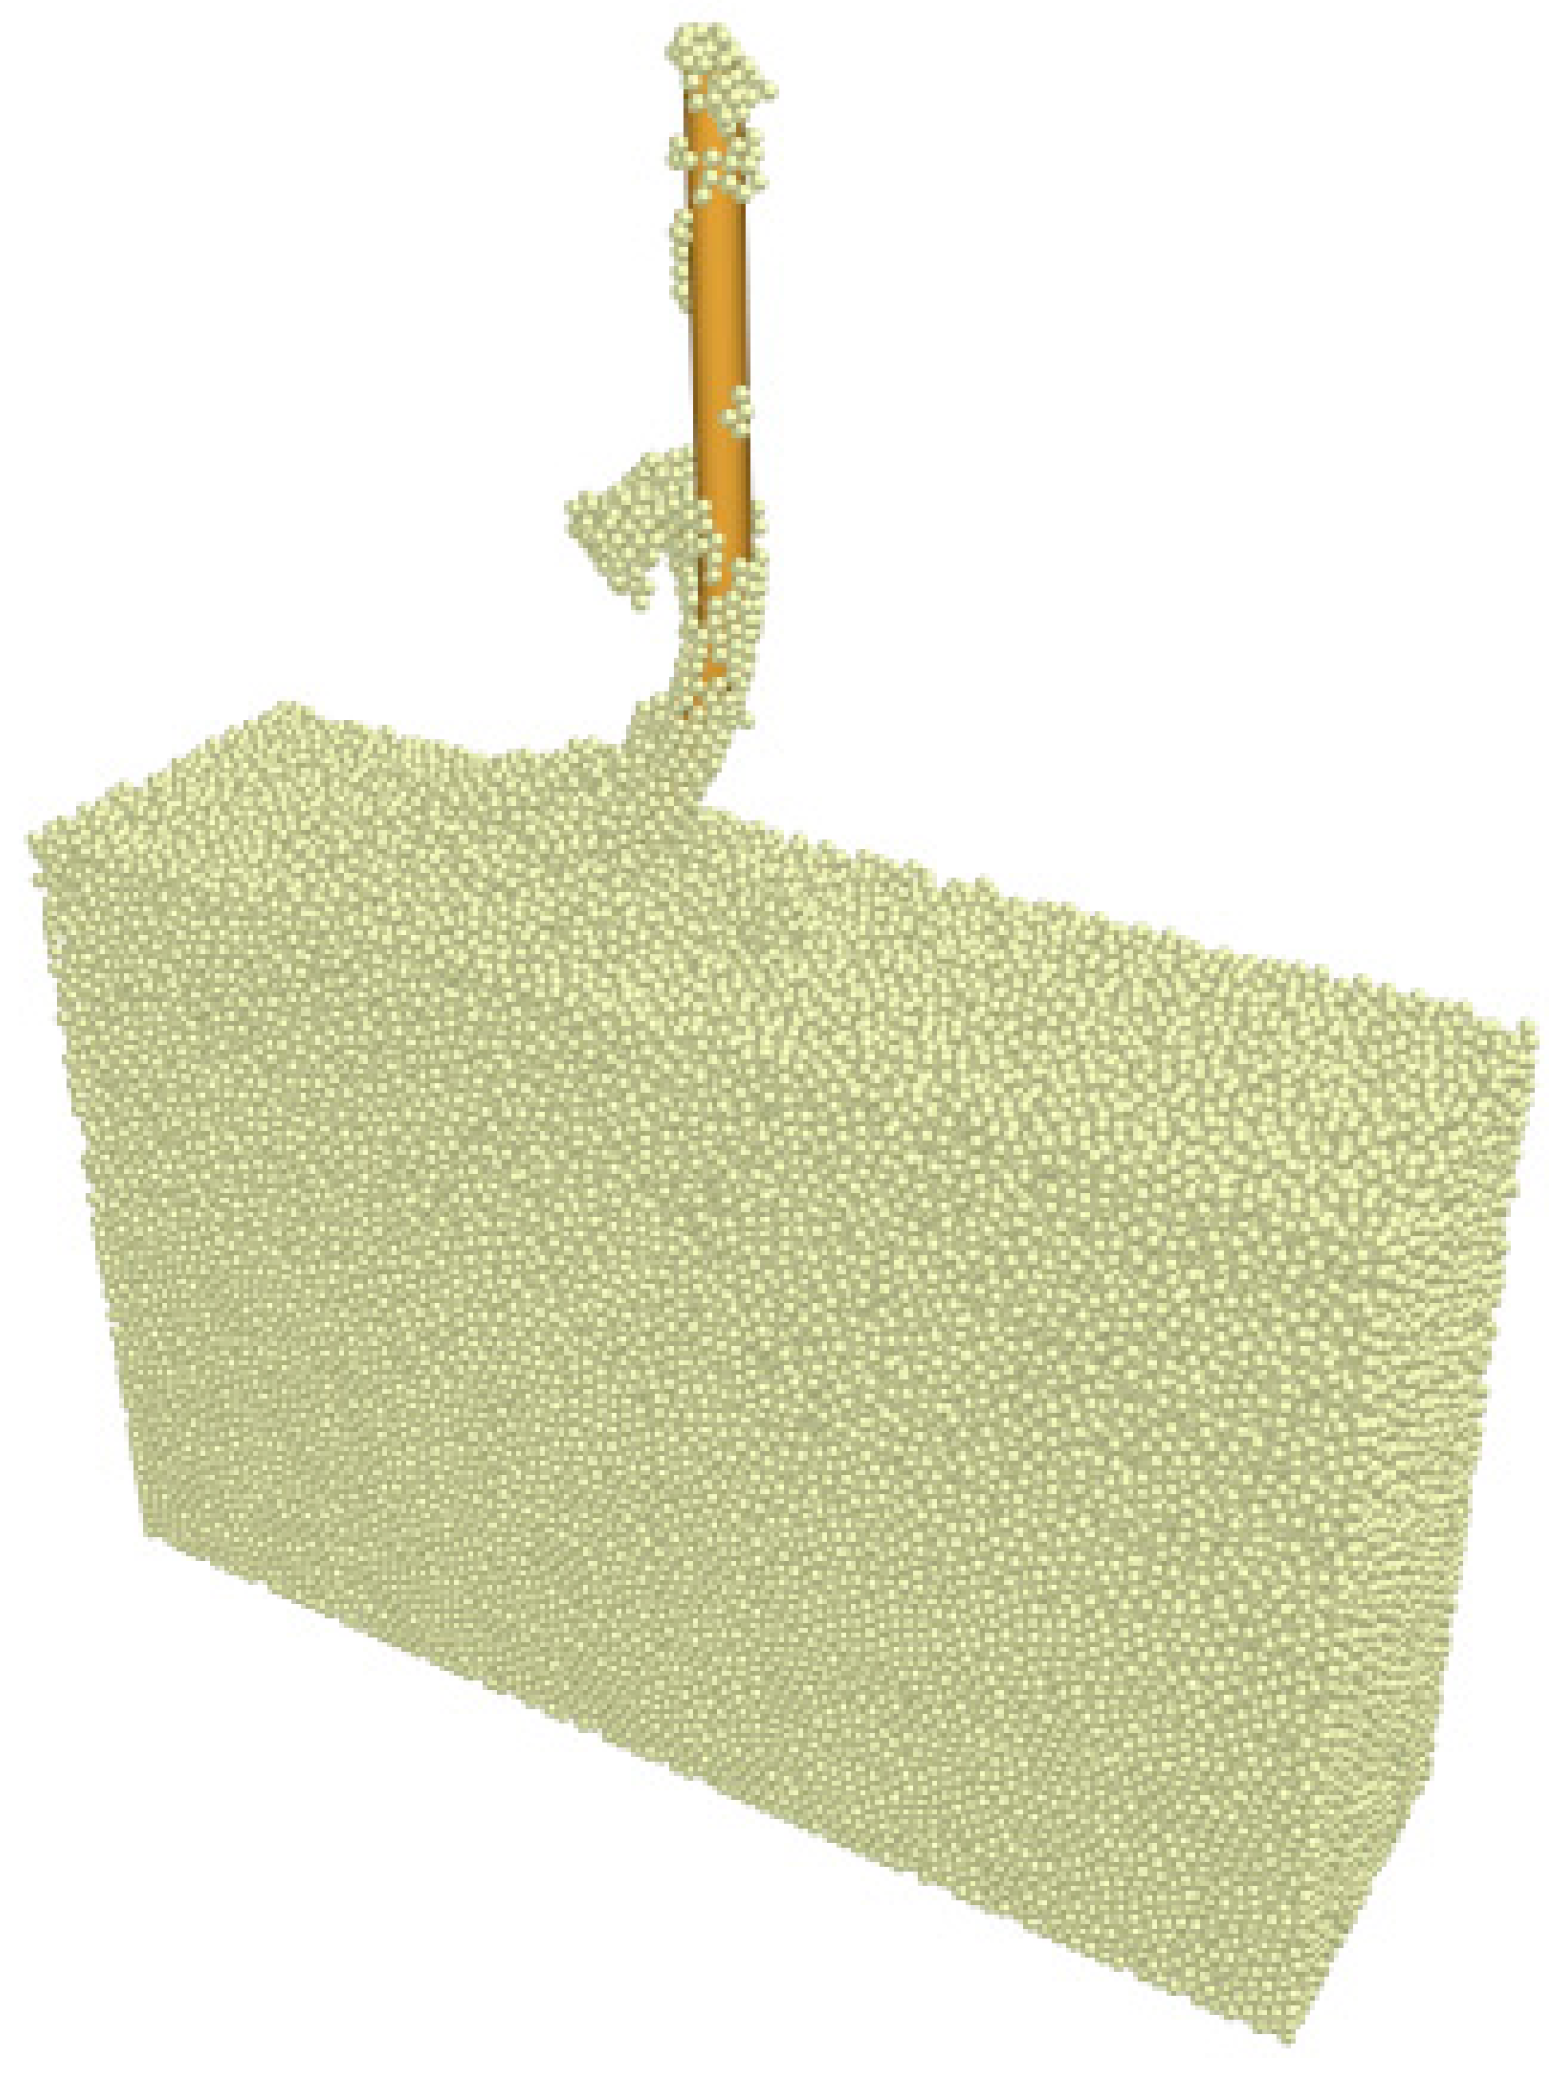
The composite DEM soil bin model for cumin taproot in sandy loam soil is illustrated in Figure 22. Using EDEM 2024, forces and motion can be added to the cumin taproot, and the resultant combination of vertical and horizontal movement constitutes the extraction process. The extraction angle and speed are modified by adjusting the magnitudes of the vertical and horizontal velocities.
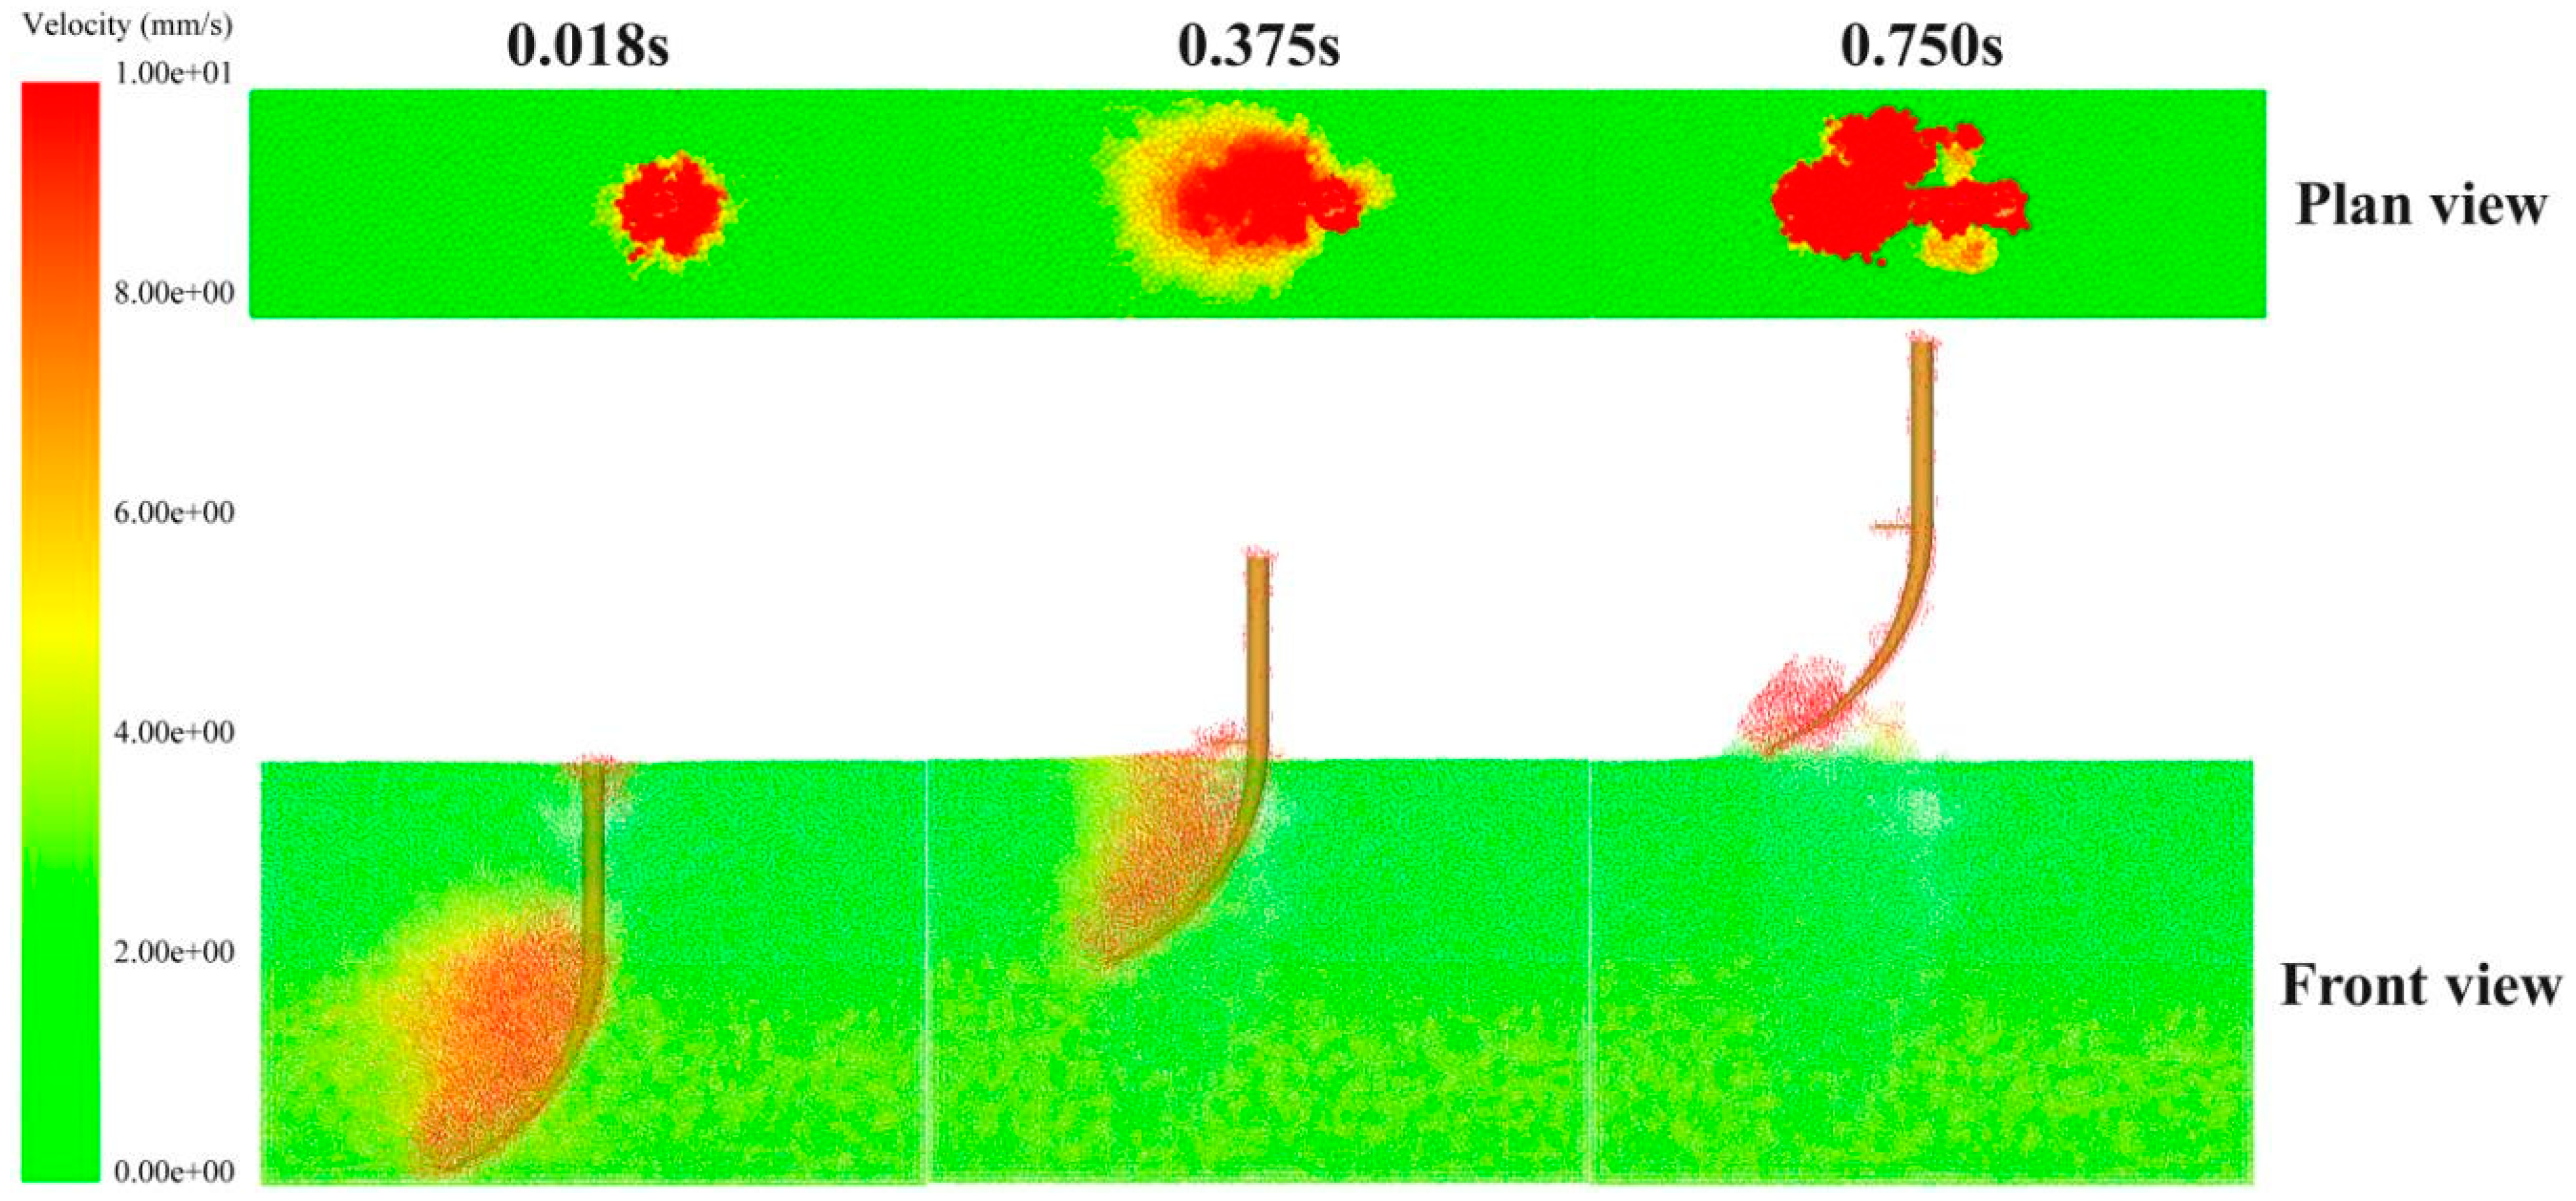
As shown in Figure 23, an upward extraction force was applied to the cumin taproot until it detached from the soil surface. During the initial stage of the extraction process, due to the surface energy between the root and the soil, the soil moved with the root until the bond between soil particles fractured, ultimately achieving root–soil separation. However, some soil particles still adhered to the surface of the extracted cumin taproot. The entire extraction process is consistent with the actual field extraction of cumin.
In the cumin taproot–sandy loam composite DEM soil bin model, motion constraints were applied to the cumin taproot. In the ’Dynamics’ module, the extraction force and angle of the cumin taproot were set, and a ’Force Controller’ motion type was added. The extraction angle was set to 90 ° , and the extraction speed was set to 7.8   cm / s . In the solver, the time step was set to 20%, the total simulation time was set to 0.75 s, and the cell size in the solver mesh was set to 3 R · min .
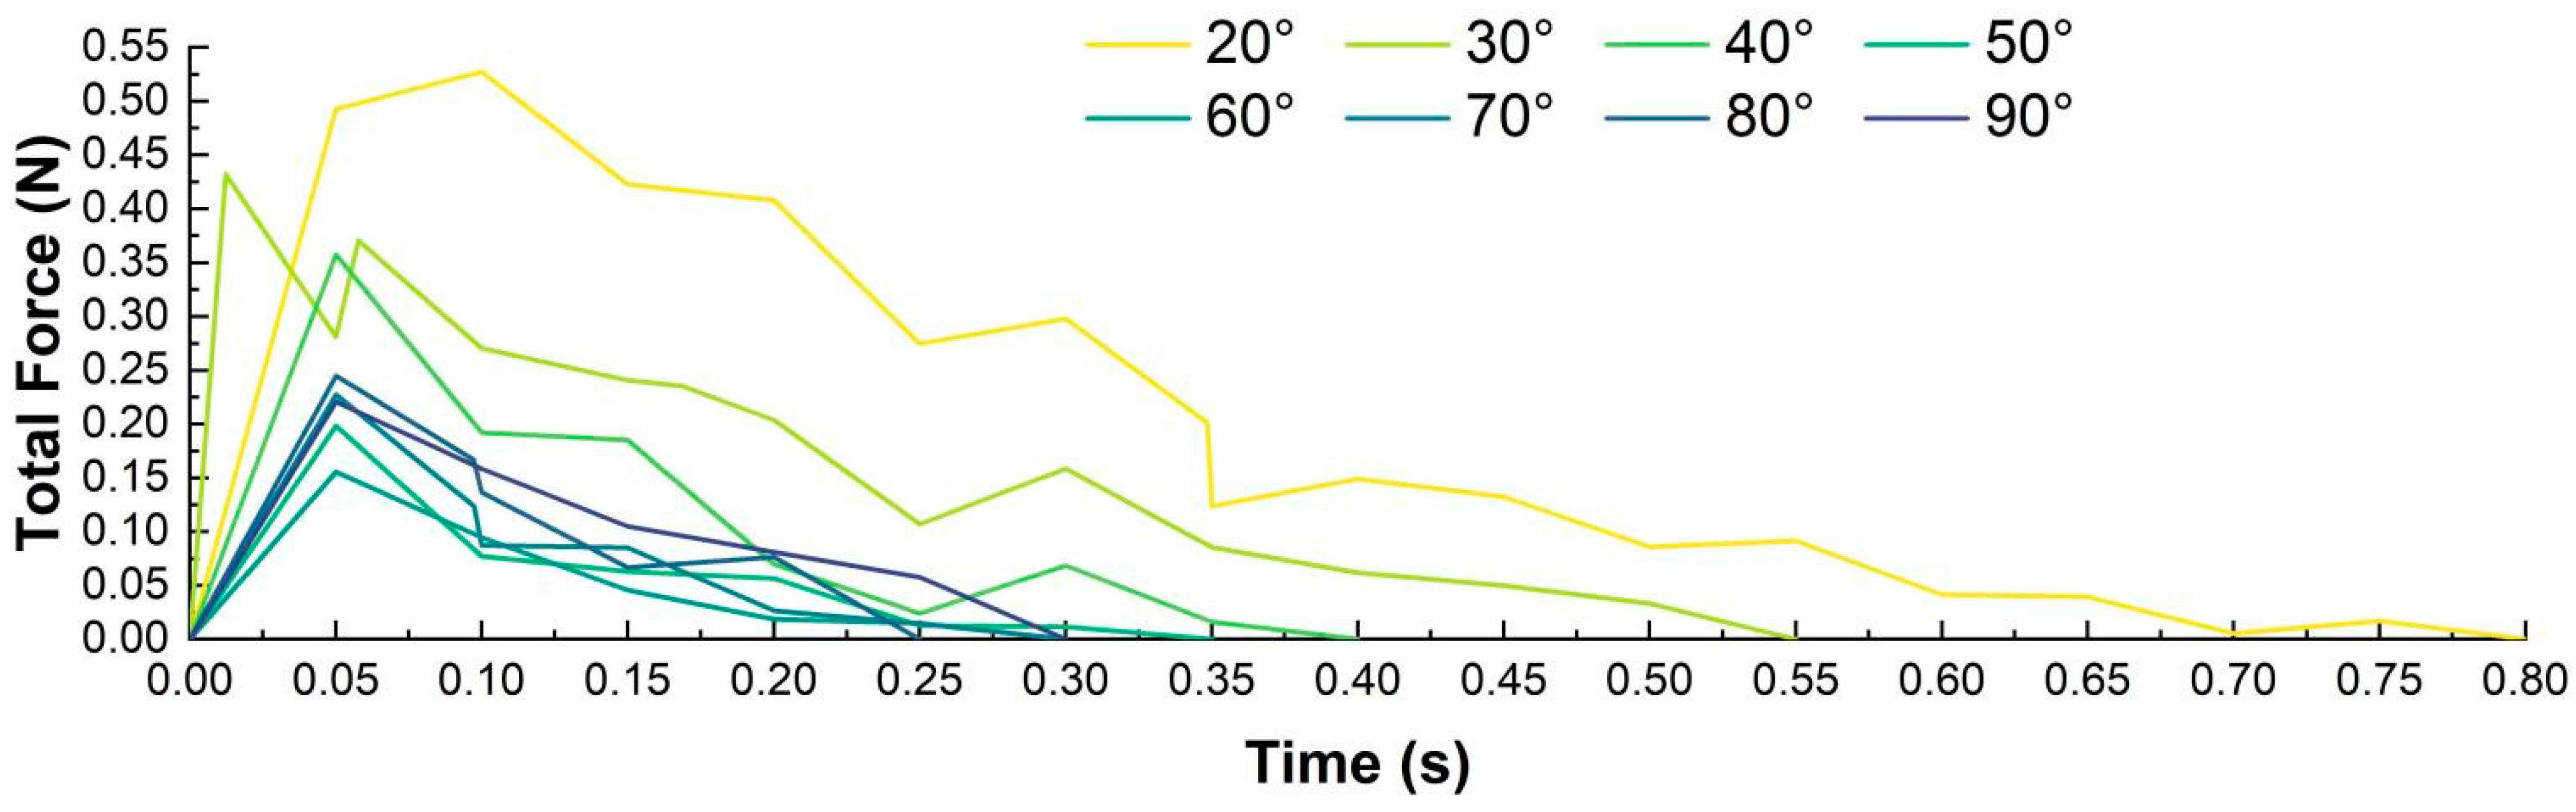
To investigate the variation pattern of the maximum pull-out force under different pull-out angles, a simulation experiment of cumin taproot pull-out was conducted with pull-out angles of 90 ° , 80 ° , 70 ° , 60 ° , 50 ° , 40 ° , 30 ° , and 20 ° . The pull-out linear velocity was set to 23.4 cm/s. In the solver, the time step was set to 20%, and the total simulation time was set such that the cell size in the solver grid was 3R min.

3. Results

3.1. The Static Friction Coefficient Between the Taproot and Sandy Loam Soil

As shown in Table 4, it can be observed that the proportion of soil particles with sizes concentrated between 0.3 mm and 2 mm exceeds 50%. Considering the computational capacity and the practicalities of the simulation parameter settings, the soil particle size for the discrete element method (DEM) simulation was therefore set to 0.5 mm, with a random distribution ranging from 0.6 to four times this value. This approach allows for a reasonable coverage of the actual soil particle size range.
As shown in Table 5, the 10 experimental data points for the taproot–sandy loam static friction coefficient have a mean value of 0.766.

3.2. Verification of the Mechanical Model of Cumin Uprooting

As depicted in Figure 24, the results of the tensile force test on cumin taproots indicated that the average tensile force was 4.061786 N, with a maximum of 5.33266 N, a minimum of 3.23995 N, and a standard deviation of 0.8813358.
As indicated by Figure 25, the maximum pull-out force achieved during uprooting was, based on cumin taproot test results, equal to 0.121302 N. Two phases of changing pull-out force were observed: an ascending phase followed by a subsequent descending phase. This implies that with increasing pull-out displacement, the friction force between the cumin taproot and the soil became effective, requiring a higher force to break the adhesion of the soil and the initial resistance of the root system, thereby resulting in an increase in the pull-out force. The pull-out force was at its maximum when the strength of the contact surface between the root system and the soil was mobilized to its fullest. Subsequently, with incremental rises in pull-out displacement, the root–soil contact area gradually diminished, causing an abrupt reduction in cohesive friction between the soil and root, lowering the pull-out force to zero. The fluctuations in the curve reflect the gradual removal of the lateral root and root tip.
The combined weight of the plastic rope and cumin taproot was found prior to the experiment to be 0.22 g. The principal radius of the primary root of the cumin taproot was 0.0018 m, while the radius at the terminal tip end of the root was 0.0005 m. The coefficient of lateral earth pressure was 0.8263518223, and the static friction coefficient between the cumin taproot and the soil around it was 0.766. The unit weight of sandy loam soil was determined as 12,250 N/m3. The taproot’s main root length of cumin was 0.025 m, and the root tip length was 0.04 m. Substituting these parameters in Equation (4), the frictional force developed between the cumin taproot and the sandy loam soil was calculated as 0.1208 N. The combined weight of the cumin taproot and plastic rope was 0.002 N, causing an error of 0.4%. This reflects the good accuracy of the cumin taproot–sandy loam soil friction model.
As shown in Figure 9, the cumin field uprooting experiment utilized steel plates with dimensions of 0.4 m in length, 0.07 m in width, and 0.01 m in thickness. Each steel plate weighed 21.54 N. The mass of 15 individual cumin plants was measured after uprooting, as detailed in Table 6. The experimental results indicated an average single-plant cumin mass of 5.86 g. During the pull-out process, the angle between the dynamometer force FL and the horizontal plane remained essentially constant. With a dynamometer reading of 220.6 N, the vertical component of the force FL constituted the cumin field uprooting force FR, calculated as F R = F L × sin 30 ° . The horizontal component of the force FL represented the frictional force between the cumin plant and the steel plates. The total field pull-out force for the 15 cumin plants was FR 110.3 N. After accounting for the weight of the two steel plates, the average field pull-out force per cumin plant was calculated to be 4.4813 N. Substituting these values into Equations (1) and (4), the theoretical field pull-out force for cumin was determined to be the sum of the cumin plant weight (0.0574 N), the tensile force of the cumin taproot (4.0618 N), and the frictional force between the cumin taproot and the soil (0.1208 N), totaling 4.24 N. The calculated error of 5% suggests satisfactory accuracy of the mechanical model for the cumin uprooting process.

3.3. The Physico-Mechanical Properties of Cumin Taproot

3.3.1. The Wet-Basis Moisture Content of Cumin Taproot

The results of the cumin taproot wet-basis moisture content determination experiment are shown in Table 7. The experimental results show that the average wet-basis moisture content of cumin taproot is 80.91%.

3.3.2. Poisson’s Ratio of Cumin Taproot

The results of the compression test for Poisson’s ratio determination are shown in Figure 26. The compression process of the cumin taproot can be divided into three stages: the first stage is the elastic stage, during which the applied load remains relatively constant, but the displacement continues to increase over time; the second stage is the linear elastic stage, where the applied load increases linearly with the increase in displacement; the third stage is the failure stage, where internal micro-fractures occur in the test material when the applied load exceeds the ultimate load capacity of the cumin taproot, leading to the termination of load application and a sudden drop in load on the compression curve. Around the 0.15 s to 0.18 s mark, there is a sudden drop in the radial loading force that the cumin taproot can withstand. The statistical analysis results of the maximum bearing load of the cumin taproot in the compression test are shown in Table 8. Substituting into Equation (7), the average Poisson’s ratio of the cumin taproot can be calculated to be 0.40.

3.3.3. Elastic Modulus and Shear Modulus of Cumin Taproot

As can be seen from Figure 27, at the initial stage of the axial compression test, the axial loading increases quickly with time and describes the behavior of the cumin taproot in the elastic deformation stage. The cumin taproot is deformed and produces a reactive force under the external pressure. The slope of the curve is the initial stiffness of the cumin taproot. Upon reaching the peak axial loading capacity, the test material develops internal micro-fractures that cause the load application to cease and the compression curve load to drop sharply. As evident from the figure, there is a sharp decline in the axial loading force the cumin taproot can withstand at approximately 0.08 s. Statistical analysis of the maximum bearing load and elastic modulus of the cumin taproot compression test is given in Table 9. From Equation (8), the average elastic modulus of the cumin taproot is found to be 15.950211 MPa. In addition, from Equation (9), the shear modulus of the cumin taproot is found to be 5.696503 MPa.

3.3.4. Bending Strength of Cumin Taproot

Based on Figure 28, at the very beginning of the three-point bending test, the texture analyzer probe had just made contact with the cumin taproot, and the bending load was near zero. As time progressed, the cumin taproot began to undergo bending deformation, and the bending load increased rapidly, exhibiting a distinct upward trend. Once the cumin taproot reached its bending strength limit and yielded, its ability to resist bending deformation significantly decreased. Around 0.08 s to 0.085 s, the bending force that the cumin taproot could withstand experienced a sudden drop. Substituting into Equation (10), the average bending strength of the cumin taproot was calculated to be 3.489518 MPa. The statistical analysis results for the maximum bending load and bending strength from the cumin taproot three-point bending test are presented in Table 10.

3.4. Simulation Analysis of the Pull-Out Process of Taproot in Sandy Loam Soil

Post-processing was performed using the EDEM 2024 software module to analyze the simulation process and process the data for display. To facilitate the observation of soil disturbance, particle velocity was set to display as red at its highest, yellow at medium, and green at its lowest. The soil disturbance caused by the cumin taproot during pull-out is shown in Figure 29. In EDEM 2024 software, the frictional resistance experienced by the taproot was used to measure the pull-out force of the taproot during the simulation process. The frictional resistance–time curve of the cumin taproot is shown in Figure 30.
As observed from Figure 29 and Figure 30, at the simulation time of 0.018 s—the time of cumin taproot pull-out—the soil particles in the vicinity of the taproot exhibit a change in velocity. At this instant, the zone of soil disturbance due to the taproot is maximum, and the cumin taproot encounters maximum frictional resistance. During the duration from 0.018 s to 0.750 s, while the cumin taproot is being pulled out, the frictional resistance experienced by the cumin taproot decreases progressively to a value of zero. Comparison of the differences between the simulation test and the actual pull-out force test indicates that the occurrence of the peak pull-out force varies between the simulation test (Figure 30) and the physical test (Figure 25). During physical pull-out force testing, the pull-out force rises progressively with time to a peak value prior to decreasing suddenly. In contrast, however, the measured pull-out force in the simulation test quickly reaches its peak at the start of the research and then decreases steadily with time.
The reason for the gradual increase of the pull-out force initially, followed by a sudden drop in the physical experiment, is the progressive mobilization of the friction force of the soil on the taproot without significant disturbance of the surrounding soil. After reaching the peak, soil rupture, and the taproot–soil contact area continues to decrease progressively, as well as a rapid reduction in the cohesion and friction between the taproot and soil. In the simulation test, however, the instant of movement of the cumin taproot disrupts the initial structure of soil bonding, and frictional resistance on the taproot is maximum right away.
The total force–time curves of the sandy loam soil on the taproot under different pull-out angles are shown in Figure 31. The maximum frictional resistance at different pull-out angles occurred when the total force of the sandy loam soil on the taproot was at its maximum, specifically at 0.05 s. Within the pull-out angle range of 60 ° to 90 ° , the maximum frictional resistance of the taproot decreased with the decrease of the pull-out angle. Conversely, within the pull-out angle range of 20 ° to 60 ° , the maximum frictional resistance of the taproot rapidly increased with the decrease of the pull-out angle. The results indicate that the pull-out resistance of the cumin taproot was minimized at a pull-out angle of 60 ° .

4. Discussion

The present study investigated the interaction between cumin taproots and sandy loam soil with emphasis on frictional behavior, mechanical simulation of the uprooting phenomenon, and the influence of pull-out angle. Findings offer useful information on the cumin harvesting mechanism, thereby establishing a foundation to enhance the design of harvesting machines.

4.1. Taproot–Soil Interaction Frictional Properties and Mechanical Modeling

The static friction coefficient of the cumin taproot against the sandy loam soil was found to be 0.766. This is a parameter that is critical to understanding the dynamics involved in uprooting. Earlier research has shown that the coefficient of static friction can be quite variable depending on parameters like soil classification, moisture content, and the type of plant species [44]. The very high friction coefficient that is established in this study can be explained by the special nature of the sandy loam soil, especially its particle size distribution, in which more than 50% of the particles have sizes between 0.3 mm and 2 mm. This size range may provide maximum contact between the taproot surface and the soil particles.
The developed mechanical model for cumin uprooting was satisfactory in terms of accuracy with error levels of 0.4% and 5% for taproot pull-out and field uprooting tests, respectively. The model incorporates significant factors such as taproot tensile strength, soil–taproot friction, and plant weight. Model predictions and experimental observations are in close agreement, showing that the model captures the dominant forces involved in uprooting.

4.2. Physico-Mechanical Properties of Cumin Taproot

The physico-mechanical properties of the cumin taproot tested here—a total of 80.91% moisture content, 0.40 Poisson’s ratio, 15.95 MPa elastic modulus, 5.70 MPa shear modulus, and 3.49 MPa bending strength—supply required parameters for discrete element method (DEM) simulation and contribute to a better understanding of taproot stress response. The high water content would surely account for the flexibility of the taproot and its capacity to deform under loading, as expressed by the elastic and linear elastic phases in the compression tests. In comparison with other crop roots, the elastic modulus represents the deformation resistance. The lower elastic modulus suggests cumin roots are comparatively easy to deform but more difficult to break under pull conditions.

4.3. DEM Simulation and Pull-Out Angle

The DEM simulations provided valuable information on soil disturbance and frictional resistance of taproot pull-out. The observation of the peak frictional resistance at the initiation of pull-out, followed by a gradual decline, is in agreement with the behavior seen in physical pull-out tests, although the temporal dynamics differ. The difference can perhaps be attributed to the simplification of soil cohesion and taproot–soil contact in the DEM model. In the mechanical tests, the progressive mobilization of the resistance to friction before maximum force suggests a progressive failure of the soil–root interface. In contrast, the DEM simulation assumes instantaneous failure of the bond structure as motion starts.
The non-monotonic behavior of the pull-out angle and peak frictional resistance, with a minimum resistance at 60°, has significant design ramifications for harvesting machinery. The non-monotonic behavior of the pull-out angle and peak frictional resistance, with a minimum resistance at 60°, has significant design ramifications for harvesting machinery. The finding suggests that optimizing the pull-out angle can minimize the force required for uprooting, with potential gains in energy conservation and minimization of plant damage. Earlier research work concerning root anchorage and pull-out resistance has demonstrated that the force required for pull-out could be highly influenced by the loading angle [45]. The optimum angle will probably be controlled by the interaction of the horizontal and vertical faces of the pull-out force and how they influence the failure patterns of the soil.

5. Conclusions

In this research, the interaction of cumin taproots with sandy loam soil was studied, the key physico-mechanical properties of the taproot were quantified, and a mechanical model was proposed for explaining cumin uprooting. The static friction coefficient between the soil and the taproot was found to be 0.766, which is a very high value and can probably be due to the soil particle size grading and its interaction with the long, flexible taproot. The mechanical model, validated and verified through laboratory and field testing (with 0.4% and 5% error, respectively), demonstrated that the uprooting forces are taproot tensile strength and, more significantly, initial static friction between the taproot and the ground. The material properties of the taproot (water content: 80.91%, Poisson’s ratio: 0.40, elastic modulus: 15.95 MPa, shear modulus: 5.70 MPa, bending strength: 3.49 MPa) suggest relative flexibility, which accounts for its interaction with the soil matrix.
DEM simulations corroborated the requirement for overcoming initial soil resistance, with a peak frictional force at pull-out initiation. Most importantly, the simulations demonstrated the non-linear relationship between resistance and pull-out angle with a minimum at 60°. While simplified root and soil models were considered, these simulations indicate the possibility of optimizing the design of harvesting equipment.
In conclusion, the present work lays the foundation for cumin uprooting mechanics. The model presented offers a template for examining forces involved, whilst empirical observations and simulations highlight the importance of taproot–soil friction and scope for optimizing the pull-out angle. Future work can include more realistic root morphology and soil rheology to refine models and further enhance harvesting efficiency.

Author Contributions

S.T.: writing—review & editing, writing—original draft, visualization, validation, supervision, software, methodology, formal analysis, data curation, conceptualization. Z.T.: methodology, data curation, resources, project administration, funding acquisition. B.L.: methodology, data curation, resources, project administration, investigation, funding acquisition. S.W.: methodology, data curation. X.G.: methodology, data curation. All authors have read and agreed to the published version of the manuscript.

Funding

This study has been supported by the Key Laboratory Equipment of Modern Agricultural Equipment and Technology (Jiangsu University), Ministry of Education (MAET202306), and the Xinjiang Production and Construction Corps Youth Talent Development Program.

Institutional Review Board Statement

Not applicable.

Data Availability Statement

The authors do not have permission to share data.

Acknowledgments

This research was funded by the Key Laboratory Equipment of Modern Agricultural Equipment and Technology (Jiangsu University), Ministry of Education (MAET202306), and the Xinjiang Production and Construction Corps Youth Talent Development Program.

Conflicts of Interest

The authors declare that they have no known competing financial interests or personal relationships that could have appeared to influence the work reported in this paper.

References

  1. Rebey, I.B.; Jabri-karoui, I.; Hamrouni-sellami, I.; Bourgou, S.; Limam, F.; Marzouk, B. Effect of drought on the biochemical composition and antioxidant activities of cumin (Cuminum cyminum L.) seeds. Ind. Crops Prod. 2012, 36, 238–245. [Google Scholar] [CrossRef]
  2. Hashemian, N.; Pirbalouti, A.G.; Hashemi, M.; Golparvar, A.; Hamedi, B. Diversity in chemical composition and antibacterial activity of essential oils of cumin (Cuminum cyminum L.) diverse from northeast of Iran. Aust. J. Crop Sci. 2013, 7, 1752–1760. [Google Scholar]
  3. Kumar, M.; Sahoo, P.K.; Kushwaha, D.K.; Saxena, S.N.; Mani, I.; Singh, G.; Pradhan, N.C. Cumin cultivation: Present status and future prospects. Pharma Innov. J. 2021, 10, 1121–1123. [Google Scholar]
  4. Singh, R.P.; Gangadharappa, H.; Mruthunjaya, K. Cuminum cyminum–A popular spice: An updated review. Pharmacogn. J. 2017, 9, 292–301. [Google Scholar] [CrossRef]
  5. Ancuceanu, R.; Dinu, M.; Hovaneţ, M.V.; Anghel, A.I.; Popescu, C.V.; Negreş, S. A survey of plant iron content—A semi-systematic review. Nutrients 2015, 7, 10320–10351. [Google Scholar] [CrossRef]
  6. Lal, G. Scenario, importance and prospects of seed spices: A review. Curr. Investig. Agric. Curr. Res. 2018, 4, 491–498. [Google Scholar] [CrossRef]
  7. Dar, E.A.; Mehdi, M.; Ahmad, M.; Bhat, F.; Hussain, N.; Hussain, M. Cumin: The flavour of Indian cuisines-history, cultivation and uses. Chem. Sci. Rev. Lett. 2019, 8, 129–135. [Google Scholar]
  8. Zhu, Z.; Chai, X.; Xu, L.; Quan, L.; Yuan, C.; Tian, S. Design and performance of a distributed electric drive system for a series hybrid electric combine harvester. Biosyst. Eng. 2023, 236, 160–174. [Google Scholar] [CrossRef]
  9. Guan, C.; Fu, J.; Cui, Z.; Wang, S.; Gao, Q.; Yang, Y. Evaluation of the tribological and anti-adhesive properties of different materials coated rotary tillage blades. Soil Tillage Res. 2021, 209, 104933. [Google Scholar] [CrossRef]
  10. Jin, Y.; Liu, J.; Xu, Z.; Yuan, S.; Li, P.; Wang, J. Development status and trend of agricultural robot technology. Int. J. Agric. Biol. Eng. 2021, 14, 1–19. [Google Scholar] [CrossRef]
  11. Han, L.; Liu, Y.; Mo, M.; Ma, H.; Kumi, F.; Mao, H. Development and Evaluation of a Walking Type Two-row Semi-automatic Transplanter for Vegetable Plug Seedlings. Ama-Agric. Mech. Asia Afr. Lat. Am. 2023, 54. [Google Scholar]
  12. Huang, M.; Jiang, X.; He, L.; Choi, D.; Pecchia, J.; Li, Y. Development of a Robotic Harvesting Mechanism for Button Mushrooms. Trans. Asabe 2021, 64, 565–575. [Google Scholar] [CrossRef]
  13. Qing, Y.; Li, Y.; Yang, Y.; Xu, L.; Ma, Z. Development and experiments on reel with improved tine trajectory for harvesting oilseed rape. Biosyst. Eng. 2021, 206, 19–31. [Google Scholar] [CrossRef]
  14. Liu, J.; Liang, J.; Zhao, S.; Jiang, Y.; Wang, J.; Jin, Y. Design of a Virtual Multi-Interaction Operation System for Hand-Eye Coordination of Grape Harvesting Robots. Agronomy 2023, 13, 829. [Google Scholar] [CrossRef]
  15. Xu, Z.; Liu, J.; Wang, J.; Cai, L.; Jin, Y.; Zhao, S.; Xie, B. Realtime Picking Point Decision Algorithm of Trellis Grape for High-Speed Robotic Cut-and-Catch Harvesting. Agronomy 2023, 13, 1618. [Google Scholar] [CrossRef]
  16. Jin, M.; Zhao, Z.; Chen, S.; Chen, J. Improved piezoelectric grain cleaning loss sensor based on adaptive neuro-fuzzy inference system. Precis. Agric. 2022, 23, 1174–1188. [Google Scholar] [CrossRef]
  17. Bengough, A.G.; Mckenzie, B.; Hallett, P.; Valentine, T. Root elongation, water stress, and mechanical impedance: A review of limiting stresses and beneficial root tip traits. J. Exp. Bot. 2011, 62, 59–68. [Google Scholar] [CrossRef]
  18. Zhang, W.; Huang, R.; Xiang, J.; Zhang, N.; Ciantia, M.O.; Liu, L.; Yin, J.; Qin, C. Role of root morphological and architectural traits: Insights into root-inspired anchorage and foundation systems. Biogeotechnics 2024, 2, 100107. [Google Scholar] [CrossRef]
  19. Kolb, E.; Legué, V.; Bogeat-triboulot, M.-B. Physical root–soil interactions. Phys. Biol. 2017, 14, 065004. [Google Scholar] [CrossRef]
  20. Mak, J.; Chen, Y.; Sadek, M. Determining parameters of a discrete element model for soil–tool interaction. Soil Tillage Res. 2012, 118, 117–122. [Google Scholar] [CrossRef]
  21. Chen, M.; Liu, X.; Hu, P.; Zhai, X.; Han, Z.; Shi, Y.; Zhu, W.; Wang, D.; He, X.; Shang, S. Study on rotor vibration potato-soil separation device for potato harvester using DEM-MBD coupling simulation. Comput. Electron. Agric. 2024, 218, 108638. [Google Scholar] [CrossRef]
  22. Zhan, Z.; Yaoming, L.; Zhenwei, L.; Zhiqiang, G. DEM simulation and physical testing of rice seed impact against a grain loss sensor. Biosyst. Eng. 2013, 116, 410–419. [Google Scholar] [CrossRef]
  23. Ma, Z.; Li, Y.; Xu, L.; Chen, J.; Zhao, Z.; Tang, Z. Dispersion and migration of agricultural particles in a variable-amplitude screen box based on the discrete element method. Comput. Electron. Agric. 2017, 142, 173–180. [Google Scholar] [CrossRef]
  24. Horabik, J.; Molenda, M. Parameters and contact models for DEM simulations of agricultural granular materials: A review. Biosyst. Eng. 2016, 147, 206–225. [Google Scholar] [CrossRef]
  25. Ma, Z.; Wu, Z.; Li, Y.; Song, Z.; Yu, J.; Li, Y.; Xu, L. Study of the grain particle-conveying performance of a bionic non-smooth-structure screw conveyor. Biosyst. Eng. 2024, 238, 94–104. [Google Scholar] [CrossRef]
  26. Ma, Z.; Zhu, Y.; Wu, Z.; Traore, S.N.; Chen, D.; Xing, L. BP neural network model for material distribution prediction based on variable amplitude anti-blocking screening DEM simulations. Int. J. Agric. Biol. Eng. 2023, 16, 190–199. [Google Scholar] [CrossRef]
  27. Li, Y.; Xu, L.; Gao, Z.; Lu, E.; Li, Y. Effect of Vibration on Rapeseed Header Loss and Optimization of Header Frame. Trans. Asabe 2021, 64, 1247–1258. [Google Scholar] [CrossRef]
  28. Wang, L.; Chai, X.; Huang, J.; Hu, J.; Cui, Z. Efficient and Low-Loss Cleaning Method for Non-Uniform Distribution of Threshed Materials Based on Multi-Wing Curved Combination Air Screen in Computational Fluid Dynamics/Discrete Element Method Simulations. Agriculture 2024, 14, 895. [Google Scholar] [CrossRef]
  29. Foroutan, T.; Mirghasemi, A.A. Use of CFD-DEM to evaluate the effect of intermediate stress ratio on the undrained behaviour of granular materials. Adv. Powder Technol. 2022, 33, 103507. [Google Scholar] [CrossRef]
  30. Mudarisov, S.; Farkhutdinov, I.; Khamaletdinov, R.; Khasanov, E.; Mukhametdinov, A. Evaluation of the significance of the contact model particle parameters in the modelling of wet soils by the discrete element method. Soil Tillage Res. 2022, 215, 105228. [Google Scholar] [CrossRef]
  31. Song, S.; Tang, Z.; Zheng, X.; Liu, J.; Meng, X.; Liang, Y. Calibration of the discrete element parameters for the soil model of cotton field after plowing in Xinjiang of China. Trans. Chin. Soc. Agric. Eng. 2021, 37, 63–70. [Google Scholar] [CrossRef]
  32. Mei, Z.; Li, H.; Qi, X.; Hu, T.; Li, C. Analysis of mechanical properties of sandy soil. J. Shenyang Agric. Univ. 2018, 49, 605–612. [Google Scholar]
  33. Mao, H.; Wang, Q.; Li, Q. Modelling and simulation of the straw-grain separation process based on a discrete element model with flexible hollow cylindrical bonds. Comput. Electron. Agric. 2020, 170, 105229. [Google Scholar] [CrossRef]
  34. Wang, Q.; Mao, H.; Li, Q. Modelling and simulation of the grain threshing process based on the discrete element method. Comput. Electron. Agric. 2020, 178, 105790. [Google Scholar] [CrossRef]
  35. Zhao, H.; Li, H.; Ma, S.; He, J.; Wang, Q.; Lu, C.; Zheng, Z. The effect of various edge-curve types of plain-straight blades for strip tillage seeding on torque and soil disturbance using DEM. Soil Tillage Res. 2020, 202, 104674. [Google Scholar] [CrossRef]
  36. Yang, Q.; Shi, L.; Shi, A.; He, M.; Zhao, X.; Zhang, L.; ADDY, M. Determination of key soil characteristic parameters using angle of repose and direct shear stress test. Int. J. Agric. Biol. Eng. 2023, 16, 143–150. [Google Scholar] [CrossRef]
  37. Wang, X.; Zhang, S.; Pan, H.; Zheng, Z.; Huang, Y.; Zhu, R. Effect of soil particle size on soil-subsoiler interactions using the discrete element method simulations. Biosyst. Eng. 2019, 182, 138–150. [Google Scholar] [CrossRef]
  38. Sun, L.; Zhang, X.; Zeng, Q.; Gao, K.; JIang, K.; Zhou, J. Application of a screw conveyor with axial tilt blades on a shearer drum and investigation of conveying performance based on DEM. Particuology 2022, 61, 91–102. [Google Scholar] [CrossRef]
  39. Chen, X.; Bai, J.; Wang, X.; Fang, W.; Hong, T.; Zang, N.; Fang, L.; Wang, G. Calibration and testing of discrete elemental simulation parameters for pod pepper seeds. Agriculture 2024, 14, 831. [Google Scholar] [CrossRef]
  40. Chen, X.; Wang, X.; Bai, J.; Fang, W.; Hong, T.; Zang, N.; Wang, G. Virtual parameter calibration of pod pepper seeds based on discrete element simulation. Heliyon 2024, 10, e31686. [Google Scholar] [CrossRef]
  41. Du, C.; Han, D.; Song, Z.; Chen, Y.; Chen, X.; Wang, X. Calibration of contact parameters for complex shaped fruits based on discrete element method: The case of pod pepper (Capsicum annuum). Biosyst. Eng. 2023, 226, 43–54. [Google Scholar] [CrossRef]
  42. Liang, Z.; Huang, Y.; Li, D.; Wada, M.E. Parameter determination of a viscoelastic-plastic contact model for potatoes during transient collisions. Biosyst. Eng. 2023, 234, 156–171. [Google Scholar] [CrossRef]
  43. Liang, Z. Selecting the proper material for a grain loss sensor based on DEM simulation and structure optimization to improve monitoring ability. Precis. Agric. 2021, 22, 1120–1133. [Google Scholar] [CrossRef]
  44. Chaobo, Z.; Lihua, C.; Jing, J. Why fine tree roots are stronger than thicker roots: The role of cellulose and lignin in relation to slope stability. Geomorphology 2014, 206, 196–202. [Google Scholar] [CrossRef]
  45. Kamchoom, V.; Leung, A.K.; Ng, C.W.W. Effects of root geometry and transpiration on pull-out resistance. Géotechnique Lett. 2014, 4, 330–336. [Google Scholar] [CrossRef]
Figure 1. Schematic representation of the morphological structure of a single cumin plant, highlighting the fine structure of the taproot.
Agriculture 15 00940 g001
Figure 2. Force analysis model of a single cumin plant’s taproot being uprooted from sandy loam soil. F is the cumin pulling-out force, F1 is the frictional force between the cumin taproot and the soil, GC is the gravitational force of the cumin plant, Fa is the inertial force of the cumin during the pulling process, and F2 is the tensile force of the taproot.
Agriculture 15 00940 g002
Figure 3. A root–soil composite formed by multiple cumin taproots and sandy loam soil after multiple cumin plants were simultaneously uprooted.
Agriculture 15 00940 g003
Figure 4. Analytical model of soil frictional forces acting on a single cumin taproot during the uprooting process from sandy loam soil.
Agriculture 15 00940 g004
Figure 5. Schematic of an inclined plane apparatus used to measure the static friction coefficient between cumin taproot and sandy loam soil. The cumin taproot is enclosed within a red circle.
Agriculture 15 00940 g005
Figure 6. Soil sieves of varying mesh sizes for particle size separation of sandy loam soil.
Agriculture 15 00940 g006
Figure 7. Tensile testing apparatus for measuring the maximum tensile force withstood by cumin taproots.
Agriculture 15 00940 g007
Figure 8. Simulation of the uprooting process for a single cumin taproot.
Agriculture 15 00940 g008
Figure 9. Field uprooting experiment simulating cumin harvesting using harvester clamps (a); and force analysis of the steel plate and multiple cumin plants as a unit during the uprooting process (b).
Agriculture 15 00940 g009
Figure 10. Mass differences in cumin taproots (pre- and post-drying) were measured using a METTLER TOLEDO electronic balance.
Agriculture 15 00940 g010
Figure 11. Taproot wet-basis moisture content was determined by a DHG-9053A thermostatic drying oven.
Agriculture 15 00940 g011
Figure 12. Experimental setup for measuring Poisson’s ratio of cumin taproots via a compression test.
Agriculture 15 00940 g012
Figure 13. Experimental setup for determining the elastic modulus of cumin taproots via a compression test.
Agriculture 15 00940 g013
Figure 14. Experimental setup for determining the flexural strength of cumin taproots via a three-point bending test.
Agriculture 15 00940 g014
Figure 15. Free-body diagram of interparticle forces under bond conditions.
Agriculture 15 00940 g015
Figure 16. Normal and tangential force-displacement relationships for bonded particles, illustrating stretching, shearing, compression, and bond breaking.
Agriculture 15 00940 g016
Figure 17. Sandy loam particle models generated using EDEM 2024 software: sphere (a), cylinder (b), cuboid (c), cube (d).
Agriculture 15 00940 g017
Figure 18. Comparison between a 3D model of a cumin taproot, constructed using statistically analyzed dimensional parameters, and an actual cumin taproot.
Agriculture 15 00940 g018
Figure 19. Image preprocessing steps for cumin taproot: original (a), grayscale (b), eroded (c), dilated (d), binarized (e).
Agriculture 15 00940 g019
Figure 20. Image preprocessing steps for the 3D model of a cumin taproot: original (a), grayscale (b), eroded (c), dilated (d), binarized (e).
Agriculture 15 00940 g020
Figure 21. Comparison of scatter plots of outline coordinates extracted using MATLAB R2022a, of an actual cumin main root and its corresponding 3D model.
Agriculture 15 00940 g021
Figure 22. Composite DEM soil bin model for cumin taproot in sandy loam soil.
Agriculture 15 00940 g022
Figure 23. Simulation experiment of the cumin taproot pulling process.
Agriculture 15 00940 g023
Figure 24. Time curves of tensile force during axial tensile loading of cumin taproot.
Agriculture 15 00940 g024
Figure 25. Time course of pull-off force for cumin taproot.
Agriculture 15 00940 g025
Figure 26. Acting pressure during radial compression tests on cumin taproot: time curve (a) and displacement curve (b).
Agriculture 15 00940 g026
Figure 27. Acting pressure during axial loading tests on cumin taproot: time curve (a) and displacement curve (b).
Agriculture 15 00940 g027
Figure 28. Acting pressure during three-point bending tests on cumin taproot: time curve (a) and displacement curve (b).
Agriculture 15 00940 g028
Figure 29. Visualization of soil disturbance in sandy loam by cumin taproot at different time moments during the simulated pull-out process. 0.00e+00 is 0 mm/s, 2.00e+00 is 2 mm/s, 4.00e+00 is 4 mm/s, 6.00e+00 is 6 mm/s, 8.00e+00 → 8 mm/s, 1.00e+01 → 10 mm/s.
Agriculture 15 00940 g029
Figure 30. Time curve of frictional resistance for cumin taproot.
Agriculture 15 00940 g030
Figure 31. Time course of total force during pull-out tests of taproot in sandy loam soil at different pull-out angles.
Agriculture 15 00940 g031
Table 1. Discrete element simulation parameters for sandy loam soil used in cotton–cumin intercropping in Xinjiang, China.
ParameterValue
Sandy loam particle radius (mm)0.5
Sandy loam particle Poisson’s ratio0.36
Sandy loam particle density (kg m−3)1250
Sandy loam particle shear modulus (Pa)1 × 10⁶
Interparticle coefficient of restitution of sandy loam particles0.48
Interparticle coefficient of static friction of sandy loam particles0.176
Interparticle coefficient of rolling friction of sandy loam particles0.56
Table 2. Discrete element simulation parameters for cumin taproots.
Parameter TypeParameterValue
Material propertiesTaproot’s Poisson’s ratio0.4
Taproot’s density (kg m−3)600
Taproot’s elastic modulus (MPa)15.950211
Contact propertiesCoefficient of restitution between taproot and sandy loam soil0.38
Coefficient of static friction between taproot and sandy loam soil0.766
Coefficient of rolling friction between taproot and sandy loam soil0.46
Surface energy between taproot and sandy loam soil (J m−2)1
Table 3. Reliable bonding parameters for soil particles in DEM simulations.
CategoryParameterValue
Between sandy loam particlesNormal stiffness per unit area/N m−35 × 106
Normal range/N m−31 × 106
Shear stiffness per unit area/N m−35 × 106
Shear range/N m−31 × 106
Normal strength/Pa5000
Shear strength/Pa5000
Bonded disk scale2
Table 4. Grain size distribution of sandy loam soils in the Xinjiang region of China.
Particle Size (mm)≤0.050.05–0.10.1–0.20.2–0.30.3–0.50.5–11–2
Mass
(g)
Soil sample 111.5741.8495.29102.74148.5168.9631.09
Soil sample 28.7528.9265.41125.88155.3381.0734.64
Soil sample 317.9139.5888.1698.42131.7999.2324.91
Average12.7436.7882.95109.01145.2183.0930.21
Percentage (%)2.5487.35616.5921.80229.04216.6186.042
Table 5. Determination of the static friction coefficient between cumin taproot and sandy loam soil.
Experiment Number12345
Friction angle / ° 37.9936.6837.3933.7639.07
Friction coefficient0.7810.7400.7630.6680.811
Experiment Number678910
Friction angle / ° 36.8137.1138.3537.1440.08
Friction coefficient0.7470.7560.7930.7570.842
Table 6. Mass of individual cumin plants (n = 15).
Experiment Number12345
Mass/g5.506.825.187.555.11
Experiment Number678910
Mass/g4.936.374.807.025.90
Experiment Number1112131415
Mass/g6.154.457.805.285.09
Table 7. Wet-basis moisture content of cumin taproot (n = 15).
Experiment Number12345Average
Wet-basis moisture content (%)79.9780.9880.7381.2581.6280.91
Experiment number678910
Wet-basis moisture content (%)80.3581.4680.5780.7982.09
Experiment number1112131415
Wet-basis moisture content (%)81.0280.1381.2481.6879.81
Table 8. Summary statistics of maximum load in radial compression of cumin taproot (n = 10).
Experiment Number12345
Maximum load/N17.073116.282366.637565.795449.3687
Experiment Number678910
Maximum load/N57.830158.342649.464221.425640.1502
Statistical IndicatorMaximumMinimumAverageStandard Deviation
Maximum load/N66.637516.282344.237018.6019
Table 9. Summary statistics of maximum load and elastic modulus of cumin taproot from axial compression tests (n = 5).
Experiment Number12345
Maximum load/N6.583470.976020.800571.329241.81493
Statistical indicatorMaximumMinimumAverageStandard Deviation
Maximum load/N6.583470.800572.3008462.169206
Elastic modulus/MPa18.70897813.78542315.9502112.053301
Table 10. Summary statistics of maximum bending load and flexural strength of cumin taproot from three-point bending tests (n = 5).
Experiment Number12345
Maximum bending load/N0.522010.560720.529040.801190.99474
Statistical indicatorMaximumMinimumAverageStandard Deviation
Maximum bending load/N0.994740.522010.681540.187464
Bending strength/MPa5.9828001.4765083.4895181.530144
Disclaimer/Publisher’s Note: The statements, opinions and data contained in all publications are solely those of the individual author(s) and contributor(s) and not of MDPI and/or the editor(s). MDPI and/or the editor(s) disclaim responsibility for any injury to people or property resulting from any ideas, methods, instructions or products referred to in the content.

