Article

Precision Agriculture for Dragon Fruit: A Novel Approach Based on Nighttime Light Remote Sensing

1
School of Civil and Surveying and Mapping Engineering, Jiangxi University of Science and Technology, Ganzhou 341000, China
2
School of Computer and Information Engineering, Xiamen University of Technology, Xiamen 361024, China
*
Authors to whom correspondence should be addressed.
Agriculture 2025, 15(9), 1014; https://doi.org/10.3390/agriculture15091014
Submission received: 4 March 2025 / Revised: 1 May 2025 / Accepted: 6 May 2025 / Published: 7 May 2025
(This article belongs to the Section Digital Agriculture)

Abstract

:
The dragon fruit industry holds significant market potential and is crucial for rural economic development. However, a comprehensive understanding and precise technical approach for analyzing the spatiotemporal dynamics of dragon fruit agriculture remain lacking. This study utilizes Nighttime Light (NTL) remote sensing data and proposes the Vegetation and Impervious area Adjusted Nighttime light Dragon fruit Index (VIANDI) to extract artificial light sources associated with dragon fruit cultivation. Furthermore, a regression model is constructed to estimate production based on light intensity. By integrating geospatial analysis methods, this study reveals the spatiotemporal evolution of dragon fruit cultivation area and production in Guangxi, China, from 2017 to 2022. The results demonstrate that the proposed method effectively monitors the dynamics of dragon fruit agriculture, achieving a Kappa Coefficient of 0.72 for area extraction and a Mean Relative Error (MRE) of 8.90% for production estimation. The spatial pattern of dragon fruit production follows a northwest–southeast distribution, with its centroid located in Nanning. The spatial expansion of cultivation areas exhibited an initial growth phase followed by stabilization, whereas production distribution transitioned from expansion to aggregation, maintaining an overall upward trend. Notably, 2019 marks a key turning point in these trends. Additionally, the rapid increase in light pollution intensity within cultivation areas warrants further attention. The study results have advanced precise monitoring of dragon fruit agriculture and enhanced understanding of its spatiotemporal evolution patterns.

1. Introduction

Dragon fruit is a tropical and subtropical fruit widely favored by global consumers for its rich nutritional value and appealing taste, contributing significantly to the agricultural economy [1]. Its cultivation is particularly well suited for arid and semi-arid climates, where it enhances agricultural productivity in water-scarce regions, reduces dependence on high-quality arable land, and improves land use efficiency while mitigating soil degradation [2]. However, a key characteristic of dragon fruit farming is its reliance on prolonged nighttime artificial lighting to enhance pollination rates and maximize yields [3,4]. Currently, approximately 90% of the world’s dragon fruit production is concentrated in China and Vietnam [5]. Notably, China’s dragon fruit industry has experienced rapid growth in recent years, surpassing 1.6 million tons in production and overtaking Vietnam in 2021 to become the world’s largest producer [6]. In 2022, the market scale of dragon fruit in China reached CNY 22 billion, bringing substantial economic benefits to the dragon fruit cultivation industry [7]. To ensure sustainable land use amid this rapid expansion, China has implemented strict land use regulations to strengthen farmland protection, which has influenced the spatial dynamics of dragon fruit cultivation [8]. In this context, adjusting regional productivity to meet the growing demand of China’s vast consumer market not only promotes rapid rural economic growth but also contributes to rural revitalization. Despite these developments, there remains a critical gap in understanding and technological support for monitoring the spatiotemporal dynamics of dragon fruit agriculture. Therefore, developing efficient precision monitoring methods for dragon fruit agriculture and understanding spatiotemporal patterns to optimize spatial planning for dragon fruit cultivation is crucial for promoting regional sustainable development.
The dragon fruit cultivation areas exhibit distinct lighting characteristics at night, which can be captured by nighttime light remote sensing satellites. Nighttime Light (NTL) remote sensing is a technology that uses satellites to collect luminous information from the Earth’s surface at night [9]. It primarily captures phenomena such as urban lights [10], traffic [11], fishing lights [12], and fire hotspots [13], providing a unique data source for monitoring both human activities and natural phenomena. Currently, the Defense Meteorological Satellite Program’s Operational Linescan System (DMSP-OLS) and the Visible Infrared Imaging Radiometer Suite (VIIRS) on the National Polar-orbiting Partnership (NPP) are the most widely used NTL remote sensing platforms [14]. One of the initial uses of NTL data was to map urban areas, particularly in regions where data are sparse or updates are delayed, offering a unique perspective to fill gaps in traditional statistics [15,16,17]. As the correlation between artificial lighting and urban areas was discovered, NTL has become an important tool for estimating socio-economic indicators (such as GDP [18], electricity consumption [19], population [20], and steel inventory [21]), as well as environmental variables (including PM2.5 [22] and CO2 emissions [23]). Additionally, NTL remote sensing has proven effective in monitoring natural disasters [24] and light pollution [25]. Due to the significant impact of human-induced disasters on nighttime lighting, NTL also offers valuable opportunities for monitoring armed conflicts [26]. Moreover, NTL has been applied in various fields, such as inequality analysis [27], disease impact assessments [28], and fisheries monitoring [29]. Therefore, NTL remote sensing technology demonstrates unique advantages in capturing the spatiotemporal dynamics of anthropogenic nighttime illumination. Its application holds significant potential for monitoring the spatiotemporal evolution of dragon fruit agriculture.
Although NTL remote sensing has been extensively used to assess human activities and urban evolution, relatively little attention has been given to the characteristics of nighttime illumination in dragon fruit cultivation areas. Research combining NTL remote sensing with agricultural applications has primarily focused on dragon fruit plantations in Binh Thuan Province, Vietnam. Wang et al. utilized NPP-VIIRS nighttime light remote sensing data to estimate dragon fruit agricultural statistics for various counties in Binh Thuan Province, Vietnam, based on the total luminosity of nighttime lights aggregated by administrative divisions. The results revealed a significant correlation [30]. Krauser et al. integrated the Breaks for Additive Seasonal and Trend (BFAST) algorithm with a decision tree classifier and the Normalized Difference Light Index (NDLI) to differentiate dragon fruit farmland from urban lighting, enhancing extraction accuracy [31]. Jia et al., building on Krauser’s research foundation, employed buffer analysis to investigate spatial expansion trends in dragon fruit cultivation areas in Binh Thuan Province, Vietnam. The results indicated that cultivation areas have expanded from traditional coastal plains to foothill regions, with the centers of intensive cultivation areas gradually moving away from the geographical center [32]. Furthermore, Wen et al. used NPP-VIIRS nighttime light data and a random forest classifier to generate dragon fruit cultivation maps for major cities in China and Binh Thuan from 2014 to 2022 [33]. These studies demonstrate the feasibility of large-scale monitoring of dragon fruit cultivation using NTL remote sensing. However, challenges remain, as urban lighting, public infrastructure illumination, and wildfire emissions introduce significant noise, limiting the accuracy of single-source nighttime light data in detecting dragon fruit plantations. Therefore, accurately monitoring the spatiotemporal dynamics of dragon fruit cultivation area and production on a large scale remains a critical challenge.
To address these research gaps and build upon prior studies, this research focuses on accurately monitoring the spatiotemporal evolution of dragon fruit farming in China’s major production regions. This is particularly relevant within the context of China’s rapidly expanding dragon fruit market and recent land use policy regulations. By employing geospatial analysis methods to assess its spatiotemporal evolution characteristics, we aim to offer new insights into the sustainable development of dragon fruit agriculture. Specifically, this study seeks to answer two key research questions: (1) How can we differentiate dragon fruit cultivation lights from interfering sources to improve monitoring accuracy? (2) What are the spatiotemporal evolution patterns of dragon fruit farming in China’s key production regions? To achieve these objectives, this study proposes a novel Vegetation and Impervious area Adjusted Nighttime light Dragon fruit Index (VIANDI) using Black Marble nighttime light data, combined with Normalized Difference Vegetation Index (NDVI) and Impervious Area (IA) data. Additionally, a regression model is constructed to estimate production based on NTL brightness within cultivation areas. Finally, statistical and geospatial analysis methods are applied to uncover the spatiotemporal evolution trends of dragon fruit production and cultivated areas, while further assessing the challenges posed by light pollution and policy changes.

2. Study Area and Data
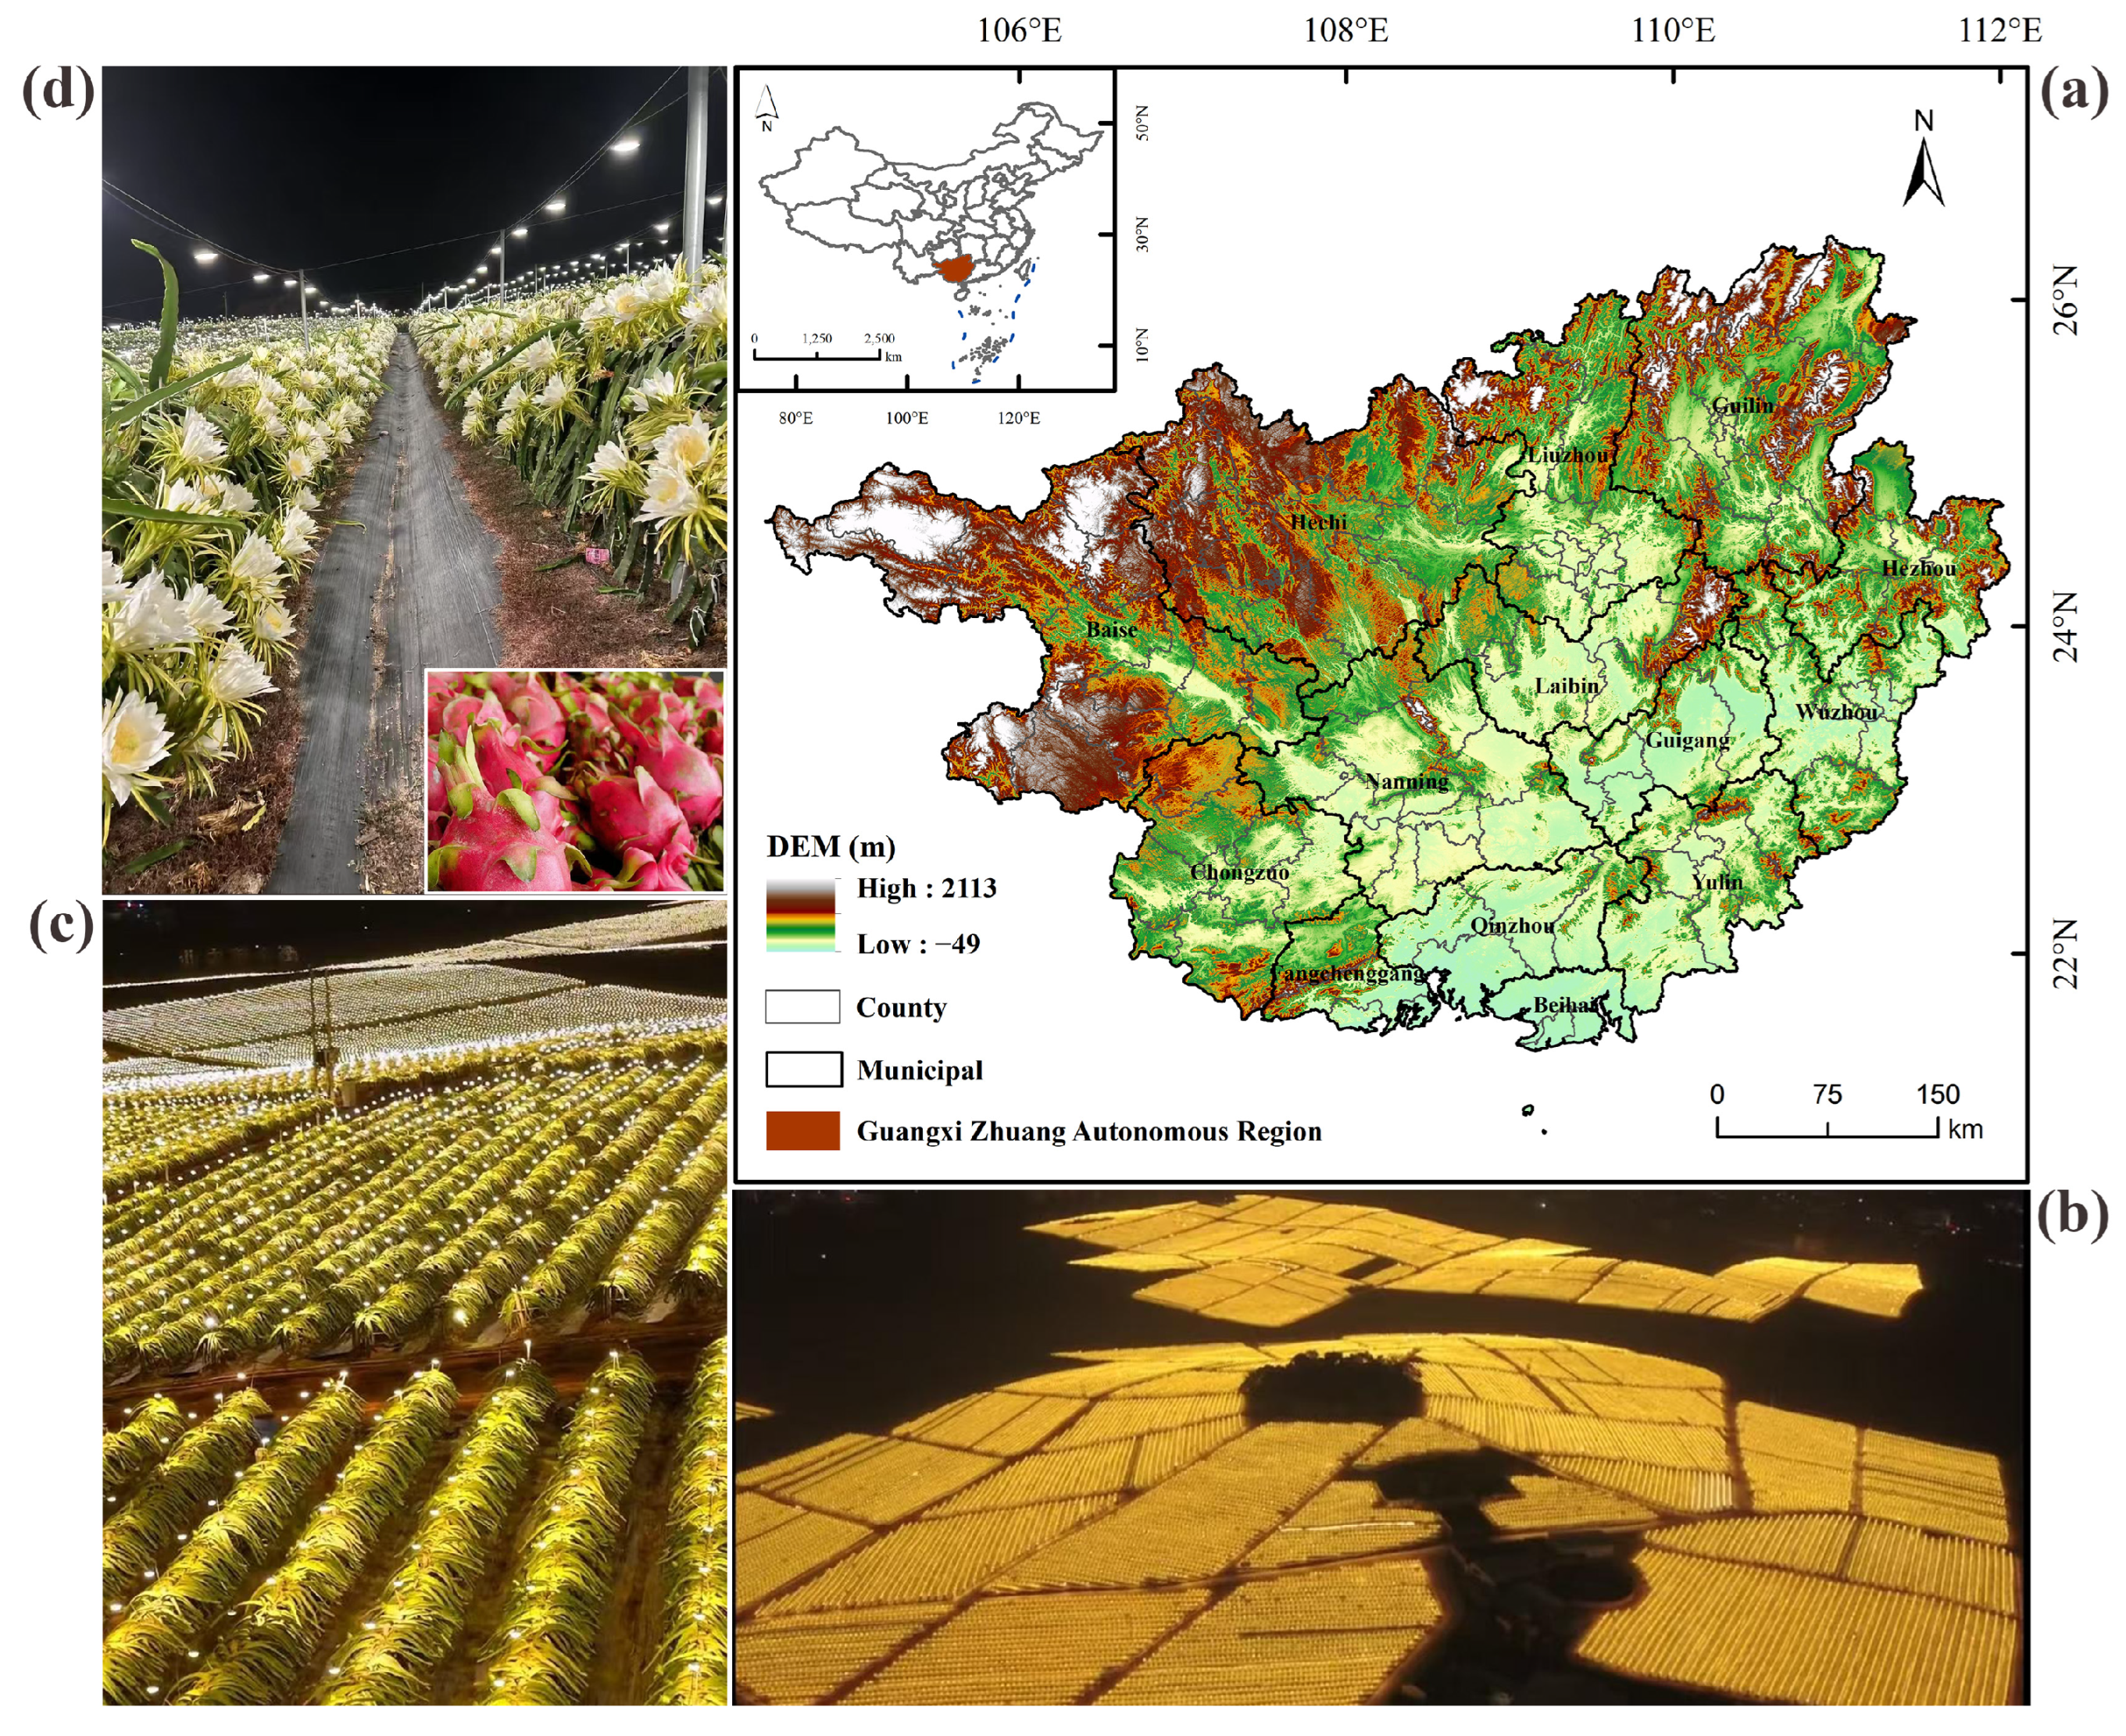
2.1. Study Area

Guangxi Zhuang Autonomous Region (longitude 104°28′ to 112°04′ E, latitude 20°54′ to 26°24′ N) is located in a low-latitude zone (Figure 1). The region’s topography is characterized by a high northwest and low southeast orientation, sloping from northwest to southeast, and it falls under a subtropical monsoon climate. The entire region consists of 14 cities, covering an area of 237,600 km2. The average annual temperature in Guangxi ranges from 20.9 °C to 21.6 °C, with annual precipitation varying between 1383.1 mm and 1809.9 mm. The climate is warm and rainfall is abundant, providing an ideal growing environment for dragon fruit cultivation. According to data from 2022, the dragon fruit cultivation area in Guangxi reached 348.200 mu (Chinese area unit, 1 mu = 666.7 m2), accounting for 34% of the national total, while its production amounted to 686,600 tons, making up 37% of the national production [7]. Both cultivation area and production are the highest in the country [34]. The development of the dragon fruit industry in Guangxi has significantly boosted the region’s rural economy, substantially improving local farmers’ incomes and making a significant contribution to rural revitalization.

2.2. Study Data

The NTL remote sensing data used in this study are derived from the Black Marble dataset released by NASA, with units expressed in nW/cm2/sr. This dataset includes daily sensor-based TOA nighttime radiance (VNP46A1), daily moonlight-adjusted NTL (VNP46A2), monthly composite NTL (VNP46A3), and annual composite NTL (VNP46A4). The NTL data used in this study are the monthly NTL data (VNP46A3) from the Black Marble suite, which refer to the third NTL product in the suite. This product provides monthly composites generated from daily atmospherically and lunar-BRDF-corrected NTL radiance to remove the influence of extraneous artifacts and biases. Known by its long name, VIIRS/NPP Lunar BRDF-Adjusted Nighttime Lights Monthly L3 Global 15 arc-second Linear Lat Lon Grid, this product contains 28 layers. They provide information on the NTL composite, the number of observations, quality, and standard deviation for multi-view zenith angle categories (near-nadir, off-nadir, and all angles), their snow-covered and snow-free statuses besides land–water mask, latitude, and longitude coordinate information [35]. The Black Marble dataset, used as the NTL remote sensing data in this study, provides a more comprehensive record of nighttime lighting in the dragon fruit cultivation areas (Figure 2).
The sources of these datasets are provided in Table 1. NDVI data are derived from the 30 m annual maximum NDVI dataset released by the National Ecosystem Science Data Center. The Impervious Area data from 2017 to 2021 are sourced from the Global Artificial Impervious Area (GAIA) dataset with a 30 m resolution, released by the Urban Environment Monitoring and Modeling Team at the College of Land Science and Technology, China Agricultural University. This dataset is available through 2021. The 2022 Impervious Area data are obtained from the China 30 m Land Cover dataset available on the Zenodo website. The statistical data for dragon fruit cultivation area and production in the cities of Guangxi are provided by the Department of Agriculture and Rural Affairs of Guangxi Zhuang Autonomous Region. Administrative boundary vector data are obtained from the National Fundamental Geographic Information System.

3. Methodology

The methodology of this study is divided into three main parts: (1) extraction of dragon fruit cultivation areas; (2) estimation of dragon fruit production; (3) spatiotemporal dynamics analysis (Figure 3).

3.1. Data Preprocessing

Dragon fruit cultivation in Guangxi typically involves supplemental lighting from January to April and September to December. However, due to high temperatures and frequent rainfall in summer (May to August), supplemental lighting is also applied on some days to address insufficient sunlight. To ensure the completeness of the dragon fruit cultivation area extraction, this study retained the full-year NTL data. Comparing ground truth observations, it was found that Layer 20 data (snow-covered all angles) captured more lighting coverage in dragon fruit areas compared to Layer 8 data (snow-free all angles). This discrepancy arises because supplemental lighting in dragon fruit cultivation areas is conducted in batches and varies by region, with winter lighting sometimes being misclassified as snow-reflected light. Since Guangxi is in a low-latitude region with minimal snow impact, Layer 20 data were processed in the same manner as Layer 8 data and subsequently merged to enhance data completeness and accuracy. The study adopted the Albers Equal Area Conic projection coordinate system and resampled the data to a 500 m spatial resolution to ensure consistency.
Since the radiance values in the NTL data are amplified tenfold by a scale factor, the study normalized the NTL radiance values accordingly. Using monthly NTL data for all 12 months, an annual maximum NTL composite for Guangxi was generated. Then, the maximum lighting value within the largest urbanized area of Nanning City was extracted as the reference baseline for Guangxi. The NTL data across the entire region were adjusted based on this reference, and annual temporal continuity corrections were applied to ensure the spatiotemporal consistency and reliability of the data.

3.2. Area Extraction Using the VIANDI Method

(1) NTL independent surface extraction. Threshold values were set based on slight overflow beyond urban boundaries, and lighting areas were extracted from NTL data. The high brightness of dragon fruit cultivation areas enabled their retention under these thresholds, producing NTL imagery that includes both urbanized and dragon fruit cultivation areas. Dragon fruit fields are mainly distributed in rural agricultural zones, with a smaller proportion located on the outskirts of small towns, away from major urban areas. By setting preliminary thresholds, high-brightness lighting areas were effectively separated, ensuring urbanized areas and dragon fruit cultivation areas were independently extracted.
(2) Preliminary extraction using Impervious Area proportion. Based on the characteristic low presence of buildings in dragon fruit cultivation areas, vectorized lighting data were used to extract Impervious Area data and calculate the proportion of Impervious Area within independent lighting areas. Validation was conducted on dragon fruit cultivation lighting areas near town edges, and the highest observed Impervious Area proportion was used as the threshold. Lighting areas with proportions equal to or below this threshold were classified as dragon fruit cultivation areas, while those exceeding it were classified as urbanized areas. NTL pixels identified as dragon fruit cultivation areas were resampled to a 30 m spatial resolution, consistent with the Normalized Difference Vegetation Index (NDVI) data.
(3) Refinement based on NDVI characteristics. The NDVI was utilized to reflect vegetation coverage. Specifically, NDVI values below 0 represent clouds, water bodies, or snow; an NDVI of 0 indicates bare soil or rocks; and positive NDVI values signify vegetation coverage, with higher values corresponding to denser vegetation [36]. Vegetation types transition from cropland to grassland and forests as NDVI increases. Since dragon fruit cultivation areas are located on cropland, their NDVI values are lower than those of grasslands or forests. In areas with lighting overflow and vegetation coverage, the NTL radiance values in dragon fruit cultivation areas are negatively correlated with NDVI. By excluding regions with an NDVI ≤ 0, the influence of water bodies, bare soil, and other non-vegetated land types was eliminated. To further minimize interference from urban lighting, binary processing of Impervious Area (IA) data was performed, assigning a value of 1 to pixels with IA data and 0 to others, thereby excluding the impact of impervious surfaces.
Based on these characteristics, the Nighttime Light (NTL), Normalized Difference Vegetation Index (NDVI), and Impervious Area (IA) data were algebraically combined to develop the Vegetation and Impervious area Adjusted Nighttime light Dragon fruit Index (VIANDI). The formula is as follows:
V I A N D I = 1 N D V I N T L 1 I A
where N D V I refers to the portion greater than 0, and I A has been binarized. During the period from 2017 to 2022, using Guangxi municipalities as units, the reference comparison method [37] was employed to annually compare dragon fruit cultivation area data based on government statistics, aiming to determine the optimal nighttime light threshold each year.

3.3. Production Estimation

The total NTL radiance value for each city was first aggregated based on the identified dragon fruit cultivation areas. Then, the correlation between the total NTL radiance value and production was analyzed. Finally, the spatial distribution of production was reverse-engineered using the constructed estimation model.

3.3.1. Light Radiance Value Statistics

The total NTL radiance value serves as an indicator of the scale of artificial illumination in dragon fruit plantations at night. It plays a crucial role in estimating variations in dragon fruit production:
TNL = i = 1 n N T L i
where T N L represents the total NTL radiance value, with units of nW/cm2/sr. i is the pixel index in the Black Marble data within the study area, and n is the total number of NTL pixels within the study region [38].
The radiance value of unit area nighttime illumination in the study region represents the intensity of artificial lighting in dragon fruit cultivation areas.
A N L I = T N L n
where the Average Nighttime Lighting Index ( A N L I ) denotes the mean nighttime illumination, measured in nW/cm2/sr, and n represents the number of NTL pixels within the study area [39].

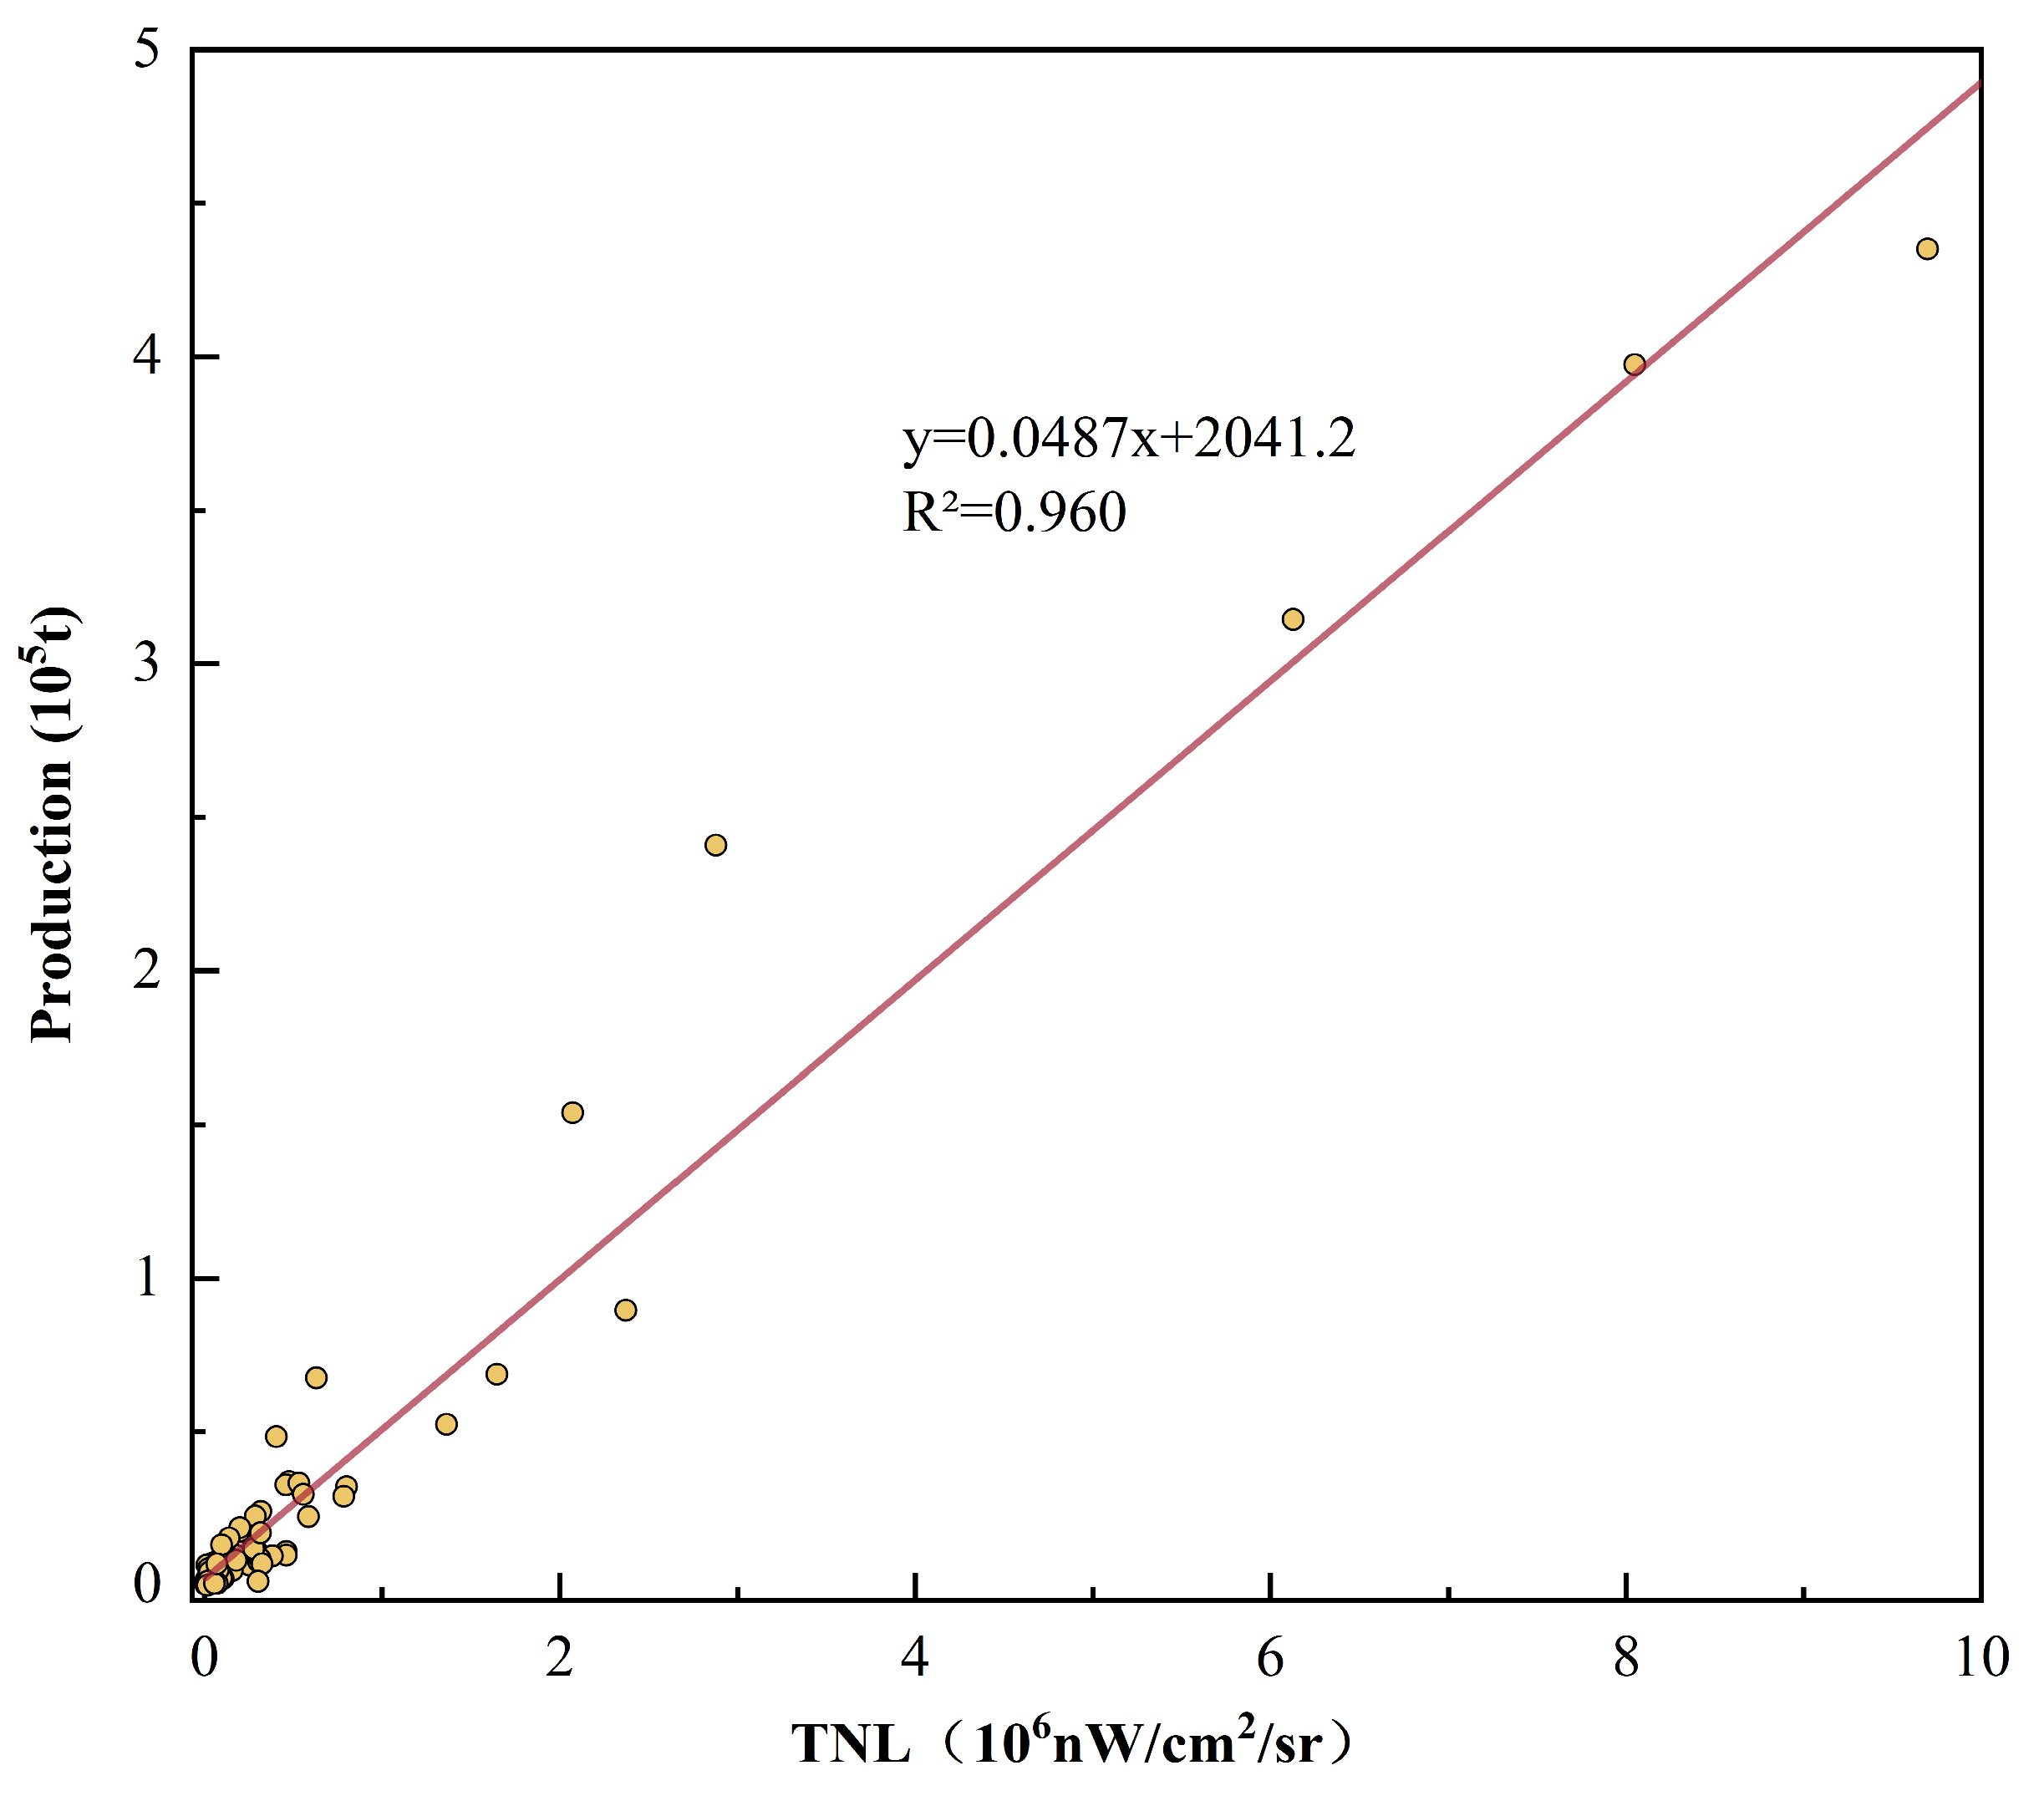
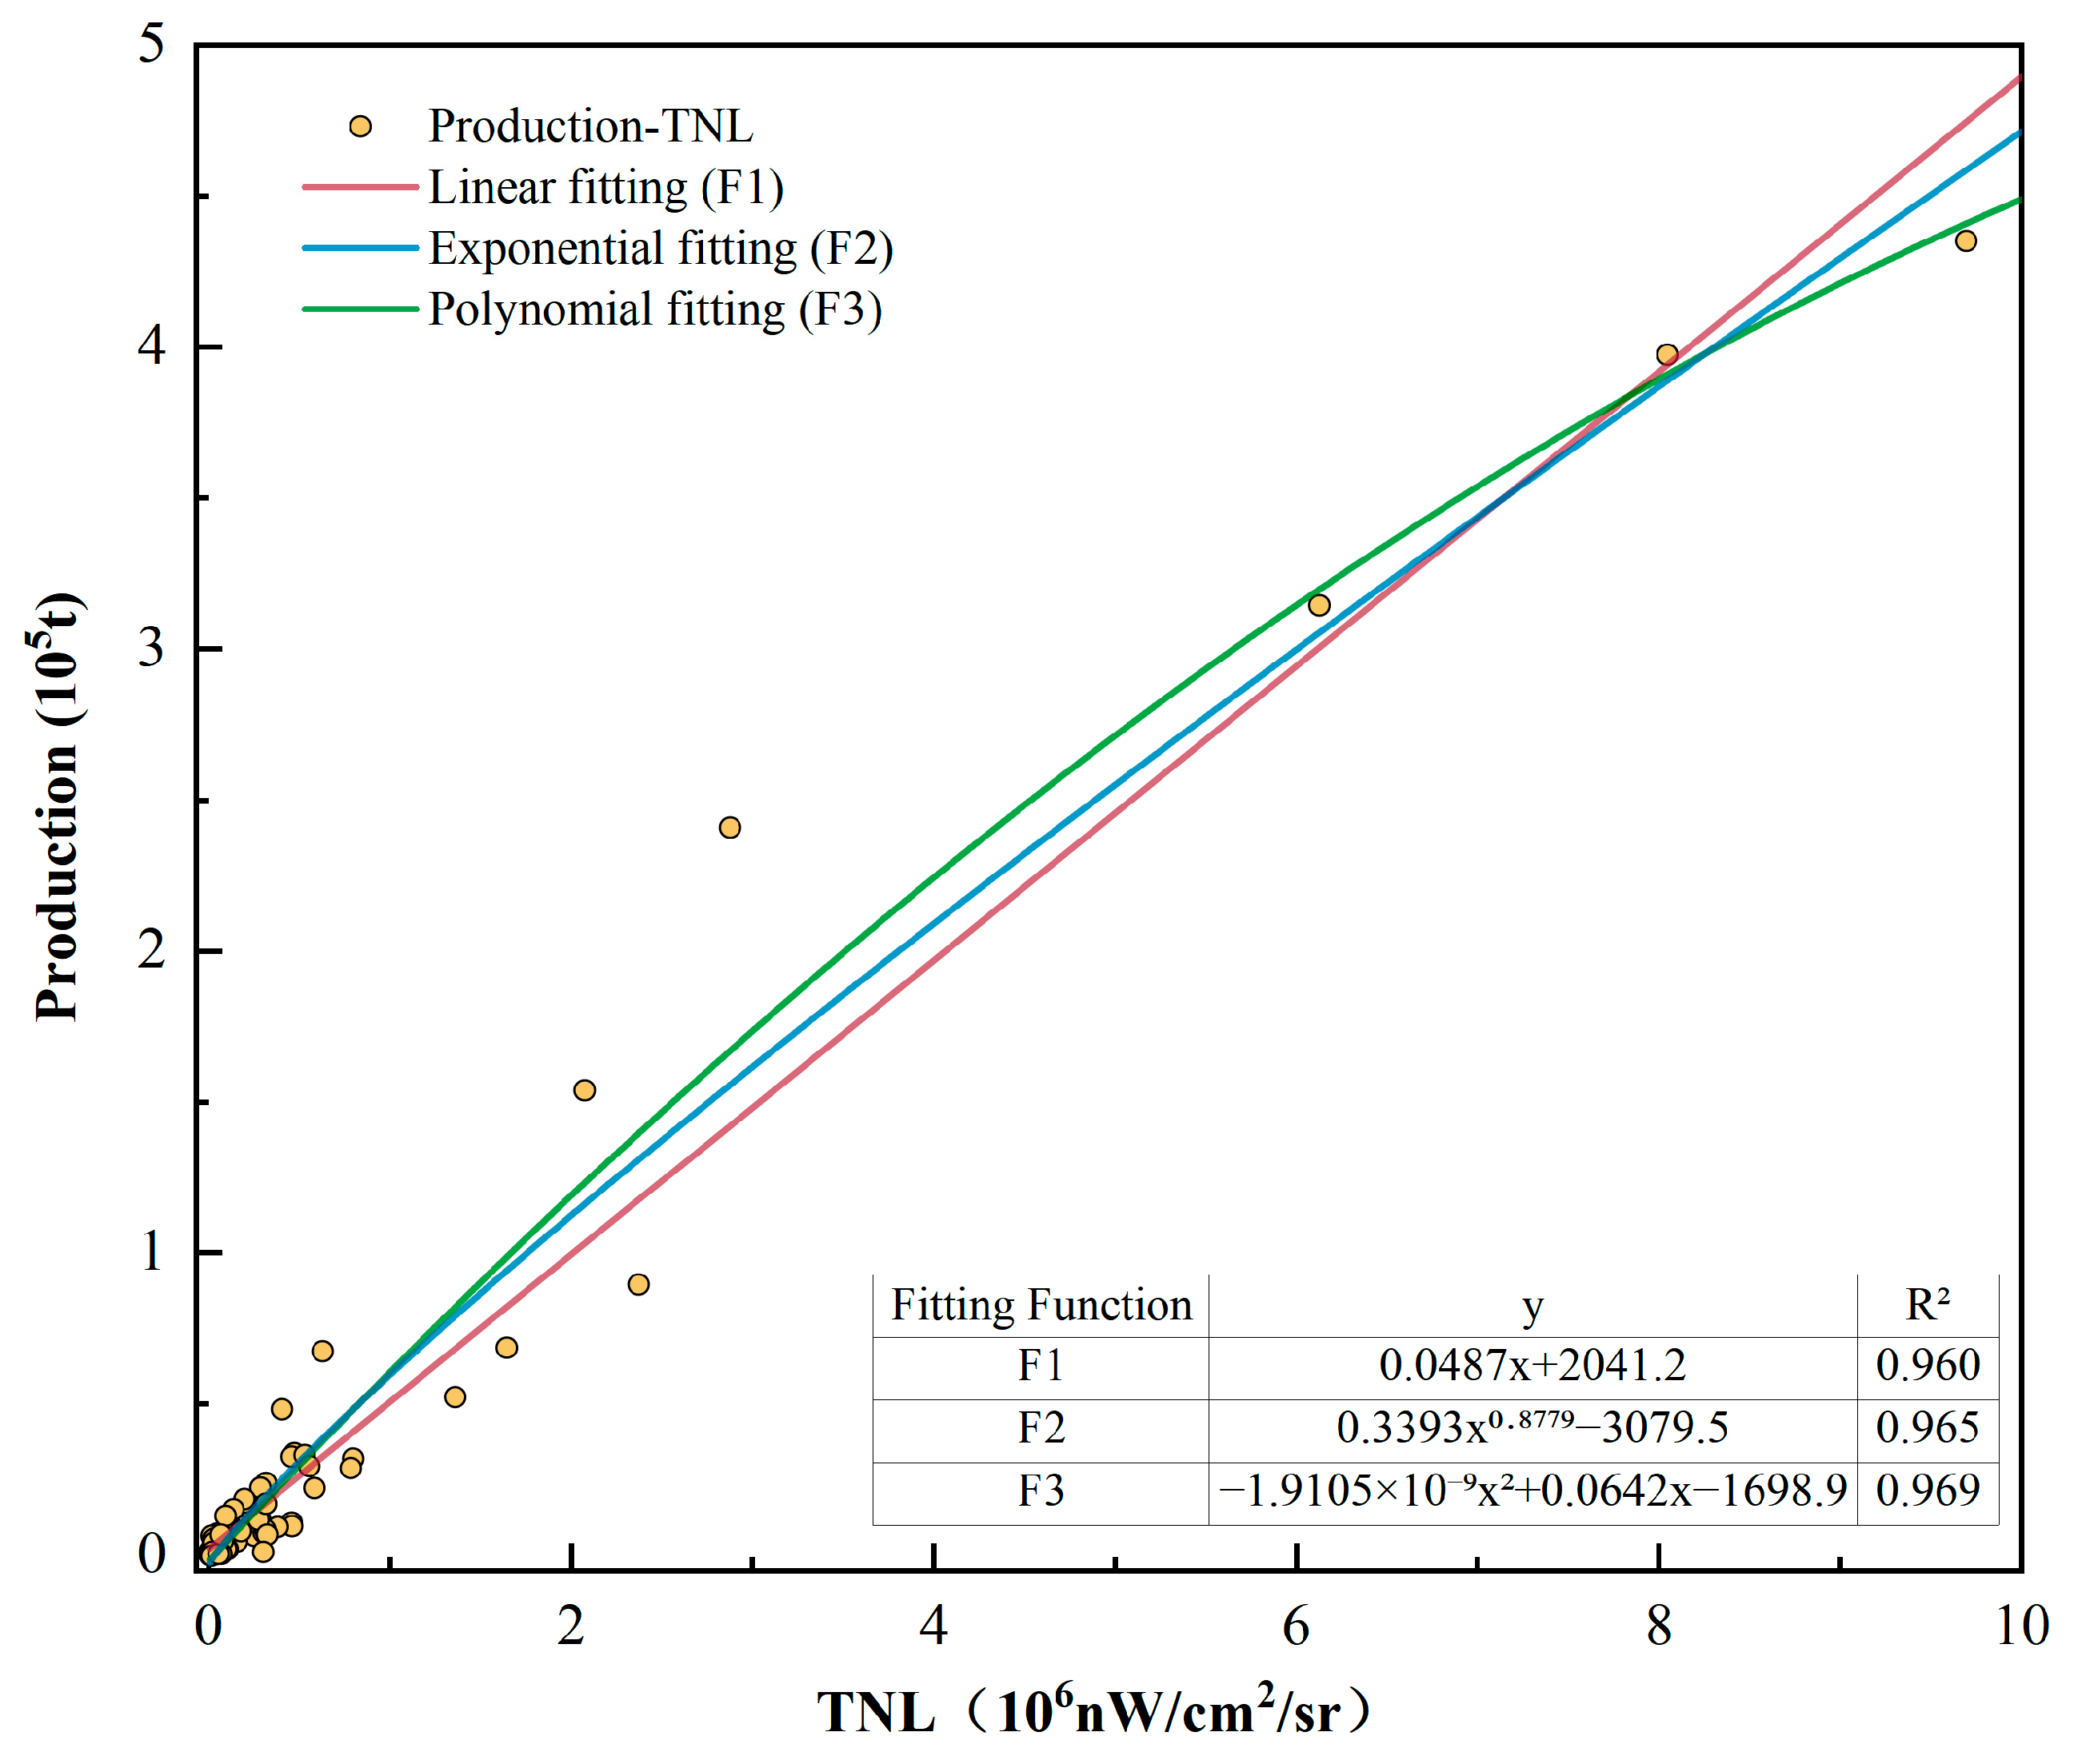
3.3.2. Correlation Analysis

Correlation analysis is a statistical method used to measure the relationship between two or more variables, assessing whether an association exists and the strength of this relationship [40]. In this study, the correlation coefficient is employed to evaluate the data correlation. The correlation coefficient, denoted as r , is calculated as follows:
r = i = 1 n x x ¯ y y ¯ i = 1 n ( x x ¯ ) 2 i = 1 n ( y y ¯ ) 2
where x and y represent the T N L and statistical production data for each region in each year, respectively, and x ¯ and y ¯ are the means of x and y , respectively. A value of r close to 1 indicates a strong positive correlation, while a value near −1 indicates a strong negative correlation. If the value is 0, there is no correlation between the variables.

3.3.3. Estimation Model Construction

This study employs a linear regression model for modeling [41], as expressed by the following formula:
P = β TNL + α
where P represents the total production statistics, and T N L is the total NTL radiance value. β is the regression coefficient, α is the intercept. The coefficient of determination (R2) is the square of r and serves as a statistical indicator to measure the extent to which the regression model explains the variation in the dependent variable. It reflects the goodness of fit of the model. The value of R2 ranges from 0 to 1, with higher values indicating better model fit.

3.4. Spatiotemporal Dynamics Analysis

3.4.1. Change Trend

The extracted area and estimated production data for each city in Guangxi Zhuang Autonomous Region from 2017 to 2022 are statistically analyzed, and the spatiotemporal change trends are described. The spatial pattern is represented by the average per-unit-area dragon fruit production over six years, while the temporal dynamics are expressed by the average changes over time.
P a v g = t P i , t t 2017 2022
Δ P a v g = t P i , t 2 P i , t 1 t 2017 2022
where P a v g represents the average unit area dragon fruit production from 2017 to 2022, t 2017 2022 denotes the number of years from 2017 to 2022, and Δ P a v g indicates the annual average change in unit area dragon fruit production during the same period.

3.4.2. Standard Deviation Ellipse

The standard deviation ellipse method is an effective tool for revealing the spatial characteristics of geographic features. It not only accurately determines the centroid location but also characterizes the directional distribution of the features [42]. Using this method, the primary directional trends of dragon fruit production distribution over time can be visually presented, providing valuable support for studying the dynamic changes in dragon fruit planting areas.
M x j , y j = i = 1 n p i x i i = 1 n p i , i = 1 n p i y i i = 1 n p i
σ x = i = 1 n p i x ^ i cos θ p i y ^ i sin θ i = 1 n p i 2
σ y = i = 1 n p i x ^ i sin θ p i y ^ i cos θ i = 1 n p i 2
where x i and y i represent the coordinates of position i , x ^ i y ^ i is the difference between the average center and the xy-axis, p i represents the dragon fruit production, θ denotes the azimuth, and M x j , y j represents the coordinates of the ellipse’s centroid in year j .

3.4.3. Spatial Autocorrelation

Spatial autocorrelation analysis is an effective measure for assessing the degree of spatial aggregation of attributes within spatial units [43]. To reveal the spatial distribution characteristics of dragon fruit cultivation area and production in Guangxi Zhuang Autonomous Region, this study utilizes both global and local spatial autocorrelation. These methods are employed to examine the overall and local correlations and clustering effects of spatial distributions. The Global Moran’s I is primarily used to analyze global spatial autocorrelation. The formula is as follows:
M I G l o b a l = n i = 1 n j n w i j x i x ¯ x j x ¯ i = 1 n j n w i j i = 1 n ( x i x ¯ ) 2
where n represents the total number of regions, w i j is the spatial weight, and x ¯ is the average of the area or production. The value of the Global Moran’s I ranges from [−1, 1]. The closer the value is to 1, the stronger the positive spatial correlation; the closer it is to −1, the stronger the negative spatial correlation. A value near 0 indicates a random spatial distribution.
While the Global Moran’s I reflects the overall spatial pattern, it may overlook atypical characteristics of local areas. Therefore, this study also employs local spatial autocorrelation to examine the local clustering phenomena of dragon fruit cultivation area and production distribution. The Local Moran’s I index is used for this purpose, and the equation is as follows:
I i = x i x ¯ j = 1 n W i j x j x ¯ S i 2
S i 2 = j = 1 n ( x j x ¯ ) 2 n 1
where x i represents the area or production of element i , x ¯ is the average value, and W i j denotes the spatial weight. The results show four types of spatial correlation patterns: High–High (HH), Low–Low (LL), High–Low (HL), and Low–High (LH) [44].

3.5. Accuracy Assessment

Accuracy assessment includes the evaluation of area extraction accuracy and production estimation model performance. Area extraction accuracy assessment involves validating the extracted dragon fruit cultivation area. Random validation points are generated within the study area, and visual interpretation is used to determine whether these points correspond to dragon fruit fields. The results are then classified, and a confusion matrix is constructed from the point data. The evaluation metrics commonly used for the confusion matrix include the Producer’s Accuracy (PA), User’s Accuracy (UA), Overall Accuracy (OA), and Kappa Coefficient (KC) [45].
Model accuracy assessment refers to the process of evaluating and verifying the fitting performance of regression models [46]. Through this assessment, the model’s performance can be understood, and its suitability for practical applications can be determined. In this study, Relative Error (RE) and Mean Relative Error (MRE) are used for testing. The calculation formulas are as follows:
RE = E a E b E b × 100 %
MRE = i = 1 n ( R E ) i n
where R E   is the relative error, E a represents the production estimated by the model, and E b refers to the statistical production data. M R E is the mean relative error. When both the RE and MRE are within a small range, the model is considered accurate and can be used for further analysis. A lower MRE value approaching zero indicates higher fitting accuracy, typically considered within 10% [47,48].

4. Results and Analysis

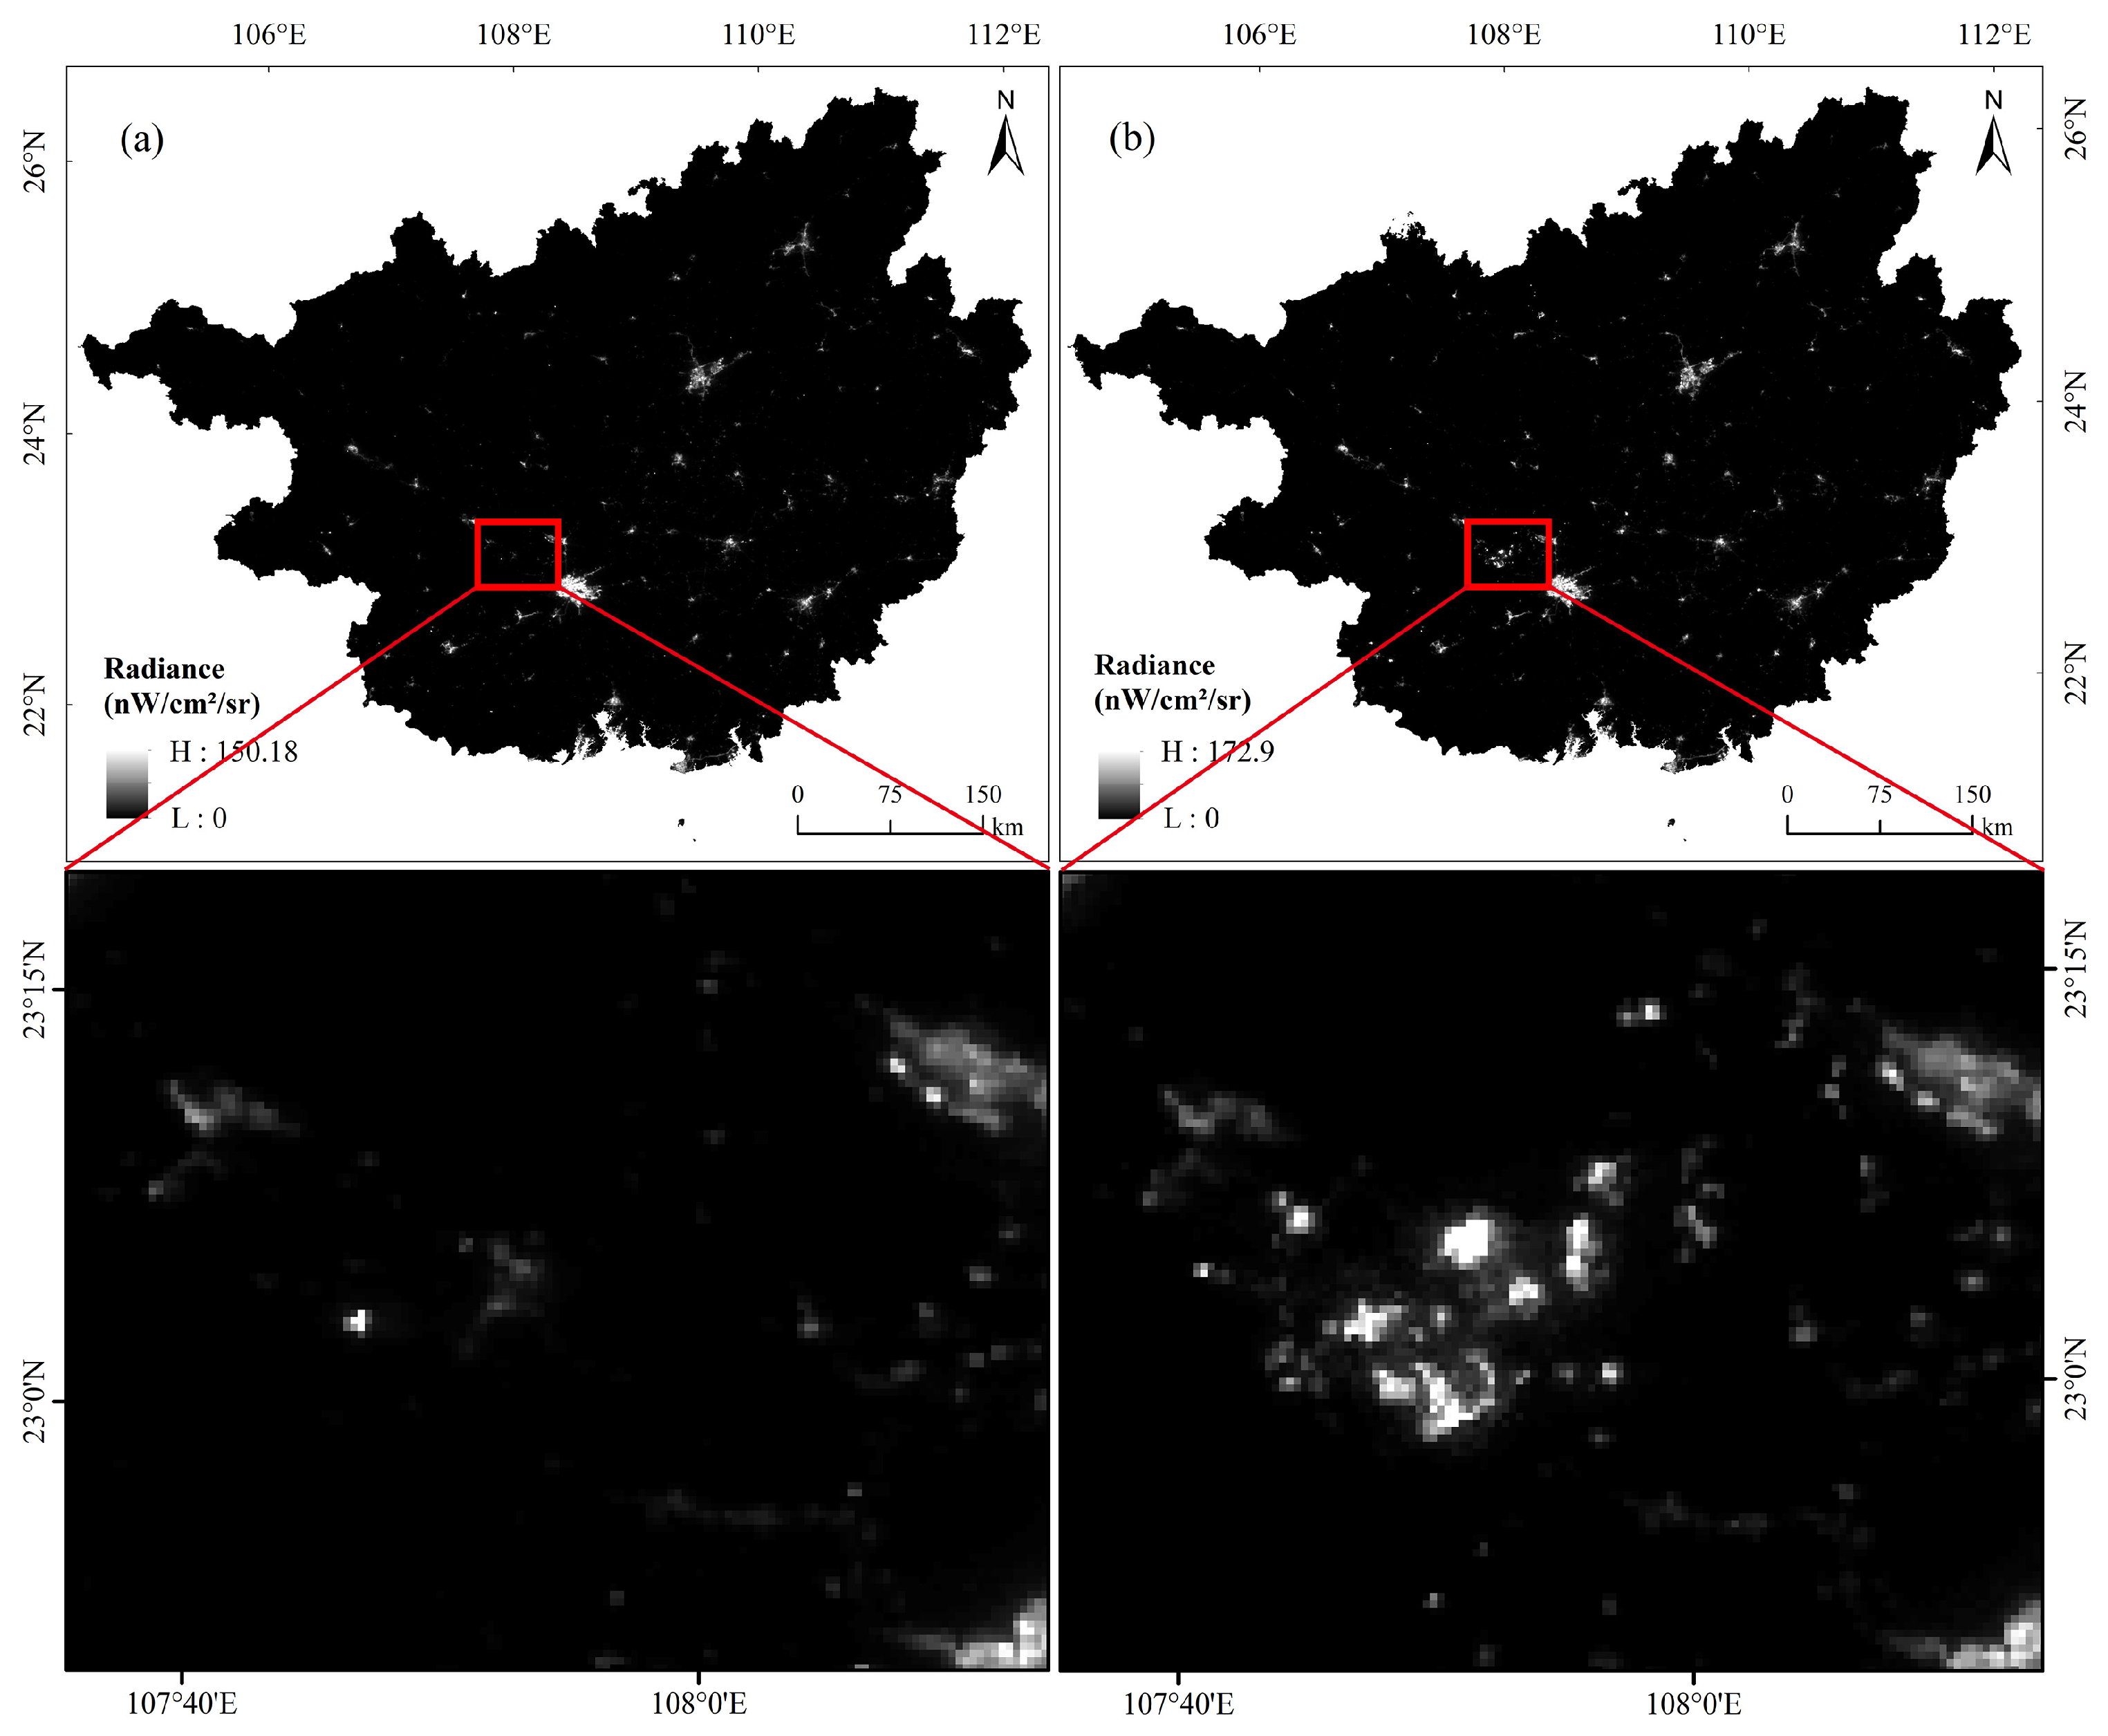
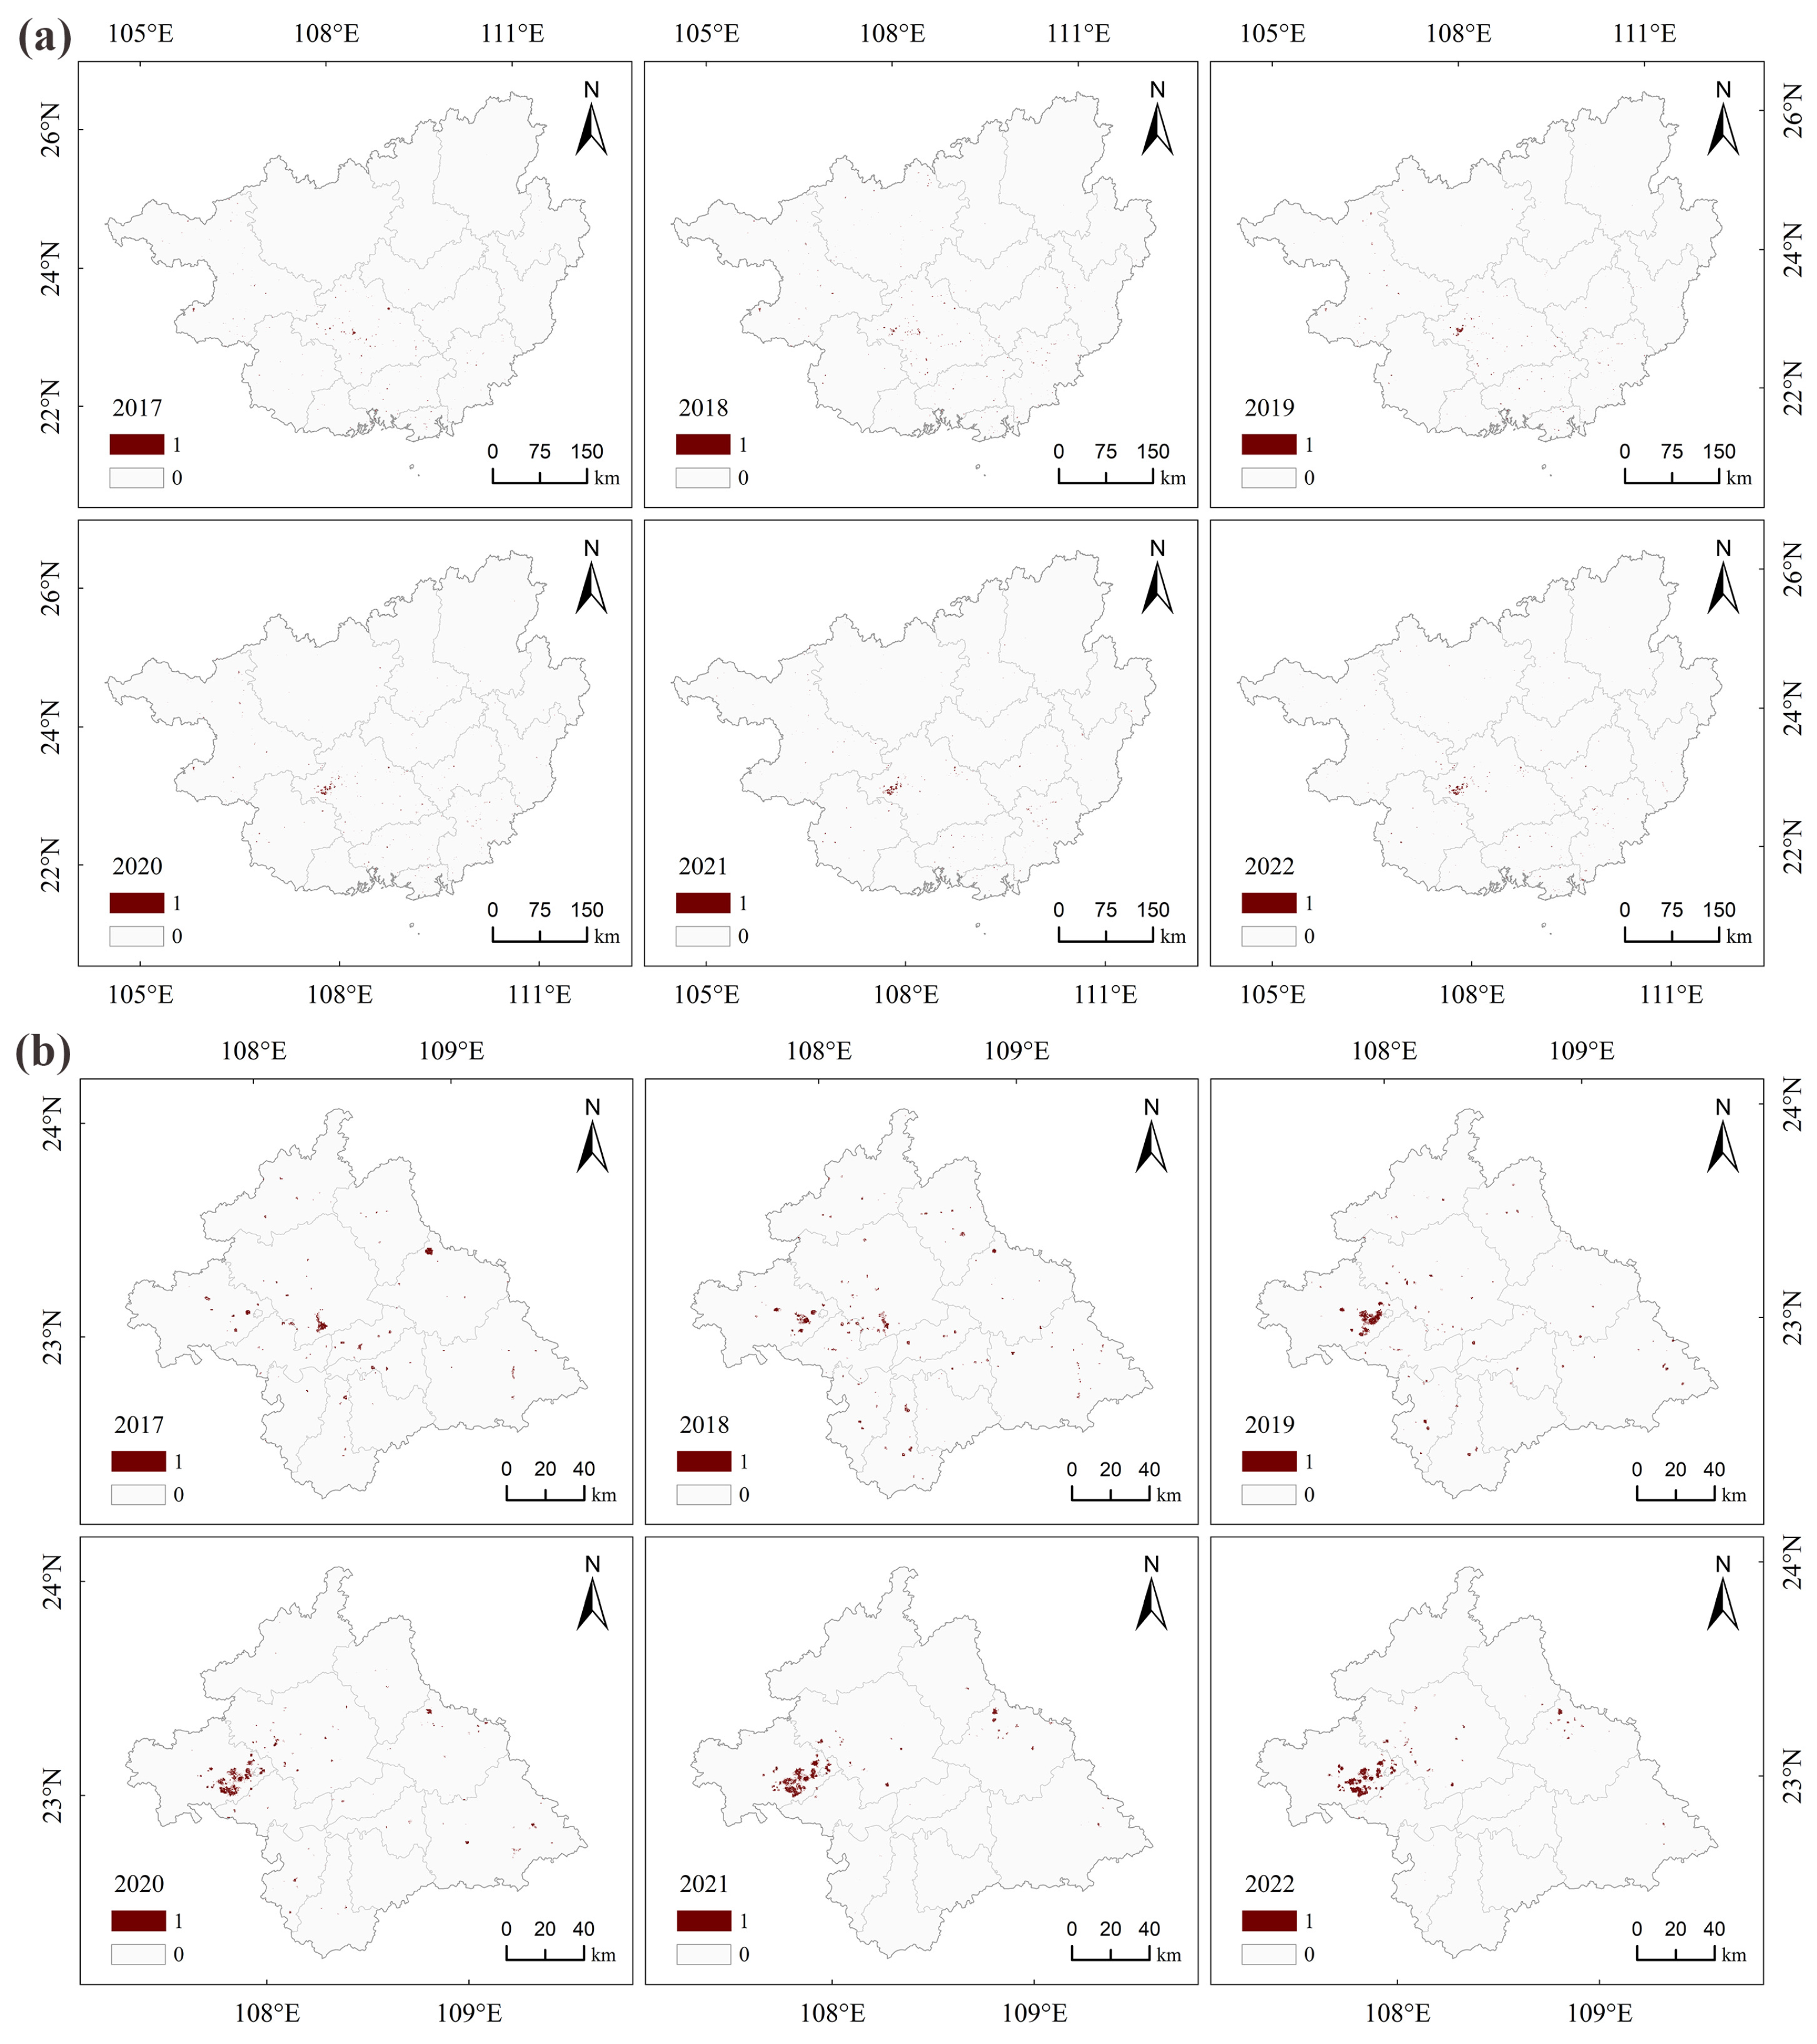
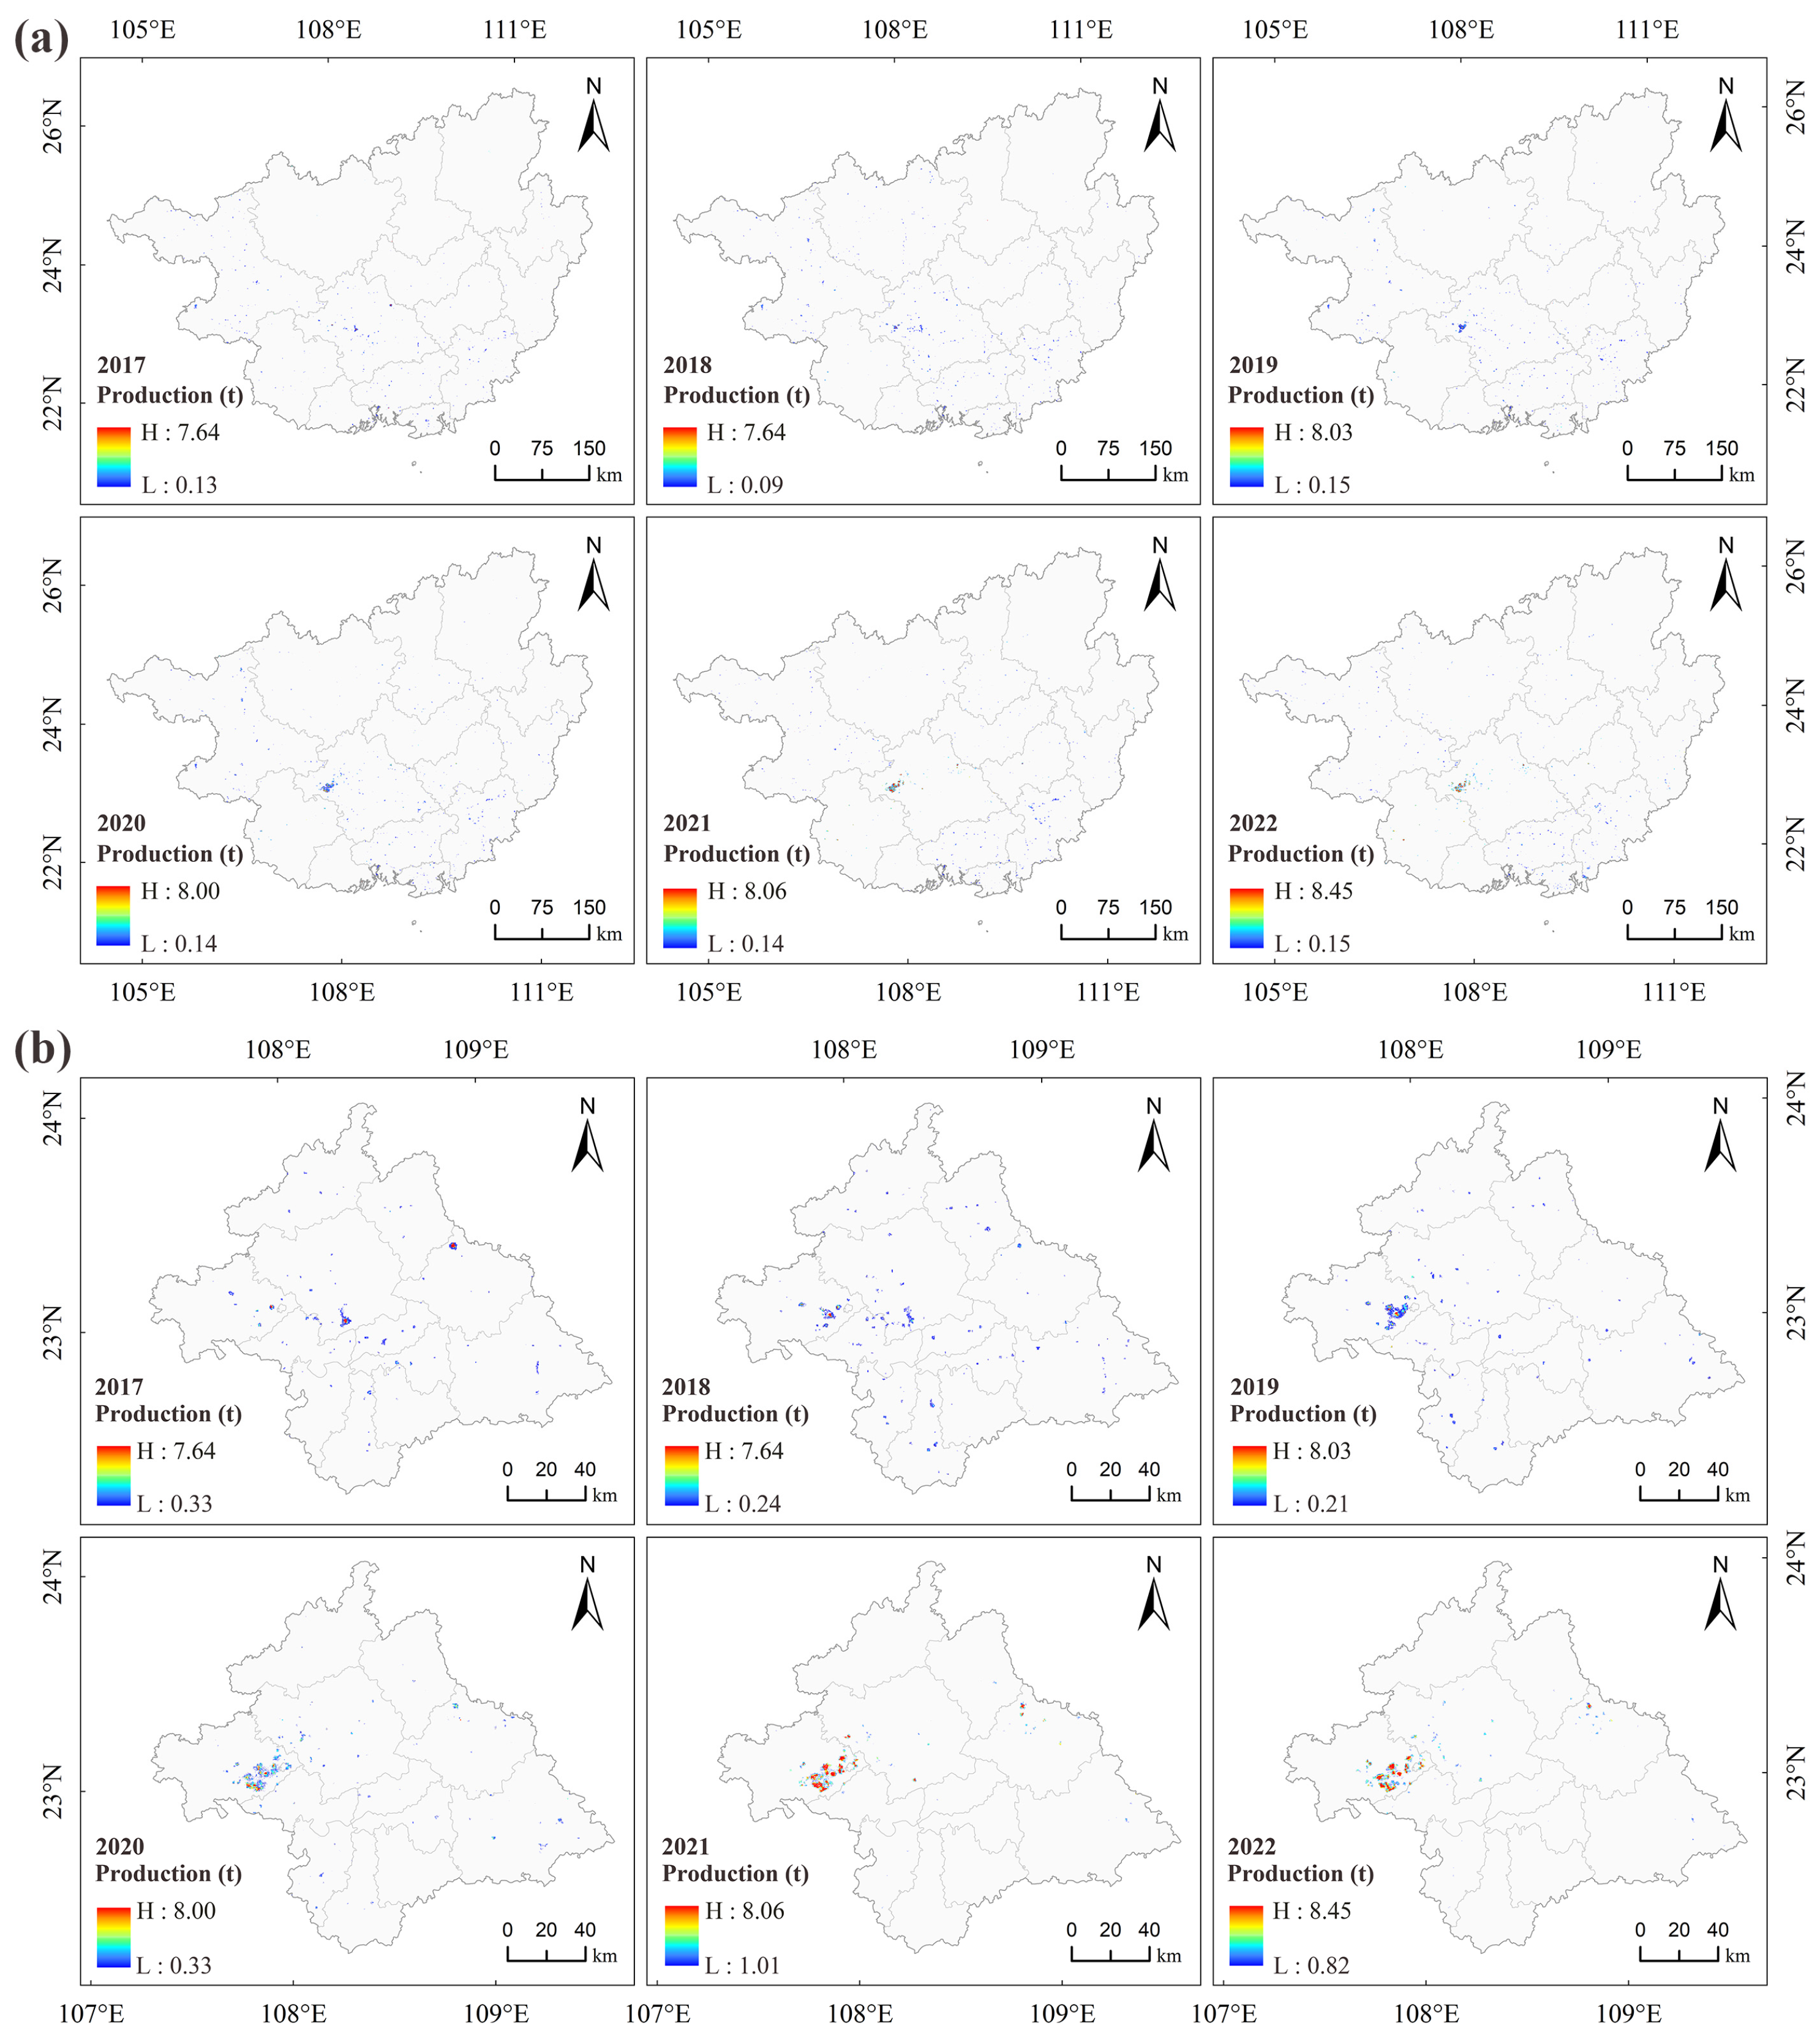
4.1. Spatial Pattern

Figure 4a illustrates the spatial distribution characteristics of the dragon fruit cultivation area in Guangxi Zhuang Autonomous Region from 2017 to 2022. The planting area increased from 151.4 km2 in 2017 to 232.9 km2 in 2022. Overall, dragon fruit cultivation in Guangxi is primarily concentrated in the northwestern, southwestern, central–southern, and southeastern regions. The central–southern region has the largest cultivation area and serves as the core zone for dragon fruit farming, which is closely linked to the geographical location and regional advantages of Nanning City. From Figure 4b, the spatial distribution of the extracted dragon fruit cultivation area in Nanning from 2017 to 2022 shows a clear trend of concentration toward the western part of the city, particularly in Long’an County, where the cultivation area has significantly increased, forming a distinct concentration of planting zones.
Using the preprocessed and corrected NTL remote sensing images, a mask was applied to the dragon fruit cultivation areas, generating the NTL data for the dragon fruit planting zones. The correlation coefficient r = 0.979, which is close to 1, indicates a strong positive correlation between the Black Marble data and dragon fruit production. The linear regression model between dragon fruit production and TNL at the city level, built in this study, shows that the coefficient of determination (R2) reached 0.960, indicating a strong fit (Figure 5). The results demonstrate that NTL data can effectively model dragon fruit production in Guangxi Zhuang Autonomous Region from 2017 to 2022.
Based on the model established in this study, dragon fruit production from 2017 to 2022 was estimated. Figure 6 shows the spatial distribution of estimated dragon fruit production in the Guangxi Zhuang Autonomous Region. From 2017 to 2022, the dragon fruit production increased from 189.6 to 693.4 kt. Overall, the high-production areas were concentrated in Nanning, particularly in the westernmost part of the city, Long’an County, which corresponds to the county’s large dragon fruit cultivation area.

4.2. Spatiotemporal Dynamics

4.2.1. Trend Analysis

Figure 7 illustrates the trend changes in the estimated dragon fruit production in Guangxi Zhuang Autonomous Region. Figure 7a shows that from 2017 to 2022, the maximum average unit area dragon fruit production at the pixel scale increased from 8.5 kt/km2 to 9.4 kt/km2. The average production per unit area below 0.5 kt/km2 accounted for 74.1% of the total pixel area, followed by the 0.5–1 kt/km2 category, which represented 10.7%. Unit area productions exceeding 0.2 kt/km2 comprised approximately 6.7% of the total pixels but contributed to 38.5% of the total dragon fruit production (Figure 7b). From 2017 to 2022, the area with increased dragon fruit production per unit area (61.9%) significantly outpaced the area with decreased production (38.1%). The regions with increased production were primarily located in the western parts of Nanning and Chongzuo, while the decreasing areas were spread across other regions of Nanning, western Guangxi, and the southeastern areas.
Figure 7c presents the annual changes in dragon fruit cultivation area and production across 14 cities in Guangxi from 2017 to 2022. Overall, the dragon fruit cultivation area in the entire autonomous region shows an increasing trend. However, after 2019, which serves as a pivotal year, the growth rate in the region has slowed. Notably, 10 cities experienced an increase in dragon fruit cultivation area, while 4 cities saw a decrease. Specifically, the most notable increases were observed in Liuzhou (1703.64%), Hechi (665.86%), Guilin (378.11%), and Guigang (314.99%), followed by Wuzhou (220.16%), Laibin (151.03%), Chongzuo (141.04%), Yulin (113.80%), Nanning (68.01%), and Qinzhou (19.34%). In contrast, the cultivation areas in Fangchenggang (−79.68%), Hezhou (−26.41%), Baise (−23.83%), and Beihai (−13.16%) saw significant reductions.
The total dragon fruit production in the region showed a sustained and rapid growth trend, with 10 cities experiencing increased production, while 4 cities saw a decline. Specifically, Guigang (2851.04%), Chongzuo (1622.87%), Wuzhou (982.80%), Laibin (592.17%), Liuzhou (385.16%), Yulin (352.11%), and Nanning (305.73%) exhibited the most substantial increases in production, followed by Hechi (148.65%), Guilin (127.39%), and Beihai (110.16%). In contrast, Hezhou (−40.39%), Fangchenggang (−26.96%), Qinzhou (−15.51%), and Baise (−15.46%) showed significant declines in production.
Among the cities with increased unit area dragon fruit production, Chongzuo experienced the highest increase (614.77%). Additionally, while Qinzhou’s cultivation area increased, its production decreased, resulting in a significant drop in unit area production (−29.20%). This reflects the low cultivation efficiency of dragon fruit in Qinzhou, leading to a reduction in production per unit area. This change may be related to the region’s current focus on developing other types of fruit cultivation [49].

4.2.2. Standard Deviation Ellipse Analysis

Figure 8 presents the standard deviation ellipses of dragon fruit production distribution and the migration trajectory of the centroid from 2017 to 2022. From the figure, it can be observed that during the study period, the centroid of dragon fruit production in Guangxi remained consistent within Nanning. The long axis of the ellipse typically extended in a northwest–southeast direction, indicating that the dragon fruit production in Guangxi is generally more concentrated along the northwest–southeast axis, and the spatiotemporal distribution of production follows this pattern.
As indicated by the parameters in Table 2, from 2017 to 2022, the standard deviation ellipse of dragon fruit production in Guangxi exhibited a spatial contraction trend. Specifically, the area of the ellipse decreased from 56,231.53 to 47,411.42 km2, representing a contraction rate of 15.69%. Furthermore, the orientation angle of the ellipse changed from 110°22′ to 106°04′, with the long axis shortening by 30.555 km and the short axis increasing by 0.524 km. This suggests that the distribution area of dragon fruit production in Guangxi is gradually contracting, the spatial directional distribution is weakening, and the difference in production between the northern and southern regions is diminishing. In recent years, Guangxi’s fruit industry has actively promoted the development of the dragon fruit sector, recognizing it as a key fruit species. With abundant land and a large labor force, Guangxi has gradually formed the advantage of large-scale production bases, and the dragon fruit industry has increasingly shifted toward large-scale operations, leading to a more concentrated production distribution [50].
From 2017 to 2021, the centroid of dragon fruit production in Guangxi shifted northeast by 10.461 km. This change is partly due to the eastward movement of the production centroid in Baise, the westernmost city in Guangxi, and partly due to the northward shift in dragon fruit production from Hengzhou to Binyang in the eastern part of Nanning. Therefore, overall, the centroid of dragon fruit production in Guangxi shifted northeast. From 2021 to 2022, the centroid shifted southward by 3.587 km. This change can be attributed to the new policies introduced by the Guangxi Zhuang Autonomous Region government in 2022 [51], which focused on creating an optimal dragon fruit cultivation core area centered around Long’an in Nanning, as well as promoting the most suitable ecological areas for dragon fruit in southern Guangxi, including Chongzuo and Yulin. These initiatives led to the southward migration of the production centroid.

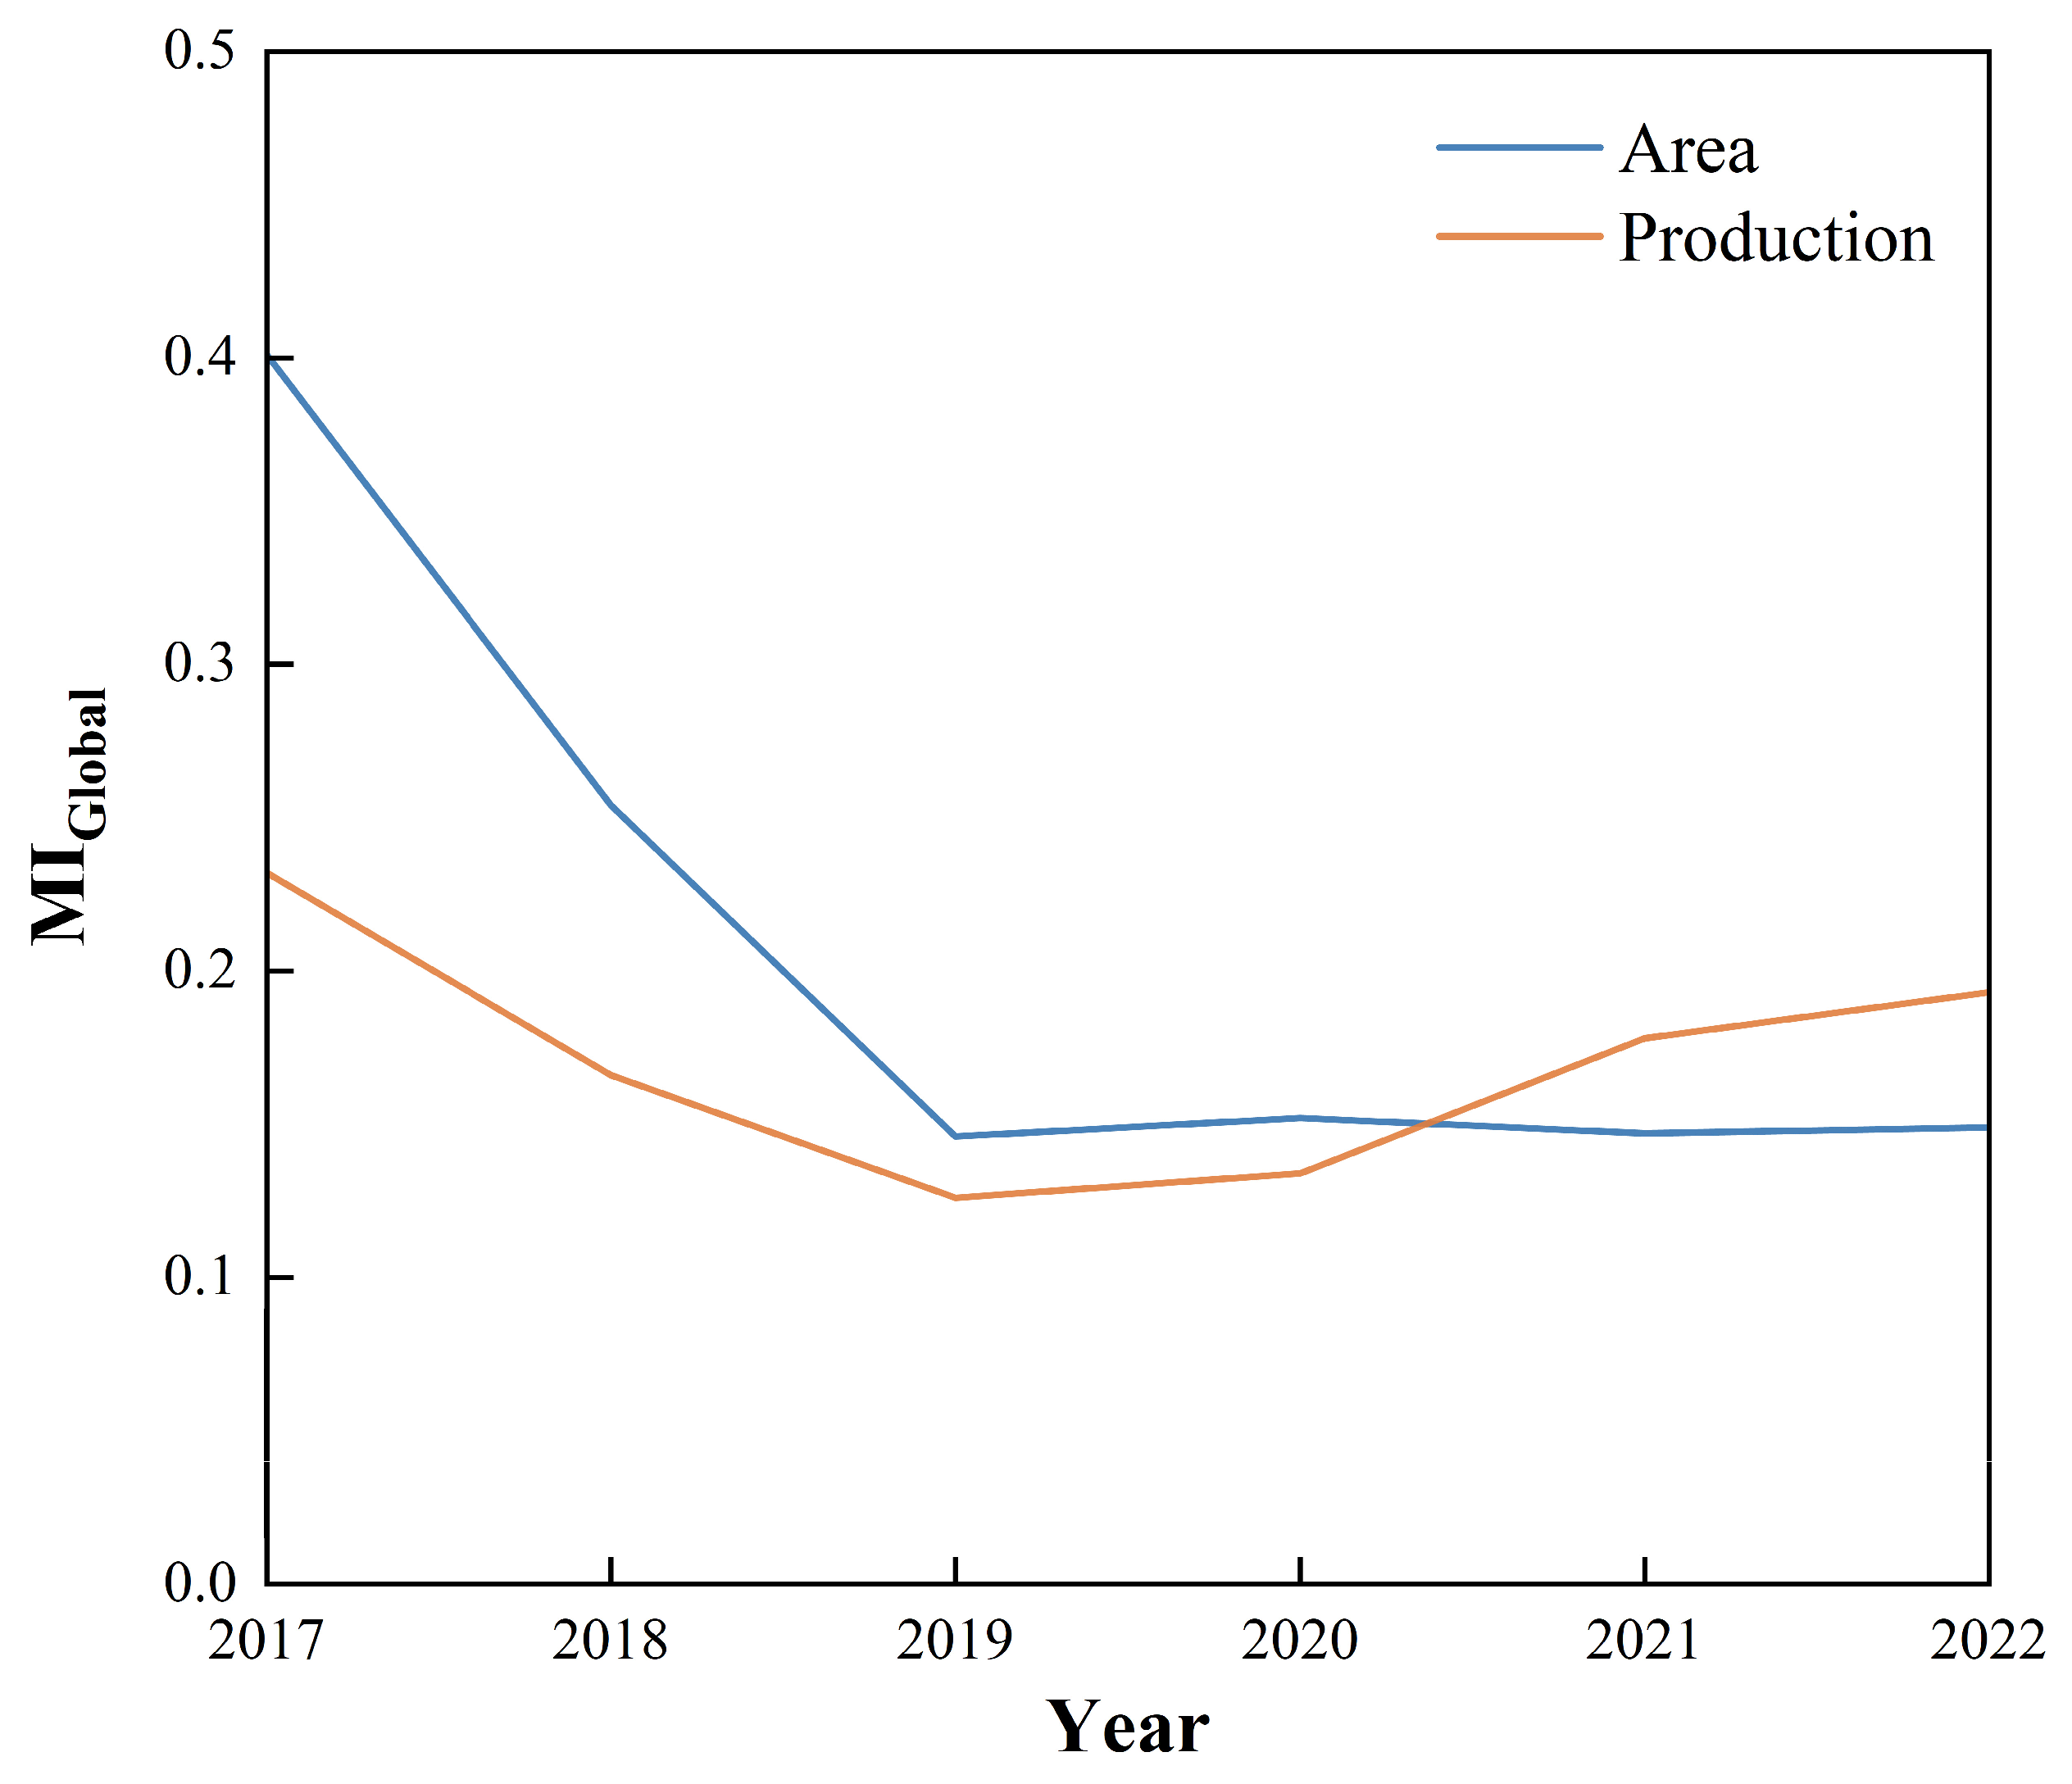
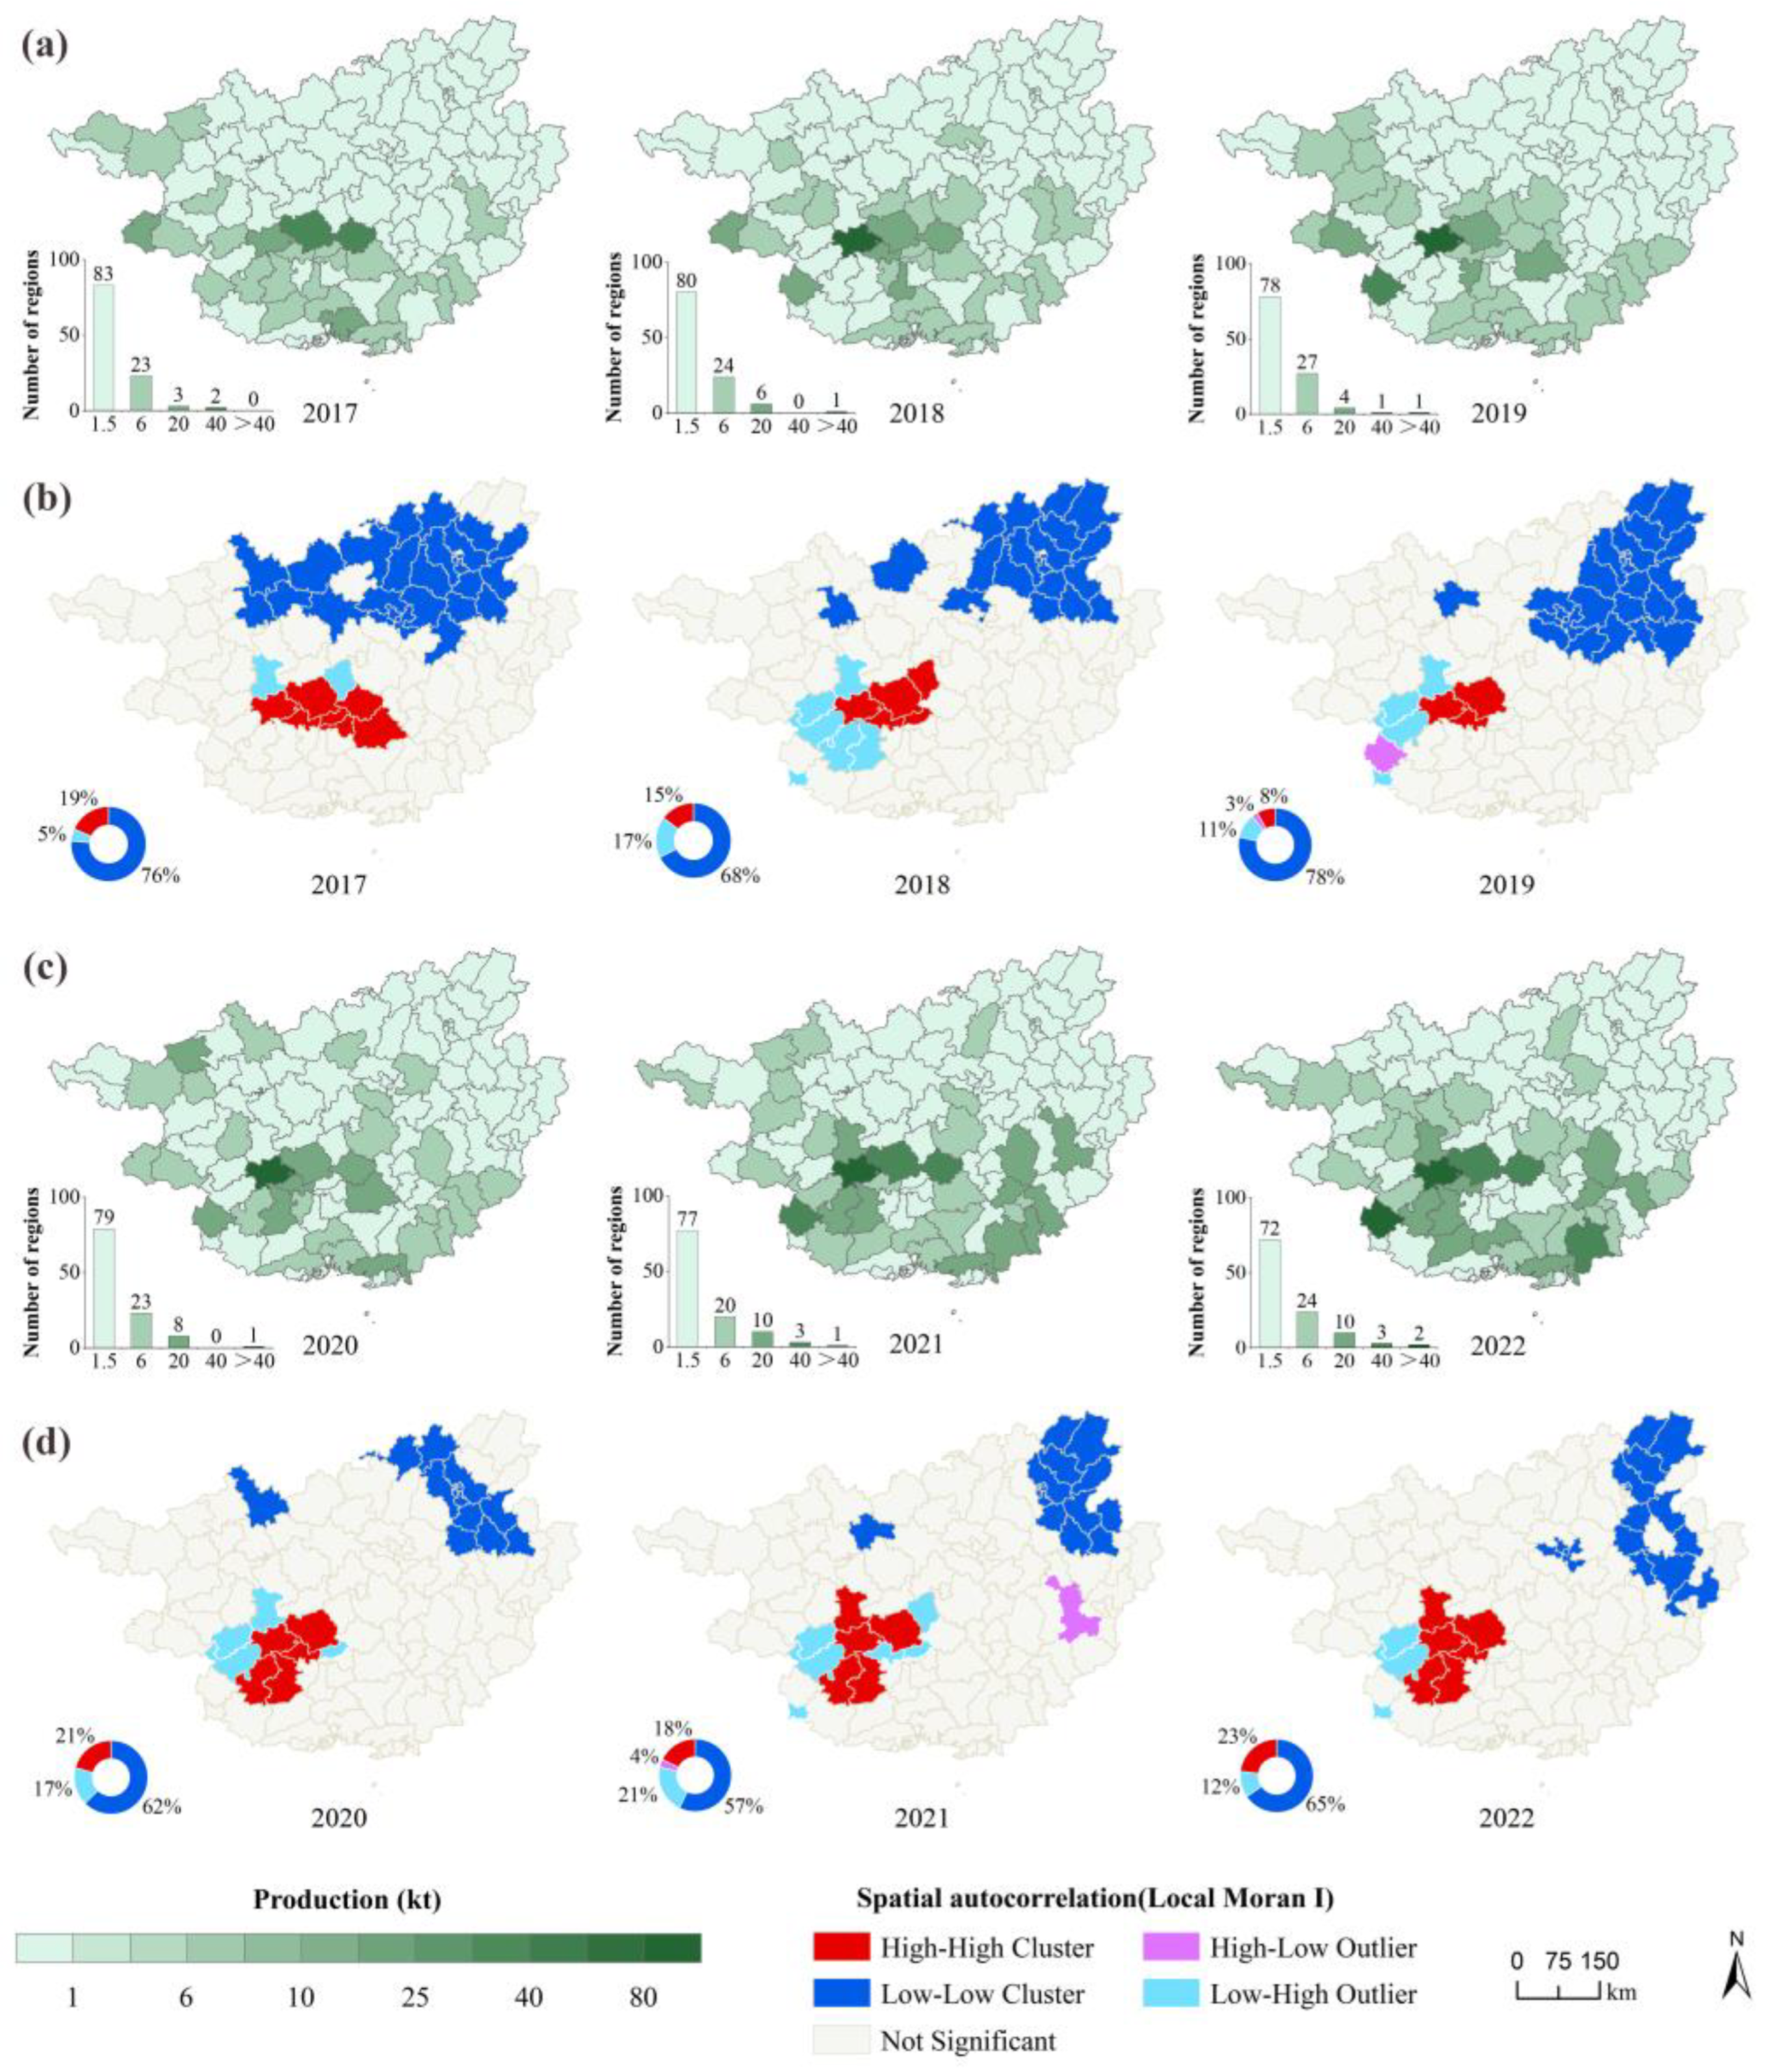
4.2.3. Spatial Autocorrelation Analysis

To explore the overall spatial clustering characteristics of dragon fruit cultivation area and production, the Global Moran’s I was used to analyze the spatial autocorrelation between cultivation area and production in the dragon fruit-growing regions of Guangxi from 2017 to 2022 (Figure 9). The Global Moran’s I values for all years were greater than 0, indicating a positive spatial correlation between the cultivation area and production. During the 2017–2019 period, the Global Moran’s I values for cultivation area and production showed a decreasing trend, indicating that the spatial clustering effect was gradually weakening, and the spatial distribution of both area and production was expanding. From 2019 to 2022, the Global Moran’s I value for cultivation area leveled off, stabilizing near 0.15, suggesting that the spatial distribution of the cultivation area became more stable. In contrast, the Global Moran’s I value for production showed an upward trend, indicating that the spatial clustering effect of production was gradually intensifying.
The local spatial correlation analysis of the cultivation area revealed a contraction trend from 2017 to 2022. Although the number of counties with an area of 0–0.6 km2 and the number of counties with areas exceeding 13 km2 remained unchanged, the positions of counties in other area categories changed slightly (Figure 10a,c). Figure 10b,d display the LISA (Local Indicators of Spatial Association) clustering maps for cultivation area. The clustered areas passed the 5% significance level test, with different colors representing various types of spatial clusters. The HH and LL clusters are the main types of local spatial autocorrelation. The LL-type clusters were mainly distributed in the northern and northeastern parts of Guangxi, showing a trend of gradual eastward movement, with the number of clusters decreasing, from 76% to 69%. On the other hand, HH-type clusters were predominantly concentrated in the central and western parts of Guangxi, with the proportion of clusters decreasing from 21% to 8% between 2017 and 2019, but then increasing from 8% to 16% between 2019 and 2022. Overall, the reduction in the number of HH-type clusters suggests that the growth of dragon fruit cultivation area is slowing, and spatial expansion is becoming more restricted. This reflects a gradual contraction in the local spatial development of dragon fruit cultivation areas in Guangxi.
The local spatial correlation analysis of production revealed an expansion trend. Figure 11a,c show that the number of counties with low productions (0–0.15 kt) decreased from 83 to 72, while the number of counties with productions exceeding 4 kt increased from 0 to 2, located in Nanning and Chongzuo. The number of counties with mid-high productions (2–4 kt) increased by one, located in Yulin. Figure 11b,d display the LISA clustering maps for production. The LL-type clusters showed a similar distribution trend to the area LISA clustering, with a decrease in the number of clusters and a decline in their proportion from 76% to 65%. HH-type clusters, mainly located in the central and western parts of Guangxi, decreased in proportion from 19% to 8% between 2017 and 2019, but then increased from 8% to 23% between 2019 and 2022. Compared to the HH-type clustering in the area LISA map, the number of HH-type clusters in the production LISA map generally increases. This indicates a more pronounced upward trend in dragon fruit production, with the spatial expansion effect of local production distribution centered around Nanning further intensifying. This also reflects a shift in the overall production distribution in Guangxi, which has become more concentrated due to the contraction of local cultivation areas.

4.3. Robustness Assessment

4.3.1. Area Extraction Accuracy Evaluation

The accuracy of the dragon fruit cultivation area extracted from NTL data for Guangxi from 2017 to 2022 was evaluated against existing statistical data. As shown in Figure 12a, at the provincial scale, the RE of the extracted results was less than 1%. At the city level, the maximum RE did not exceed 5%, with most cities exhibiting relative errors of less than 2%. This indicates that the method proposed in this study achieved high consistency with statistical data for the extraction of dragon fruit cultivation area.
To further validate the extraction accuracy, an in situ verification was conducted for Nanning’s dragon fruit fields in 2022. A total of 1000 random validation points were generated within a local study area, with a minimum distance of 4 m between points. The classification results revealed 320 points within dragon fruit fields and 680 points in non-dragon fruit areas, as shown in Figure 12b. A confusion matrix based on visual interpretation of the results revealed a PA of 72.21%, a UA of 95.00%, an OA of 86.70%, and a KC of 0.72 (Table 3). Thus, the VIANDI method for extracting dragon fruit cultivation areas effectively delineated the general contours of the cultivation regions. Additionally, the light spillover issue was significantly mitigated through the processing of NTL remote sensing images, further verifying the effectiveness and reliability of this method in extracting dragon fruit cultivation areas.

4.3.2. Production Estimation Accuracy Evaluation

Using NTL data for dragon fruit cultivation areas in the 14 cities of Guangxi from 2017 to 2022 and comparing with official production statistics (84 data points), this study evaluated the performance of linear, exponential, and polynomial regression models for production estimation. The coefficients of determination (R2) for the models were 0.960, 0.965, and 0.969, respectively, demonstrating a good fit (Figure 13).
The errors in production estimation for each model are shown in Table 4. For the linear model, the relative errors in 2018 and 2019 were −17.12% and −28.11%, respectively, both exceeding 10%. However, in the remaining years, the RE was less than 5%, with an MRE of 8.90%. For the exponential model, the relative errors in 2018 and 2019 were −12.01% and −25.54%, respectively, both exceeding 10%. In other years, the RE was less than 10%, with an MRE of 10.97%. For the polynomial model, the relative errors for four years exceeded 10%, while the remaining two years had errors below 10%, resulting in an MRE of 15.18%. Among the three models, only the linear regression model had an MRE below 10%, indicating that the linear regression model provided the best fit and its MRE was within an acceptable range. Therefore, linear regression fitting is considered the optimal method for estimating the interannual production of dragon fruit in Guangxi.

5. Discussion

5.1. Comparison of the Performance of NDLI and VIANDI in Mapping Dragon Fruit Cultivation Areas

This discussion section compares the performance differences between the Normalized Difference Light Index (NDLI) and the proposed Vegetation and Impervious area Adjusted Nighttime light Dragon fruit Index (VIANDI) in delineating dragon fruit cultivation areas. The NDLI method identifies dragon fruit plantations by detecting seasonal variations in nighttime light intensity, assuming brighter lights during winter and dimmer lights during summer, which suits regions with distinct seasonal supplemental lighting patterns. Krauser et al. [31] reported that in Binh Thuan Province, Vietnam, the NDLI-based approach achieved an Overall Accuracy of 68.9% and a Kappa Coefficient of 0.54, with a commission error rate as high as 17.7% in urban fringe areas. Although NDLI performs adequately in regions with clear seasonal lighting changes, its accuracy significantly degrades in urban–rural mixed zones or in areas lacking obvious seasonal differences (such as Guangxi, China), where non-agricultural lights cause considerable confusion.
To overcome these limitations, we developed the VIANDI by integrating NDVI (Normalized Difference Vegetation Index) and IA (Impervious Area) information, which significantly enhances the discrimination between agricultural and non-agricultural lighting. The empirical results from Guangxi demonstrate that VIANDI improves the Overall Accuracy to 86.7% and the Kappa Coefficient to 0.72 while reducing the commission error rate to below 10% and significantly decreasing the omission error. Notably, VIANDI is less dependent on pronounced seasonal lighting variations and achieves high extraction accuracy even in areas with year-round supplemental lighting or atypical seasonal lighting patterns. Moreover, VIANDI exhibits greater robustness in complex spatial environments, reduces reliance on complex classifiers, and enables effective extraction using single-period nighttime imagery, thereby expanding the potential of nighttime light remote sensing for agricultural dynamic monitoring.

5.2. Challenges of Artificial Nighttime Lighting in Dragon Fruit Cultivation on the Ecological Environment

In recent years, with the acceleration of urbanization, the excessive use of artificial nighttime lighting—commonly referred to as light pollution—has had significant impacts on both human health and the ecological environment. Studies have shown that prolonged exposure to artificial light at night disrupts the human circadian rhythm, increasing the risks of sleep disorders, metabolic dysfunction, and chronic diseases [52]. Additionally, light pollution interferes with the behavior, physiology, and reproductive cycles of wildlife, negatively affecting the survival of species such as insects, birds, and mammals [53]. In agricultural landscapes, prolonged and high-intensity artificial lighting can reduce biodiversity, alter species composition, and disrupt regional ecological balance. Moreover, excessive nighttime illumination leads to increased energy consumption and greenhouse gas emissions [54]. As a photoperiod-sensitive crop, dragon fruit cultivation has exhibited a continuous increase in nighttime lighting intensity. Between 2017 and 2022, the total nighttime light emissions from dragon fruit cultivation areas in Guangxi increased from 3.78 to 13.98 × 10⁶ nW/cm2/sr, marking a 269.74% increase. Specifically, nighttime light emissions in Nanning’s dragon fruit cultivation areas rose by 308.94%, while those in Chongzuo surged by an astonishing 1636.48%. In contrast, Baise experienced a 14.79% decline in nighttime lighting intensity. Nanning consistently remained the dominant source of nighttime lighting emissions among all dragon fruit cultivation areas in Guangxi, with its contribution rising from 62.71% to 69.36% of the total emissions. These findings indicate a rapid and substantial increase in nighttime lighting intensity, which may exert significant pressure on the ecological environment.
From 2017 to 2018, the dragon fruit cultivation area in the entire region increased from 225,200 to 322,000 mu, an expansion of nearly 100,000 mu. As a result of this expansion, the distribution of dragon fruit cultivation became more dispersed, leading to a significant decrease in the average unit area nighttime light intensity, from 23.7 to 15.2 nW/cm2/sr, a decline of 35.86% (Figure 14b). However, in 2019, the Central Committee of the Communist Party of China and the State Council issued “Opinions on Establishing the National Spatial Planning System and Supervising Its Implementation,” which strengthened farmland protection policies [8]. This policy not only effectively curbed the rapid expansion of orchard areas but also promoted a regional restructuring of dragon fruit cultivation in Guangxi. Under the guidance of the policy, small-scale, dispersed planting areas were gradually integrated by enterprises, leading to a shift toward large-scale and intensive cultivation. This transition is clearly reflected in nighttime light data: the light intensity in key production areas such as Nanning, Baise, and Chongzuo showed varying degrees of change. Specifically, the Baise dragon fruit cultivation area saw a gradual reduction in light intensity, even fading completely, due to the decrease in cultivation area; whereas in Nanning and Chongzuo, the light intensity increased continuously as cultivation areas became more concentrated (Figure 14c). Notably, from 2017 to 2022, the unit area light intensity in Chongzuo’s dragon fruit cultivation area grew from 14.7 to 106.2 nW/cm2/sr, a remarkable increase of 622.45%, which closely correlates with the significant rise in unit area dragon fruit production.
While regional productivity has improved, it has also led to serious light pollution. Therefore, addressing how to reduce the ecological impact of light pollution while maintaining agricultural productivity has become a pressing issue. Future solutions could include promoting intelligent lighting management systems, optimizing light sources (such as adopting low-pollution LED lights), and formulating agricultural lighting standards. Through these measures, it is possible to reduce light pollution to the greatest extent while maintaining agricultural economic productivity, thereby achieving a win–win goal of sustainable agricultural development and ecological balance.

5.3. Impact of Government Policies and Global Health Events on Dragon Fruit Cultivation

The continuous growth of Guangxi’s total dragon fruit production has been driven by a combination of policy support and the impact of the COVID-19 pandemic. The development of Guangxi’s dragon fruit industry is closely aligned with China’s 14th Five-Year Plan [55]. As a key agricultural province, Guangxi plays a vital role in China’s characteristic agricultural sector, with dragon fruit cultivation receiving strong governmental support. Under the 14th Five-Year Plan, which emphasizes the integration of agriculture and industry, the dragon fruit industry has emerged as a crucial pillar for achieving sustainable rural economic development.
Moreover, following the outbreak of COVID-19 in 2019, China implemented strict quarantine and control measures that significantly restricted cross-border trade with Vietnam, the country’s largest supplier of imported dragon fruit [56]. This disruption reduced competition in the domestic dragon fruit market, creating a favorable environment for Guangxi’s cultivation industry. As a result, farmers were incentivized to expand production, further driving the industry’s growth. Beyond economic benefits, the expansion of the dragon fruit sector has contributed to rural economic development, poverty alleviation, and improvements in farmers’ livelihoods, making a significant contribution to achieving the United Nations Sustainable Development Goal 1 (SDG1) of ending poverty.

5.4. Reasons for High Mean Relative Error in Dragon Fruit Estimation

From 2017 to 2018, the dragon fruit cultivation area across the autonomous region increased by nearly 100,000 mu. This significant expansion led to a substantial increase in production in 2018, reaching 237,700 tons, a growth of 126.7% compared to the previous year [57]. Therefore, the production estimate for 2018 derived from the linear regression model was considerably lower than the actual dragon fruit production.
Driven by policy support and advancements in production technology, subsequent years were expected to maintain high growth rates following the trend observed in 2018. However, the outcomes did not meet expectations. On one hand, the Central State Council’s land control policies in 2019 restricted the rapid expansion of orchard areas, impacting production. On the other hand, the COVID-19 pandemic restricted border movements with Vietnam in 2019, affecting localized spatial distribution, but domestic dragon fruit production in China continued to show sustained growth thereafter. These combined factors resulted in a slowed growth rate in dragon fruit production despite overall increases.
During the period from 2020 to 2022, minimal changes in dragon fruit cultivation areas across the autonomous region led to a declining growth rate compared to 2018. Additionally, the fitting trend of the regression model was significantly influenced by the overall characteristics of the dataset, particularly dominated by data from 2017, 2020, 2021, and 2022, thereby explaining the substantial relative error between estimated and statistical yields in 2019.

5.5. Limitations

While the optimal threshold was used to extract the dragon fruit cultivation area, some light spillover may still occur. Therefore, future studies could integrate multiple data sources, such as combining the delineated cultivation area with multispectral or hyperspectral remote sensing data (e.g., Landsat imagery). Supervised classification methods in machine learning could further improve the precision of dragon fruit cultivation area extraction. In terms of production estimation, additional fitting methods could be explored and optimized to improve model accuracy. This would not only enhance the accuracy of short-term estimations but also provide a solid model foundation for estimating dragon fruit productions over longer time series, supporting more comprehensive production decisions and industrial development planning. In the future, with the expanding application of nighttime light remote sensing technology, the spatiotemporal analysis of dragon fruit cultivation will provide more accurate data support for global agricultural planning.

6. Conclusions

This study proposed the VIANDI method based on multi-source remote sensing data, incorporating spatial analysis techniques to evaluate the spatiotemporal dynamics of dragon fruit cultivation and production in Guangxi from 2017 to 2022. This study also examines the spatiotemporal dynamics of Guangxi’s dragon fruit industry, the challenges posed by light pollution, and the interplay between these factors and evolving policy frameworks. The main conclusions are as follows:
(1) The VIANDI method, based on NTL, NDVI, and IA data, was proposed to detect dragon fruit fields and estimate production. Accuracy assessment results showed an Overall Accuracy of 86.70% for area extraction and a Mean Relative Error (MRE) of approximately 8.9% for production estimation. These results demonstrate that the method is effective for dragon fruit agricultural assessments.
(2) From 2017 to 2022, the dragon fruit cultivation area grew from 151.4 to 232.9 km2, while production increased from 189.6 to 693.4 kt. Cultivation and production were primarily concentrated in the northwest, southwest, central–south, and southeast of Guangxi, with the central–south (Nanning) serving as the core area. Long’an County in Nanning, with its large-scale cultivation, emerged as a key high-production region.
(3) Dragon fruit production exhibited a “northwest–southeast” distribution, with its centroid located in Nanning. From 2017 to 2022, the maximum average unit area dragon fruit production at the pixel scale increased from 8.5 kt/km2 to 9.4 kt/km2, with 61.9% of the regions experiencing an increase in production. The cultivation area remained generally stable, influenced by land control policy, as reflected by the fluctuating Global Moran’s I. Production distribution exhibited stronger spatial clustering, with the 2019 COVID-19 pandemic serving as a key turning point, followed by an increase in clustering. Local autocorrelation analysis revealed a contraction trend in cultivation area clustering and an expansion trend in production clustering.
(4) The continuous increase in total nighttime light intensity within dragon fruit cultivation areas has significantly driven production growth, leading to an effective optimization of land use efficiency. However, the potential environmental hazards associated with light pollution cannot be overlooked. Therefore, it is imperative for agricultural management to develop scientifically sound and effective strategies that not only sustain agricultural production and economic benefits but also prioritize ecological conservation, ultimately achieving a balanced goal of sustainable agricultural development.
Our research findings will contribute to understanding the monitoring and spatiotemporal changes in dragon fruit agriculture, providing a scientific basis for optimizing dragon fruit cultivation patterns, enhancing national macro-control of regional dynamics, and promoting agricultural sustainability. In the future, integrating Black Marble nighttime remote sensing data with optical remote sensing data and applying machine learning can advance research on long-term monitoring of dragon fruit agriculture.

Author Contributions

Conceptualization, T.Z., X.L. and L.Z; Methodology, T.Z. and L.Z.; Visualization, T.Z.; Writing—Original Draft, T.Z.; Supervision, X.L.; Funding acquisition, X.L. and L.Z. All authors have read and agreed to the published version of the manuscript.

Funding

This work was funded by the National Natural Science Foundation of China (No. 42171437), the Natural Science Foundation of Xiamen, China (No. 3502Z202472026), and the National Natural Science Foundation of China (No. 42401422).

Institutional Review Board Statement

Not applicable.

Data Availability Statement

Data are contained within the article.

Conflicts of Interest

The authors declare no conflicts of interest.

Abbreviations

The frequently used abbreviations in this article are explained as follows.
NTLNighttime Light
NPP-VIIRSNational Polar-orbiting Partnership-Visible Infrared Imaging Radiometer Suite
NDVINormalized Difference Vegetation Index
IAImpervious Area
VIANDIVegetation and Impervious area Adjusted Nighttime light Dragon fruit Index
TNLTotal Nighttime Light
ANLIAverage Nighttime Lighting Index
PAProducer’s Accuracy
UAUser’s Accuracy
OAOverall Accuracy
KCKappa Coefficient
RERelative Error
MREMean Relative Error
LISALocal Indicators of Spatial Association

References

  1. Le Bellec, F.; Vaillant, F.; Imbert, E. Pitahaya (Hylocereus spp.): A new fruit crop, a market with a future. Fruits 2006, 61, 237–250. [Google Scholar] [CrossRef]
  2. Abirami, K.; Swain, S.; Baskaran, V.; Venkatesan, K.; Sakthivel, K.; Bommayasamy, N. Distinguishing three Dragon fruit (Hylocereus spp.) species grown in Andaman and Nicobar Islands of India using morphological, biochemical and molecular traits. Sci. Rep. 2021, 11, 2894. [Google Scholar] [CrossRef]
  3. Jiang, Y.-L.; Liao, Y.-Y.; Lin, T.-S.; Lee, C.-L.; Yen, C.-R.; Yang, W.-J. The photoperiod-regulated bud formation of red pitaya (Hylocereus sp.). Hortscience 2012, 47, 1063–1067. [Google Scholar] [CrossRef]
  4. Jiang, Y.-L.; Liao, Y.-Y.; Lin, M.-T.; Yang, W.-J. Bud development in response to night-breaking treatment in the noninductive period in red pitaya (Hylocereus sp.). HortScience 2016, 51, 690–696. [Google Scholar] [CrossRef]
  5. Carmen, F.; Frances, C.; Barthe, L. Trends on valorization of pitaya fruit biomass through value-added and green extraction technology–A critical review of advancements and processes. Trends Food Sci. Technol. 2023, 138, 339–354. [Google Scholar] [CrossRef]
  6. Zhao, Y. China’s dragon fruit production ranks first in the world. China Fruit Ind. Inf. 2023, 40, 52. [Google Scholar]
  7. The 2023 Edition of the Dragon Fruit Industry Planning Special Research. Available online: https://www.chinairn.com (accessed on 18 March 2024).
  8. Several Opinions of the Central Committee of the Communist Party of China and the State Council on Establishing a Territorial Spatial Planning System and Supervising Its Implementation. Available online: https://www.gov.cn/zhengce/2019-05/23/content_5394187.htm (accessed on 25 September 2024).
  9. Levin, N.; Duke, Y. High spatial resolution night-time light images for demographic and socio-economic studies. Remote Sens. Environ. 2012, 119, 1–10. [Google Scholar] [CrossRef]
  10. Zheng, Q.; Seto, K.C.; Zhou, Y.; You, S.; Weng, Q. Nighttime light remote sensing for urban applications: Progress, challenges, and prospects. ISPRS J. Photogramm. Remote Sens. 2023, 202, 125–141. [Google Scholar] [CrossRef]
  11. Xu, N.; Xu, Y.; Yan, Y.; Guo, Z.; Wang, B.; Zhou, X. Evaluating road lighting quality using high-resolution JL1-3B nighttime light remote sensing data: A case study in nanjing, China. Remote Sens. 2022, 14, 4497. [Google Scholar] [CrossRef]
  12. Li, J.; Cai, Y.; Zhang, P.; Zhang, Q.; Jing, Z.; Wu, Q.; Qiu, Y.; Ma, S.; Chen, Z. Satellite observation of a newly developed light-fishing “hotspot” in the open South China Sea. Remote Sens. Environ. 2021, 256, 112312. [Google Scholar] [CrossRef]
  13. Polivka, T.N.; Wang, J.; Ellison, L.T.; Hyer, E.J.; Ichoku, C.M. Improving nocturnal fire detection with the VIIRS day–night band. IEEE Trans. Geosci. Remote Sens. 2016, 54, 5503–5519. [Google Scholar] [CrossRef]
  14. Hu, T.; Wang, T.; Yan, Q.; Chen, T.; Jin, S.; Hu, J. Modeling the spatiotemporal dynamics of global electric power consumption (1992–2019) by utilizing consistent nighttime light data from DMSP-OLS and NPP-VIIRS. Appl. Energy 2022, 322, 119473. [Google Scholar] [CrossRef]
  15. Zheng, Y.; Tang, L.; Wang, H. An improved approach for monitoring urban built-up areas by combining NPP-VIIRS nighttime light, NDVI, NDWI, and NDBI. J. Clean. Prod. 2021, 328, 129488. [Google Scholar] [CrossRef]
  16. Li, X.; Song, Y.; Liu, H.; Hou, X. Extraction of urban built-up areas using nighttime light (NTL) and multi-source data: A case study in Dalian City, China. Land 2023, 12, 495. [Google Scholar] [CrossRef]
  17. Wang, L.; Ye, C.; Chen, F.; Wang, N.; Li, C.; Zhang, H.; Wang, Y.; Yu, B. CG-CFPANet: A multi-task network for built-up area extraction from SDGSAT-1 and Sentinel-2 remote sensing images. Int. J. Digit. Earth 2024, 17, 2310092. [Google Scholar] [CrossRef]
  18. Chen, Z.; Wei, Y.; Shi, K.; Zhao, Z.; Wang, C.; Wu, B.; Qiu, B.; Yu, B. The potential of nighttime light remote sensing data to evaluate the development of digital economy: A case study of China at the city level. Comput. Environ. Urban Syst. 2022, 92, 101749. [Google Scholar] [CrossRef]
  19. Li, P.; Zhang, H.; Wang, X.; Song, X.; Shibasaki, R. A spatial finer electric load estimation method based on night-light satellite image. Energy 2020, 209, 118475. [Google Scholar] [CrossRef]
  20. Stathakis, D.; Baltas, P. Seasonal population estimates based on night-time lights. Comput. Environ. Urban Syst. 2018, 68, 133–141. [Google Scholar] [CrossRef]
  21. Zhong, L.; Liu, X.; Yang, P.; Zhong, X.; Zeng, X.; Zou, C.; Xu, X. Quantifying the spatiotemporal evolution of the in-use steel stock in countries along the Belt and Road. Resour. Conserv. Recycl. 2022, 181, 106226. [Google Scholar] [CrossRef]
  22. Li, D.; Xu, F.; Chen, Z.; Xie, X.; Fan, K.; Zeng, Z. Fine simulation of PM2. 5 combined with NPP-VIIRS night light remote sensing and mobile monitoring data. Sci. Total Environ. 2024, 914, 169955. [Google Scholar] [CrossRef]
  23. Fang, G.; Gao, Z.; Tian, L.; Fu, M. What drives urban carbon emission efficiency?–Spatial analysis based on nighttime light data. Appl. Energy 2022, 312, 118772. [Google Scholar] [CrossRef]
  24. Jia, M.; Li, X.; Gong, Y.; Belabbes, S.; Dell’Oro, L. Estimating natural disaster loss using improved daily night-time light data. Int. J. Appl. Earth Obs. Geoinf. 2023, 120, 103359. [Google Scholar] [CrossRef]
  25. Mu, H.; Li, X.; Du, X.; Huang, J.; Su, W.; Hu, T.; Wen, Y.; Yin, P.; Han, Y.; Xue, F. Evaluation of light pollution in global protected areas from 1992 to 2018. Remote Sens. 2021, 13, 1849. [Google Scholar] [CrossRef]
  26. Eun, J.; Skakun, S. Characterizing land use with night-time imagery: The war in Eastern Ukraine (2012–2016). Environ. Res. Lett. 2022, 17, 095006. [Google Scholar] [CrossRef]
  27. Mirza, M.U.; Xu, C.; Bavel, B.v.; Van Nes, E.H.; Scheffer, M. Global inequality remotely sensed. Proc. Natl. Acad. Sci. USA 2021, 118, e1919913118. [Google Scholar] [CrossRef] [PubMed]
  28. Xu, G.; Xiu, T.; Li, X.; Liang, X.; Jiao, L. Lockdown induced night-time light dynamics during the COVID-19 epidemic in global megacities. Int. J. Appl. Earth Obs. Geoinf. 2021, 102, 102421. [Google Scholar] [CrossRef]
  29. Huang, R.; Wu, W.; Yu, K. Building consistent time series night-time light data from average DMSP/OLS images for indicating human activities in a large-scale oceanic area. Int. J. Appl. Earth Obs. Geoinf. 2022, 114, 103023. [Google Scholar] [CrossRef]
  30. Wang, R.; Shi, W.; Dong, P. Mapping dragon fruit croplands from space using remote sensing of artificial light at night. Remote Sens. 2020, 12, 4139. [Google Scholar] [CrossRef]
  31. Krauser, L.E.; Stevens, F.R.; Gaughan, A.E.; Nghiem, S.V.; Thy, P.T.M.; Duy, P.T.N.; Chon, L.T. Shedding light on agricultural transitions, dragon fruit cultivation, and electrification in southern vietnam using mixed methods. Ann. Am. Assoc. Geogr. 2022, 112, 1139–1158. [Google Scholar] [CrossRef]
  32. Jia, S.; Nghiem, S.V.; Kim, S.-H.; Krauser, L.; Gaughan, A.E.; Stevens, F.R.; Kafatos, M.C.; Ngo, K.D. Extreme development of dragon fruit agriculture with nighttime lighting in Southern Vietnam. In Remote Sensing of Agriculture and Land Cover/Land Use Changes in South and Southeast Asian Countries; Springer: Berlin/Heidelberg, Germany, 2022; pp. 553–571. [Google Scholar]
  33. Wen, Z.; Liu, G. Nighttime light data capture spatiotemporal dynamics of dragon fruit cultivation from 2014 to 2022 in China and Vietnam. Comput. Electron. Agric. 2024, 225, 109270. [Google Scholar] [CrossRef]
  34. Guangxi’s Fruit Output Has Ranked First in the Country for Five Consecutive Years. Available online: http://nynct.gxzf.gov.cn/xwdt/ywkb/t17369856.shtml (accessed on 21 August 2024).
  35. Román, M.O.; Wang, Z.; Sun, Q.; Kalb, V.; Miller, S.D.; Molthan, A.; Schultz, L.; Bell, J.; Stokes, E.C.; Pandey, B. NASA’s Black Marble nighttime lights product suite. Remote Sens. Environ. 2018, 210, 113–143. [Google Scholar] [CrossRef]
  36. Carlson, T.N.; Ripley, D.A. On the relation between NDVI, fractional vegetation cover, and leaf area index. Remote Sens. Environ. 1997, 62, 241–252. [Google Scholar] [CrossRef]
  37. Xie, Y.; Weng, Q. Updating urban extents with nighttime light imagery by using an object-based thresholding method. Remote Sens. Environ. 2016, 187, 1–13. [Google Scholar] [CrossRef]
  38. Yan, Y.; Lei, H.; Chen, Y.; Zhou, B. Analyzing the Dynamic Spatiotemporal Changes in Urban Extension across Zhejiang Province Using NPP-VIIRS Nighttime Light Data. Remote Sens. 2022, 14, 3212. [Google Scholar] [CrossRef]
  39. Xu, H.; Hu, S.; Li, X. Urban distribution and evolution of the Yangtze River Economic Belt from the perspectives of urban area and night-time light. Land 2023, 12, 321. [Google Scholar] [CrossRef]
  40. Wang, Y.; Jiao, M.; Li, T.; Li, R.; Liu, B. Role of mangrove forest in interception of microplastics (MPs): Challenges, progress, and prospects. J. Hazard. Mater. 2023, 445, 130636. [Google Scholar] [CrossRef]
  41. Letu, H.; Hara, M.; Yagi, H.; Naoki, K.; Tana, G.; Nishio, F.; Shuhei, O. Estimating energy consumption from night-time DMPS/OLS imagery after correcting for saturation effects. Int. J. Remote Sens. 2010, 31, 4443–4458. [Google Scholar] [CrossRef]
  42. Lefever, D.W. Measuring geographic concentration by means of the standard deviational ellipse. Am. J. Sociol. 1926, 32, 88–94. [Google Scholar] [CrossRef]
  43. Lu, L.; Weng, Q.; Xie, Y.; Guo, H.; Li, Q. An assessment of global electric power consumption using the Defense Meteorological Satellite Program-Operational Linescan System nighttime light imagery. Energy 2019, 189, 116351. [Google Scholar] [CrossRef]
  44. Anselin, L. Local indicators of spatial association—LISA. Geogr. Anal. 1995, 27, 93–115. [Google Scholar] [CrossRef]
  45. Li, X.; Zhao, L.; Li, D.; Xu, H. Mapping urban extent using Luojia 1-01 nighttime light imagery. Sensors 2018, 18, 3665. [Google Scholar] [CrossRef] [PubMed]
  46. Lo, C. Modeling the population of China using DMSP operational linescan system nighttime data. Photogramm. Eng. Remote Sens. 2001, 67, 1037–1047. [Google Scholar]
  47. Moriasi, D.N.; Arnold, J.G.; Van Liew, M.W.; Bingner, R.L.; Harmel, R.D.; Veith, T.L. Model evaluation guidelines for systematic quantification of accuracy in watershed simulations. Trans. ASABE 2007, 50, 885–900. [Google Scholar] [CrossRef]
  48. Raes, D.; Steduto, P.; Hsiao, T.; Fereres, E. AquaCrop Reference Manual (Version 4.0); FAO—Land and Water Division: Rome, Italy, 2012. [Google Scholar]
  49. Notice on Printing and Distributing the Action Plan for the Revitalization of Agricultural Industry in Qinzhou City. Available online: http://nynct.gxzf.gov.cn/xwdt/gxlb/qz/t11798890.shtml (accessed on 21 August 2024).
  50. Focus on Building Chains, Supplementing Chains, Extending Chains, and Strengthening Chains, and Create Advantageous and Characteristic Industrial Clusters. Available online: https://www.nanning.gov.cn/zt/rdzt/ggtztpgjcgqmtjxczx/gzcg_45582/t5261354.html (accessed on 11 September 2023).
  51. Notice of the General Office of the People’s Government of Guangxi Zhuang Autonomous Region on Printing and Distributing the Implementation Plan for Promoting the High-Quality Development of the Fruit Industry in Guangxi. Available online: http://www.gxzf.gov.cn/html/zfwj/zxwj/t12644769.shtml (accessed on 15 September 2023).
  52. Münzel, T.; Hahad, O.; Daiber, A. The dark side of nocturnal light pollution. Outdoor light at night increases risk of coronary heart disease. Eur. Heart J. 2021, 42, 831–834. [Google Scholar] [CrossRef]
  53. Grubisic, M.; van Grunsven, R.H.; Kyba, C.C.; Manfrin, A.; Hölker, F. Insect declines and agroecosystems: Does light pollution matter? Ann. Appl. Biol. 2018, 173, 180–189. [Google Scholar] [CrossRef]
  54. Gaston, K.J.; Davies, T.W.; Bennie, J.; Hopkins, J. Reducing the ecological consequences of night-time light pollution: Options and developments. J. Appl. Ecol. 2012, 49, 1256–1266. [Google Scholar] [CrossRef]
  55. The Outline of the 14th Five-Year Plan (2021–2025) for National Economic and Social Development and the Long-Range Objectives Through the Year 2035. Available online: https://www.gov.cn/xinwen/2021-03/13/content_5592681.htm (accessed on 25 September 2024).
  56. Coronavirus Delays Việt Nam’s Agricultural Exports to China. Available online: https://vietnamnews.vn/economy/591791/coronavirus-delays-viet-nams-agricultural-exports-to-china.html (accessed on 4 November 2024).
  57. Statistical Communiqué on the National Economic and Social Development of Guangxi Zhuang Autonomous Region in 2018. Available online: http://tjj.gxzf.gov.cn/tjsj/tjgb/qqgb/t2381649.shtml (accessed on 13 September 2023).
Figure 1. Geographic location of the study area. (a) DEM map of Guangxi Zhuang Autonomous Region; (bd) show the nighttime lighting of dragon fruit cultivation areas in Nanning at distant, medium, and close perspectives, respectively; the inset in (d) is an image of harvested dragon fruit.
Agriculture 15 01014 g001
Figure 2. NTL remote sensing imagery of Guangxi Zhuang Autonomous Region in December 2022. (a) NPP-VIIRS data; (b) Black Marble data; both panels show high-resolution images of the same location.
Agriculture 15 01014 g002
Figure 3. Flowchart of the research methodology.
Agriculture 15 01014 g003
Figure 4. Spatial distribution of dragon fruit cultivation area extraction results (1 indicates dragon fruit cultivation area, 0 indicates non-cultivation area). (a) Extracted dragon fruit cultivation area in Guangxi Zhuang Autonomous Region from 2017 to 2022; (b) Extracted dragon fruit cultivation area in Nanning from 2017 to 2022.
Agriculture 15 01014 g004
Figure 5. Linear regression model between TNL and production.
Agriculture 15 01014 g005
Figure 6. Estimated production spatial distribution map of dragon fruit cultivation areas. (a) Estimated dragon fruit production spatial distribution in Guangxi Zhuang Autonomous Region from 2017 to 2022; (b) Estimated dragon fruit production spatial distribution in Nanning from 2017 to 2022.
Agriculture 15 01014 g006
Figure 7. The trend of dragon fruit production and cultivation area. (a) Average dragon fruit production per unit area from 2017 to 2022. Select a1–a3 as three representative regions with significant changes; (b) Annual average change in dragon fruit production per unit area from 2017 to 2022. Select b1–b3 as the corresponding positions to the areas in a1–a3; (c) Changes in dragon fruit cultivation area and production across 14 cities. In the dual y-axis curve chart, dark cyan represents production, and brown represents area. The middle chart shows the distribution of dragon fruit cultivation area and production in Guangxi Zhuang Autonomous Region over 6 years.
Agriculture 15 01014 g007
Figure 8. Standard deviation ellipses of production distribution and centroid migration trajectory.
Agriculture 15 01014 g008
Figure 9. Global Moran’s I line chart.
Agriculture 15 01014 g009
Figure 10. Spatiotemporal distribution characteristics of dragon fruit cultivation area and LISA maps. (a,c) show the spatiotemporal distribution characteristics of dragon fruit cultivation area in Guangxi from 2017 to 2022; (b,d) show the LISA maps for dragon fruit cultivation area in Guangxi from 2017 to 2022.
Agriculture 15 01014 g010
Figure 11. Spatiotemporal distribution characteristics of dragon fruit production and LISA maps. (a,c) show the spatiotemporal distribution characteristics of dragon fruit production in Guangxi from 2017 to 2022; (b,d) show the LISA maps for dragon fruit production in Guangxi from 2017 to 2022.
Agriculture 15 01014 g011
Figure 12. Accuracy verification of dragon fruit cultivation area extraction. (a) Relative Error; (b) Local spatial pattern verification of dragon fruit fields.
Agriculture 15 01014 g012
Figure 13. Regression models for the relationship between TNL and dragon fruit production in Guangxi.
Agriculture 15 01014 g013
Figure 14. Visualization of nighttime lighting in the dragon fruit cultivation areas of Guangxi. (a) Total nighttime light intensity in the dragon fruit cultivation areas of various cities in Guangxi from 2017 to 2022; (b) Nighttime light imagery and an eagle-eye view of the three cities with the highest total nighttime light intensity from 2017 to 2022, from left to right: Nanning, Baise, and Chongzuo; (c) Average unit area nighttime light intensity in the dragon fruit cultivation areas of various cities in Guangxi from 2017 to 2022. The redder the color in the figure, the higher the nighttime light intensity.
Agriculture 15 01014 g014
Table 1. Research datasets.
NameTimeSource
Black Marble NTL data2017–2022LAADS DAAC (https://ladsweb.modaps.eosdis.nasa.gov/missions-and-measurements/products/VNP46A3) (accessed on 8 July 2023)
NDVI data2017–2022National Ecosystem Science Data Center (https://www.nesdc.org.cn/sdo/detail?id=60f68d757e28174f0e7d8d49) (accessed on 13 February 2024)
IA data2017–2021X-MOL (https://www.x-mol.com/groups/li_xuecao/dongtaizhitu) (accessed on 17 November 2023)
IA data2022Zenodo (https://zenodo.org/record/8176941) (accessed on 28 November 2023)
Statistical data2017–2022Department of Agriculture and Rural Affairs of Guangxi Zhuang Autonomous Region (http://nynct.gxzf.gov.cn) (accessed on 26 July 2023)
Administrative boundary2022National Geometics Center of China (http://www.ngcc.cn) (accessed on 14 July 2023)
Table 2. Parameters of the standard deviation ellipse.
YearCentroid X (°E)Centroid Y (°N)Major Axis (km)Minor Axis (km)θ (°) Area (km2)
2017108.20123.015189.18194.622110.36956,231.526
2018108.31123.115186.570111.863112.69065,561.394
2019108.21323.016183.36594.845107.82954,631.169
2020108.25223.057180.81199.035105.65356,250.737
2021108.28223.063164.01996.042104.70549,484.817
2022108.27323.032158.62695.146106.07647,411.439
Table 3. Confusion matrix for classification.
Classified DataValidation Data (Pixels)/PointsUA/%
Dragon FruitNon-Dragon FruitTotal
Dragon Fruit3041632095.00
Non-Dragon Fruit11756368082.79
Total4215791000-
PA/%72.2197.27--
Table 4. Production estimation accuracy for dragon fruit cultivation in Guangxi (2017–2022).
YearLinear Fitting RE (%)Exponential Fitting RE (%)Polynomial Fitting RE (%)
20171.317.9816.07
2018−17.12−12.01−5.48
2019−28.11−25.54−20.80
2020−2.82−5.40−7.34
2021−3.02−8.36−17.79
20221.00−6.51−23.58
MRE8.9010.9715.18
Disclaimer/Publisher’s Note: The statements, opinions and data contained in all publications are solely those of the individual author(s) and contributor(s) and not of MDPI and/or the editor(s). MDPI and/or the editor(s) disclaim responsibility for any injury to people or property resulting from any ideas, methods, instructions or products referred to in the content.

