Article

Synergistic Purification of Flue Gas from Straw Combustion Using Ammonia Method and Electrostatic Charged Spray

1
School of the Environment and Safety Engineering, Jiangsu University, Zhenjiang 212013, China
2
Key Laboratory for Theory and Technology of Intelligent Agricultural Machinery and Equipment, Jiangsu University, Zhenjiang 212013, China
3
Jiangsu Province and Education Ministry Cosponsored Synergistic Innovation Center of Modern Agricultural Equipment, Jiangsu University, Zhenjiang 212013, China
4
School of Agricultural Engineering, Jiangsu University, Zhenjiang 212013, China
*
Author to whom correspondence should be addressed.
Agriculture 2025, 15(9), 1001; https://doi.org/10.3390/agriculture15091001
Submission received: 28 February 2025 / Revised: 24 April 2025 / Accepted: 4 May 2025 / Published: 6 May 2025

Abstract

:
To enhance the efficiency of flue gas purification from straw combustion, a combined approach using the ammonia method and electrostatic charged spray was investigated. This study investigated the charging characteristics of atomized droplets and their impact on flue gas purification. The results show that the charge-to-mass ratio of droplets increases and then decreases as charging voltages increase. At a constant voltage, the ratio increases with higher ammonia concentrations and shows a gradual increase with higher spray pressures. For flue gases from three common straw combustion sources, the average dust removal rate at 8 kV was 2.5 to 3 times higher than at 0 kV. Under the 8 kV condition with a 10% ammonia solution, the NO removal rate was approximately 4.7 times, and the NO2 removal rate was 2.8 times compared to water alone. Particulate matter, NO, and NO2 removal rates were 61.2%, 88.6%, and 88.1%, respectively, at a spray pressure of 0.5 MPa, 8 kV charging voltage, and 10% ammonia concentration. This study provides an experimental foundation for developing high-efficiency flue gas purification systems for straw combustion.

1. Introduction

China has abundant straw resources, which generate approximately 865 million tons annually [1,2]. Historically, straw has played a crucial role in rural economies, serving as fertilizer, fuel, animal feed, and building material [3]. However, as rural living standards improve and the industrial structure shifts, traditional uses of straw have become increasingly inadequate. This has led to significant regional, seasonal, and structural surpluses of straw [4]. The high costs associated with straw utilization industries and limited acceptance among farmers have further exacerbated the issue, leading to widespread open-air straw burning in some rural areas. This practice releases substantial amounts of harmful pollutants, including nitrogen oxides (NOx) and dust, which pose serious risks to human health and contribute to haze and air pollution [5,6,7]. Under the premise of effectively controlling pollution from straw-burning emissions, on-site straw incineration serves as a convenient method for straw disposal and utilization. On one hand, it provides a faster and more efficient way to clear post-harvest straw, saving valuable farming time and facilitating timely sowing for the next crop cycle [8]. On the other hand, the resulting straw ash can contribute to crop production. This byproduct, commonly known as plant ash, primarily consists of mineral elements such as potassium, calcium, phosphorus, and magnesium, making it a natural inorganic fertilizer [9]. When returned to the fields, plant ash acts as a fast-acting fertilizer that enhances soil fertility and supplies essential nutrients for crop growth. Given the current ecological and environmental priorities, developing technologies to remove pollutants from straw combustion flue gas and achieve environmentally safe emissions is essential for sustainable straw utilization.
Globally, particulate matter treatment technologies are classified into four categories based on their mechanisms: mechanical dust removal, filtration dust removal, wet dust removal, and electrostatic dust removal [10]. While conventional single dust removal technologies are highly effective in removing coarse particles, achieving dust removal rates exceeding 90% and sometimes as high as 99.9%, they are significantly less effective for fine particles [11]. To overcome this limitation, researchers worldwide have been exploring various combined processes to enhance particle removal efficiency. Among these, electrostatic spray technology has shown great promise in improving the removal of fine particles [12,13]. Electrostatic spray dust removal combines the principles of wet and electrostatic dust removal. By charging droplets, this process intensifies the electrostatic attraction between droplets and particles, facilitating the adsorption and settling of fine particles upon collision with charged droplets. For instance, Teng et al. [14] found that the removal efficiency of an electrostatic spray separation device increased by nearly 50% under charged conditions compared to uncharged conditions. Zhang et al. [15] developed a three-stage composite wet scrubber that purifies flue gas through a series of mechanisms, including falling film scrubbing with Raschig ring packing, spray sedimentation with water mist, grid interception with a reticular water film, and electrostatic adsorption via filaments. This advanced scrubber achieves a particle removal efficiency of over 99.5%, showcasing the potential of combined approaches for high-efficiency particulate matter removal. Nitrogen oxide (NOx) treatment technologies are primarily classified into dry and wet denitrification methods [16]. Wet denitrification, which uses a liquid absorbent to remove NOx, is highly valued for its simplicity and cost-effectiveness, attracting significant interest from researchers worldwide. For example, Liu et al. [17] achieved a denitrification efficiency of 82.5% by combining ozonation with ammonia absorption through spray scattering technology for flue gas purification. Chin et al. [18] used a combination of wet scrubbers and charged atomizers to remove NO from the flue gas using solutions containing ozone, sodium sulfide, and sodium hydroxide, achieving an efficiency of 95%. Yamasaki et al. [19] developed a semi-dry desulfurization reactor using PCHP (Pulse Corona Hybrid Process) technology, achieving optimal removal rates of 45% for NO and 39% for overall NOx by injecting a sufficient ozone flow. Additionally, over 90% of the byproducts were effectively recovered in the form of Na2SO4. These studies highlight the versatility and efficiency of wet denitrification methods, showcasing their potential for high NOx removal rates and byproduct recovery in industrial applications.
Despite advancements in flue gas purification technologies, current research primarily targets industrial applications with limited focus on the agricultural sector. Furthermore, most studies focus on single pollutants, leaving a gap in integrated approaches that address both particulate matter and gaseous pollutants simultaneously. To bridge this gap, this study proposes a synergistic purification method that combines ammonia absorption with electrostatic spray to remove nitrogen oxides and particulate matter from the flue gas. Ammonia solution acts as an absorbent, contacting the flue gas through a charged atomization spray system to enhance removal efficiency. The primary chemical reactions involved in the nitrogen oxide (NOx) removal process from straw combustion flue gas are as follows [16,20]:
Primary reaction: 4NO + 4NH3 + O2 → 4N2 + 6H2O
Secondary reactions: 2NO2 + 4NH3 + O2 → 3N2 + 6H2O
          NO + NO2 + 2NH3 → 2N2 + 3H2O
NO oxidation reaction: 2NO + O2 → 2NO2
Absorption reactions: NO2 + H2O → HNO3 + HNO2
          HNO3 + NH3 → NH4NO3
          HNO2 + NH3 → NH4NO2
Meanwhile, the purified ash collected is nitrogen-rich and can be directly returned to fields, enhancing soil nitrogen content. This study proposes a flue gas purification method that combines charged spray dust suppression and ammonia-based denitrification, and it conducts experimental research on the impact of various process parameters on the flue gas purification effect.

2. Materials and Methods

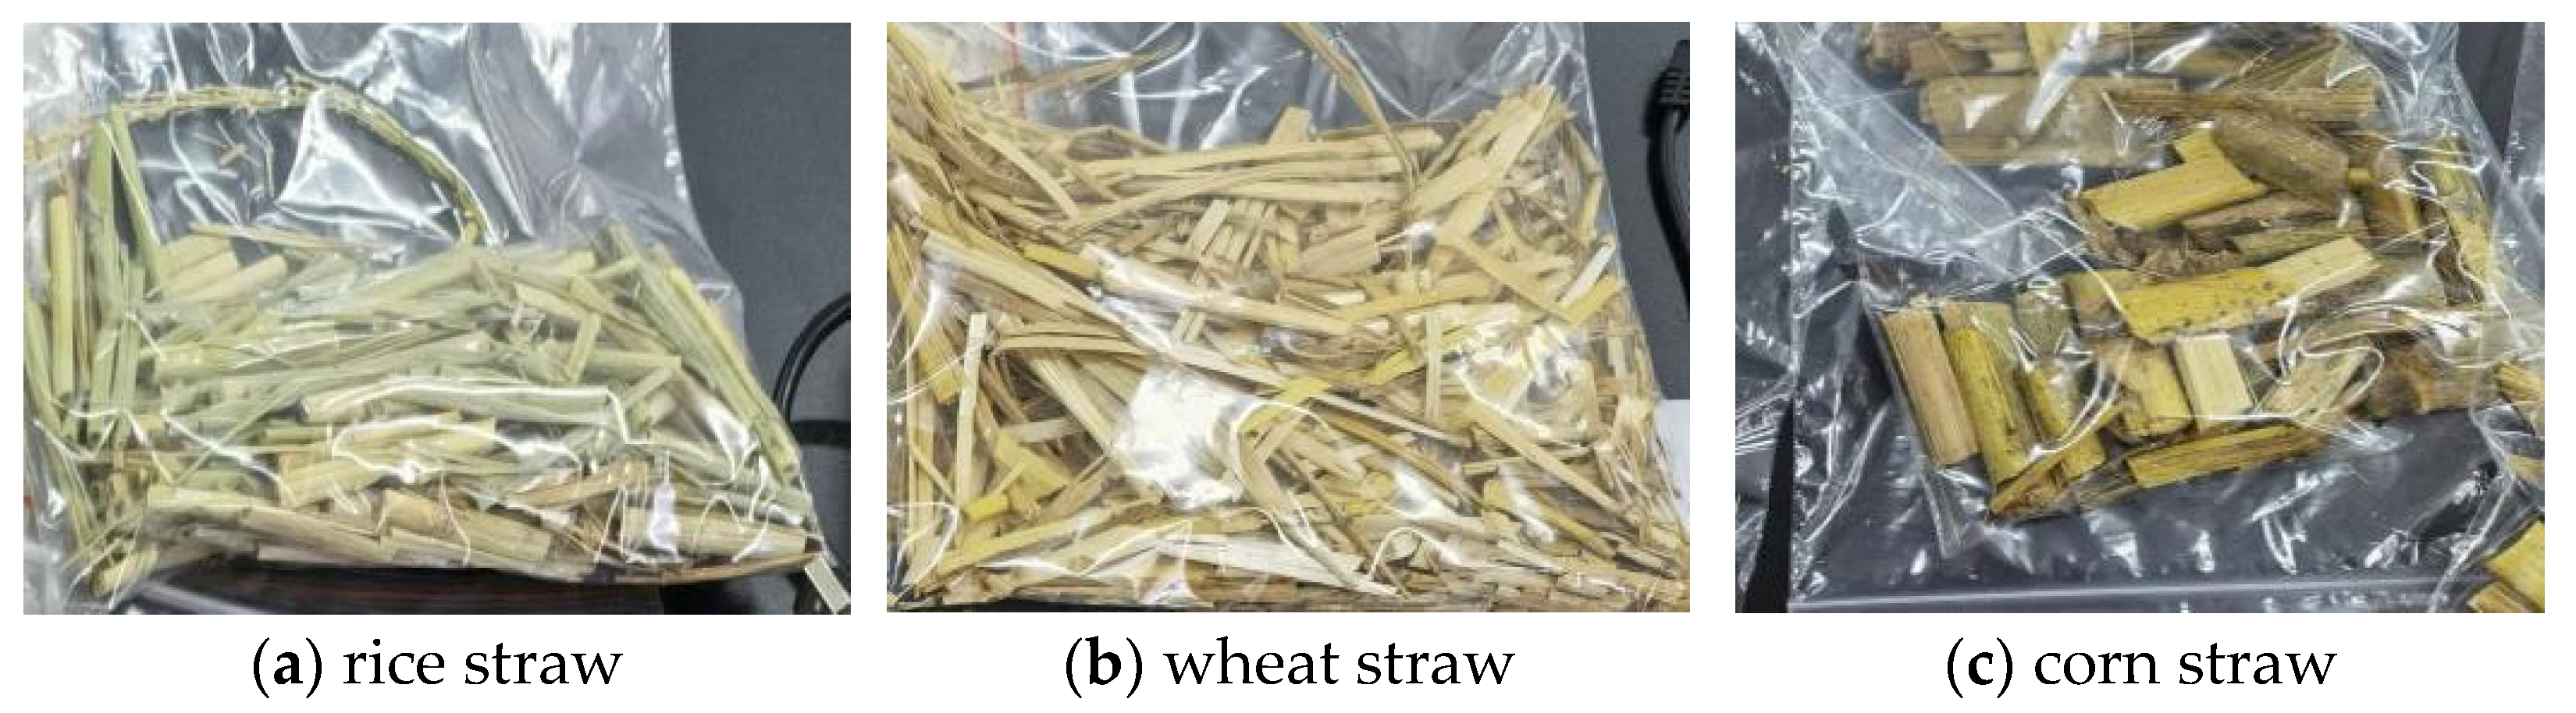
2.1. Experiment Materials

For the gas purification experiment, rice straw, wheat straw, and corn straw were used after being dried. The straws were processed into segments with a length of 20–40 mm, as shown in Figure 1. Each segment was weighed at 20 g and placed in a clean, sealed container for use in the experiment.
The inductive low-pressure electrostatic nozzle was manufactured by Beijing Kefeng Jiahua Technology Co., Ltd. (Beijing, China), with a nozzle diameter of 0.8 mm, an annular electrode, and a spray cone angle of 60–80 degrees, as shown in Figure 2.
Four types of solutions were selected as experimental materials for the charge –mass ratio study: water, 3% ammonia solution, 5% ammonia solution, and 10% ammonia solution, with densities of 1.000 g.m−3, 0.985 g.m−3, 0.977 g.m−3, and 0.957 g.m−3, respectively. Ammonia solutions were stored in sealed containers in a cool, dark place to maintain their stability.

2.2. Measurement Method of Charge–Mass Ratio

To assess the conductivity of solutions with varying concentrations, this study used an intelligent conductivity electrode (model RMD-ISEP10) manufactured by Remond in mainland China. Before conducting the charge–mass ratio experiment, the conductivity characteristics of the solutions were evaluated. The electrode was connected to a PC terminal for detection and was cleaned with pure water prior to use. At a room temperature of 25 °C, a specific volume of water was poured into a measuring cup, and the electrode was inserted. After the system stabilized, the conductivity value was read from the PC terminal. Following each test, the electrode was thoroughly cleaned with pure water. The same procedure was used to measure the conductivity of different ammonia concentrations, and the results are summarized in Table 1.
Figure 3 provides a schematic diagram of the charge–mass ratio measurement test setup. The experimental bench is primarily made up of an electrostatic nozzle, a Faraday cup, a movable spray frame, a GF-2A high voltage electrostatic generator produced by Wuxi Kangte Electronic Equipment Co., Ltd. (Wuxi, China), a A Keithley 6485 nanoammeter produced by Keithley Instruments,(Cleveland, OH, USA), and measuring cups. The charge–mass ratio measurement method for charged droplets is described as follows: When the atomized droplets sprayed by the nozzle pass through the electrode ring, they become charged through inductive charging. Upon reaching the Faraday cup, the charged droplets transfer their charge to the grounded metal mesh within the cup, forming a closed circuit with the ground and generating a microcurrent. Once the metal mesh stabilizes, the current value is detected by the picoammeter. Meanwhile, the volume of sprayed droplets is measured using a graduated cylinder at the outlet of the Faraday cup, and the total spray time is recorded [21]. The charge–mass ratio of the droplets is calculated using the following equation:
R = I · t ρ · V
where R is the charge-to-mass ratio (mC.kg−1), I is the electric current (µA), t is the spray time (s), ρ is the liquid density (g.m−3), and V is the total volume of spray droplets (cm3).

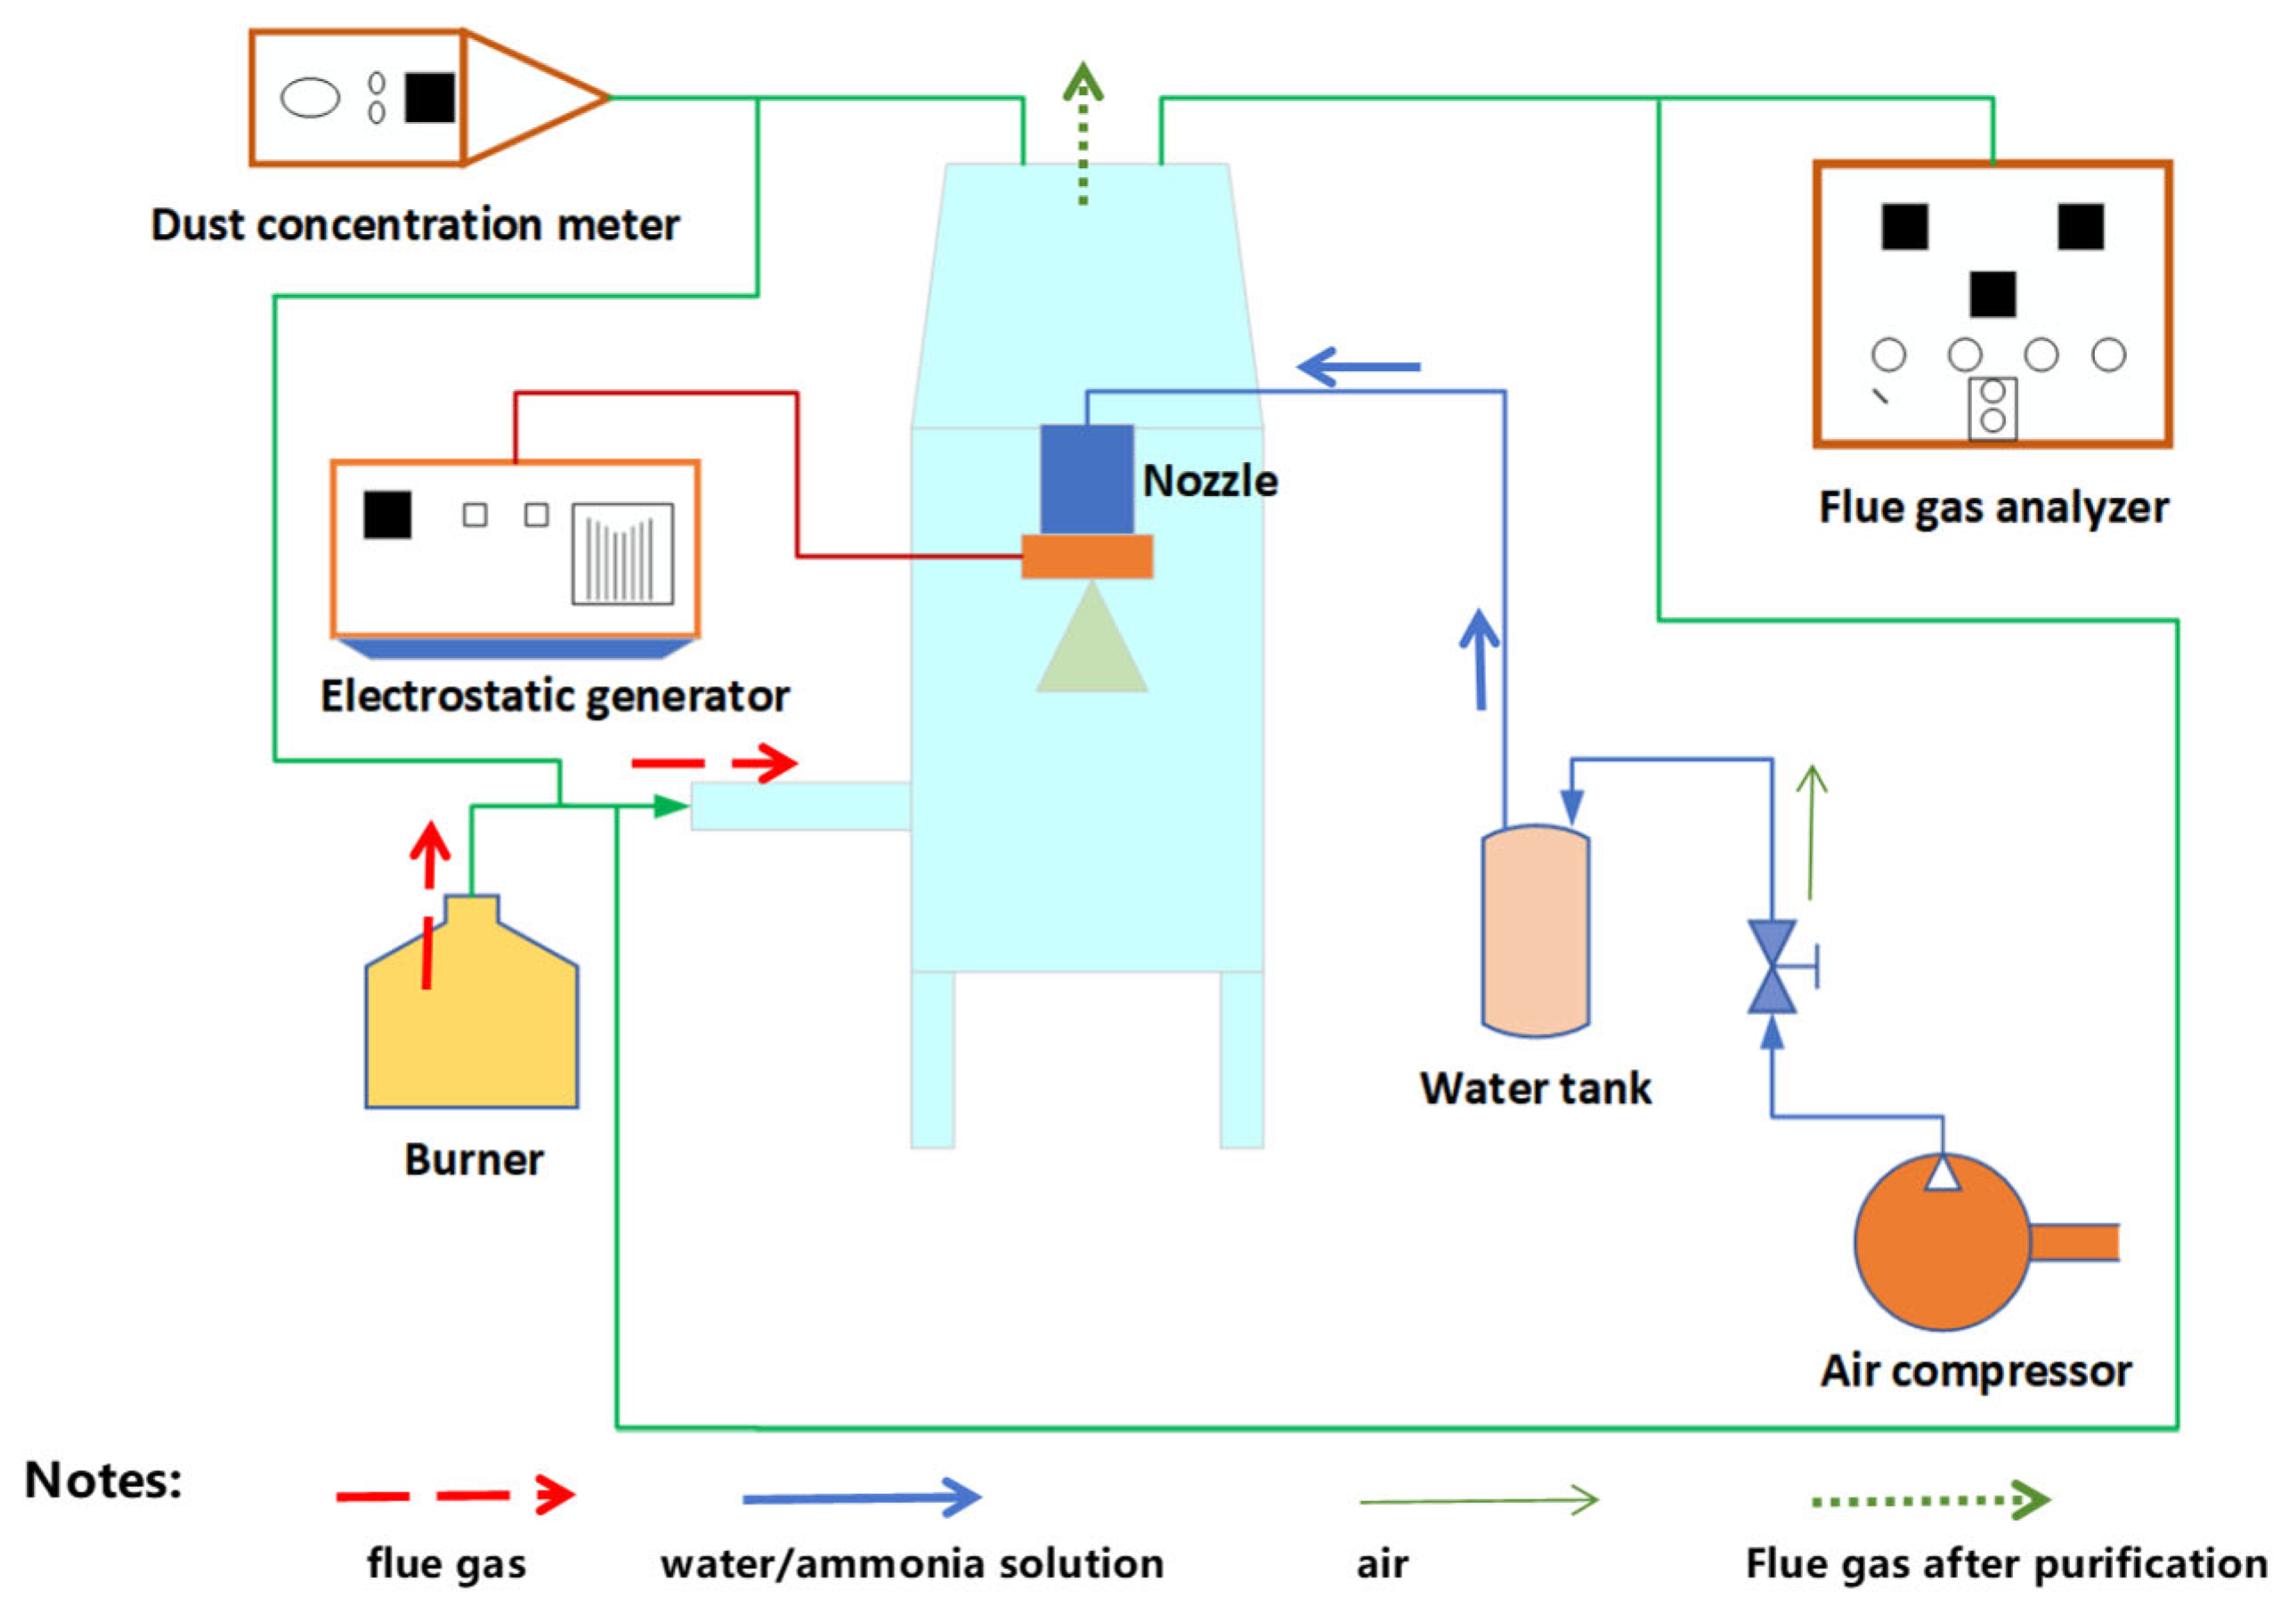
2.3. Measurement Method of Straw Flue Gas Purification

Figure 4 illustrates the schematic diagram of the straw combustion flue gas purification test platform. The test system is divided into four main components: the flue gas generation system, the liquid supply system, the flue gas purification system, and the detection system.
The flue gas generation system comprises a custom semi-gasified straw burner and a flue, both constructed from stainless steel to prevent contamination. The liquid supply system includes a water tank and an air compressor, with the air compressor having a power rating of 1.5 kW and a maximum pressure of 1 MPa. The water tank is filled with ammonia solution, which is transported to the nozzle via air pressure from the air compressor into the flue gas purification system.
The flue gas purification system consists of an electrostatic nozzle, an electrostatic generator, and a flue gas purification cylinder. The electrostatic nozzle is positioned at the top of the purification cylinder and powered by the electrostatic generator to produce a charged spray. The main part of the flue gas purification cylinder is 450 × 450 × 1000 mm, and it is made of transparent, corrosion-resistant acrylic glass.
The detection system includes a CENTER314 temperature and humidity meter produced by Taiwan Quint Company(Taiwan, China), a NOVA5003-S flue gas comprehensive analyze rproduced by NOVA(Halifax, Canada), and a CEL-712 dust concentration meter produced by CASELLA(Bedforf, UK). The temperature and humidity meter is used to measure the temperature and relative humidity of the flue gas. The flue gas comprehensive analyzer measures the concentrations of NO and NO2, while the dust concentration meter quantifies the concentration of dust.
The test methods for each index in the experiment are in line with the standard “Determination of Particulate Matter in Exhaust from Stationary Pollution Sources and Sampling Method for Gaseous Pollutants” (GB/T 16157-1996, China) [22]. Standard methods were used to measure the flue gas characteristics (temperature, humidity, dust concentration, and NOx concentration) at the incinerator’s exhaust outlet.
The operational workflow for the in-furnace straw combustion flue gas testing experiment is as follows: (1) Connect all instruments according to the schematic diagram in Figure 4 and then stand by for operation. (2) Calibrate and inspect each measuring instrument to ensure data accuracy and system compliance with research requirements. (3) Position the flue gas sampling point at the exhaust outlet of the combustion furnace. Given the small flue diameter (200 mm), the sampling location is selected as the central point of the outlet. (4) Power on the flue gas analyzer, particulate concentration monitor, and temperature/humidity sensor before warm-up. Fix the isokinetic sampling probes of the gas analyzer and particulate monitor at the predetermined sampling point. (5) Evenly distribute the prepared straw material in the furnace chamber. Activate the electronic ignition until stable flames appear and then deactivate the igniter to allow natural combustion. (6) Start recording instrument measurements after smoke generation, simultaneously documenting flue gas velocity and combustion duration. End data collection when smoke dissipates. Maintain the isokinetic sampling probes in ambient air for 3 additional minutes before shutting down the instruments. (7) Conduct combustion tests using six samples for each of the three straw types, repeating the entire process for every trial. In the flue gas purification experiment, the electrostatic ammonia solution spraying process was sustained for 5 min. (8) After testing, properly store all equipment and process/analyze the recorded experimental data.
The calculation formula for the emission factors of particulate matter, NO, and NO2 in flue gas is as follows:
E F i = M i M f
where E F i represents the emission factor of pollutant i in flue gas (g·kg−1), M i denotes the total emissions of pollutant i, and M f indicates the total mass of combusted straw.
The removal efficiency of NOx is calculated using the following equation:
η N = c N 1 c N 2 c N 1 × 100 %
where η N is the NOx removal efficiency (%), cN1 is the nitrogen oxide concentration in inlet (mg.m−3), and cN2 is the nitrogen oxide concentration at outlet (mg.m−3).
Similarly, the dust removal efficiency is calculated using the following equation:
η T = c T 1 c T 2 c T 1 × 100 %
where η T is the dust removal efficiency (%), cT1 is the dust concentration in inlet (mg/m3), and cT2 the dust concentration at outlet (mg.m−3).

3. Results and Discussion

3.1. Characteristics of Straw Combustion Flue Gas

The measured results of flue gas temperature and humidity from the experiment are shown in Table 2. It can be observed that the flue gas temperature from the combustion of the three types of straw ranges between 40 and 60 °C, with humidity ranging between 38 and 50%. Among them, rice straw combustion produces the lowest flue gas temperature at 40.3 °C, while wheat straw and corn straw combustion generate flue gas temperatures approximately 1.4–1.5 times higher at 59.3 °C and 56.9 °C, respectively. Corn straw has the lowest flue gas humidity at 38.4%, followed by wheat straw at 39.3%, and rice straw has the highest at 50.0%, which is 1.3 times that of corn straw. The differences in flue gas temperature and humidity among the three types of straw are primarily due to differences in their composition and properties. Biomass straw has a relatively high hydrogen content, which causes it to generate moisture during combustion. Additionally, the heating value of rice straw is slightly lower than that of wheat and corn straw, resulting in lower energy conversion efficiency during combustion. This results in reduced heat release, resulting in lower flue gas temperatures and higher humidity.
The emission factors of major pollutants in the flue gas produced by the combustion of three crop straws (rice straw, wheat straw, and corn straw) in the furnace are presented in Table 3. The results show that the real-time emission factors of NO, NO2, and dust in the flue gas ranges from 1.48 to 2.75 g·kg−1, 0.57 to 0.79 g·kg−1, and 25.34 to 28.26 g·kg−1, respectively, with an NO/NO2 ratio of 2.14–4.82. Corn straw has the highest NO emission factor at 2.75 ± 0.21 g·kg−1, while wheat straw exhibits a higher NO2 emission factor at 0.79 ± 0.14 g·kg−1. Corn straw also has the highest dust emission factor at 28.26 g·kg−1. During the experiment, it was observed that, compared to rice and wheat straw, corn straw combustion produces more noticeable pollutants, generates heavier white smoke, and has less complete combustion. The higher NO/NO2 ratio of corn straw further indicates relatively lower oxygen levels in the furnace during combustion, slowing the conversion of NO to NO2 and resulting in higher NO emissions.
While this study investigated flue gas from three typical straw types (rice, wheat, and corn), practical applications involving different biomass fuels (e.g., wood or high-sulfur straw) may exhibit varied combustion conditions and flue gas compositions (e.g., SO2, CO), potentially affecting purification efficiency. For instance, SO2 from high-sulfur fuel combustion may react with ammonia to form ammonium sulfate [23], altering droplet properties. Future work should expand fuel-type testing and investigate interaction mechanisms under multi-pollutant coexistence to enhance system adaptability.

3.2. Effect of Different Operating Parameters on the Charge–Mass Ratio

3.2.1. Effect of Spray Pressure on Charge–Mass Ratio

The effect of nozzle spray pressure on the charge-to-mass ratio of droplets is shown in Figure 5. The experiment used tap water as the spray medium and selected spray pressures of 0.2 MPa, 0.3 MPa, 0.4 MPa, and 0.5 MPa. Under each spray pressure, the charging voltage was adjusted in increments of 2 kV from 2 kV to 10 kV. The measured charge-to-mass ratios are shown in Figure 5. As the spray pressure increases, the charge-to-mass ratio gradually increases, but the rate of increase becomes progressively slower. This is because as spray pressure increases, the droplet size decreases and the surface area per unit mass of the droplets increases. As a result, the smaller droplets can have better charging effects in an electric field. As the spray pressure continues to increase, the droplet size decreases, and the critical charge required for droplet instability and breakup decreases. As a result, the droplet’s charge approaches its maximum value, and the charging voltage’s effect on increasing the charge-to-mass ratio decreases.
The droplet size significantly affects the electrostatic adsorption efficiency [24]. Experiments showed that increasing the spray pressure from 0.2 MPa to 0.5 MPa increased the charge-to-mass ratio by 1.8 times (Figure 5). While smaller droplets have superior submicron particle capture capability due to their larger surface area, optimal purification performance requires a careful balance between the settling velocity and residence time. Future studies should focus on optimizing droplet size distributions for maximum efficiency.

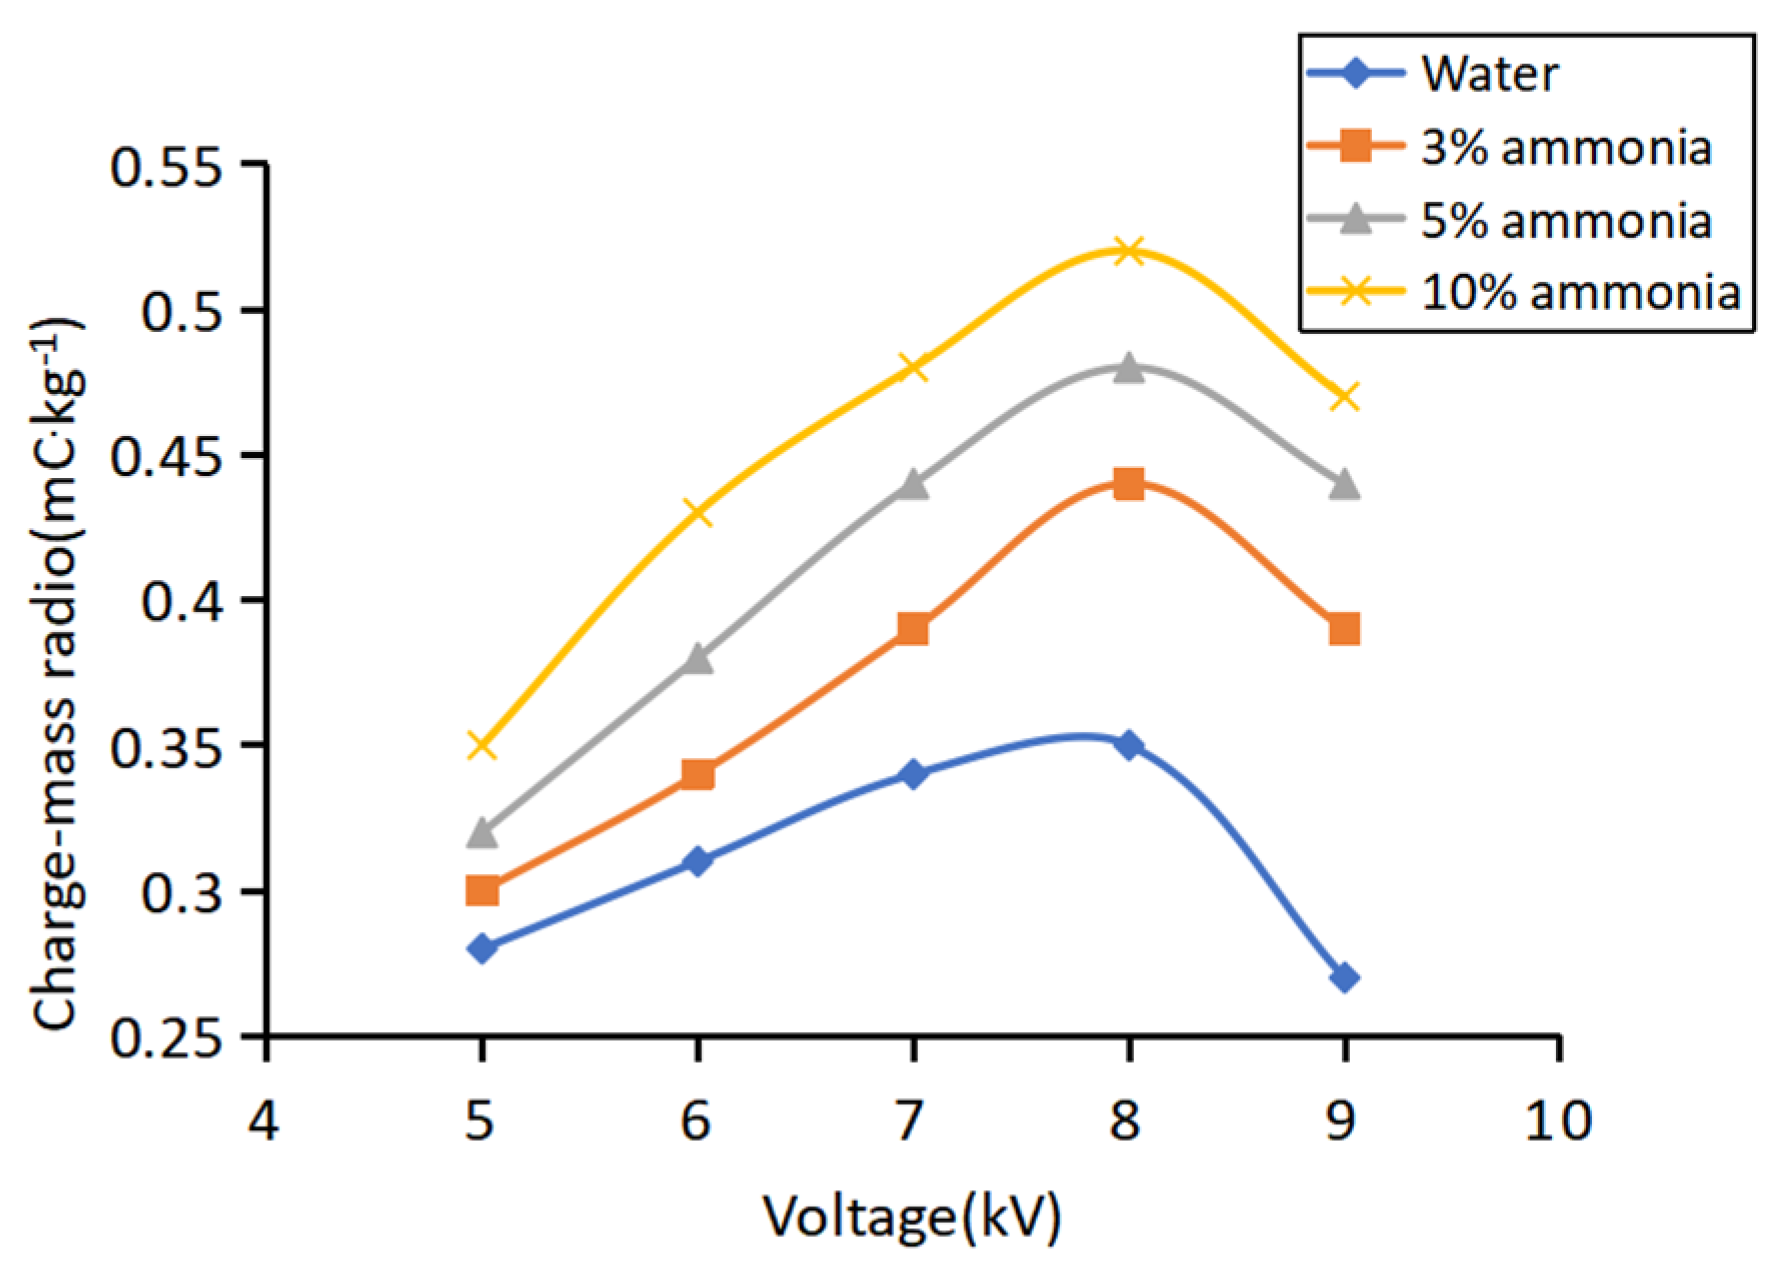
3.2.2. Effect of Ammonia Concentration on Charge–Mass Ratio

The effect of ammonia concentration on the droplet charge–mass ratio is shown in Figure 6. Under the same charge voltage condition, the charge-to-mass ratio gradually increases as ammonia concentration increases. It is known that the ammonia solution has a density of 0% > 3% > 5% > 10%, and a conductivity of 10% > 5% > 3% > 0%. At the same spray flow rate, the lower the density, the lower the mass, and according to the charge–mass ratio formula, the lower the mass, the higher the charge-to-mass ratio for the same charge. The charging time constant equation [25] states that the conductivity of the medium affects the charging time:
t c = ϵ / S
where t c is the charging time constant, ϵ is the dielectric constant of the solution, and S is the electrical conductivity.
The conductivity is inversely related to the charging time constant; the greater the conductivity, the shorter the droplet charging time. The droplet formation time is fixed when other working conditions are kept consistent, so the larger the conductivity of the medium in the droplet formation process, the more efficient the charge in the electric field and the greater the charge-to-mass ratio.
This study found a positive correlation between the charge-to-mass ratio of the ammonia solution and its concentration (Figure 6). However, ammonia volatility may compromise long-term operational stability. Experiments revealed a 12% decrease in conductivity after 24 h of open-air exposure for a 10% ammonia solution, indicating potential ammonia loss and reduced charge-carrying capacity. Future research could mitigate ammonia escape by adding stabilizers [26].

3.2.3. Effect of Charging Voltage on Charge–Mass Ratio

As illustrated in Figure 5 and Figure 6, the charge–mass ratio showed an initial increase followed by a decrease as the charging voltage was increased. The charge–mass ratio increases linearly with the charging voltage within the voltage. This trend suggests that as the charging voltage increases, the electric field strength between the electrode ring and the nozzle increases, leading to a gradual increase in the droplet’s charge and, therefore, a higher charge–mass ratio.
However, when the charging voltage exceeded 8 kV, the charge–mass ratio started to decrease instead of continuing to increase. This decline can be attributed to the fact that the surface of the electrode ring is not perfectly smooth. At higher charging voltages, corona discharge occurs due to irregularities in the electrode ring. The corona discharge creates a charge on the droplet, which is the same polarity as the charging electrode. This charge-neutralization process cancels out the initial charge on the droplet and reduces the overall charge–mass ratio.

3.3. Purification Effect of Straw Flue Gas

Based on the charge-to-mass ratio measurement results, the following conditions were selected for the straw flue gas purification test: a spray pressure of 0.5 MPa, charge voltages of 0 kV and 8 kV, and a spray media consisting of water and 10% ammonia solution, respectively.

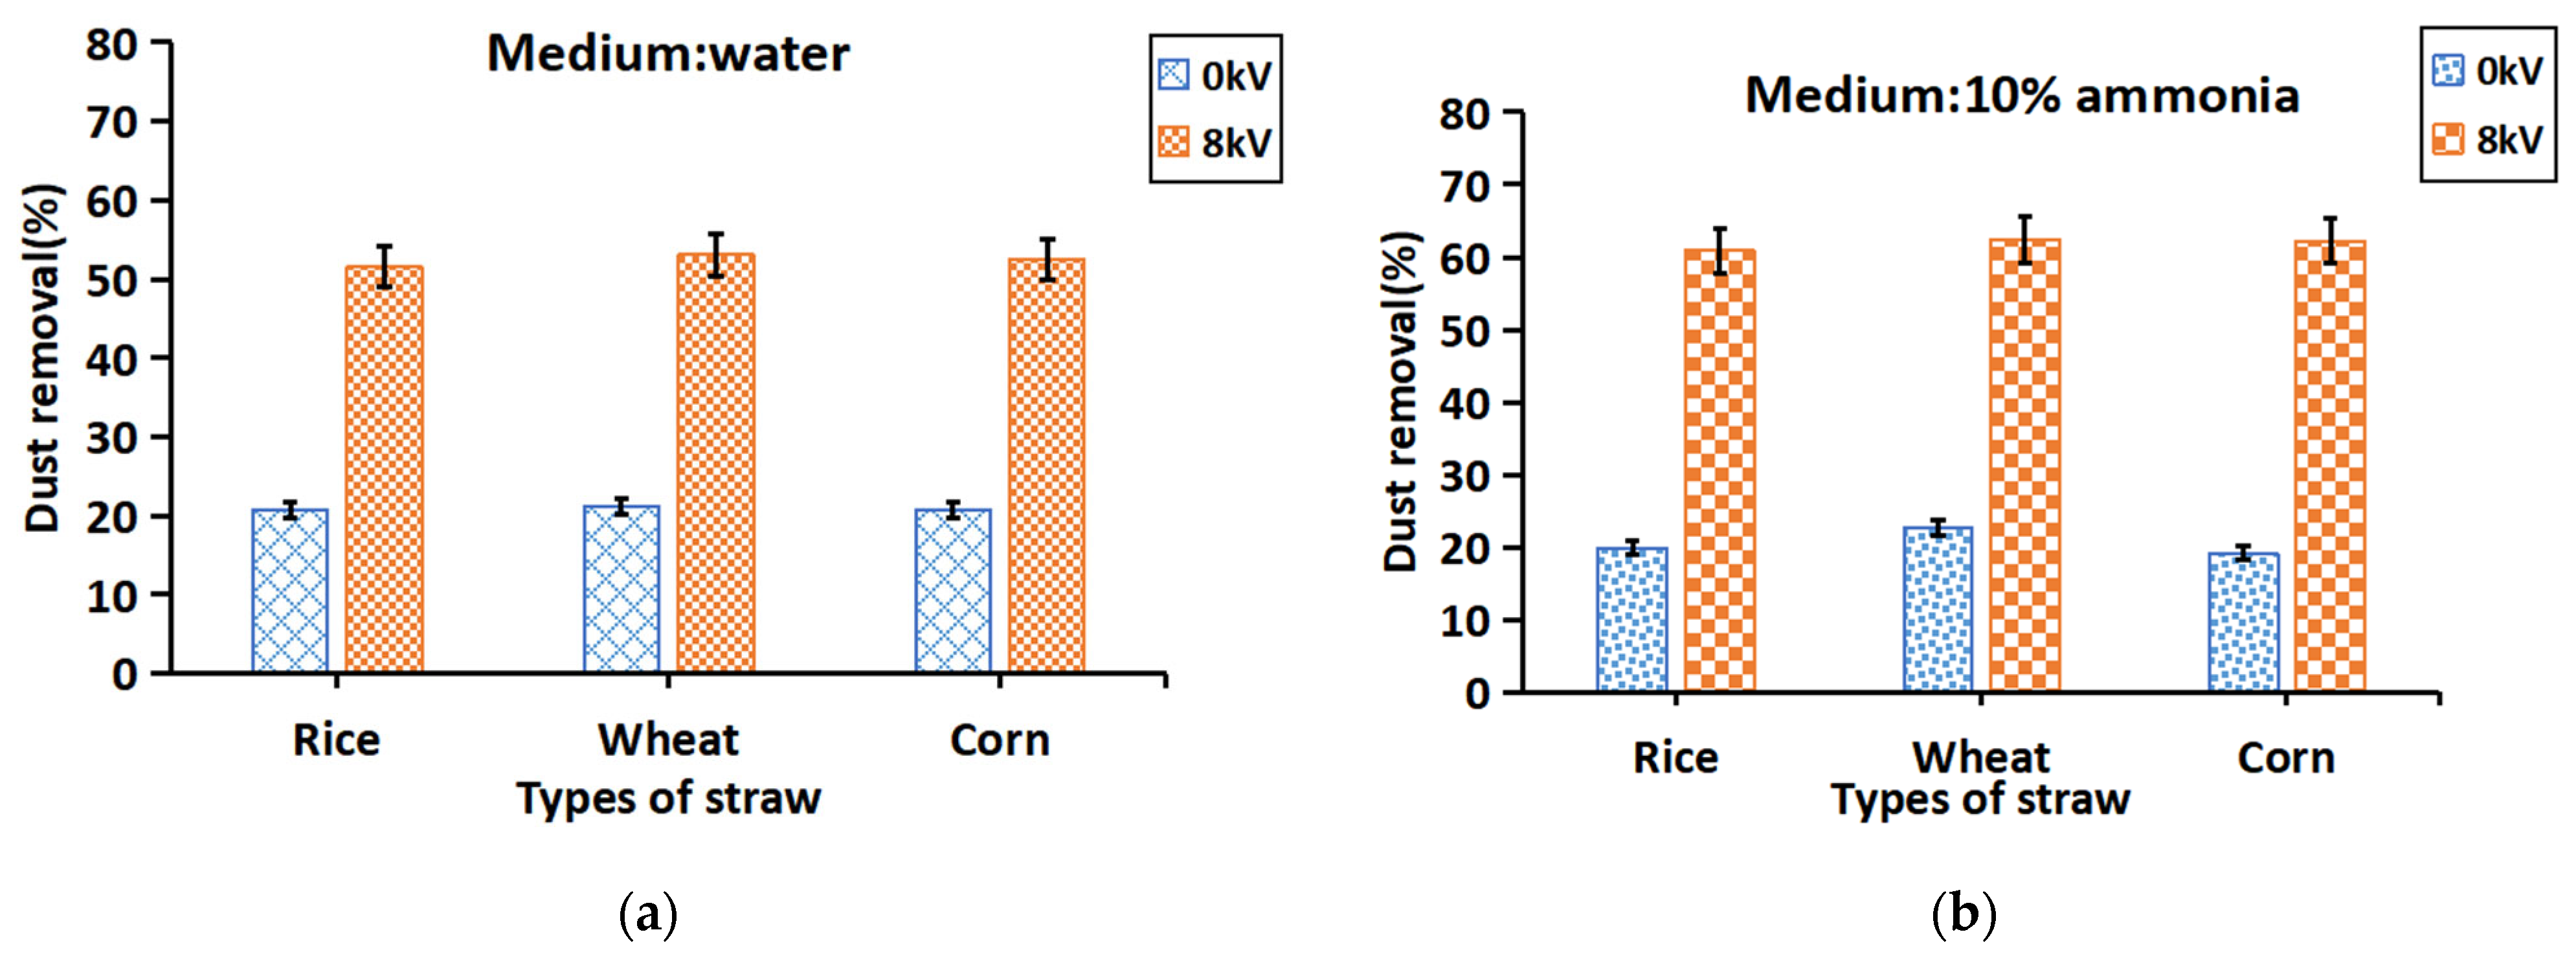
3.3.1. Electrostatic Charging Effects on Dust Removal

The effects of spray charging on dust removal efficiency in the flue gas are shown in Figure 7. The test device, whether using water or a 10% ammonia solution as the spray medium, achieved a dust removal efficiency of 19–23% under uncharged conditions for the three types of straw combustion flue gases. Under charged conditions (8 kV), this efficiency increased significantly to 52–63%, representing a 2.5- to 3-fold improvement over the uncharged scenario.
This improvement can be attributed to the behavior of the charged droplets. Under the influence of an external electric field, droplets are broken down into smaller, charged particles [27,28]. The Coulomb repulsion between these droplets ensures a more uniform distribution, expanding their contact area with the flue gas. At the same time, when particles in the flue gas come into contact with the charged droplets, an electrostatic force is generated. This force enables the charged droplets to actively capture and adsorb fine particles in their surroundings.
In summary, spray charging plays a crucial role in enhancing dust removal efficiency by improving droplet distribution and promoting the capture of fine particles through electrostatic interactions.

3.3.2. Electrostatic Charging Effects on Nitrogen Oxide Removal

The effects of spray charging on the removal efficiency of nitrogen oxides (NOx) from the flue gas are shown in Figure 8. The results show that the removal rate of NO at an 8 kV charge is not significantly different from that under uncharged conditions, with both achieving a removal rate of approximately 19%. For NO2, the removal rate under uncharged conditions was around 20%, but it increased to 31–34% when charged at 8 kV.
This discrepancy can be attributed to the different solubilities of NO and NO2 in water. NO is insoluble in water, meaning that charging the droplets has little effect on its removal. In contrast, NO2 is highly soluble in water. The removal of NO in flue gas primarily occurs through its reaction with O2 in the air, converting it to NO2. Once formed, NO2 can be effectively captured by the spray droplets.
When charged, droplets become atomized into a larger number of smaller droplets, which are more evenly distributed under the influence of a strong electric field. This process increases the contact area between the droplets and the flue gas, thereby enhancing the dissolution of NO2 into the atomized droplets. As a result, the removal efficiency of NO2 is significantly improved under charged conditions.

3.3.3. Electrostatic Charging and Ammonia on Dust Removal

The impacts of ammonia concentration on the flue gas dust removal efficiency are shown in Figure 9. Under uncharged conditions, the dust removal rate remains largely unaffected by ammonia concentration, hovering around 20%. However, under charged conditions (8 kV), the dust removal rate is significantly impacted by the spray medium. When water is used as the medium, the dust removal rate reaches approximately 52%, whereas with a 10% ammonia solution, the rate increases to 62%. This confirms the charge–mass ratio measurements shown in Figure 7.
Electrostatic spray dust removal technology primarily relies on electrostatic forces to actively capture particles surrounding the atomized droplets [29,30,31]. The higher the charge on the droplets, the stronger their ability to absorb surrounding particles. The charge–mass ratio of the droplets directly affects the dust removal efficiency. As shown in Figure 9, the charge–mass ratio of the 10% ammonia solution is higher than that of water at the same voltage. Consequently, the higher charge on ammonia droplets enhances their adsorption capacity, resulting in an increased dust removal rate. The dust concentrations after purification via electrostatic-assisted ammonia spraying were 23.4, 24.1, and 26.6 mg.m−3 for the three types of straw dust, all below the 30 mg.m−3 emission limit specified in China’s National Standard “Emission Standard of Air Pollutants for Boilers” (GB 13271-2014, China) [32].

3.3.4. Electrostatic Charging and Ammonia on Nitrogen Oxide Removal

The effects of ammonia concentration on the removal efficiency of nitrogen oxides (NOx) in the flue gas are shown in Figure 10. The results show that using a 10% ammonia solution as the spray medium significantly enhances the removal of NOx compared to water. Under charged conditions (8 kV), the NOx removal rate using 10% ammonia increases by approximately 17% relative to the uncharged condition, achieving removal efficiencies close to 90% for both NO and NO2.
When the 10% ammonia solution is atomized and sprayed into the flue gas, a portion of the ammonia vaporizes and mixes with the surrounding air. The NO in the flue gas reacts with oxygen in the purification cylinder and simultaneously reacts with the vaporized ammonia gas to produce clean nitrogen gas and water [33]. This dual reaction effectively removes NO from the flue gas.
During the flow process, NO2 in the flue gas comes into contact with the atomized ammonia solution droplets. This interaction generates clean nitrogen and water, as well as ammonium nitrate, which has a fertilizing effect and settles with the droplets [34]. The revenue generated from purification byproducts can partially compensate for the reagent costs of this method, endowing it with relative economic competitiveness over conventional denitrification technologies. Through the combined effects of the ammonia solution and water absorption, NO2 is effectively removed from the flue gas. The NOx concentrations after purification via electrostatic-assisted ammonia spraying were measured at 13.1, 14.9, and 16.7 mg.m−3 for the three types of straw combustion, all significantly below the 200 mg.m−3 emission limit stipulated in China’s National Standard “Emission Standard of Air Pollutants for Boilers” (GB 13271-2014).

4. Conclusions

The emission factors of major pollutants in the flue gas produced from the combustion of different straw types in furnaces vary. Among the three straw types, corn straw combustion produces the highest concentrations of nitrogen oxides (NO and NO2) and particulate matter in the flue gas. In contrast, rice straw combustion produces flue gas with relatively low temperature and higher humidity. The differences in pollutant concentrations, temperature, and humidity among various straw types are primarily due to variations in their composition and properties.
The droplet charge–mass ratio is positively correlated with spray pressure. As the spray pressure increases, the charge–mass ratio of the droplets gradually increases, with a rate of increase moderating at higher pressures. Additionally, the charge–mass ratio is positively correlated with ammonia concentration, with higher ammonia concentrations yielding higher charge–mass ratios. The charge–mass ratio also exhibits a non-linear relationship with charging voltage, initially increasing and then decreasing, reaching a peak at a charging voltage of 8 kV.
High charging significantly reduces particulate matter from the flue gas. For the three types of flue gas generated by straw combustion, the dust removal rate at 8 kV is significantly higher under uncharged conditions, with an average increase of approximately 2.5 to 3 times, regardless of whether the spray medium is water or a 10% ammonia solution.
The ammonia solution primarily affects the removal of nitrogen oxides (NO and NO2) from flue gas. For the three types of straw combustion flue gas, the removal rate of nitrogen oxides is significantly higher when using a 10% ammonia solution compared to water. Specifically, under uncharged conditions, the removal rate of nitrogen oxides is about 2.4 times higher with 10% ammonia than with water. Under charged conditions (8 kV), the removal rate of NO is approximately 4.7 times higher, and the removal rate of NO2 is about 2.8 times higher when using a 10% ammonia solution compared to water.
To summarize, the best results for flue gas cleaning were achieved by using a combination of ammonia solution and an electrostatically charged spray (charge voltage of 8 kV, 10% ammonia). For the three types of flue gas produced by straw combustion, this method achieved an average dust removal rate of 61.8%, an NO removal rate of 88.6%, and an NO2 removal rate of 88.1%.
The proposed straw combustion flue gas purification technology, which combines the ammonia method and electrostatic spray, requires further optimization of process parameters and an economic analysis. By integrating this system into combined harvesters, it achieves a complete “crushing-combustion-purification-returning” treatment cycle. Technology ensures that flue gas emissions meet environmental standards while directly returning readily available nitrogen-rich purification byproducts (containing readily available nitrogen) to farmland. This innovative approach not only resolves straw-burning pollution issues but also enables nutrient recycling, forming a closed-loop agricultural waste valorization system with both environmental and agronomic benefits.

Author Contributions

Conceptualization, B.Z. and C.W.; methodology, B.Z.; software, C.Z.; validation, X.H. and C.Z.; formal analysis, X.H.; investigation, X.H.; resources, B.Z.; data curation, C.Z.; writing—original draft preparation, X.H.; writing—review and editing, X.H.; visualization, X.X.; supervision, B.Z.; project administration, C.W.; funding acquisition, C.W. All authors have read and agreed to the published version of the manuscript.

Funding

This research was funded by the Priority Academic Program Development of Jiangsu Higher Education Institutions (No. PAPD2023_87), the Project of Faculty of Agricultural Engineering of Jiangsu University (No. NZXB20200102), the Postgraduate Research & Practice Innovation Program of Jiangsu Province (No. KYCX24_3990), and the Key and General Projects of Jiangsu Province (No. BE2022338).

Data Availability Statement

Data are contained within the article.

Conflicts of Interest

The authors declare no conflicts of interest.

References

  1. Yang, J.; Chang, J.; Cao, X.; Wang, Y.; Yao, J. Energy, Environmental, and Socioeconomic Potential Benefit of Straw Resources Utilization under Water Availability Limit Condition. J. Clean. Prod. 2023, 392, 136274. [Google Scholar] [CrossRef]
  2. Xing, S.; Zhang, G.; Wang, C.; Zhang, N.; Chen, S. Effects of Straw Incorporation on Soil Erosion Resistance along a Land Degradation Gradient in the Black Soil Region of China. Catena 2023, 231, 107365. [Google Scholar] [CrossRef]
  3. Li, D.; Wang, Y.; Lu, D.; Chen, X.; Cui, Z.; Chen, X.; Lu, J.; Nie, J.; Wang, H.; Zhou, J. Bio-straw resource recycling systems: Agricultural productivity and green development. Resour. Conserv. Recycl. 2023, 190, 106844. [Google Scholar] [CrossRef]
  4. Qian, R.; Guo, R.; Yang, Q.; Naseer, M.A.; Sun, B.; Wang, L.; Zhang, J.; Ren, X.; Chen, X.; Jia, Z. Can straw recycling achieve sustainable agriculture at the smallholder level? A case in a semi-arid region. J. Clean. Prod. 2024, 439, 140859. [Google Scholar] [CrossRef]
  5. Alemayehu, Y.A.; Asfaw, S.L.; Terfie, T.A. Exposure to urban particulate matter and its association with human health risks. Environ. Sci. Pollut. Res. 2020, 27, 27491–27506. [Google Scholar] [CrossRef]
  6. Mendoza, D.L.; Crosman, E.T.; Benney, T.M.; Anderson, C.; Gonzales, S.A. A Preliminary Case Study on the Compounding Effects of Local Emissions and Upstream Wildfires on Urban Air Pollution. Fire 2024, 7, 184. [Google Scholar] [CrossRef]
  7. Kim, M.; Jo, S.; Woo, J.; Jeon, E.-C. Studies on characteristics of fine particulate matter emissions from agricultural residue combustion. Energy Environ. 2021, 32, 1361–1377. [Google Scholar] [CrossRef]
  8. Gatkal, N.R.; Nalawade, S.M.; Sahni, R.K.; Walunj, A.A.; Kadam, P.B.; Bhanage, G.B.; Datta, R. Present trends, sustainable strategies and energy potentials of crop residue management in India: A review. Heliyon 2024, 10, e39815. [Google Scholar] [CrossRef]
  9. Hurets, L.; Izmodenova, T.; Vakal, V.; Vakal, S.; Malovanyy, M. Utilization of Renewable Energy Waste (Wood Ash and Straw) in the Production of Mineral Fertilizers. J. Ecol. Eng. 2024, 25, 332–339. [Google Scholar] [CrossRef]
  10. Ren, B.; Xie, P.; Xu, J.; Li, A.; Tian, X.; Hu, Z.; Huang, Y.; Li, X.; Zhang, Q.; Ren, H.; et al. Use of the PSCF method to analyze the variations of potential sources and transports of NO2, SO2, and HCHO observed by MAX-DOAS in Nanjing, China during 2019. Sci. Total Environ. 2021, 782, 146865. [Google Scholar] [CrossRef]
  11. Fan, J.-N.; Deng, J.; Xiao, Y. Comprehensive review of spray and ventilation technologies for coal dust control at mining faces. Process Saf. Environ. Prot. 2025, 195, 106799. [Google Scholar] [CrossRef]
  12. Wang, Y.; Yang, M.; Shao, L.; Wu, Z.; Liu, W.; Chen, Y.; Zheng, C.; Gao, X. Enhancing fine particle removal by electrostatic precipitation from flue gas with a high PM concentration: Effect of various electrode configurations. Sep. Purif. Technol. 2025, 353 Pt B, 128459. [Google Scholar] [CrossRef]
  13. Chen, L.; Gonze, E.; Ondarts, M.; Outin, J.; Gonthier, Y. Electrostatic precipitator for fine and ultrafine particle removal from indoor air environments. Sep. Purif. Technol. 2020, 247, 116964. [Google Scholar] [CrossRef]
  14. Teng, C.; Fan, X.; Li, J. Effect of charged water drop atomization on particle removal performance in plate type wet electrostatic precipitator. J. Electrost. 2020, 104, 103426. [Google Scholar] [CrossRef]
  15. Zhang, B.; Hu, C.; He, J. Performance evaluation of a three-stage composite wet scrubber for removing particulate matter. IOP Conf. Ser. Earth Environ. Sci. 2020, 615, 012117. [Google Scholar] [CrossRef]
  16. Alves, L.; Holz, L.I.V.; Fernandes, C.; Ribeirinha, P.; Mendes, D.; Fagg, D.P.; Mendes, A. A comprehensive review of NOx and N2O mitigation from industrial streams. Renew. Sustain. Energy Rev. 2022, 155, 111916. [Google Scholar] [CrossRef]
  17. Liu, B.; Xu, X.; Xue, Y.; Liu, L.; Yang, F. Simultaneous desulfurization and denitrification from flue gas by catalytic ozonation combined with NH3/(NH4)2S2O8 absorption: Mechanisms and recovery of compound fertilizer. Sci. Total Environ. 2020, 706, 136027. [Google Scholar] [CrossRef]
  18. Chin, T.; Tam, I.; Yin, C.-Y. Wet scrubbing process with oxidation and reduction in series for removal of SO2 and NO from marine diesel engine exhaust. Chem. Eng. J. 2023, 464, 142299. [Google Scholar] [CrossRef]
  19. Yamasaki, H.; Mizuguchi, Y.; Nishioka, R.; Fukuda, Y.; Kuroki, T.; Yamamoto, H.; Okubo, M. Pilot-Scale NOx and SOx Aftertreatment by Semi-Dry Plasma-Chemical Hybrid Process in Glass-Melting-Furnace Exhaust Gas. Plasma Chem. Plasma Process. 2021, 42, 51–71. [Google Scholar] [CrossRef]
  20. Zhu, Z.; Xu, B. Purification Technologies for NOx Removal from Flue Gas: A Review. Separations 2022, 9, 307. [Google Scholar] [CrossRef]
  21. Dai, S.; Zhang, J.; Jia, W.; Ou, M.; Zhou, H.; Dong, X.; Chen, H.; Wang, M.; Chen, Y.; Yang, S. Experimental Study on the Droplet Size and Charge-to-Mass Ratio of an Air-Assisted Electrostatic Nozzle. Agriculture 2022, 12, 889. [Google Scholar] [CrossRef]
  22. State Environmental Protection Administration. Determination of Particulate Matter in Exhaust from Stationary Pollution Sources and Sampling Method for Gaseous Pollutants; GB/T 16157-1996; China Environmental Science Press: Beijing, China, 1996. [Google Scholar]
  23. Xu, Q.; Chen, Z.; Xian, S.; Wu, Y.; Li, M. Sulfur release behavior and sulfur fixation mechanism during biomass microwave co-pyrolysis of Ascophyllum and rice straw. Bioresour. Technol. 2024, 407, 131073. [Google Scholar] [CrossRef] [PubMed]
  24. Ali, M.; Tan, Y.; Lin, F.; Su, Z.; Liao, W.; Wang, H. Pilot design of experiment study: Effect of stirring duration and guest particle loading on electrostatic adsorption of Ti-6Al-4V composite powder formation. Int. J. Adv. Manuf. Technol. 2024, 130, 1949–1967. [Google Scholar] [CrossRef]
  25. Wang, H.; Yang, L. Dielectric constant, dielectric loss, conductivity, capacitance and model analysis of electronic electroactive polymers. Polym. Test. 2023, 120, 107965. [Google Scholar] [CrossRef]
  26. Chakraborty, R.; Purakayastha, T.J.; Pendall, E.; Dey, S.; Jain, N.; Kumar, S. Nitrification and urease inhibitors mitigate global warming potential and ammonia volatilization from urea in rice-wheat system in India: A field to lab experiment. Sci. Total Environ. 2023, 898, 65479. [Google Scholar] [CrossRef]
  27. Vaddi, R.S.; Guan, Y.; Novosselov, I. Behavior of Ultrafine Particles in Electro-Hydrodynamic Flow Induced by Corona Discharge. J. Aerosol Sci. 2020, 148, 105587. [Google Scholar] [CrossRef]
  28. Zhou, H.; Ou, M.; Dong, X.; Zhou, W.; Dai, S.; Jia, W. Spraying performance and deposition characteristics of an improved air-assisted nozzle with induction charging. Front. Plant Sci. 2024, 15, 1309088. [Google Scholar] [CrossRef]
  29. Ou, M.; Wang, M.; Zhang, J.; Gu, Y.; Jia, W.; Dai, S. Analysis and experiment research on droplet coverage and deposition measurement with capacitive sensor. Comput. Electron. Agric. 2024, 218, 108743. [Google Scholar] [CrossRef]
  30. Badami, M.M.; Tohidi, R.; Aldekheel, M.; Farahani, V.J.; Verma, V.; Sioutas, C. Design, optimization, and evaluation of a wet electrostatic precipitator (ESP) for aerosol collection. Atmos. Environ. 2023, 308, 119858. [Google Scholar] [CrossRef]
  31. Patel, S.; Veerasamy, V.S.; St. John, J.P.; Orlov, A. A comprehensive review on dust removal using electrodynamic shield: Mechanism, influencing factors, performance, and progress. Renew. Sustain. Energy Rev. 2023, 183, 113471. [Google Scholar] [CrossRef]
  32. Ministry of Environmental Protection of the People’s Republic of China; General Administration of Quality Supervision, Inspection and Quarantine. Emission Standard of Air Pollutants for Boilers; GB 13271-2014; China Environmental Science Press: Beijing, China, 2014. [Google Scholar]
  33. Yousefi Rizi, H.A.; Shin, D. Development of Ammonia Combustion Technology for NOx Reduction. Energies 2025, 18, 1248. [Google Scholar] [CrossRef]
  34. Hadlocon, L.J.S.; Zhao, L.; Wyslouzil, B.E.; Zhu, H. Semi-mechanistic modelling of ammonia absorption in an acid spray wet scrubber based on mass balance. Biosyst. Eng. 2015, 136, 14–24. [Google Scholar] [CrossRef]
Figure 1. Straw materials.
Agriculture 15 01001 g001
Figure 2. Electrostatic nozzle.
Agriculture 15 01001 g002
Figure 3. Schematic diagram of the charge–mass ratio measuring device.
Agriculture 15 01001 g003
Figure 4. Schematic diagram of the flue gas purification test platform.
Agriculture 15 01001 g004
Figure 5. Variation in charge–mass ratio with spray pressure.
Agriculture 15 01001 g005
Figure 6. Variation in charge–mass ratio with ammonia concentration.
Agriculture 15 01001 g006
Figure 7. Effect of charging on dust removal: (a) medium: water; (b) medium: 10% ammonia.
Agriculture 15 01001 g007
Figure 8. Effect of charging on nitrogen oxide removal. (a) Medium: water; (b) medium: 10% ammonia.
Agriculture 15 01001 g008
Figure 9. The impacts of ammonia concentration on the flue gas dust removal efficiency. (a) Charge: 0 kV; (b) charge: 8 kV.
Agriculture 15 01001 g009
Figure 10. The effects of ammonia concentration on the removal efficiency of nitrogen oxides (NOx) in the flue gas (a) Charge: 0 kV; (b) charge: 8 kV.
Agriculture 15 01001 g010
Table 1. Conductivity characteristics of spray medium.
MediumResistance (Ω)Conductivity (mS·cm−1)
Water (0%)32260.31
3% ammonia solution8211.21
5% ammonia solution7751.29
10% ammonia solution7111.41
Table 2. Temperature and humidity of flue gas from straw combustion.
Types of StrawGas Temperature (°C)Relative Humidity (/%)
rice straw40.350.0
wheat straw59.339.3
corn straw56.938.4
Table 3. Combustion flue gas emission factor of straw combustion furnace (g·kg−1).
Types of StrawNONO2NOxDust
rice straw1.48 ± 0.230.69 ± 0.102.1726.49
wheat straw2.18 ± 0.210.79 ± 0.142.9725.34
corn straw2.75 ± 0.210.57 ± 0.073.3228.26
Disclaimer/Publisher’s Note: The statements, opinions and data contained in all publications are solely those of the individual author(s) and contributor(s) and not of MDPI and/or the editor(s). MDPI and/or the editor(s) disclaim responsibility for any injury to people or property resulting from any ideas, methods, instructions or products referred to in the content.

