1. Introduction
Apples are a globally critical agricultural product, with China holding a dominant position in both production and consumption, accounting for over 50% of the world’s total output [
1]. However, the development of the apple industry is accompanied by numerous severe challenges. Apple harvesting has distinct seasonal characteristics, and the current process relies heavily on manual labor. Due to population aging, agricultural production faces a shortage of labor [
2,
3]. Vasso Marinoudi’s research [
4] indicates that advancing automation and mechanization can reduce or offset this impact. While mechanical harvesting technologies can enhance harvesting speed to some extent, fruits are highly susceptible to mechanical damage during harvesting, packaging, and transportation, often leading to degraded fruit quality [
5,
6]. According to a research report by Zaharan Hussein [
7], apple bruising can be as high as 35% during the harvest and transportation processes alone. The Food and Agriculture Organization of the United Nations report
The State of Food and Agriculture [
8] states that global fruit and vegetable production suffered a 15–20% loss in 2016, noting that in developing countries, mechanical damage from outdated technology accounts for a higher proportion of postharvest fruit losses than in developed countries. This not only causes enormous resource waste—contrary to global sustainable development goals—but also directly harms farmers’ economic interests, dampens their production motivation, and threatens the healthy development of the entire industry.
In terms of harvesting methods, the traditional manual approach involves workers using ladders to pick apples, temporarily storing them in portable buckets, and transporting full buckets to centralized collection points. Prolonged manual harvesting poses risks to workers’ physical health [
9]. Zhao Zhang et al.’s study [
10] found that pickers spend approximately 64% of their working time in awkward postures prone to causing occupational diseases, with ladders and buckets contributing to most cumbersome operations and inefficiencies, severely limiting harvesting scale and speed. Developing mechanized solutions that improve harvesting efficiency while protecting fruit quality has thus become a critical issue for the apple industry.
Current postharvest technologies struggle to balance throughput and damage control. For processing-grade apples, vibration harvesting—mechanically shaking trees to make fruits fall into collection systems—processes 20–60 trees per hour, offering relatively high efficiency [
11]. However, frequent fruit collisions lead to a damage rate as high as 50%. Even when Shaochun Ma et al. [
12] incorporated air suspension buffers in their design and tested six apple varieties, the damage rate remained unacceptably high for fresh market apples, though lower than traditional vibration harvesting. This is a fatal flaw for high-quality fresh eating apples, prompting many studies on this method to focus on improving fruit detachment rates [
13,
14,
15]. With technological progress, robotic arm harvesting has emerged, using machine vision [
16,
17] and flexible grippers [
18,
19] to mimic the precision of manual picking [
20]. However, existing technologies suffer from complex operations and high costs: 3D path planning relies on complex sensor arrays and real-time algorithms [
21,
22], driving up the cost of each robotic arm harvesting system [
23].
Auxiliary harvesting platforms are another common solution. Łukasz Kuta’s research [
24] shows that they effectively reduce the burden of traditional manual harvesting: workers stand on elevating platforms to pick apples and place them directly onto the platform [
25]. While this eliminates the need to carry buckets up and down ladders, repetitive bending to place fruits still causes significant physical strain, affecting work sustainability [
26].
To address these technological bottlenecks and shortcomings of traditional methods, our research team has developed an innovative postharvest apple collection system. Departing from traditional free-fall collection, the system uses a combination of horizontal conveyor belts and pneumatic tubes with air-cushioned transport to achieve low-damage collection: apples are conveyed laterally on belts and buffered vertically through tubes, breaking down the postharvest collection process and eliminating the need for workers to bend to place fruits. By optimizing operational parameters (conveyor speed, air flow velocity, etc.), the system minimizes mechanical stress on fruits while maintaining throughput. Experiments show it has outstanding advantages in protecting fruit quality and enhancing harvesting efficiency, providing a practical solution to the challenge of minimizing damage during postharvest collection for fresh market apples.
2. Materials and Methods
2.1. Machine Structure and Working Principle
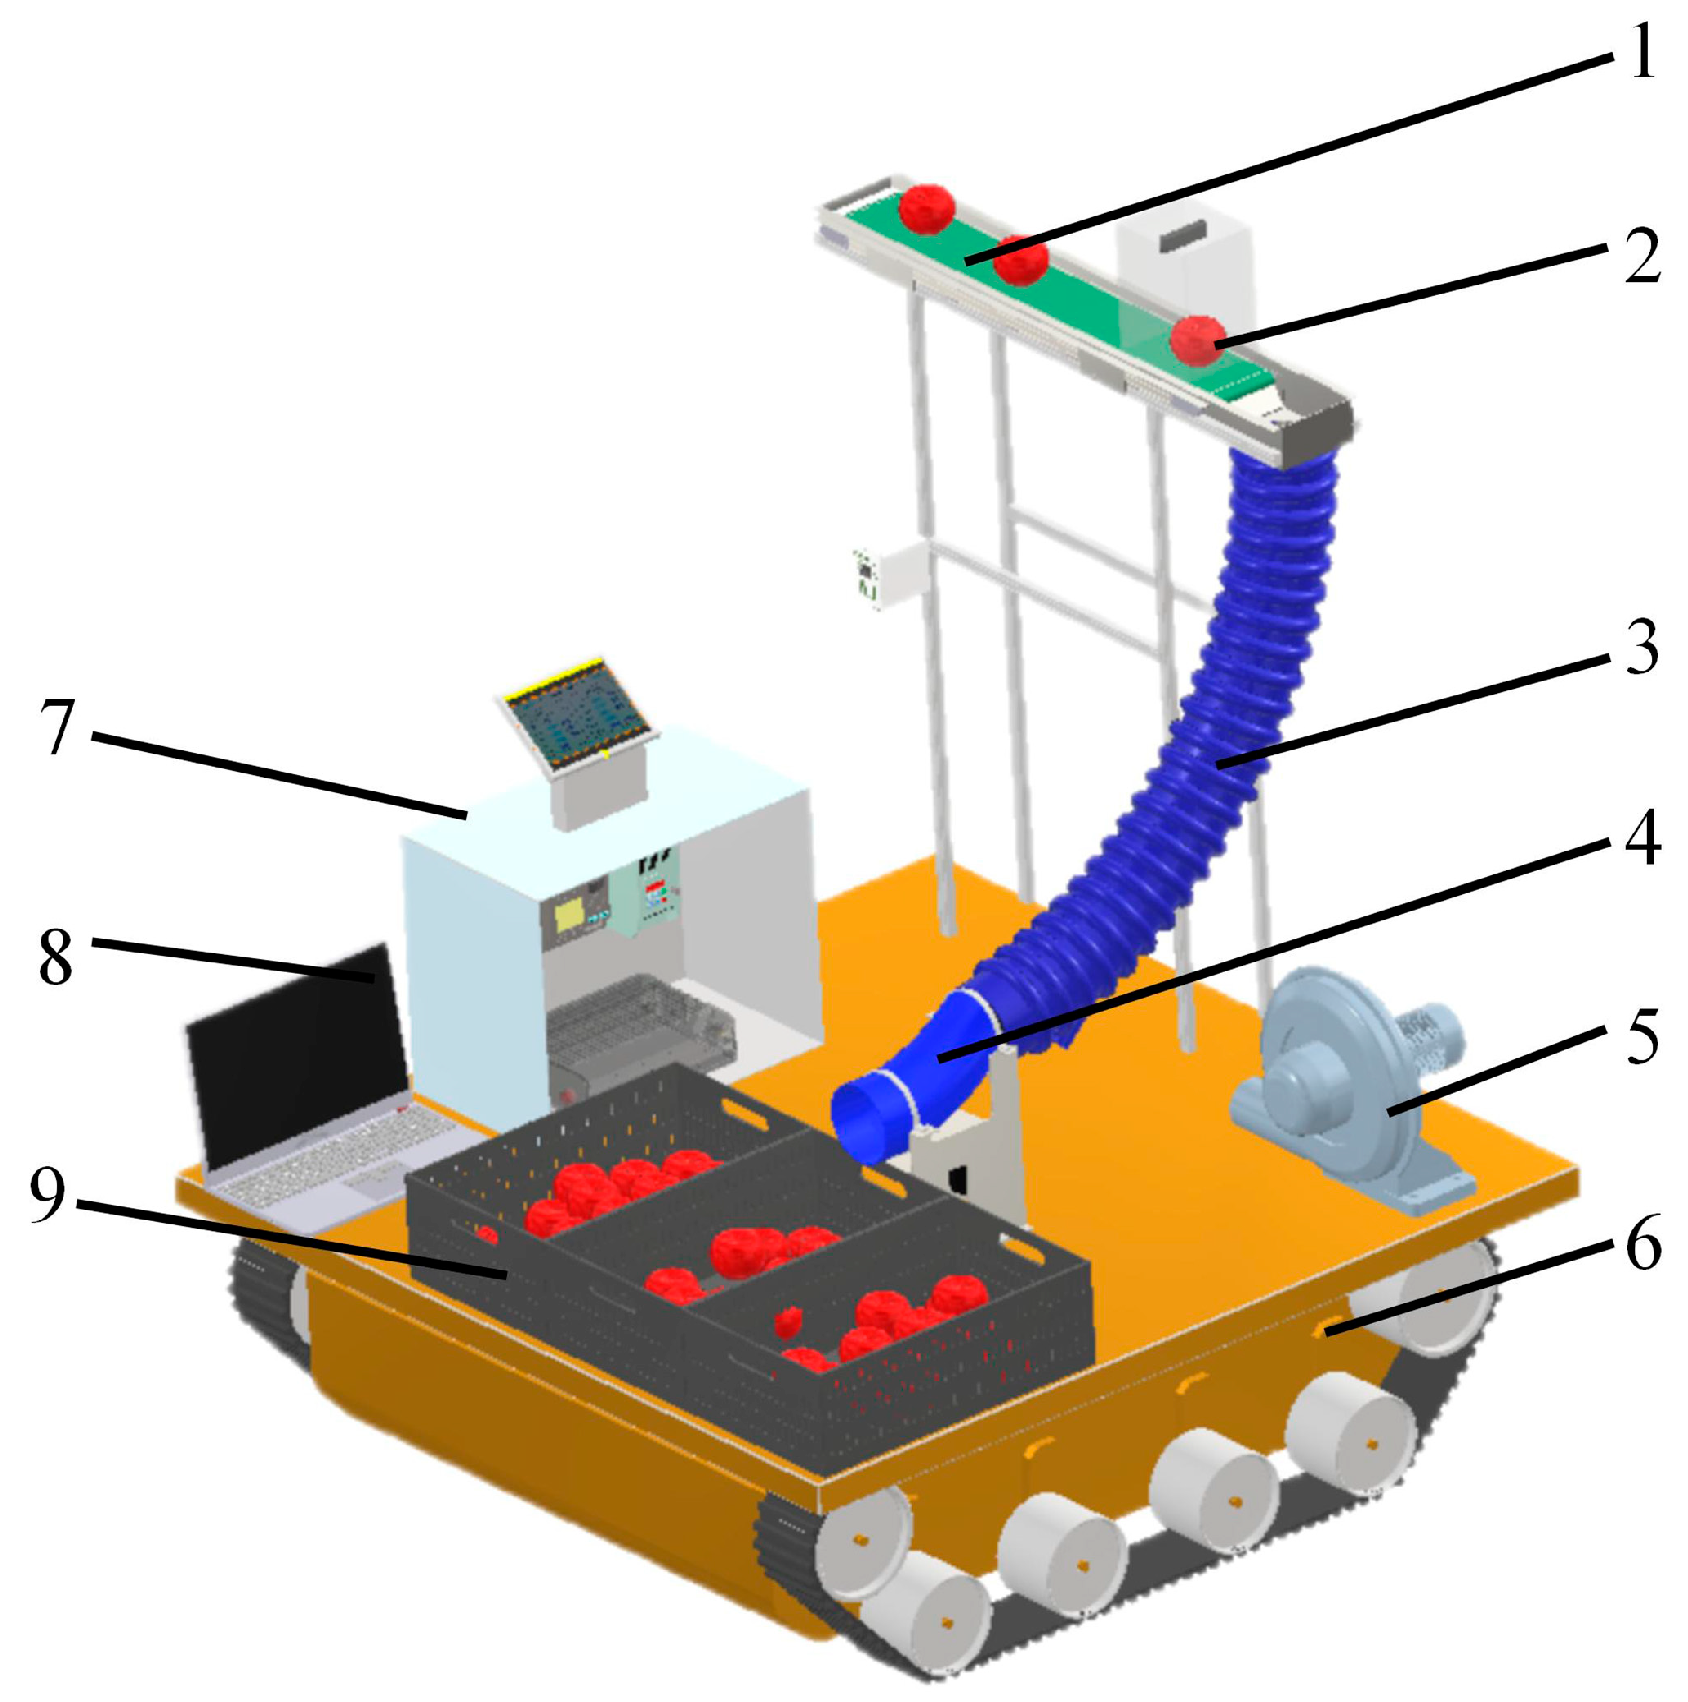
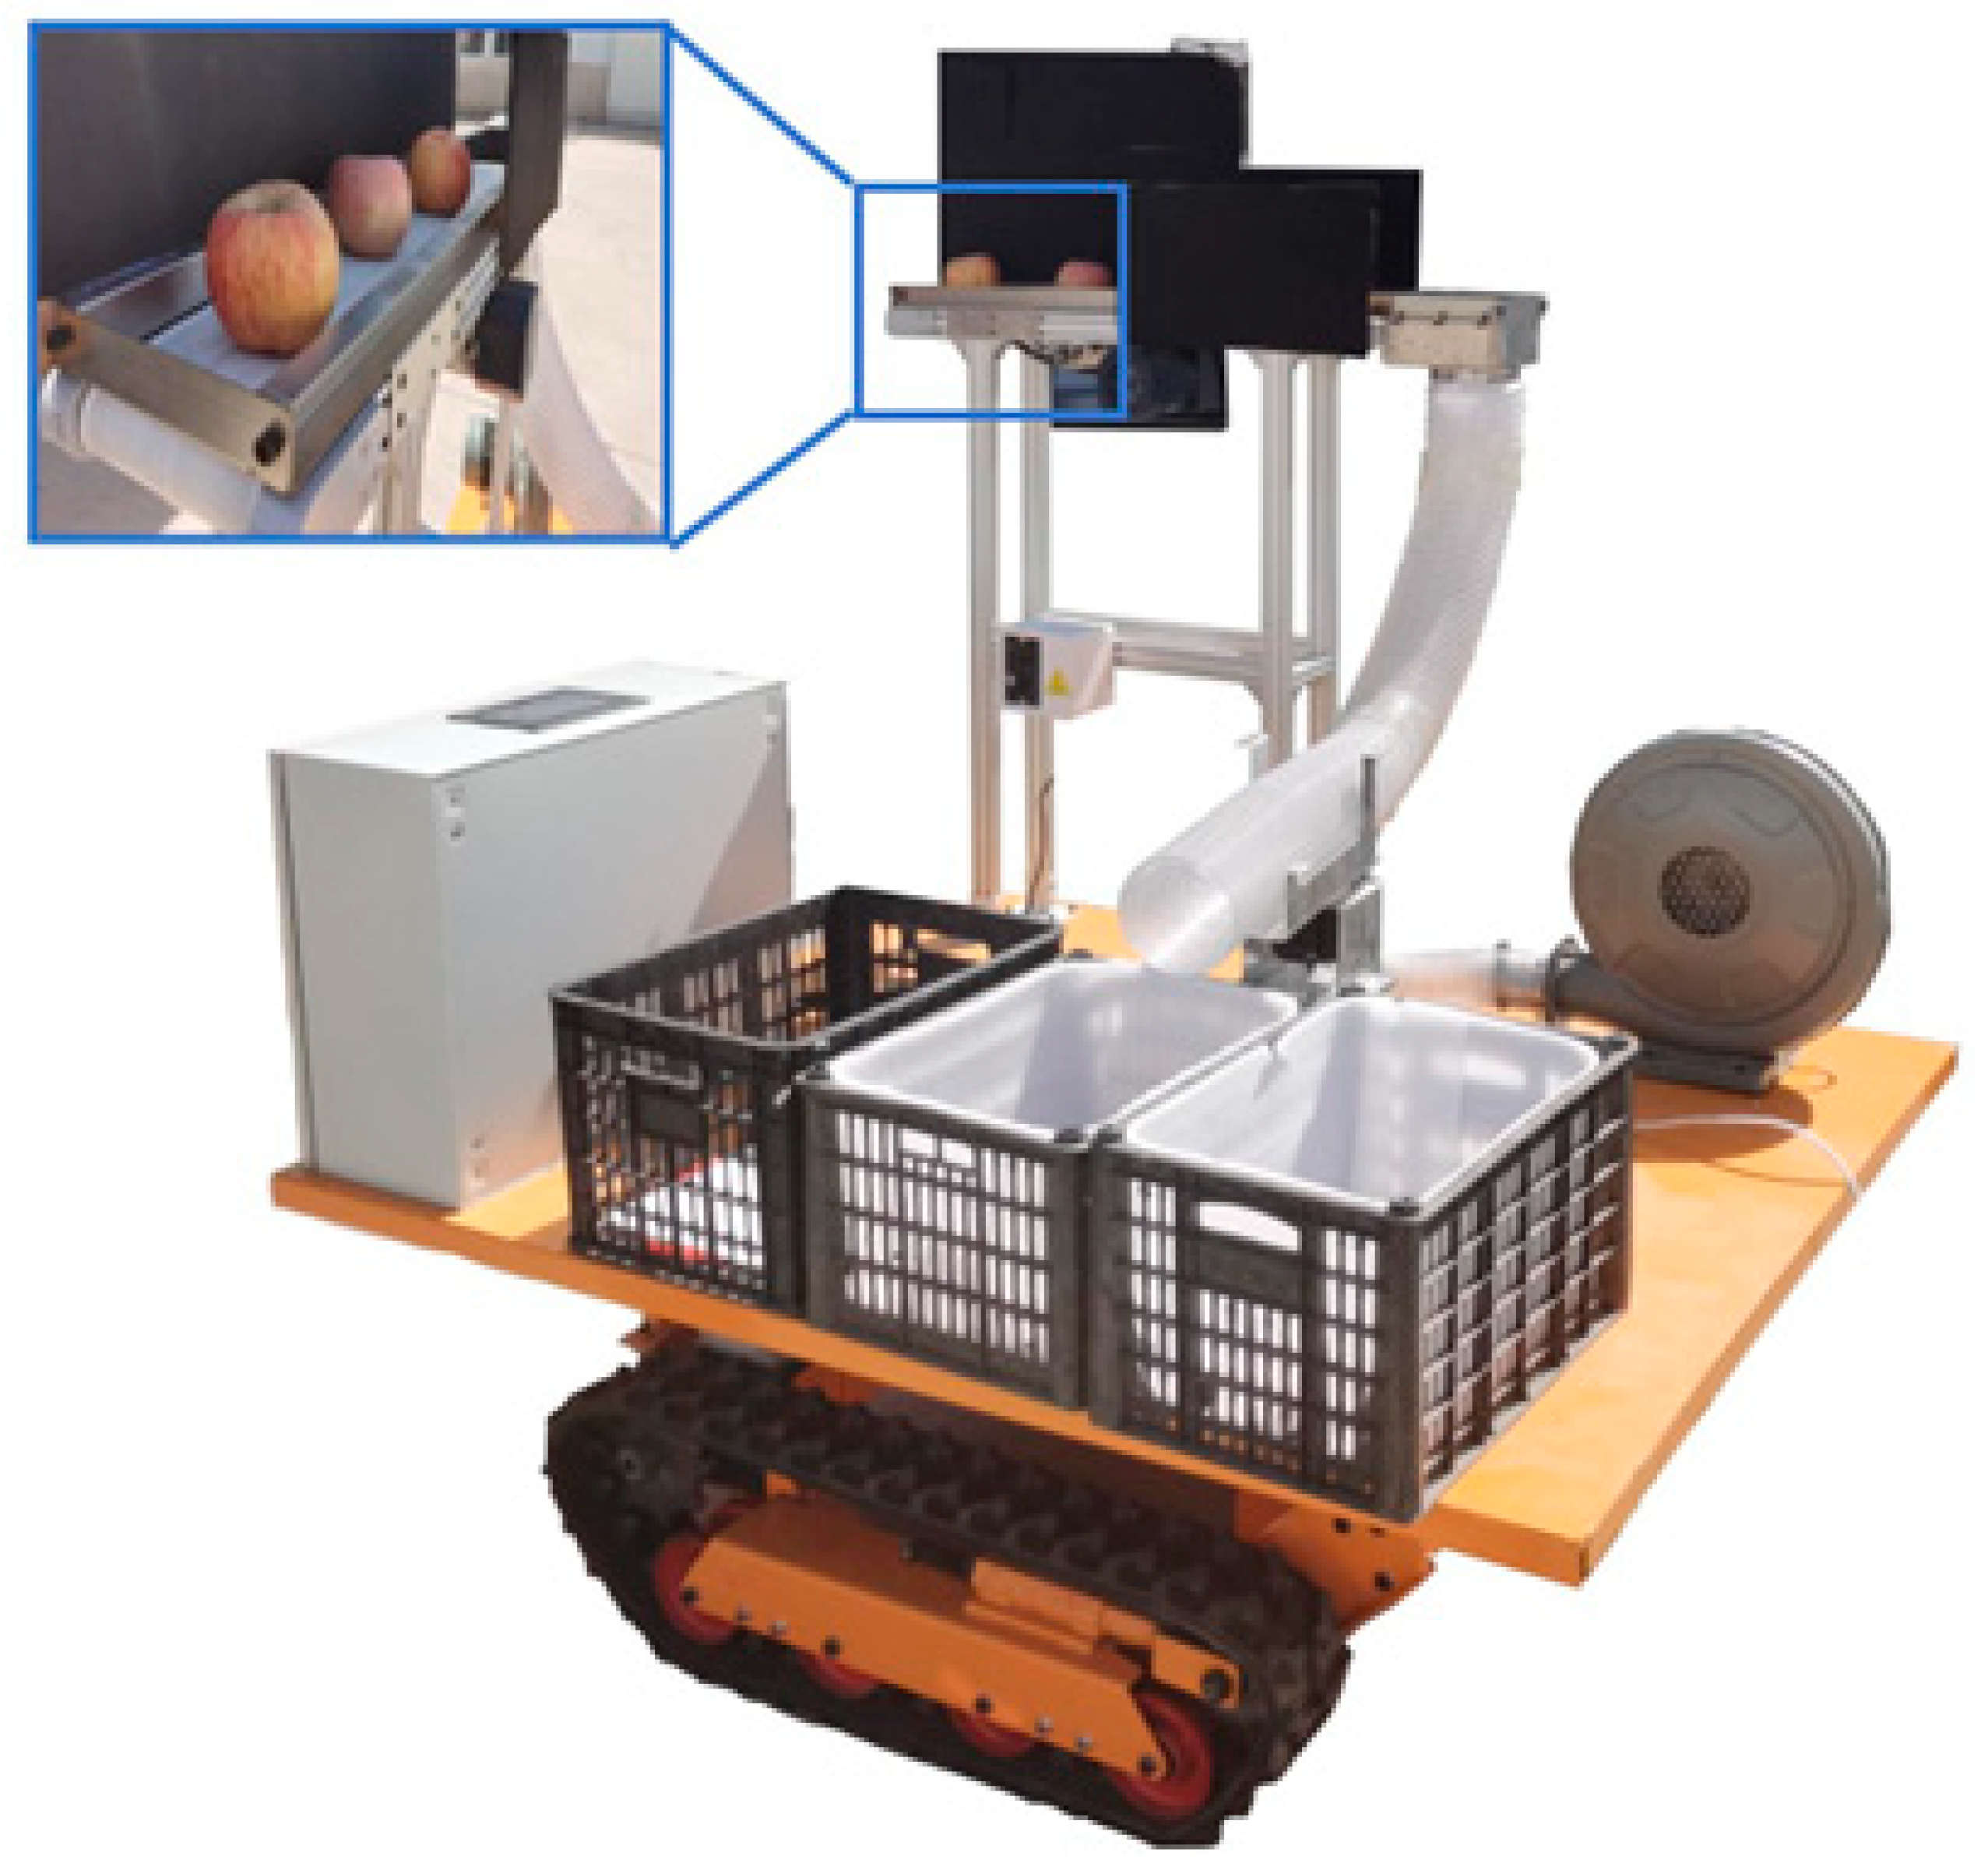
The apple postharvest loss-reduction conveying device is composed of a mobile chassis, a conveying and grading system, a loss-reduction conveying system, and an apple sorting system, as shown in
Figure 1. The conveying and grading system includes a horizontal conveyor belt, a fruit diameter detection chamber, and a computer. The loss-reduction conveying system consists of a conveying pipeline and a centrifugal fan. The apple sorting system comprises a sorting mechanism and fruit bins.
During operation, workers place harvested apples onto the horizontal conveyor belt. As apples pass through the fruit diameter detection chamber, a built-in camera captures images and transmits them to the grading system for real-time size measurement and grading [
27]. After processing these data, the system’s computer triggers two synchronized actions: adjusting the speed of the centrifugal fan via a frequency converter to generate buffer airflow specific to each grade, while simultaneously using a stepper motor controller to rotate the sorting gate and position it above the corresponding fruit bin. (The construction method and operation program of the detection chamber are detailed in the appendix. Shorter detection time and higher precision are preferable for apple diameter measurement, though this depends on technological development and will not be elaborated further here).
Apples fall into the conveying pipeline through the inlet port. Inside the pipeline, precisely controlled upward airflow slows their descent, minimizing impact damage. The apples exit the pipeline and drop into designated bins according to their size grades, completing the low-impact postharvest conveying cycle.
2.2. Technical Parameters
The key technical parameters of the apple postharvest loss-reduction conveying system are listed in
Table 1.
2.3. Design of the Loss-Reduction Conveying System
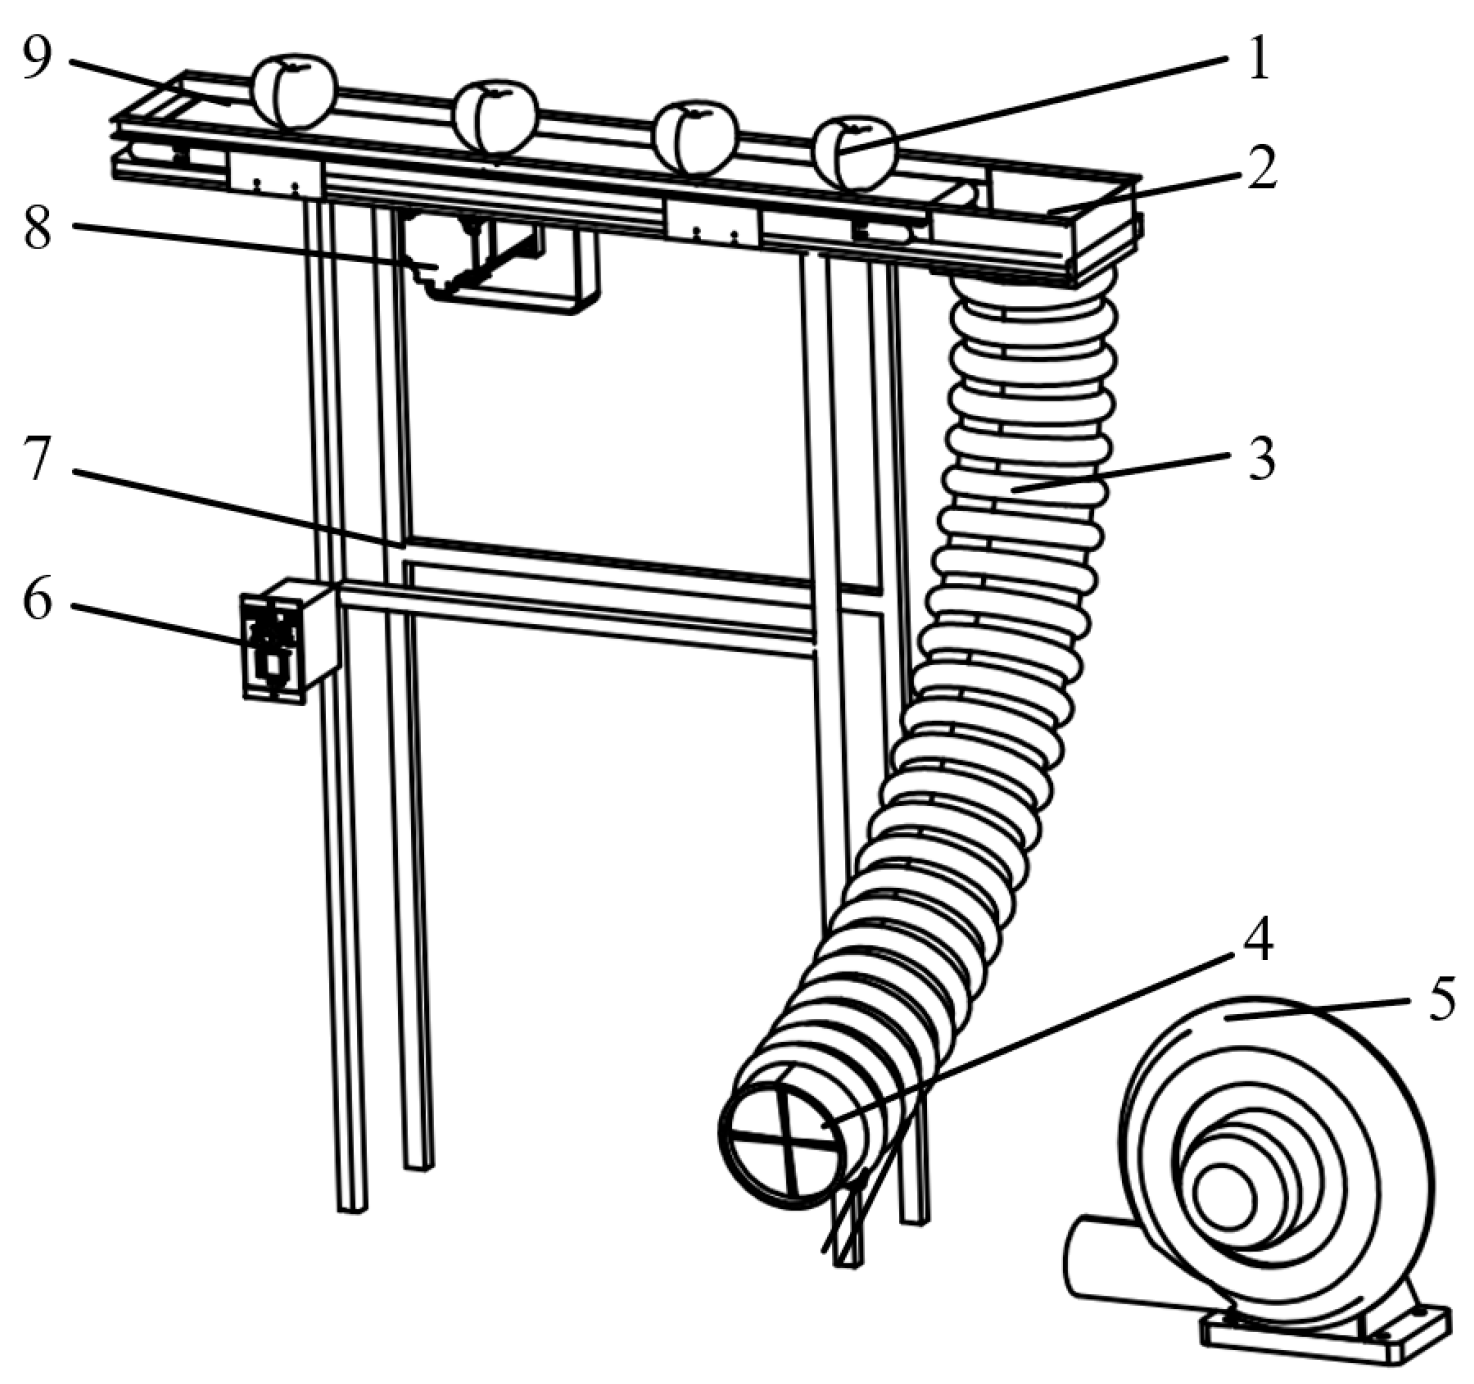
The loss-reduction conveying system serves as the primary component for testing the damage-minimizing transport functionality in this apparatus. Its horizontal conveyor belt and pipeline installation configuration are illustrated in
Figure 2. Regarding the apple transportation method using pipelines, the research team has previously investigated pipeline materials, inner diameters, and layout designs. Results demonstrated that a silicone rubber tube with a 5 mm-thick polyethylene foam liner, 112 mm inner diameter, and downward-curved configuration is optimal for apple conveyance [
28,
29,
30]. Building on these findings, this study will analyze the apple collision dynamics in the enhanced system incorporating horizontal belt conveyance and an integrated airflow cushioning mechanism within the pipeline.
2.4. Apple Motion Analytics
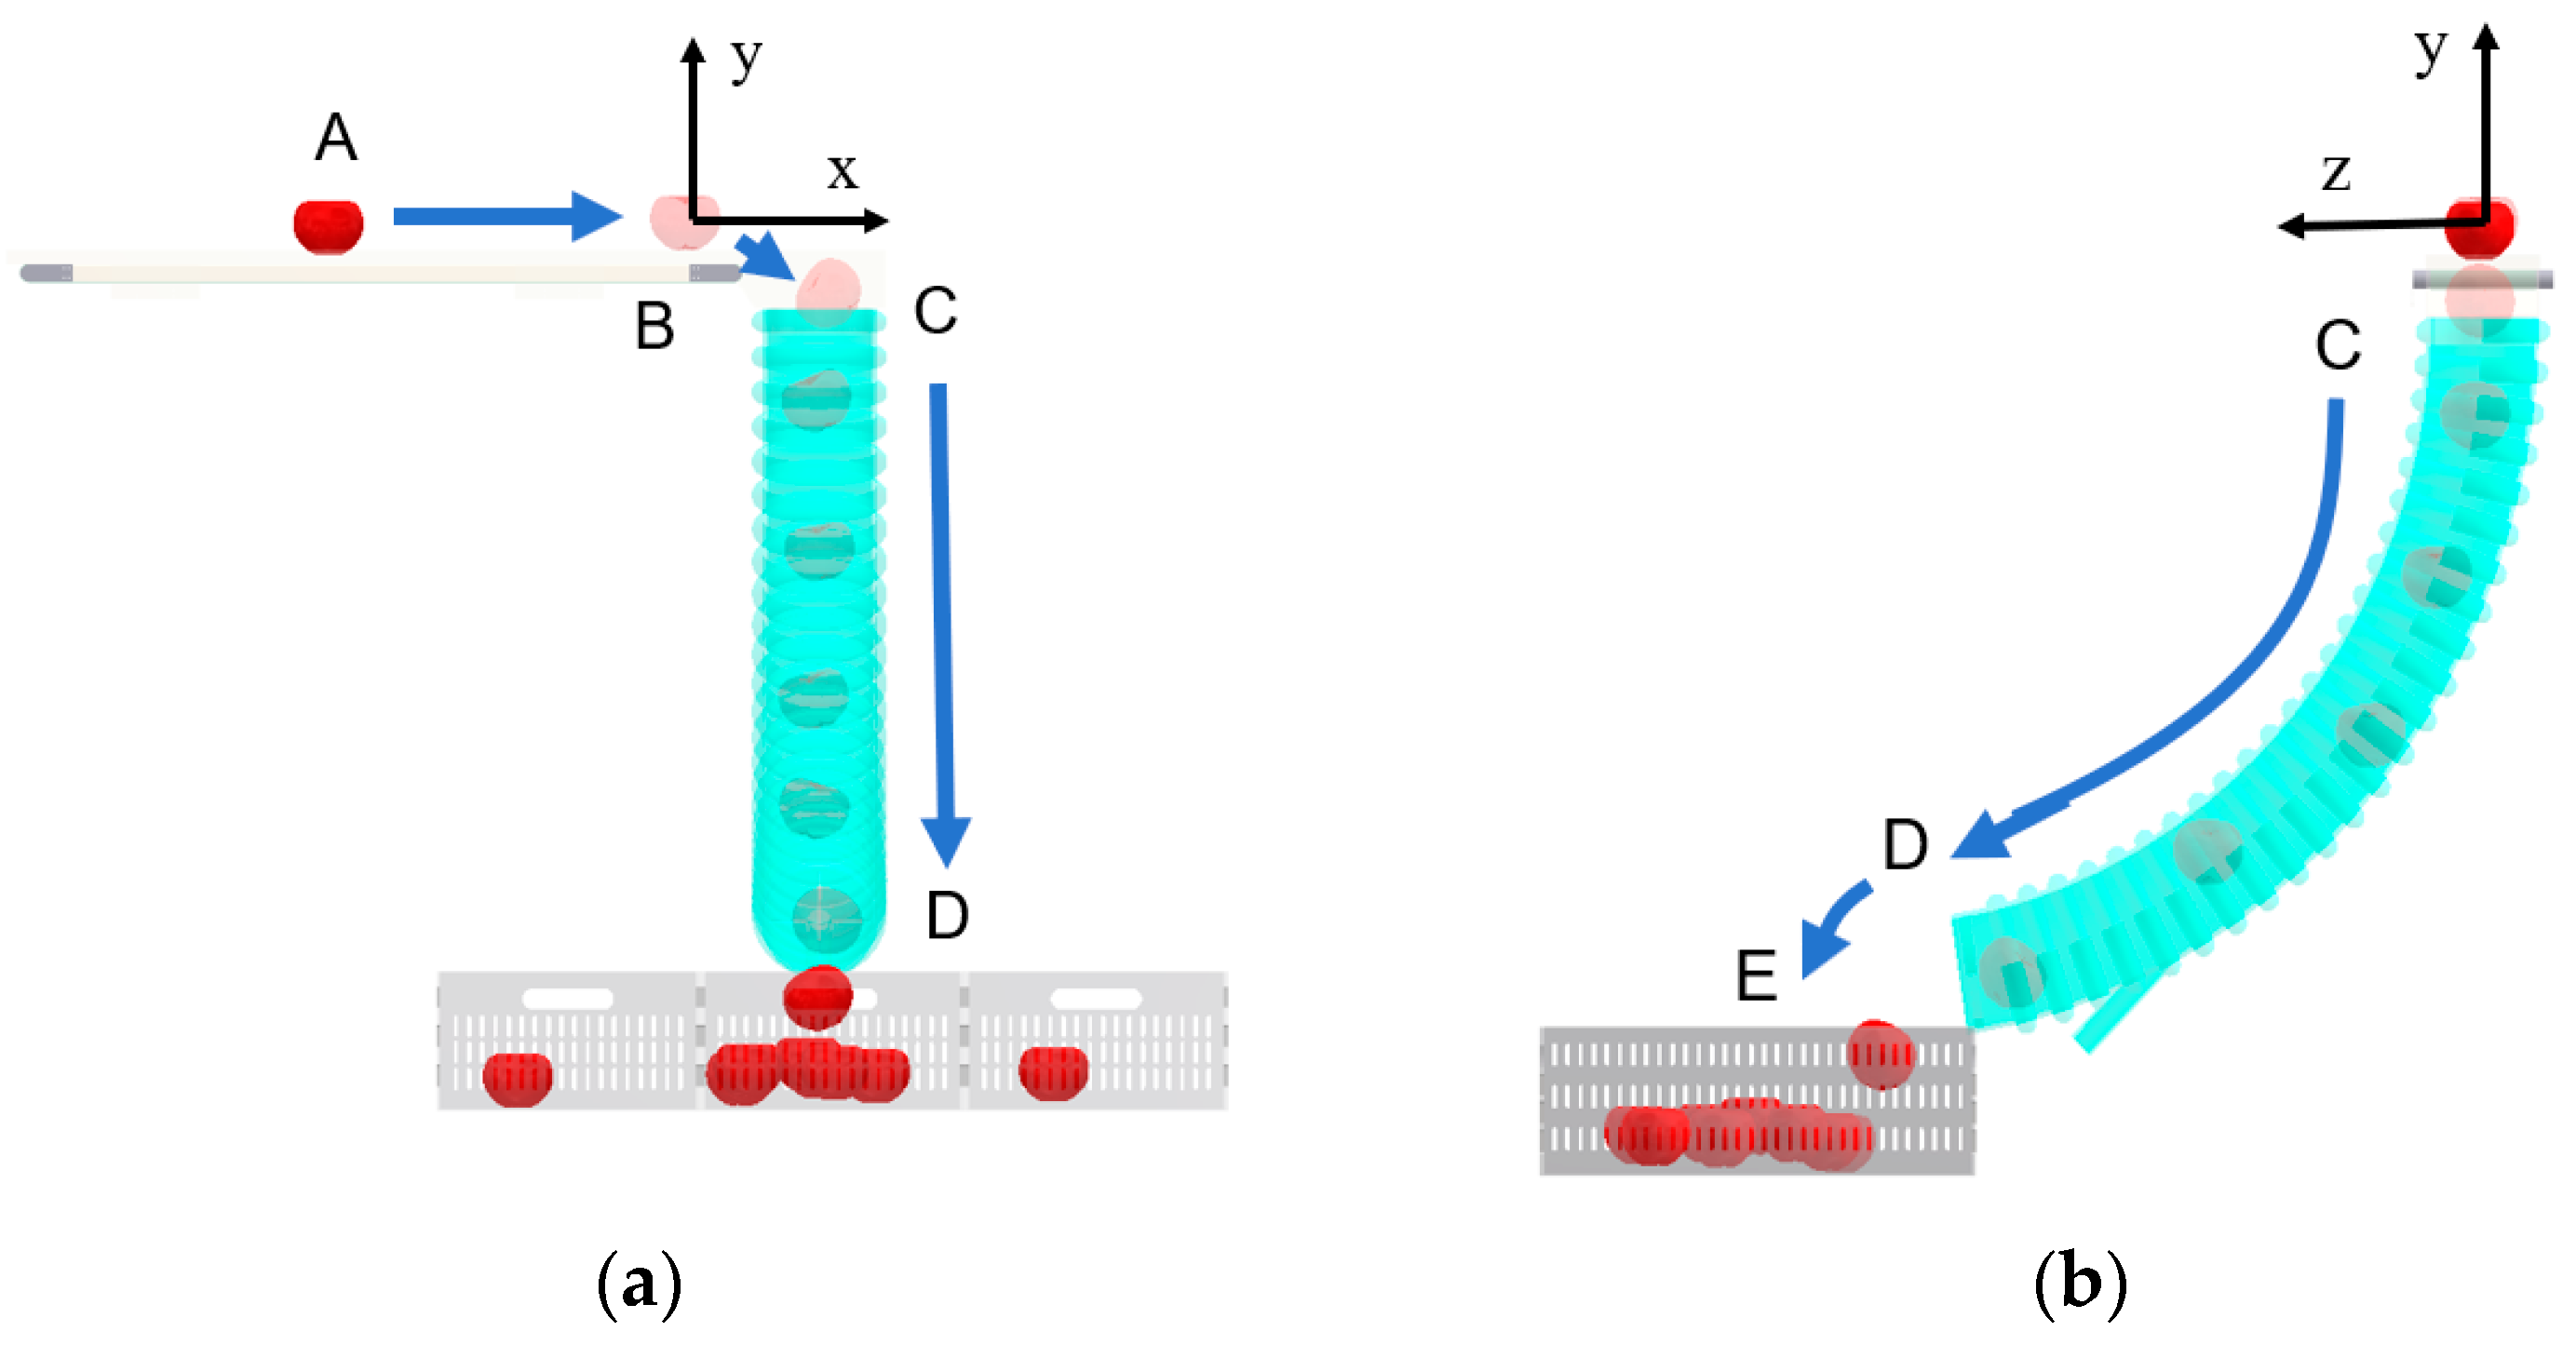
The motion trajectory of apples from the horizontal conveyor belt to the fruit bins is illustrated in
Figure 3, comprising four sequential phases:
Phase AB: postharvest apples are transported to the terminal end of the horizontal conveyor belt.
Phase BC: apples free-fall into the pipeline at an initial velocity, colliding with the pipeline wall.
Phase CD: post-collision apples descend through the pipeline, undergoing secondary collisions and rolling along the wall under airflow interactions.
Phase DE: apples are ejected from the pipeline outlet at a terminal velocity, landing in the fruit bins and triggering bin–apple and inter-apple collisions.
To address the computational complexity arising from in-pipeline dynamics (e.g., rebound deformation and short-range motion), apples are geometrically simplified as spherical bodies with equivalent diameters. Focusing on individual apple kinematics under harvesting conditions, this study analyzes three critical states:
Collision mechanics between apples and the pipeline wall.
Rolling behavior driven by airflow–wall interactions.
Ejection kinematics at the pipeline outlet.
2.5. Analysis of Collision Damage Factors During Apple Transportation
2.5.1. Apple Conveying Process Analysis
The force analysis during apple conveyance within the low-damage postharvest conveying system is illustrated in
Figure 4. The process is divided into three distinct phases: the OA phase, where apples collide with both the sidewalls and curved sections of the pipeline; the AB phase, representing controlled transport through the conveying pipeline under regulated airflow; and the BC phase, during which apples free-fall from the pipeline outlet into collection bins, accompanied by collisions between apples and bin surfaces, as well as inter-apple interactions.
The descent of an apple from the terminal end of the horizontal conveyor belt into the conveying pipeline follows projectile motion [
31]. A Cartesian coordinate system is established as follows:
Origin: centroid of the apple at the point of separation from the conveyor belt.
x-axis: direction of the conveyor belt linear velocity (positive orientation).
y-axis: direction of gravitational acceleration (positive downward).
The equations of motion for the OA phase are derived based on this coordinate framework.
vx—horizontal direction velocity of apple colliding with pipeline, m/s.
vy—apple and conveying pipe collision moment of vertical direction velocity, m/s.
hOA—apple from the end of the horizontal conveyor belt to the falling height of the collision with the conveyor pipe, m.
h1—the vertical height of the apple from the end of the horizontal conveyor belt to the position of collision with the conveyor pipe, m.
θ—angle between normal velocity van and horizontal velocity vx, (°).
The conveying pipeline absorbs the normal velocity-related kinetic energy during collision, reducing the apple’s velocity from vn to vn′ through inelastic interaction.
va—the speed of the apple in collision contact with the conveying pipe, m/s.
α—angle between the velocity va and the velocity of the apple in the horizontal direction, (°).
vat—separation speed of the apple after collision, m/s.
By combining Equations (1) and (2), we obtained the following:
For apples in the conveying pipeline, as shown in phase AB, the apple movement process must satisfy the law of conservation of energy, and the motion analysis process is the following:
ΔEBA—energy change in the movement of the apple from position A to position B, J.
Ef—energy lost by friction between the apple and the conveying pipe, J.
Eq—energy lost by the apple being hindered by the buffer airflow, J.
m—mass of apple, g.
vb—speed of the apple when it reaches the exit of the conveying pipe, m/s.
hAB—vertical displacement of the apple in the conveying pipe, mm.
The speed of the apple when it reaches the exit of the conveying pipe is the following:
For apples from the outlet of the conveying pipe with a speed of
to perform the projectile movement, the movement process is shown in the BC phase. The following is the equation of motion for the BC phase:
vcx—component of velocity in the horizontal direction, m/s.
vcy—component of velocity in the vertical direction, m/s.
φ—angle between velocity and , (°).
hBC—the vertical displacement of the apple from the outlet of the pipeline to contact with the fruit basket, mm.
Associated with the collision speed of apples with the fruit basket,
is the following:
2.5.2. Collision Damage Analysis of Apples in Fruit Bins
Apples entering fruit bins from the conveying pipeline outlet collide with either bin walls or pre-stacked apples at a specific velocity
vb, with collision intensity directly determining mechanical damage levels. To identify critical damage factors, computational analysis of maximum contact stress during collisions was performed [
32].
Figure 5 details the collision mechanics between apples within the fruit bin. As apple 2 remains stationary in the bin, the relative collision velocity between apples 1 and 2 equals the discharge velocity
vb of apple 1 from the pipeline outlet.
The falling impact action time of apples is short, the action area is very small, and the collision of the apples will occur in different degrees of plastic and brittle deformation. In order to simplify the analysis, the contact collision between apples is equivalent to the collision between a sphere and a sphere; based on the Hertz contact theory [
33], the contact stress
P1 and normal force
F when apple 1 collides into apple 2 are, respectively, the following:
Ed—modulus of elasticity of apple, MPa.
Rd—equivalent radius of the contact region of apple 1 and apple 2, mm.
δ—deformation of collision contact surface of apple 1 and apple 2, mm.
R1—radius of apple 1, mm.
R2—radius of apple 2, mm.
From Newton’s second law, the collision velocity of apple 1 and apple 2 after t time is the following:
Apple 1 satisfies the law of conservation of energy from the time it touches apple 2 to the time it leaves apple 2 after the collision.
md—equivalent mass of the two apples, kg.
U—potential energy of the elastic deformation of apple 1 after collision with apple 2, J.
The elastic potential energy of the collision process can be obtained by combining Equations (10) and (11).
When apple 1 collides with apple 2, the elastic potential energy of the collision is maximum when the collision velocity is reduced to 0. At this time, the deformation of apple 1 is maximum, and the maximum deformation
δmax after the collision of apple 1 and apple 2 calculated by the coupling Equations (10) and (12) is the following:
Bringing Equation (18) into Equation (14) gives the maximum contact stress
Pmax on the apple as follows:
Comprehensive analysis of apple movement within the damage-reducing conveyor system and collisions in the fruit basket reveals three primary collision types: those between apples and the inner wall of the conveying pipeline, between apples and the fruit baskets, and between apples themselves. Collisions with the conveying pipe are predominantly influenced by apple caliber and conveying speed. Post-collision impact location and velocity upon entering the fruit basket correlate with the ejection velocity at the pipeline outlet, while the buffer airflow inside the pipeline directly regulates the falling speed. Equations (13) and (14) indicate that the maximum contact stress and deformation upon deposition into the fruit basket are primarily determined by the apple’s elastic modulus, radius, and falling speed. Higher falling speeds and greater apple mass exacerbate collision damage, with falling speed itself being a function of conveying speed and buffer airflow. Therefore, horizontal conveyor belt speed, buffer airflow velocity, and apple caliber are the key factors governing collision stress, impact location, and resultant damage. Experimental validation was conducted using a postharvest apple damage-reducing conveyor testbed, with orthogonal experiments analyzing the effects of these factors on apple damage area and collision force.
2.6. Apple Grading
In this study, apple fruit diameter and damaged area were divided into grades according to relevant standards such as “Fresh Apples GB/T 10651-2008” [
34] and “Apple Grade Specification NY/T 1793-2009” [
35], as well as according to market demand. The determined grade standards are shown in
Table 2.
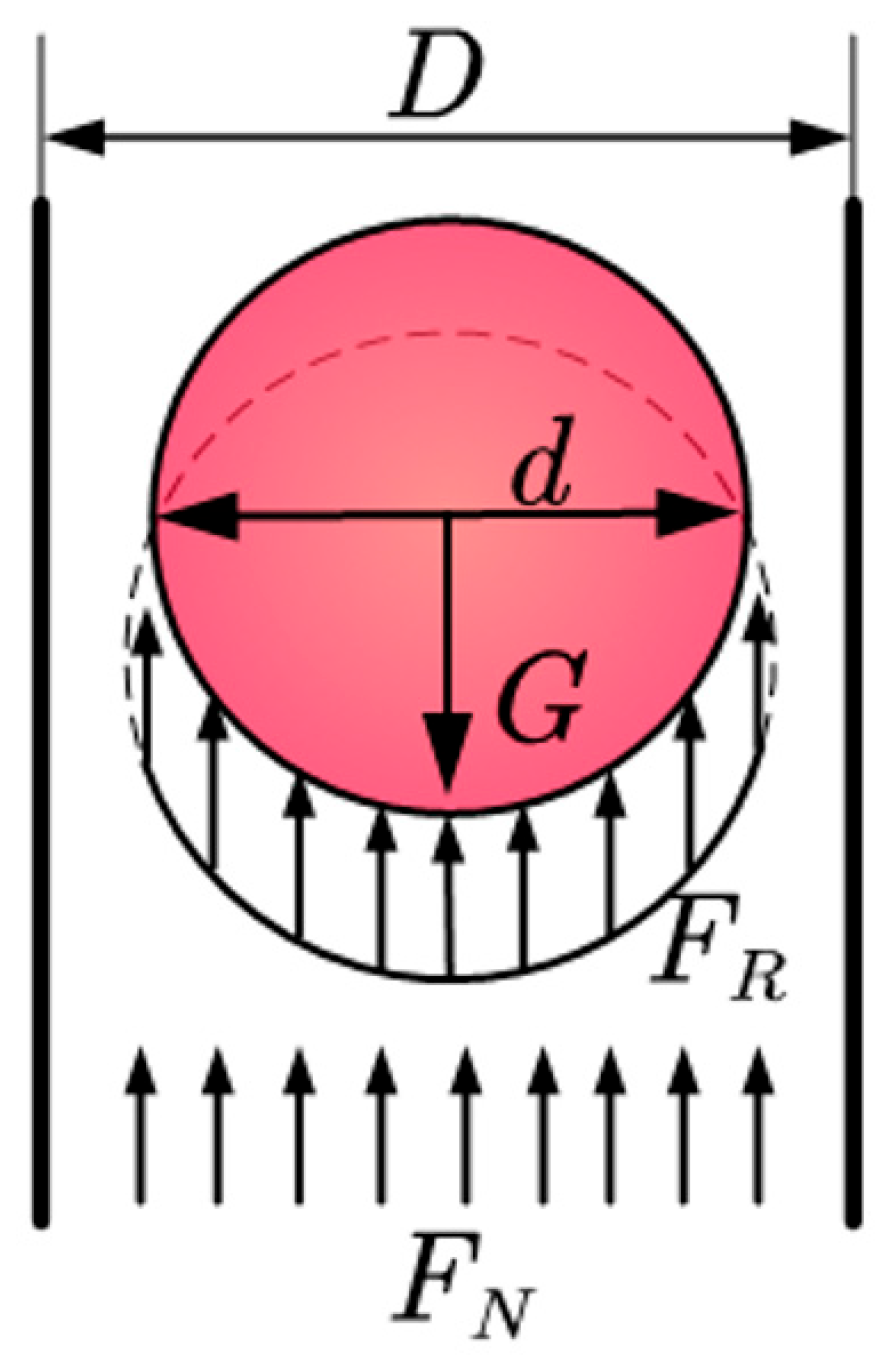
2.7. Determination of Buffer Airflow Velocity
The buffer airflow in the conveying pipe plays a role in slowing down the falling speed of apples. In order to determine the size of the airflow velocity in the inlet pipe of the conveying pipeline, the method of calculating the pneumatic conveying theory is used to study the force on the apples in the conveying pipeline [
36] and to determine the size of the levitation velocity, which in turn determines the speed of the buffer airflow. The force analysis of the apple inside the conveying pipe is shown in
Figure 6.
The air action resistance is the following:
The gravity of an apple is expressed as follows:
The apple equivalent diameter is the following:
The drag coefficient is the following:
FR—air action resistance, N.
C—resistance coefficient.
dd—apple equivalent diameter, mm.
Vx—suspension velocity of apples in the conveying pipe, m/s.
ρA—air density, kg/m3.
G—gravity of apples, N.
Ρ—apple density, kg/m3.
D—diameter of conveying pipe, mm.
m—mass of apple, g.
When the apple gravity G and the air resistance FR are equal, the apple is in levitation, and then the levitation speed is calculated as follows:
The calculated apple fruit diameter is 60–85 mm when the suspension velocity is 16.51 m/s–20.32 m/s, and from Equation (12) it can be seen that the airflow velocity of the apple in the conveying pipeline has a direct impact on the force. The study of apples under conveying pipeline suspension velocity is of great significance.
2.8. Horizontal Conveyor Belt Line Speed Determination
The conveying length and line speed of the horizontal conveyor belt are determined by the apple fruit diameter detection time and the falling time of apples through the conveying pipe. From the fruit diameter detection system, it can be seen that the apple fruit diameter detection time is within 1 s, so its effect on the horizontal transportation of fruit can be ignored.
If the apples are transported faster on the horizontal conveyor belt, resulting in a number of apples falling into the conveying pipeline, this will lead to collision between the apples in the pipeline, and the sorting device swing head cannot accurately place the apples into their corresponding fruit baskets based on fruit diameter; in order to ensure that the apple conveying pipeline takes the same amount of time each time, there is only one apple conveyor, i.e., the time for apples to move from the end of the horizontal conveyor belt to the mouth of the fruit drop
is not less than the time it takes apples from entering the conveying pipeline to falling into the fruit baskets
. In actual harvesting operations, the average picking speed during apple picking, including stalk shearing, bending and releasing the fruit, and other processes, by picking personnel is 7 s, of which stalk shearing is an average of 3 s, and bending and releasing the fruit is 4 s. The horizontal conveyor belt is meant to be an artificial replacement for the bending and releasing process when picking fruit, in order to ensure efficiency when harvesting, and the time ts using the horizontal conveyor should be no greater than the time
bending and releasing the fruit, which should satisfy Equation (20):
The association yields a range of linear velocities for the horizontal conveyor belt:
—the placement interval of the apples, mm.
L—length of horizontal conveyor belt, mm.
t1—apples from the end of the horizontal conveyor belt to the time of falling fruit, s.
v—linear speed of horizontal conveyor belt, m/min.
t2—time the apples from entering the conveyor pipe to falling into the fruit basket, s.
t3—the time taken for bending over and placing the apple, s.
The falling time of apples in the conveying pipeline under different buffer airflow speeds is shown in
Table 3, and the longest falling time of apples is 0.53 s under the maximum buffer airflow speed of 20 m/s. Considering the size limitation of the traveling platform, the length of the horizontal conveyor belt is 800 mm, and the calculated linear speed of the horizontal conveyor belt ranges from 11.37 to 15.1 m/min.
3. Results and Analysis
3.1. Experimental Materials and Design
3.1.1. Materials and Equipment
The test materials were Fuji apples picked from the dwarf anvil and densely planted apple orchard in Shunping County, Baoding City, Hebei Province; the test equipment included a postharvest loss-reducing conveyor test bench, as shown in
Figure 7; Z2200 frequency converter (Shanghai Zongchen Electronic Science and Technology Co., Shanghai, China); model digital anemometer (Source Instrument and Equipment Co., Ltd., Shenzhen, China); DL91150 digital display vernier calipers, Deli flagship store, range 0–20 mm, precision 0.02 mm; GY-1 type fruit hardness tester, range 0–15 N/cm
2, precision 0.1 N/cm
2; CF-200 Liangheng digital electronic scales, (Guangzhou Measurement and Scale Electronics Manufacturing Co., Ltd., Guangzhou, China), range 0–5000 g, precision 0.1 g; resistive thin-film pressure sensor, range 50–2000 g, precision 0.1 g.
3.1.2. Experimental Design
- (1)
Determination of critical destructive force of fruit
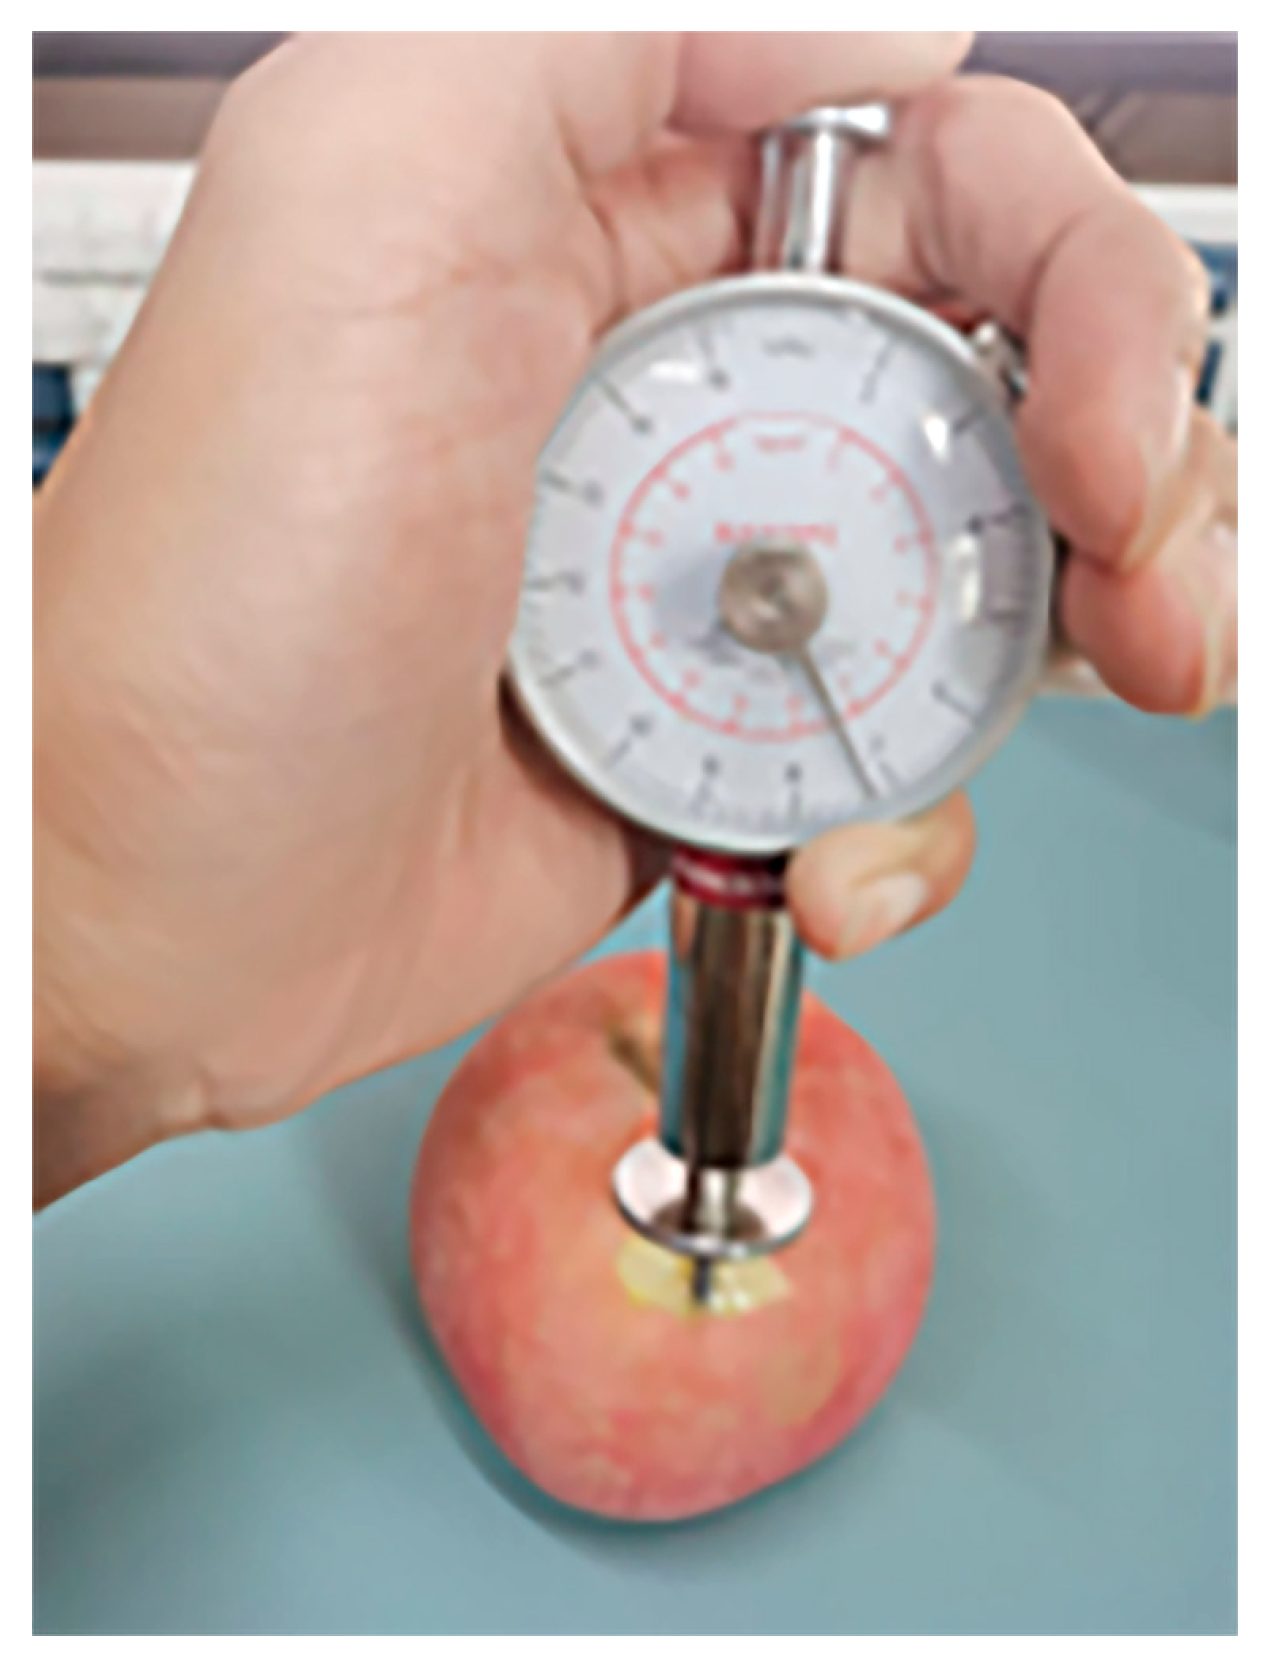
The testing location was Laboratory 331 of Hebei Agricultural University. The GY-3 durometer was selected as the testing equipment. Refer to GB/T 10651-2008 [
34] “Fresh Apples” for the calibration of apple hardness. Apple hardness refers to the pressure that can be borne per unit area of the fruit surface, and it is the resistance of the pulp when under pressure, which is used to determine whether the apples entering the fruit basket are damaged. Due to the influence of environmental conditions such as light and moisture, the pectin distribution inside the apples was uneven, resulting in differences in the hardness of different parts of the same apple. Also, since the apples needed to be peeled for measurement to avoid the test results affecting each other, they were divided into three groups to separately test the top, shoulder, and middle parts of the apples. Uniform-sized, undamaged, and intact Fuji apples were selected as the testing materials. In total, 120 apples were divided into three groups, namely Group A, Group B, and Group C, with 40 apples in each group. Group A measures the corresponding hardness data of the top part, Group B measures the corresponding hardness data of the shoulder part, and Group C measures the corresponding hardness data of the middle part. After the measurement was completed, the average value of the hardness data measured by each group was taken. A demonstration of the apple hardness test is shown in
Figure 8.
The calculation formula for the hardness of apples is as follows:
According to the measurement results of the durometer, equivalent conversion is performed (keeping one decimal place for the results), and an indenter is used with a diameter of 3 mm to obtain the yield stress of the apple. The analysis of the test data shows that, under roughly the same growing environment, the hardness of apples of the same variety varies at different parts. The hardness of the top and the shoulder is similar and greater than that of the middle part. The highest yield stress in the measurement results is 39.2 N, and the lowest yield stress is 27.3 N. Also, since the middle part of the apple accounts for a large proportion of the apple’s surface area, 27.3 N is calibrated as the limit value of the apple’s stress damage.
- (2)
Response surface experimental design
The apple damage-reducing conveyor test adopted a three-factor, three-level Box–Behnken experimental design. In this study, the test factors were apple fruit diameter grade, horizontal conveyor belt linear speed, and buffer airflow velocity, with the test indices being the damage area and collision force of apples after conveying in the damage-reducing device. The horizontal conveyor belt linear speed ranged from 11 to 15 m per minute (m/min), the buffer airflow velocity from 16 to 20 m per second (m/s), and the apple fruit diameter from 60 to 85 millimeters (mm). The conveyor belt speed was controlled by adjusting an electronic voltage governor while the centrifugal fan’s airflow velocity was regulated by adjusting the fan frequency via a frequency converter. The apple fruit diameter grading standards defined fruit diameter ≤60 mm as third grade, 60–75 mm as second grade, and ≥75 mm as first grade. For each test group, 10 apples were selected, their mean values were calculated, and a total of 17 test groups were conducted involving 170 apples in total. After the tests, apple damage was measured. Based on the significance analysis of the test factors and parameter optimization of the device, the optimal parameter combinations corresponding to the three apple grades were finally obtained. The coding table for experimental factor levels is shown in
Table 4.
The purpose of the apple postharvest damage-reducing conveyor device is to reduce the mechanical damage caused by collision and friction during the harvesting process. This study takes the damage area of apples falling into the fruit basket as the test index and analyzes the comprehensive performance of the device according to the size of the damage area on the apples. After the apples fall into the fruit basket from the conveying device, the apples will have different degrees of damage, and the conveyed apples will be stored at room temperature for 48 h; after the color of the broken tissue of the apples is browned, the skin of the broken place will be removed to reveal the flesh at the damaged place, and vernier calipers will be used to measure the surface long axis of the damage and the surface short axis of the damage of the apples (
Figure 9). The test samples were ripe apples with a diameter of 60~85 mm. The test samples were mature apples between 60 and 85 mm in diameter, and the number of samples was 85. According to Equation (22), the area of apple damage was calculated.
The damage area is calculated by the following formula:
Ss—apple damage area, mm2.
b1—short axis of apple damage surface, mm.
b2—long axis of apple damage surface, mm.
Apples fall into the fruit basket after transportation through the pipeline, where they will impact the bottom of the basket, the side of the basket, and collide with other apples. The intensity of the collision affects the degree of damage to the apples, so the collision force of the apples falling into the basket was used as a test index.
The apples exited the pipeline into the fruit basket and landed on the film pressure sensor, pressurizing the film pressure sensor sensing area. The bottom layers of the line are separated from each other by conduction, and the output resistance of the metal port results from the corresponding changes in pressure, which are indicated on a small board to show the amount of pressure. Thin-film pressure sensors were used to determine the collision force of apples falling into the basket, and pressure sensors were affixed to the bottom of the basket and the back of the basket wall and pasted on the surface of the apples to read the value measured by the sensor and record the maximum value. The test samples were ripe apples with a fruit diameter between 60 and 85 mm, the number of samples was 85, and each group of tests was repeated five times. The location of the pressure sensors is shown in
Figure 10.
3.2. Regression Modeling and Validation
Design-Expert12.0 software was used to design a three-factor, three-level response surface test based on the principles of Box–Behnken experimental design. This test contains 17 groups of tests, and the specific test scheme and test results are shown in
Table 5. In the experiment, regression equations were established among the coded levels of apple size grade, horizontal conveyor speed, and buffer airflow velocity, as well as the evaluation indices of apple damage area and apple impact force, followed by a significance analysis.
3.2.1. Analysis of Variance for Apple Damage Area
Multiple regression analysis was performed using Design-Expert 12.0 test software, and the regression equations of each factor on apple damage area were obtained after presenting the insignificant terms.
Based on the analysis of the regression model’s analysis of variance table in
Figure 11 and
Table 6, the factors’ influences on the apple damage area, ranked from high to low, are as follows: the linear speed of the horizontal conveyor belt (
X2), the apple fruit diameter class (
X1), and the buffer airflow velocity (
X3). The
p-value of the response surface model for the apple damage area is less than 0.01, indicating that the regression model is highly significant. The lack-of-fit term is not significant, suggesting that the regression equation has a high degree of goodness of it. Therefore, the regression model has high reliability. The coefficient of determination
R2 is 0.9833, indicating good accuracy and adequacy. The linear terms (
X1, X2, X3) and the quadratic term (
X32) have a highly significant influence on the apple damage area. The interaction terms (
X1X2,
X1X3) and the quadratic term (
X22) have a significant influence on the apple damage area.
3.2.2. Analysis of Variance for Collision Force
A multiple regression analysis was conducted on the response value of the collision force to obtain the regression equation for the influence of each factor on the apple damage area.
Based on the analysis of the regression model’s analysis of variance in
Table 7, the
p-values of each factor and their influences on the apple collision force are as follows, ranked from high to low: buffer airflow velocity (
X3), apple fruit diameter class (
X1), and horizontal conveyor belt linear speed (
X2). The response surface model for apple collision force has a
p-value less than 0.01, indicating that the regression model is highly significant. The lack-of-fit term is not significant, meaning the regression model can be used to replace actual experimental results for analysis. The coefficient of determination (R
2) is 0.9975, demonstrating good accuracy and adequacy. The linear terms (
X1,
X2,
X3), quadratic terms (
X12,
X32), and interaction terms (
X1X2,
X1X3) have a highly significant influence on the apple collision force.
3.3. Analysis of Response Surface Test Results
3.3.1. Response Surface Analysis of Apple Damage Area
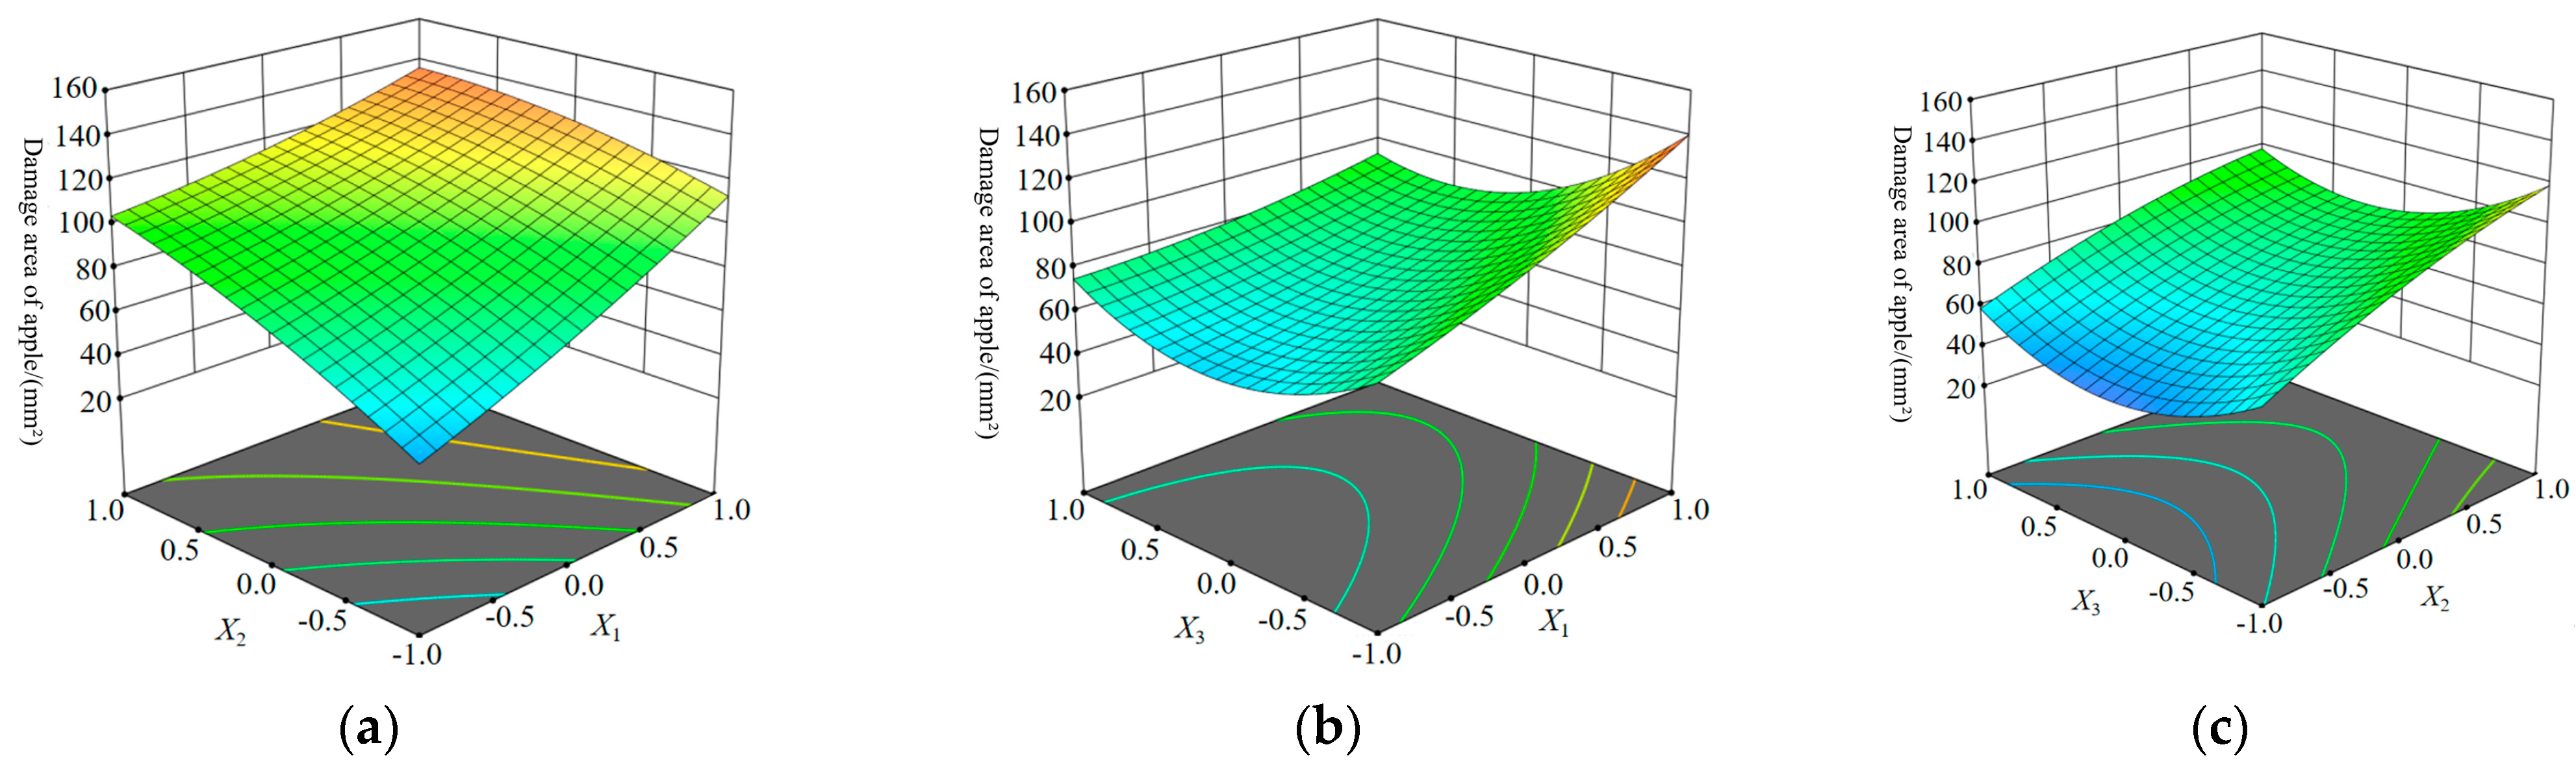
Based on the regression model, a response surface model was developed to characterize the relationship between apple fruit diameter class, horizontal conveyor belt linear speed, buffer airflow velocity, and apple damage area.
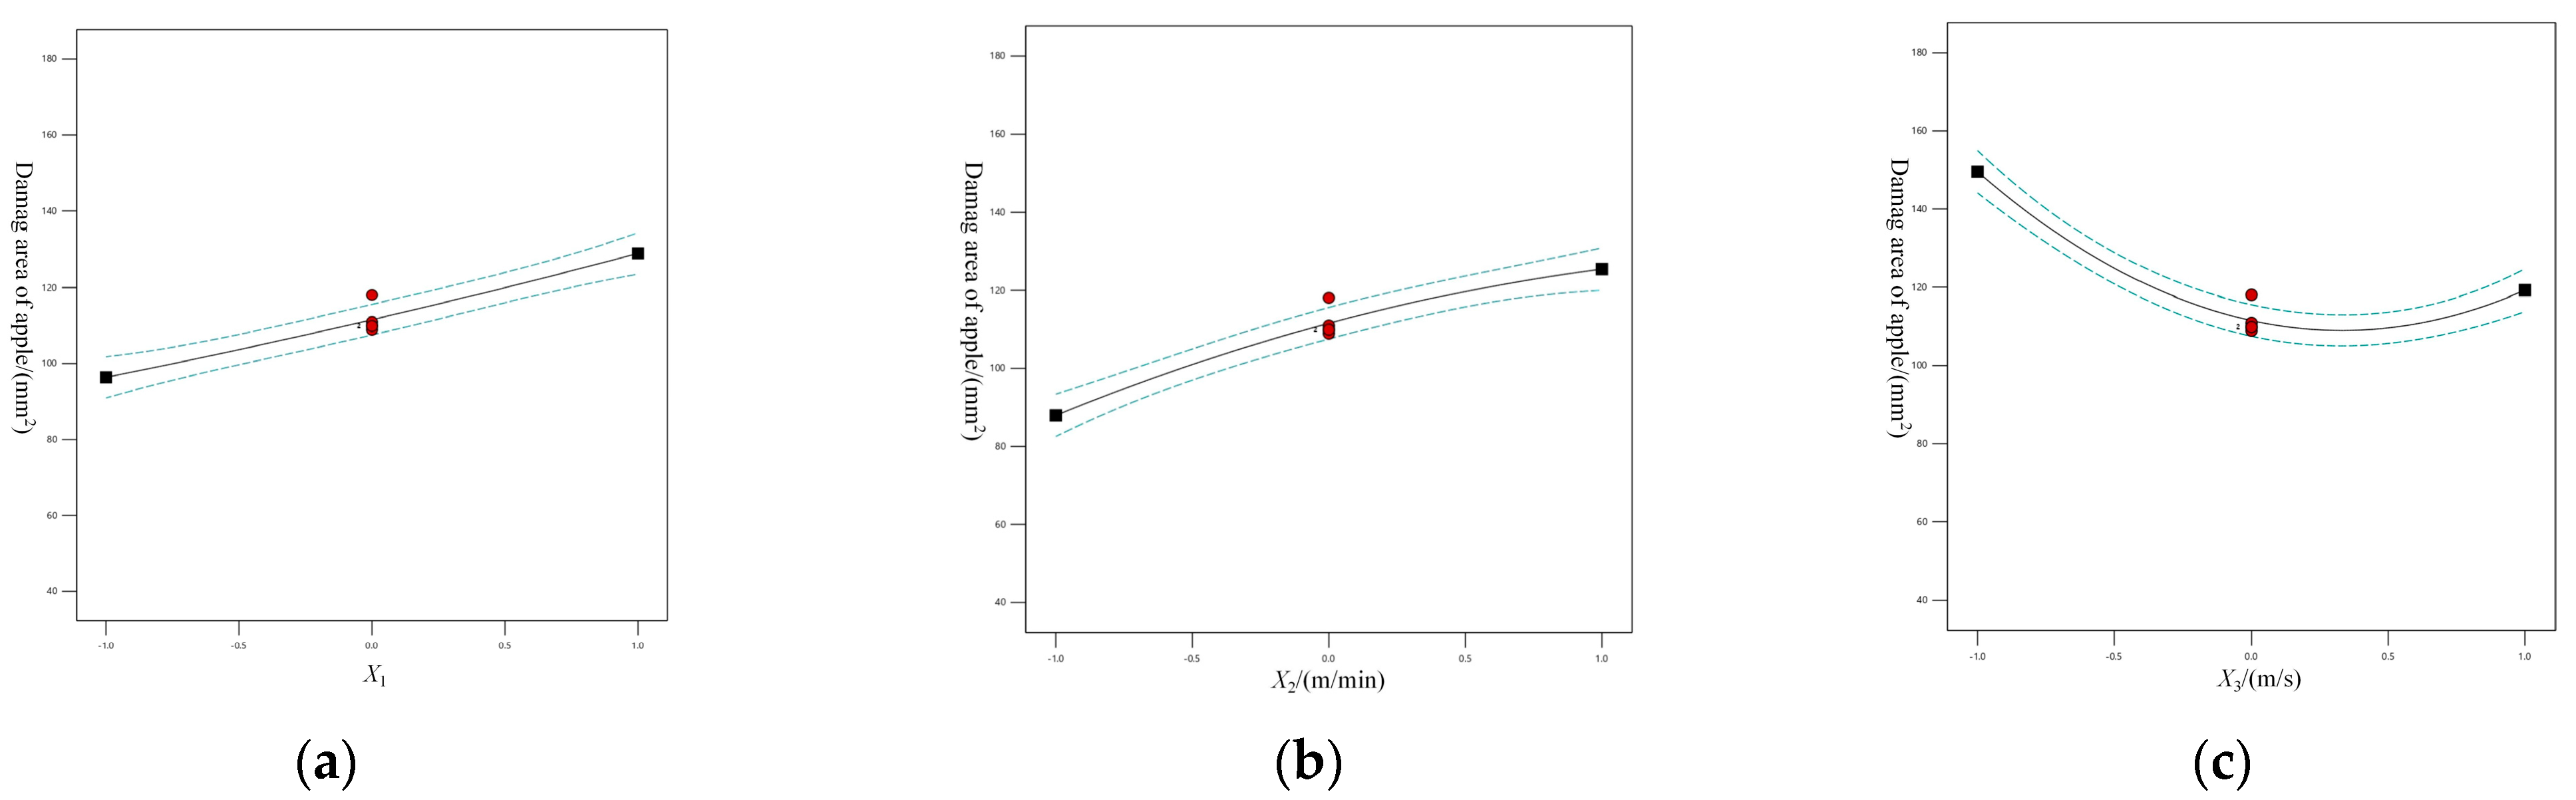
As the apple fruit diameter class and horizontal conveyor belt linear speed increase, the apple damage area gradually expands, as shown in
Figure 12a. The primary reason is that the collision force when apples impact the damage-reducing conveyor device is primarily determined by the initial collision velocity and apple mass. Therefore, moderately reducing the horizontal conveyor belt linear speed can help minimize the apple damage area. When the buffer airflow velocity increases, the apple damage area exhibits a trend of first decreasing and then increasing, as illustrated in
Figure 12b. The key reason is that excessively high buffer airflow speeds cause apples to move irregularly within the pipeline, increasing the frequency of collisions between apples and the pipeline walls and exacerbating damage. When the buffer airflow velocity is held constant, the apple damage area increases gradually with the increase in horizontal conveyor belt linear speed. Conversely, when the horizontal conveyor belt linear speed is unchanged, the apple damage area first decreases and then increases as the buffer airflow velocity rises, as depicted in
Figure 12c.
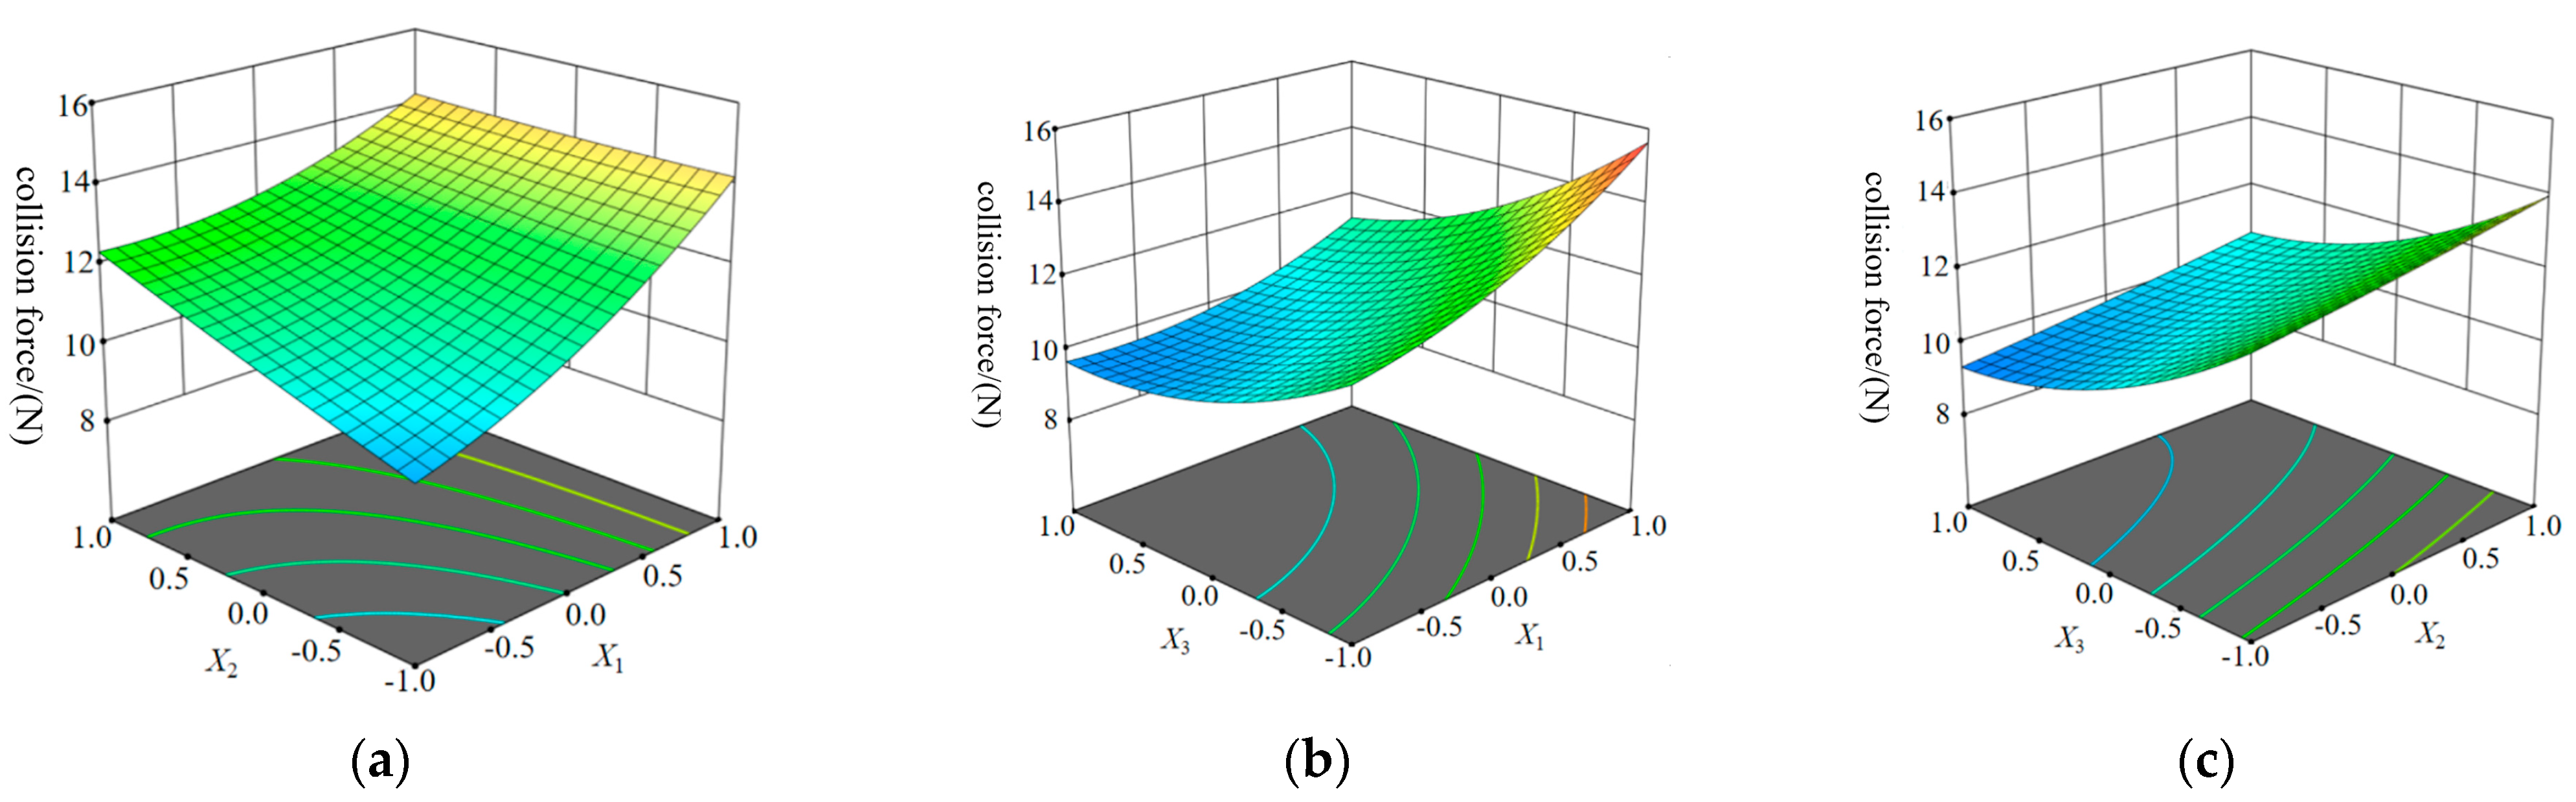
3.3.2. Response Surface Analysis of Apple Collision Forces
When the apple fruit diameter grade and horizontal conveyor belt linear velocity increases, the apple collision force gradually increases, as shown in
Figure 13a. When the buffer airflow velocity increases, the apple collision force gradually increases or decreases a small amount, the main reason being that the increase in the buffer airflow reduces the initial velocity of the apple thrown from the mouth of the tube, which reduces the collision force of the apple, as shown in
Figure 13b. With the increase in the horizontal conveyor belt linear velocity, the collision force of the apple gradually decreases, and with the increase in the buffer air velocity, the collision force of the apple gradually increases, as shown in
Figure 13c.
3.4. Optimization of Test Parameters
After the completion of conveying, the apple damage area and the collision force of apples are two indicators that need to be as small as possible. Design-Expert 12.0’s optimization solving function was used to obtain the optimal combination of picking parameters for apples of different fruit size grades in the postharvest damage-reducing conveyor device, with achieving the minimum values of the apple damage area and the collision force of the apples falling into the fruit basket being the optimization objective. The optimization objective function and constraints are as follows:
Through the optimization calculation, the optimal parameter combination is obtained: when the apples were third-grade fruits, the horizontal conveyor belt line speed was 11 m/min, the buffer airflow velocity was 18.2 m/s, the damage area of the apple under this combination was 34.24 mm2, and the collision force of the apple was 8.7 N; when the apples were second-grade fruits, the horizontal conveyor belt line speed was 11 m/min, the buffer airflow velocity was 19.01 m/s, the damage area of the apple under this combination was 55.88 mm2, and the collision force of the apple was 9.56 N. When the apples were first-grade fruits, the horizontal conveyor belt linear speed was 11 m/min, the buffer airflow velocity was 19.3 m/s, the damage area of apples under this combination was 67.01 mm2, and the collision force of apples was 10.34 N.
3.5. Field Experiment Validation
To validate the accuracy of the optimized parameters, field experiments were conducted in a dwarf rootstock high-density apple orchard (38°84′ N, 115°32′ E) located in Shunping County, Baoding City, Hebei Province, China, using the postharvest loss-reduction conveyor device with optimized settings. This region is a major apple production area in China’s North China Plain, characterized by its suitability for mechanized operations and uniform fruit maturity due to the dwarf rootstock planting system (planting spacing: 1.2 × 3.5 m). Environmental parameters were monitored throughout the trial, with daytime average temperature maintained at 23 ± 1.5 °C, relative humidity at 47 ± 3%, and airflow velocity ranging from 0.8 to 1.2 m/s, all complying with the environmental requirements specified in NY/T 1086-2006 [
37] environmental requirements for mechanical operations in fruit harvesting for apple harvesting.
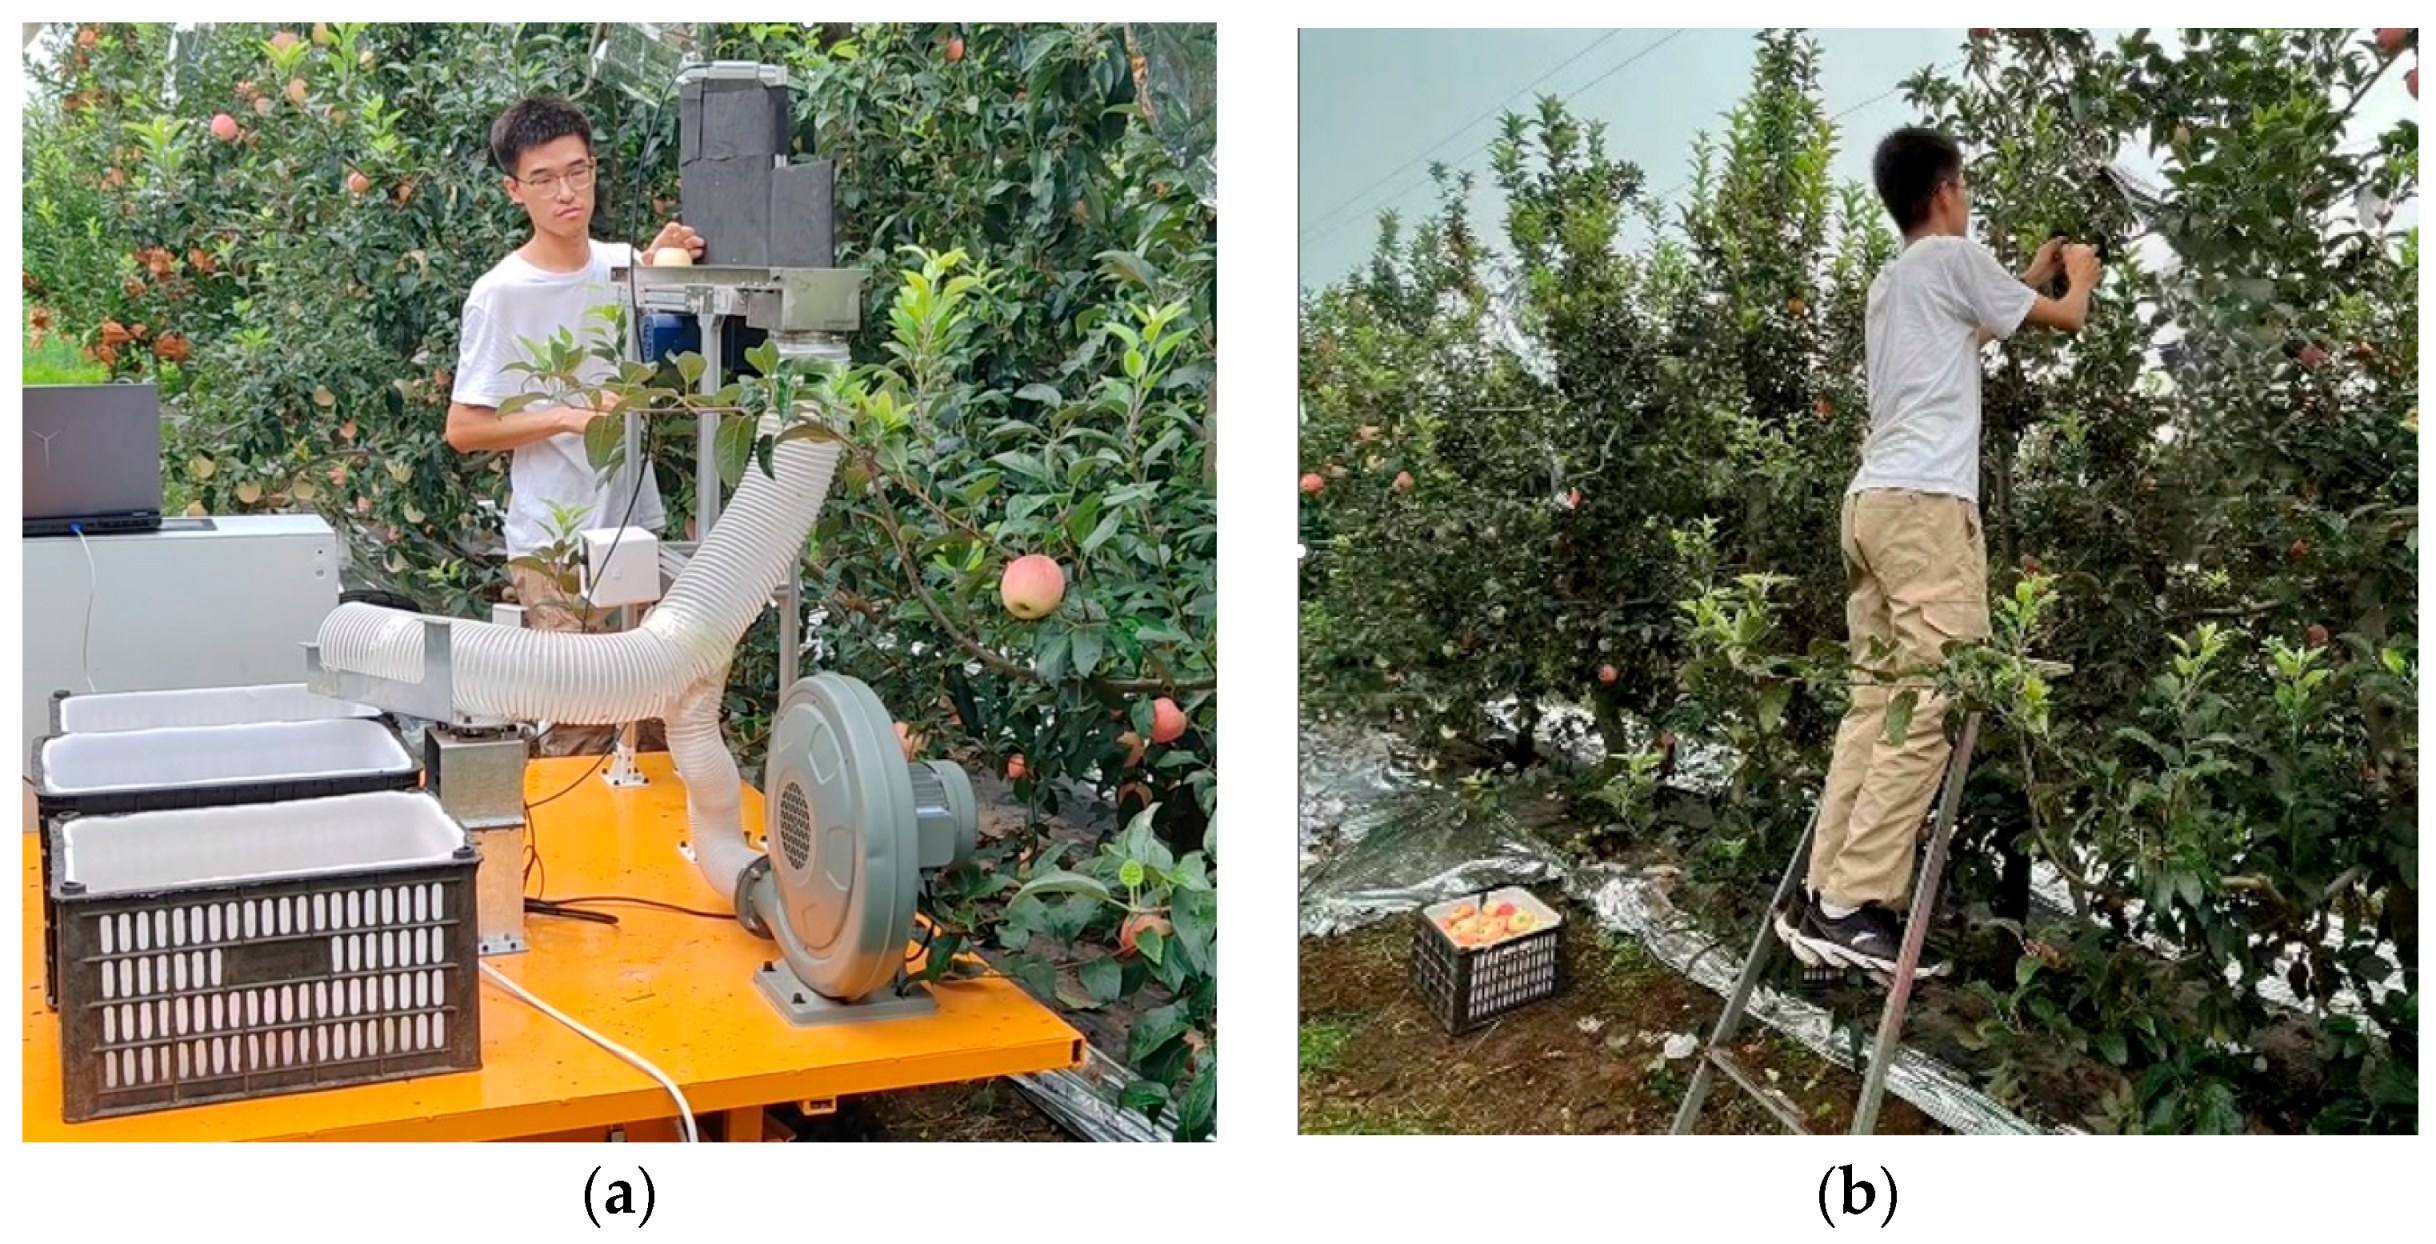
The experimental area is composed of 10 consecutive planting units, with each unit housing 15 apple trees. These trees have an average height of 2.8 ± 0.3 m and a trunk diameter of 45 ± 5 mm. The harvesting operation was carried out using a manually controlled mobile platform equipped with an apple damage-reducing conveyor device (as shown in
Figure 14a). During the experiment, mature “Fuji” apples from the upper-middle part of the canopy were randomly selected as samples. A skilled operator harvested 212 apples within a continuous 30-min operation cycle, and all the collected samples were evaluated for postharvest damage. As a control, the traditional manual harvesting method was adopted (as shown in
Figure 14b). One worker completed harvesting and placing 87 apples within 30 min.
Refer to
Table 2 for apple loss analysis. When the damage area of an apple exceeds the limit of its corresponding grade, it is classified as a loss apple, and its grade is downgraded by one level.
Apple damage area was calculated using Equation (22), while the damage rate [
38] was determined by Equation (26):
where:
η2—apple damage rate (%).
ny—number of damaged apples in the sample.
Nz—the total number of apples corresponding to the fruit diameter in the sample.
After calculation, the damage rate of grade I apples (damage area ≤ 1 cm2) harvested using the optimized apple damage-reducing conveyor device was 12%, while the damage rate of grade II apples (damage area ≤ 1 cm2) was 0%, with 100% compliance with grade II standards. The damage rate was far lower than that of vibration harvesting (50%).
Additionally, within 30 min, the optimized device harvested 212 apples, demonstrating significantly higher efficiency than traditional manual harvesting (only 87 apples in 30 min). The efficiency of the optimized device was 2.43 times that of traditional manual methods (212 vs. 87). Additionally, according to the first-hand feedback from harvesters, using the apple damage-reducing conveyor device was less physically strenuous compared to traditional manual harvesting.
4. Discussion
This study represents our team’s exploration of a low-damage apple collection device. Since the field trials were not subjected to rigorous engineering condition tests, the device is still some distance from commercialization. To enhance its resistance to environmental interference, the device does not use a one-to-one wind speed buffering mechanism for each apple grade; instead, it employs three wind speed levels corresponding to three apple grades. This trade-off sacrifices a potentially better buffering effect but reduces interference from confounding factors such as environmental changes during operation. However, research into more precise wind speed control for improved buffering is ongoing. We hold a patent for an air-layer buffering apple collection device in pipelines (included in the appendix), which features bamboo-joint-shaped air nozzles inside the pipeline and has lower energy consumption than the single-end air-inlet pipeline described in this paper.
The device’s current cost is approximately USD 4000, with the main expense being the mobile chassis. If commercialized, the cost is expected to decrease further, offering a significant cost advantage compared to mainstream robotic arms, which cost hundreds of thousands of USD. The device also has the potential to be used in conjunction with robotic arms—for example, the flexible swallowing gripper for apple harvesting studied by Z. Zhang [
39]. In their design, apples are picked by a robotic hand and rolled directly into the collector through a pipeline opening in the palm, eliminating the need for arm movement to place the fruit. While their research focuses on the gripper’s grasping force, integrating our airflow-buffered pipeline with their robotic arm would better ensure apple quality during harvesting.
Given the variability in apple ripening times and referring to the hardness table for major Chinese apple varieties in “Fresh Apples GB/T 10651-2008”, Fuji apples were selected for this study due to their mid-range hardness. In the future, we will investigate how the device interacts with different apple varieties, setting specific parameters for each to maximize the device’s practical value. Meanwhile, M. Van Zeebroeck’s research [
40] found that unripe apples are harder and less prone to damage than mature ones. In this study, both traditional manual harvesting and harvesting using the apple damage-reducing conveyor device involve human picking activities, and people actively select more mature apples. Therefore, the data measured in this field experiment show lower values for the device. If more underripe apples were harvested, the test data of the parameter-optimized device would be more in line with expectations.
5. Conclusions
(1) For the apple postharvest damage-reducing conveyor device based on airflow cushioning technology, analysis of the apple transportation process in the harvesting system revealed that the primary factors influencing apple damage area and post-collection impact force are apple size grade, horizontal conveyor belt speed, and buffer airflow velocity.
(2) To optimize operational parameters of the apple postharvest conveying device, a three-factor, three-level response surface methodology was implemented following Box–Behnken experimental design principles. Using apple size grade, horizontal conveyor speed, and buffer airflow velocity as independent variables, with apple damage area and impact force as response values, multivariate quadratic polynomial regression equations were established. Interaction analysis and response surface evaluation demonstrated that the factors affecting damage rate followed this descending order of significance: horizontal conveyor speed > apple size grade > buffer airflow velocity.
(3) An operational parameter optimization model was developed, yielding optimal parameter combinations for different apple grades:
Grade III apples: conveyor speed of 11 m/min with 18.2 m/s airflow.
Grade II apples: conveyor speed of 11 m/min with 19.01 m/s airflow.
Grade I apples: conveyor speed of 11 m/min with 19.3 m/s airflow.
The optimized parameters resulted in damage areas ranging from 34.24 to 67.01 mm2 and impact forces between 8.70 and 10.34 N. All impact forces remained below apple yield stress thresholds while maintaining minimal damage, demonstrating effective protective performance for apple preservation.
(4) Field trials of the parameter-optimized postharvest damage-reducing apple collection device showed a damage rate of 12% for grade I apples and 0% for grade II apples. This is lower than the 35% damage rate reported for mechanical apple harvesting in the publication by Zaharan Hussein.
(5) Through comparative trials with traditional manual harvesting, it was found that the harvesting efficiency of the postharvest damage-reducing apple collection device is more than twice that of traditional manual methods. Additionally, compared with the over 50% damage rate of vibration harvesting, using this device ensures better apple quality. This device provides an engineering case for balancing improvements in apple harvesting quality and speed.


