Article

The Effect of New Zeolite Composites from Fly Ashes Mixed with Leonardite and Lignite in Enhancing Soil Organic Matter

by
Renata Jarosz
1,*,
Joanna Beata Kowalska
2,
Krzysztof Gondek
3,
Romualda Bejger
4,
Lilla Mielnik
4,
Altaf Hussain Lahori
5 and
Monika Mierzwa-Hersztek
3
1
Department of Mineralogy, Petrography and Geochemistry, Faculty of Geology, Geophysics and Environmental Protection, AGH University of Krakow, Mickiewicza 30 Av., 30-059 Krakow, Poland
2
Institute of Soil Science, Plant Nutrition and Environmental Protection, Wroclaw University of Environmental and Life Sciences, Grunwaldzka 53, 50-357 Wroclaw, Poland
3
Department of Agricultural and Environmental Chemistry, University of Agriculture in Krakow, Mickiewicza 21 Av., 31-120 Krakow, Poland
4
Department of Bioengineering, West Pomeranian University of Technology in Szczecin, Papieza Pawla VI 3, 71-459 Szczecin, Poland
5
Department of Environmental Sciences, Sindh Madressatul Islam University, Karachi 74000, Pakistan
*
Author to whom correspondence should be addressed.
Agriculture 2025, 15(7), 786; https://doi.org/10.3390/agriculture15070786
Submission received: 7 March 2025 / Revised: 2 April 2025 / Accepted: 3 April 2025 / Published: 5 April 2025

Abstract

:
The aim of this study was to evaluate the influence of innovative mineral–organic mixtures containing zeolite composites produced from fly ashes and lignite or leonardite on the fractional composition of soil organic matter in sandy loam soil under two-year pot experiments with maize. The fractional composition of soil organic matter (SOM) was analyzed and changes in the functional properties of soil groups were identified using the ATR-FTIR method. Changes in the content of phenolic compounds were assessed, and the potential impact of fertilizer mixtures on soil carbon stocks was investigated. The addition of these mixtures improved the stability of SOM. The application of mineral–organic mixtures significantly increased the total organic carbon (TOC) by 18% after the 2nd year of the experiment. The maximum TOC content in the soil was observed by 33% with the addition of MC3%Leo3% amendment. Nitrogen content in soil was increased by 62% with MV9%Leo6% additive, indicating increased soil fertility. The study highlighted an increase in fulvic acid carbon relative to humic acid carbon, signaling positive changes in organic matter quality. The new mineral–organic mixtures influence changes in specific functional groups (ATR-FTIR) present in the soil matrix, compared to mineral fertilization alone. The additive mixtures also contributed to an increase in soil carbon stocks, highlighting their potential for long-term improvement of soil fertility and carbon sequestration.

1. Introduction

Soil health and nutrient management are critical elements of sustainable agriculture. The physical, chemical, and biological properties of healthy soil promote optimal plant growth as well as water and air quality [1]. Most parameters used to assess soil condition are interrelated and their interactions can be predicted. The Soil Health Institute identified organic carbon, soil carbon mineralization potential, and aggregate stability as key indicators based on analysis of over 30 indicators at 124 long-term agricultural research centers in North America [2,3]. Healthy soil contains high levels of organic matter and a diverse biological population [4].
Fertilizers play a critical role in preserving soil fertility and thereby increasing crop yields. Their use is essential for the production of high-quality food. Consequently, the significance of fertilizers in sustaining the global food supply is undeniable [5,6]. The combination of organic and inorganic fertilizers can help to increase the organic matter content of the soil and enhance the quantity and diversity of soil microorganisms [7,8].
In order to limit the decline in soil organic matter, it is necessary to implement sustainable, environmentally friendly and economically viable production systems. Zeolites as a soil additive offer numerous benefits, as they increase or maintain soil pH compared to mineral fertilizers [9]. Due to their ability to exchange ions, zeolites improve nutrient retention. One of the main applications of zeolites in agriculture is the absorption, storage, and gradual release of nitrogen [9,10,11,12]. Megías-Sayago et al. [13] observed that in addition to nitrogen retention, zeolites can also capture CO2. The effectiveness of CO2 capture relies heavily on the concentration of Al atoms in the zeolite structure and its cationic character. Zeolites present a promising solution to achieve balance in the agricultural ecosystem. In this regard, zeolites can potentially aid farmers in achieving fertilizer savings, improved water management, soil remediation, and groundwater purification [11,12]. The results of studies by various authors show that zeolites can be successfully synthesized from fly ash. Therefore, it can be considered that the synthesis of zeolites from fly ash is an effective way of managing these industrial wastes, contributing to their utilization and use in practical applications [14,15].
Lignite represents a natural organic reservoir that is of significant value to agricultural soils because it is a rich source of humic acids [16,17,18,19]. According to Dubey and Mailapalli [20] and Nan et al. [21], the use of lignite or lignite-based fertilizers can improve the properties of soil organic matter, thereby increasing the soil’s ability to retain water and nutrients. The addition of lignite to the soil can affect the soil microflora quantitatively and qualitatively and the enzymatic activity [8,16,22,23]. Moreover, the study conducted by Chen et al. [24] indicates that the use of lignite-based fertilizer had a positive impact on the reduction of CH4 and CO2 emissions.
Leonardite is a deposit rich in humic acids, making it a valuable addition to agricultural soils [25]. The chemical composition of leonardite indicates a great potential for its use as a soil improver [18,19,26]. The decline in soil organic matter significantly impacts soil biochemical processes, highlighting the importance of preserving and enhancing soil organic carbon for the long-term stability of agricultural and environmental ecosystems. Consequently, the restoration of adequate soil organic matter content is a prevalent objective in soil science research [16].
Despite extensive research on zeolites and organic amendments, the combined effects of these materials on long-term SOM stability and nutrient cycling remain poorly understood. This study aims to fill this gap by analyzing the transformation of soil organic matter after the application of mineral–organic mixtures in a two-year pot experiment.
We hypothesize that the addition of mineral–organic mixtures containing zeolite composites, lignite, or leonardite would possess heterogeneous dissimilarities to increase soil carbon stocks, stabilize soil organic matter content, and positively influence its quality. In order to verify these assumptions, we analyzed (i) the fractional composition of soil organic matter, (ii) changes in soil carbon stocks, (iii) ATR-FTIR characterization of soil, and (iv) the content of phenolic compounds.

2. Materials and Methods

2.1. Description of the Soil Sampling Site

Soil samples were collected from an agricultural area with grass mixtures adjacent to a coniferous forest in South Malopolska (coordinates 50°09′36″N 19°66′53″E, 377.6 m a.s.l.). Samples were taken from the upper soil layer at a depth of 0–30 cm using a hydraulic soil sampler (Auto-Field Sampler Wintex 1000 adapted for ATV Polaris, Wintex Agro, Thisted, Denmark). According to the World Reference Base for Soil Resources [27], the soil identified as Eutric Cambisol (CM-eu) comprised sand 850 g · kg−1, silt 120 g · kg−1, clay 30 g · kg−1, which categorizes it as loamy sand. The physical composition of the soil was as follows: particle density 2.65 g · cm−3, bulk density 1.45 g · cm−3. The initial soil for the research had a pH value of 5.24 and an electrical conductivity (EC) value of 850 µS · cm−3. The total organic carbon (TOC) and total nitrogen (TN) contents were 5.74 g · kg−1 and 0.40 g · kg−1, respectively, with a C:N ratio of 14.4 [8,19,23].

2.2. Materials Used in the Experiment

The components of the mineral–organic mixtures used in the research were zeolite composites (zeolite–carbon composite (NaX-C) or zeolite–vermiculite composite (NaX-V)) and organic materials (lignite or leonardite), in two doses. The doses of zeolite composites were determined based on the analysis of previous literature data. Zeolite composites were applied at rates of 3% (0.043 g · kg−1) and 9% (0.129 g · kg−1). Zeolite composites were obtained through alkaline synthesis of fly ash from the “Kozienice” Power Plant (Poland), which underwent hydrothermal treatment. A detailed description of the zeolite composites used has been presented in a previous article [28,29]. The rates of lignite and leonardite were 3% (0.043 g · kg−1) and 6% (0.086 g · kg−1). Lignite was sourced from the “Sieniawa” lignite mine located in Poland. Leonardite was supplied by the producer—Energy Investment Company Ltd., Kyiv, Ukraine. The properties of lignite and leonardite are given in Table S1 in the Supplementary Material. The reference treatment of the experiment was the control soil without any additives and the soil with only mineral fertilization. Chemical salts were applied as a solution prior to planting at the following rates: 0.20 g · kg−1 NH4NO3; 0.10 g · kg−1 Ca(H2PO4)2 H2O; 0.25 g · kg−1 KCl. The chemical composition of each mixture was determined by considering the percentage share and chemical composition of individual ingredients.

2.3. Description of the Pot Experiment Design

The two-year pot experiment was conducted in 2020 and 2021 during the summer season in the vegetation hall located in Krakow. Details of the experimental design are presented in Table 1. All treatments were replicated four times (n = 4). Soil was air-dried in the shade for 3–4 days, then ground to <2 mm sieve size and homogenized prior to pot experiments. The pots, with dimensions of 0.25 m in height, 0.22 m in diameter, and a volume of 0.009 cubic meters, were filled with soil blended together with mineral–organic mixtures. Each pot held 9 kg of soil and mineral–organic mixture, and the Kosynier variety of maize (Zea mays L.) was sown in each pot. Maize is an excellent crop for testing due to its long growing season and high nutrient requirements. For this reason, information on the accuracy or justification of the fertilization applied can be obtained relatively quickly [30,31]. During the growing season, the plants exhibited symptoms indicative of N deficiency. Consequently, supplementary NH4NO3 was applied to each pot (except the control) at a rate of 0.02 g N · kg−1 DM soil. Providing the optimal amount of water and nutrients resulted in a reduction in the length of the growing season of the plants. In a field experiment, this period is usually extended by 2–3 months. The doses of NPK fertilizer and microelements were established based on the recommended doses for maize. Soil moisture levels were maintained between 40 and 60% of the maximum water capacity of soil, with adjustments made according to the stage of plant development. Soil moisture levels were regulated using a portable probe equipped with an ECH2O EC5 sensor (Decagon Devices, Inc., Pullman, WA, Washington, USA). At the end of the growing season, the roots were removed from the pots and, after the necessary preparation, their morphological parameters were determined. These findings are presented in more detail in our previous paper [19]. In the 2nd year, the mixtures were reapplied to the same pots and, after manual mixing, new maize seeds were sown in each pot.

2.4. Description of the Experimental Area

The experimental vegetation hall where the pot experiment was conducted is located at the research facility of the University of Agriculture in Krakow. The experimental region, situated in the south of Krakow in Poland, is characterized by a moderate climate zone and is dominated by four distinct seasons. Data on mean monthly temperature and humidity are shown in the Supplementary Materials, Table S2. The vegetation hall was constructed with a transparent roof to allow natural light to enter, and the use of netting instead of walls permitted unrestricted airflow while providing protection from birds. The pots were placed on horizontal carts to provide equal access to light and air.

2.5. Soil Sampling

Soil samples were collected from each pot at the end of the plant growth cycle (126 days in year one and 118 days in year two). Soil samples were obtained using the standard soil sampler probe (Egner’s staff) from the depth of the entire pot. The soil was then manually homogenized and placed on PVC trays to dry. Soil samples were subsequently dried at room temperature, 2 mm sieved, cleaned of plant residues, and stored in plastic bags for subsequent physicochemical analyses. Soil samples for carbon fraction determination were additionally ground in an agate mortar immediately before analysis.

2.6. Laboratory Analysis

All analyses were conducted in four replicates for each treatment.

2.6.1. Basal Soil Analysis

Soil pH (1:2.5 w/v) was determined electrochemically, while electrical conductivity values were obtained conductometrically (soil/water ratio, 1:2.5 w/v) using an Elmetron Multifunction Meter CX-502. Total nitrogen (TN) content in soil was determined using a Vario EL Cube (Elementar Analysensysteme GmbH, Langenselbold, Germany). Total sorption capacity (T) was determined as the sum of base cations (S) and hydrolytic acidity (Hh). S was determined by the Kappen method by extracting the cations from the soil with 0.1 M HCL, and Hh was determined by titration after extraction with 1 M sodium acetate. The T value was calculated according to the formula
T = S + Hh [mmol(+) · kg−1].

2.6.2. Carbon Fractions Determination

The obtained solutions of humic substances and fulvic acids (after humic acid precipitation) were then analyzed by the oxidation titration method [32] to determine TOC (total organic carbon content), including the following carbon fractions: C Ext—NaOH+Na4P2O7 separated carbon; CHA—carbon of the humic acid fraction; CFA—carbon of the fulvic acid fraction (calculated as CFA = C Ext—CFA); CNH—the amount of carbon remaining in the soil after extraction (calculated as CNH = TOC—C Ext). An important indicator for evaluating organic matter quality is the humification index, which is measured by the CHA:CFA ratio.
Organic carbon stocks (ZC) were calculated based on the TOC content (in %) and the volumetric density of soil (ρc in Mg · m−3) [33] using the following formula:
ZC = TOC · ρc · 10
where ZC represents the soil carbon stock (in Mg C · ha−1), TOC stands for the carbon content (mg C · g soil−1), and ρc is the soil density (bulk density in Mg · m−3).

2.6.3. ATR-FTIR Spectroscopy Method

ATR-FTIR spectroscopy is a valuable tool for analyzing the organic and mineral composition of soil mixtures. Individual spectra of soil samples were measured using an IR300 FT-IR spectrometer (Thermo Mattson, Madison, WI, USA) fitted with a Quest Single Reflection Diamond ATR (Specac, Cranston, RI, USA). Spectral analysis was performed in the wave number range of 4000 to 400 cm−1. Recordings were made with a resolution of 4 cm−1 and 32 scans per sample. To correct for background interference, each spectrum was adjusted using ambient air as a reference spectrum. The ATR-FTIR spectra were then smoothed to avoid shifting of the maximum band. All spectra were baseline-corrected and normalized to ensure comparability of spectral characteristics between treatments.

2.6.4. Water-Soluble Phenolic Compounds (WPC)

Water-soluble phenolic compounds were extracted from the soil with redistilled water at a soil/water ratio of 1:10 (w/v). The extraction (using a rotary mixer) was carried out for 4 h. The solution was then filtered through a Büchner funnel and 10 cm3 of the solution was transferred to 25 cm3 test tubes. Subsequently, 3 cm3 of Na2CO3 (20%) and 1 cm3 of Folin–Ciocalteu reagent were added and the solution was topped-up with redistilled water. After mixing, the samples were left at room temperature (20–25 °C) for 1 h. The absorbance was then read at a wavelength of 750 nm using a UV-VIS spectrophotometer (HITACHI U-5100, Tokyo, Japan).

2.6.5. Statistical Analysis

A two-way analysis of variance (ANOVA) with Duncan’s test (p ≤ 0.05) was performed using Statistica® PL 13.3 TIBCO Software Inc (StatSoft Inc., Tulsa, OK, USA), with both treatments and year of experiment as factors. The standard deviation (SD) was computed to assess the variability within each mixture. Pearson linear correlation coefficients were employed to calculate the correlation between carbon fractions, treatment, year, and other soil properties (with significance levels: p ≤ 0.05, p ≤ 0.01, and p ≤ 0.001). Graphical visualizations of the data sets were generated using OriginPro® 2022b software (OriginLab®).

3. Results and Discussion

3.1. The pH and Electrical Conductivity (EC) in Soil

The pH values in the soil after the first and second year of the experiment did not differ significantly within each treatment (Table 2). Significant differences between the years were recorded between the soil from the control treatments and the soil from the fertilized treatments. It should be noted that regardless of the year of the study, fertilization led to a decrease in the soil pH value.
In the soil with treatments, an increase in electrical conductivity values was observed after the second year of the experiment in all treatments except the control soil (Table 2). The highest EC values after the 2nd year of the experiment were determined in the MV9%Leo6% treatment—1111.7 µS · cm−1 and in the MC3%Leo3% treatment—1263.3 µS · cm−1. The majority of these treatments showed a considerable elevation in EC over time, indicating an increase in soil EC. The impact of the different treatments varies, with certain combinations (e.g., MV9%Leo6%) demonstrating a notable increase in EC, potentially attributable to the elevated concentrations of NaX-V or NaX-C and lignite.
The results of the total sorption capacity (T) determination show significant differences between the tested variants in the first and second years of the study. All fertilized variants showed an increase in T values in the second year of the study, confirming the positive effect of the applied substances on the soil’s ability to retain cations. The highest T values in the second year were observed in the variants MC9%L6% (138.5 mmol(+) · kg−1) and MC3%Leo3% (138.4 mmol(+) · kg−1), indicating that these combinations had the greatest effect on improving soil sorption properties.
In all fertilized variants, an increase in T values was observed in the second year of the study, suggesting that the effect of fertilization builds up over time and that the improvement in soil properties is not immediate. Particularly significant increases in sorption capacity were observed in the MV3%L3% and MC3%L3% treatments, indicating that these combinations are more effective in improving the soil’s ability to retain cations.

3.2. Total Carbon and Total Nitrogen Contents in Soil

The total soil organic carbon (TOC) content after the first year of the study ranged from 5.13 g · kg−1 in the soil with MV3%L3% to 6.17 g · kg−1 in the soil of the MV9%Leo6% addition. The TOC content after the second year of the study ranged from 5.57 g · kg−1 in the soil with MV3%L3% to 6.87 g · kg−1 in the soil with the MC9%L6% addition. Soil organic carbon (TOC) content was higher in each treatment after the second year of the experiment compared to the first year (Table 3). The addition of mineral–organic mixtures resulted in an average 18% increase in TOC content after the second year of the experiment. The soil containing MC3%Leo3% showed the highest increase in TOC content (33%). The ANOVA results indicate that the different fertilization treatments had no significant effect on the TOC content in the soil compared to the control (p ≤ 0.05). However, an analysis of the results obtained after the first and second years of testing revealed a statistically significant increase in the TOC content following the application of the MV3%Leo3%, MC3%L3%, MC9%L6%, and MC3%Leo3% mixtures. These results suggest that the use of mineral–organic mixtures significantly changed the TOC content, which is consistent with previous literature reports [34,35]. The study by Spaccini et al. [36] proved that the introduction of hydrophobic humic acid from an external source into the soil resulted in a notable increase in organic carbon sequestration in the soil. A portion of the microbially oxidized carbon derived from organic material was successfully incorporated into the stable fraction of soil organic matter, which was represented by humic substances. The cited authors contended that the retention of carbon in the soil results in a subsequent reduction in CO2 emissions. It is estimated that up to 60% of total applied nitrogen is lost from poor, low-yielding soils. In addition, low-yielding soils exhibit reduced sorption and ion-exchange capacity, resulting in additional nitrogen losses through leaching and surface runoff. The application of zeolites to arable soils has the potential to enhance nitrogen efficiency and significantly reduce possible losses. This may contribute to increased yields [37,38]. The soil TN content is presented in Table 3. The results of the ANOVA analysis for TN content revealed significant differences between the various fertilization treatments. After the first year of the experiment, the highest TN content (0.477 g · kg−1) was identified in the control soil, exhibiting a notable elevation compared to all other treatments. The lowest TN content was observed in the MV3%Leo3% treatment (0.376 g · kg−1). However, after the second year of the experiment, the significantly highest TN content was recorded in the MV9%Leo6% treatment (0.609 g · kg−1), indicating that the addition of leonardite and NaX-V increased the nitrogen content in the soil. The control treatment (C) had a lower TN content (0.512 g · kg−1) compared to several treatments that included the addition of mineral–organic mixtures. The greatest increase (62%) in TN content was determined in the soil with the MV9%Leo6% addition. This was probably due to the lower amount of biomass and, consequently, reduced nitrogen uptake. In the treatment amended solely with mineral fertilization, the total nitrogen content increased by a mere 3%. The use of mineral–organic mixtures led to an average 9% increase in the total nitrogen content in the soil after the second year of the study, compared to the control. However, the addition of mineral–organic mixtures helped in nitrogen retention, probably due to enhanced sorption and ion-exchange capacity provided by the mixtures, as supported by the findings of Aziz et al. [37] and Naz et al. [38].
The carbon to nitrogen ratio (TOC:TN) of soil organic matter reflects the amount of carbon relative to the amount of nitrogen present. A TOC:TN ratio between 1 and 15 results in rapid mineralization and release of N available for plant uptake. A lower TOC:TN ratio results in accelerated release of nitrogen into the soil, thereby facilitating its direct use by the crop. A ratio of 20–30 provides a balance between mineralization and immobilization [39]. It is assumed that the TOC:TN ratio in soil organic matter is in the range of 10–13:1 and that it decreases significantly after the removal of plant residues from the soil. On the other hand, in clayey agricultural soils, the TOC:TN ratio can be as low as 6:1 [40]. The results of the TOC:TN ratio (Table 3) obtained after the 1st year of the experiment ranged from 12.8 ± 0.7 (MV3%L3% and MC3%Leo3%) to 16.6 ± 2.7 in the MV9%Leo6% treatment. The TOC:TN ratio results for the analyzed treatments indicate a higher TOC:TN ratio value after the second year of the experiment in the control treatment and in the treatment with mineral fertilization, compared to the values obtained after the first year. However, in the remaining treatments with mineral–organic additives, the TOC:TN values obtained after the second year were 5 to 35% lower than those obtained after the first year. The statistical analysis revealed no significant differences in the TOC:TN ratios across treatments analyzed. However, when comparing the values obtained from year to year, a notable decline was observed only in the MV9%Leo6% treatment. The variation in TOC:TN ratios suggests a balanced release of nitrogen for plant uptake, supporting crop growth.

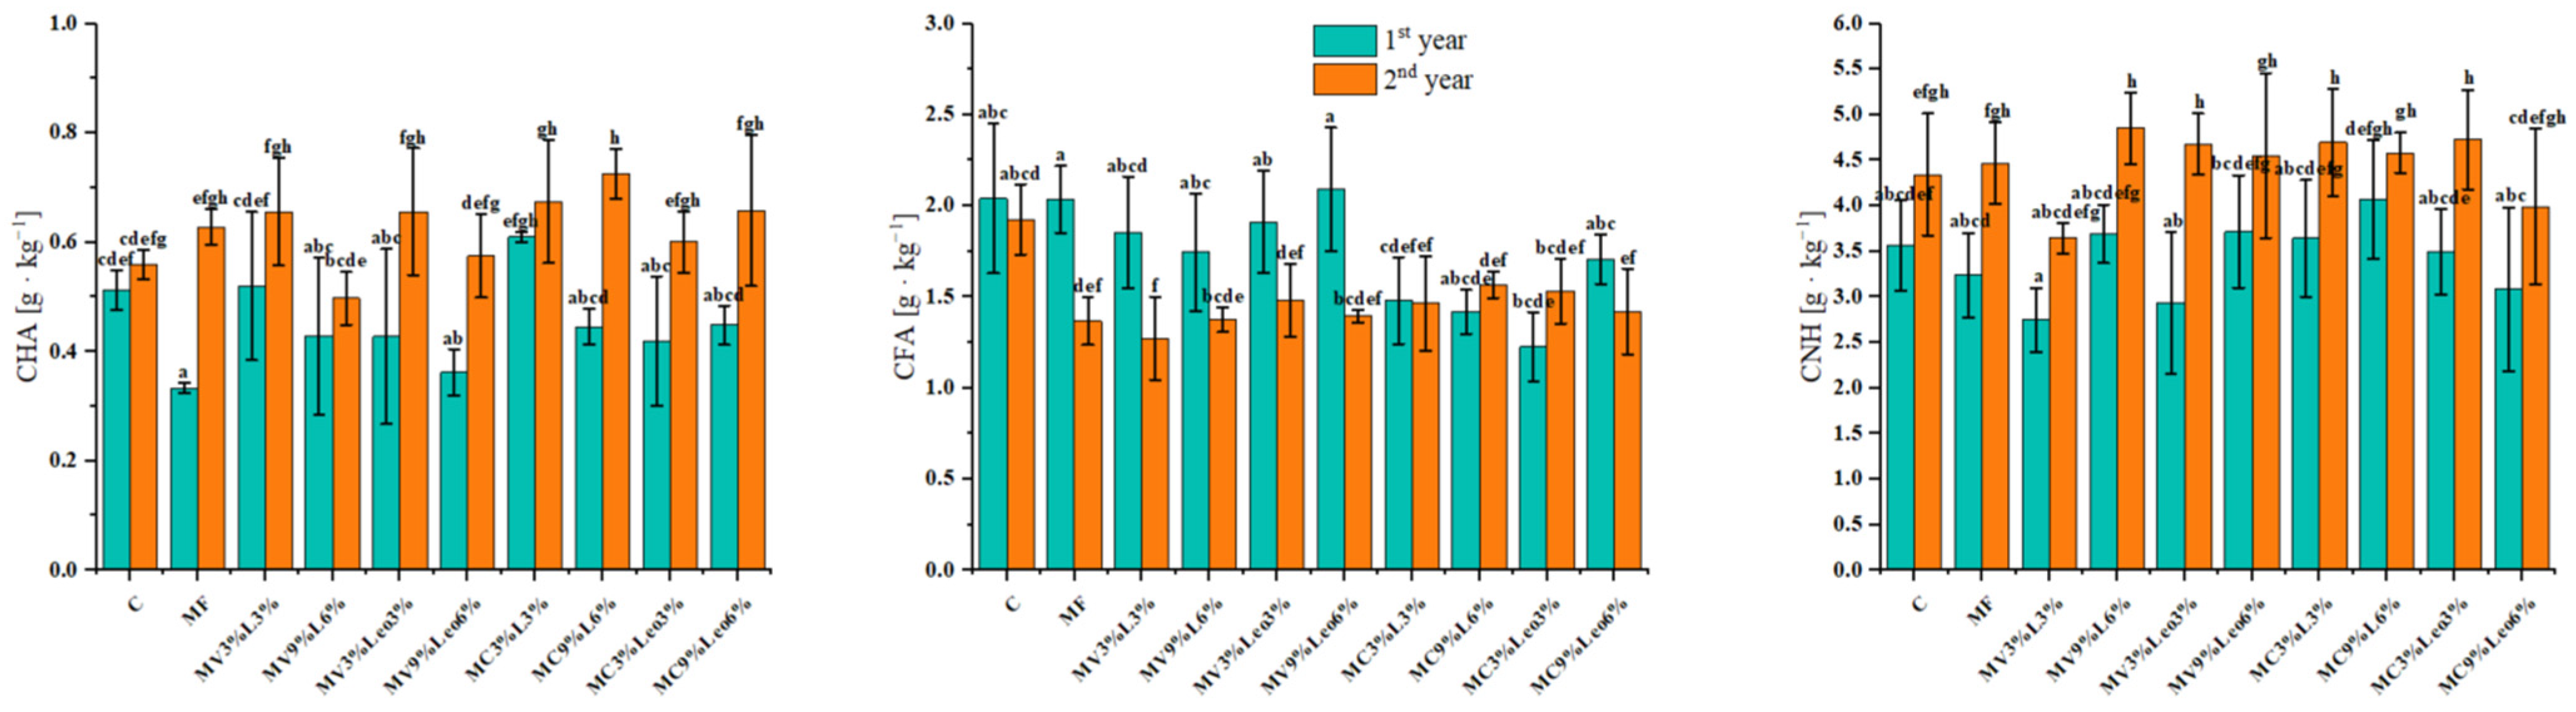
3.3. Content of Carbon Fractions in Soil

Humic acids, the principal constituent of SOM, can form an enzymatically active complex that initiates various reactions commonly attributed to the metabolic activity of microorganisms [25]. Fulvic acids have a higher abundance of carboxylic, phenolic, and ketone groups than humic acids, resulting in greater solubility at all pH levels. Humic acids, which are characterized by their aromatic properties, become insoluble when their carboxylate groups are protonated at low pH. This structural characteristic of humic materials influences their ability to bind both hydrophobic and hydrophilic substances [41]. The contents of humic acid carbon (CHA) and fulvic acid carbon (CFA) after the first and second year of the experiment are depicted in Figure 1. The CHA content identified after the first year of the experiment ranged from 0.33 ± 0.01 g · kg−1 in the soil with only mineral fertilizer addition to 0.61 ± 0.01 g · kg−1 in the soil with MC3%L3% addition. After the second year of the experiment, the CHA content increased in all treatments analyzed. The greatest increases in CHA content were found in the MF treatment—89%—and in the MC9%L6% treatment—63%. In contrast, the results showed a decrease in CFA content in the soil after the second year of the study compared to the first year. The CFA content determined after the first year of the experiment ranged from 1.23 ± 0.19 g · kg−1 in MC3%Leo3%, to 2.09 ± 0.34 g · kg−1 in the soil with MV9%Leo6% addition. After the second year of the experiment, the highest CFA content of 1.93 ± 0.19 g · kg−1 was found in the control treatment, while the lowest of 1.27 ± 0.23 g · kg−1 in the treatment with the addition of MV3%L3%. In general, the CFA content was higher than the CHA content in all the soils analyzed. The study of Truc and Yoshida [42] demonstrated that the carbon accumulation of humic fractions and the degree of humification and aromaticity of humic acids increased as a result of Ca-zeolite application to soil. This proves that the decomposition process of humic acids in soil without zeolites exceeds the rates of oxidation, decarboxylation, and demethanation. This suggests that the presence of certain amendments, such as zeolites, can significantly influence the balance between the decomposition and stabilization processes of humic substances in soil [43]. The observed changes in CHA and CFA levels across treatments underscore the dynamic nature of SOM and its sensitivity to external inputs and soil management practices [44,45]. The results of our study indicate an increase in CHA content in soils containing mineral and organic amendments, highlighting the potential of these treatments to enhance soil carbon sequestration and improve soil condition by promoting the formation of stable humic substances.
The content range of non-hydrolyzable humic compounds (CNH) (Figure 1) varied from 2.75 ± 0.35 g · kg−1 in soil treated with MV3%L3% to 4.07 ± 0.65 g · kg−1 in soil with the addition of MC9%L6% after the first year of the experiment. On the other hand, after the second year of the experiment, the non-hydrolyzing fraction of humic compounds showed varying contents across treatments, ranging from 3.65 ± 0.17 g · kg−1 in MV3%L3% to 4.85 ± 0.39 g · kg−1 in MV9%L6%. All treatments showed an increase in CNH content after the second year, with the highest increase of 59% in the MV3%Leo3% treatment. The content and composition of humic substances indicate enhanced soil microbial activity and carbon stabilization. The increase in CNH content, especially the significant rise in the MV3%Leo3% treatment, indicates that these amendments can effectively promote the formation of stable carbon compounds in the soil. Compiling these results can be helpful in understanding which fertilizer combinations are most effective in improving soil quality. Overall, the findings support the use of mineral–organic mixtures as a sustainable soil management practice, with implications for soil health and environmental sustainability.
Soil organic carbon (ZC) stocks are influenced by various factors, including soil properties, cultivation and fertilization methods, climate, irrigation, and the type and frequency of agrotechnical practices [34,35]. The ZC values (Figure 2) obtained after the first year of the experiment ranged from 7.45 ± 0.52 Mg · ha−1 in the soil treated with MC3%Leo3% to 9.08 ± 0.32 Mg · ha−1 in the soil treated with MV9%Leo6%. ANOVA for ZC content in the soil after the first and second years of the experiment showed significant differences between various fertilization treatments and between years. The study findings revealed that all the fertilization variants used resulted in an increase in ZC after the second year of the experiment, with an average increase of 16%. The greatest increase in ZC (39%) after the second year of the experiment was determined in the soil with MC3%Leo3% addition. The fertilized treatments exhibited either lower or slightly higher ZC values compared to the control after the first year of the experiment. However, after the second year, the ZC values were lower in the MV3%L3% and MC9%Leo6% treatments compared to the control. Moreover, the values determined in the other treatments were notably higher. Additives such as NaX-V, NaX-C, lignite, and leonardite were found to significantly influence the increase in ZC in the soil.
The enhancement of soil carbon stocks has the potential to reduce carbon dioxide emissions into the atmosphere. The simultaneous mitigation of climate change impacts and improvement of soil health and fertility can ultimately lead to higher-quality crops [46]. Optimizing soil organic carbon stocks provides many benefits, including carbon sequestration, improved water retention, enhanced soil structure, and support for microbiological and enzymatic activities [47]. In a study by Zhang et al. [48], the use of organic amendments compared to mineral fertilization practices had a positive effect on the soil carbon sequestration in rice crops, capturing carbon at a rate of 0.20–0.88 Mg · ha–1 · year−1. However, the soil carbon content did not increase proportionally with increasing dose of organic amendment. Therefore, the cited authors advised against using excessive amounts of organic amendments to enhance carbon sequestration. Policymakers, farmers, and scientists need to promote changes in C sequestration practices that provide additional benefits, e.g., climate change mitigation, improved soil health, food security [49].

3.4. Humic Acid Carbon: Fulvic Acid Carbon Ratio

The CHA:CFA ratios (Table 4) calculated after the first year of the experiment ranged from 0.165 ± 0.018 in the MF treatment to 0.420 ± 0.069 in the treatment with the addition of MC3%L3%. After the second year, the lowest CHA:CFA ratio was obtained in treatment C—0.293 ± 0.039—and the highest in the MV3%L3% treatment—0.536 ± 0.163. Based on the average CHA:CFA ratio over two years, the soil treated with MC3%L3% exhibited the highest value (0.448 ± 0.101), suggesting superior humification compared to the control soil, which showed the lowest value (0.277 ± 0.049). The quality of soil organic matter can be assessed by calculating the CHA:CFA ratio. It is generally assumed that fertile soils are characterized by a higher concentration of humic substances and a CHA:CFA ratio greater than 1. On agricultural land, the humic properties of soils are mainly influenced by post-harvest residues [50]. In our study, all the CHA:CFA values obtained were less than 1. Nevertheless, the results of the second year of the study demonstrated a significant increase in the CHA:CFA ratio following the application of mineral–organic mixtures.

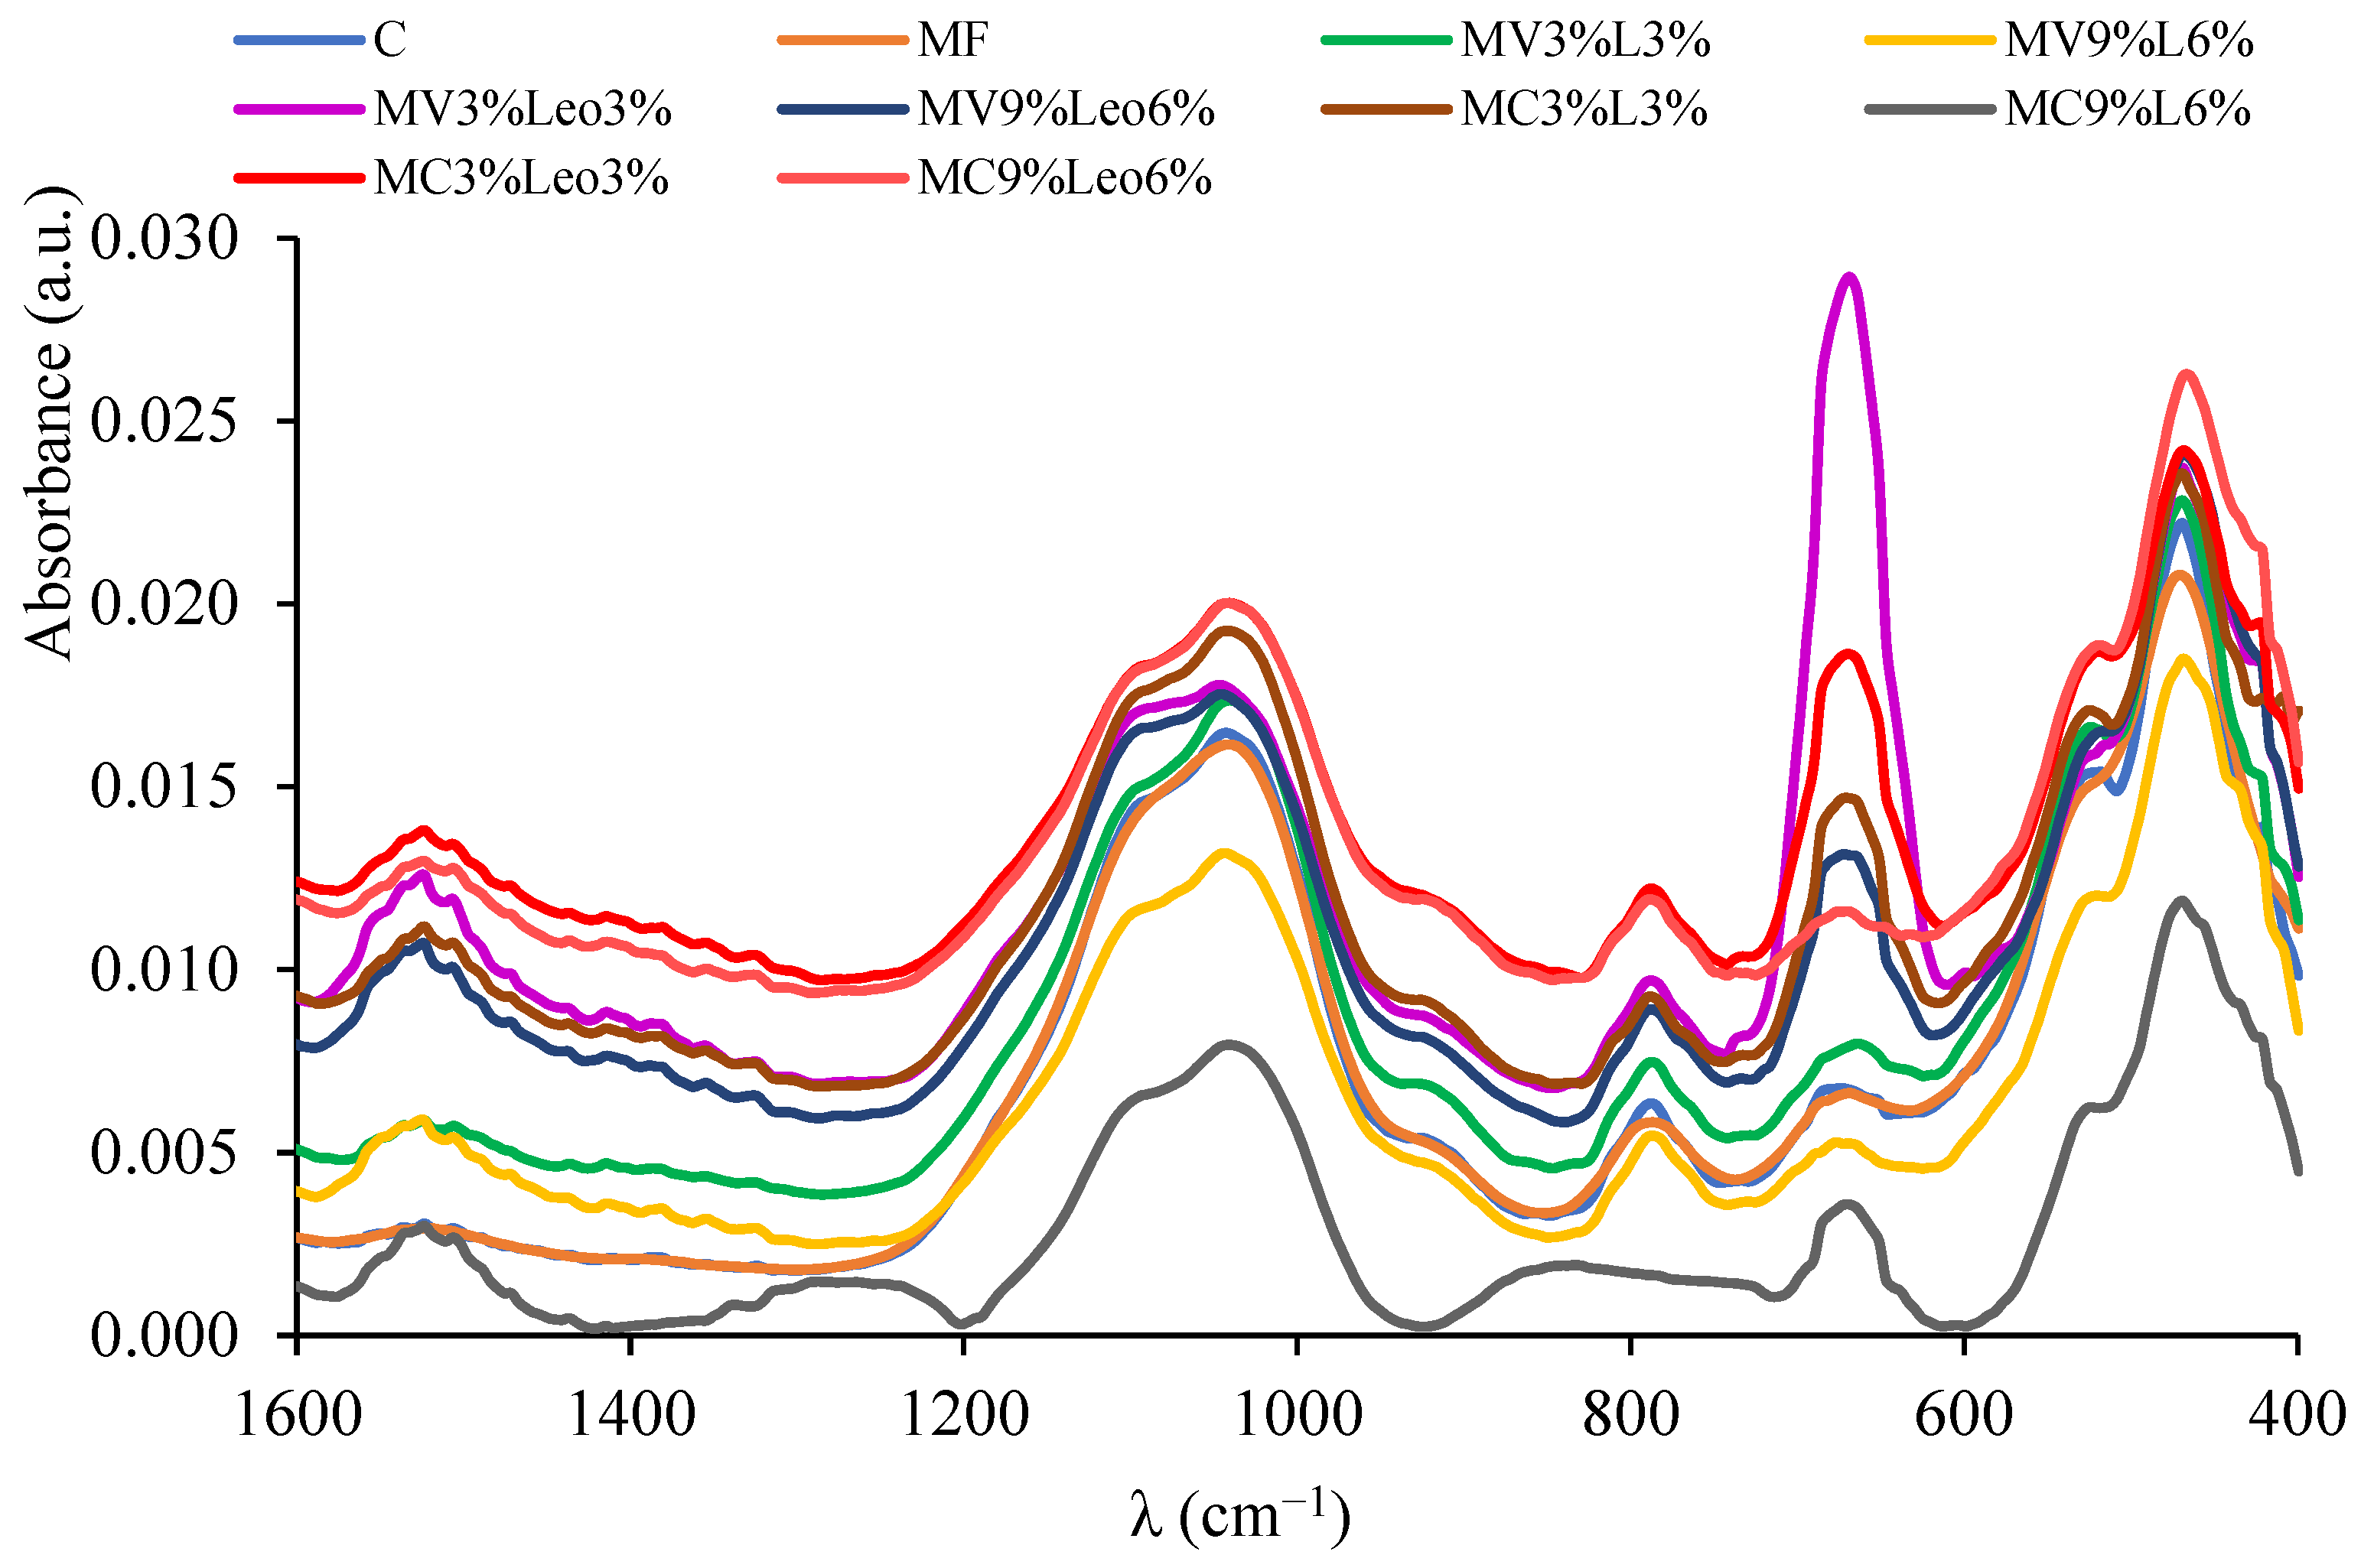
3.5. Analysis of ATR-FTIR Spectra of Soil Samples

In the tested soil samples amended with mineral–organic mixtures (MV3%L3%—MV9%Leo6%) (Figure 3), a small band emerged, centered at 1520 cm−1, attributed to the asymmetric stretching vibrations of carboxylate (COO) [51,52]. The appearance of a band at 1520 cm−1 in samples containing mineral–organic additives suggests the formation of carboxyl (COO-) complexes with metal cations present in the soil. The presence of this band in samples with organic additives, but not in control (C) or mineral fertilization (MF), suggests that organic matter introduces additional functional groups capable of interacting with soil minerals. The most intense bands in this range were observed in the MC3%Leo3% treatment.
The control soil samples, both without additives and with the addition of mineral fertilization (C and MF, respectively), did not show the aforementioned band. The 1400–1100 cm−1 region is difficult to analyze without data from other IR techniques to evaluate both the organic matter and mineral composition of the soil matrix, but differences in band intensities between variants may be due to changes in the content of humic substances and their interactions with soil minerals [53,54]. All soil samples showed well-defined peaks of high or medium intensity between 1100 and 450 cm−1, which may correspond to the overtones and combination bands of bending vibrations involving O–Si–O bonds in quartz and hydrosilicates; clay minerals; or oxides such as hematite, magnetite, and rutile anions [53,54,55].
Our results indicate that mineral–organic mixtures add distinct functional groups to the soil matrix that are absent when only mineral fertilizers are used. The peaks with a maximum around 1080 cm−1 are attributed to the asymmetric stretching vibration of Si-O groups, symmetric stretching at 780 cm−1, and symmetric and asymmetric Si-O bending modes at 695, 520, and 450 cm−1, respectively [56]. In general, C and MF treatments were found to have relatively weak band intensities in most key regions. These samples contain less hydrogen, carbonyl, and C-O groups. Average band intensities compared to other soil samples are shown by MV9%L6%, MV3%Leo3%, and MV9%Leo6% samples. They are characterized by a higher number of functional groups such as -OH, C=O, and C-O. In contrast, MC3%L3%, MC9%L6%, MC3%Leo3%, and MC9%Leo6% samples are characterized by the highest intensity of bands, especially in the C-H range and -OH and C=O groups. This indicates a higher content of hydrocarbon compounds and functional groups such as alcohol and carbonyl groups.
These spectral modifications highlight the role of mineral–organic mixtures in altering soil chemistry by introducing distinct functional groups and facilitating organic-mineral interactions absent in mineral-only fertilized soils. The formation of carboxylate-metal complexes and increased humic substance associations with silicates suggest improved soil structure and nutrient retention, demonstrating the agronomic benefits of these amendments.

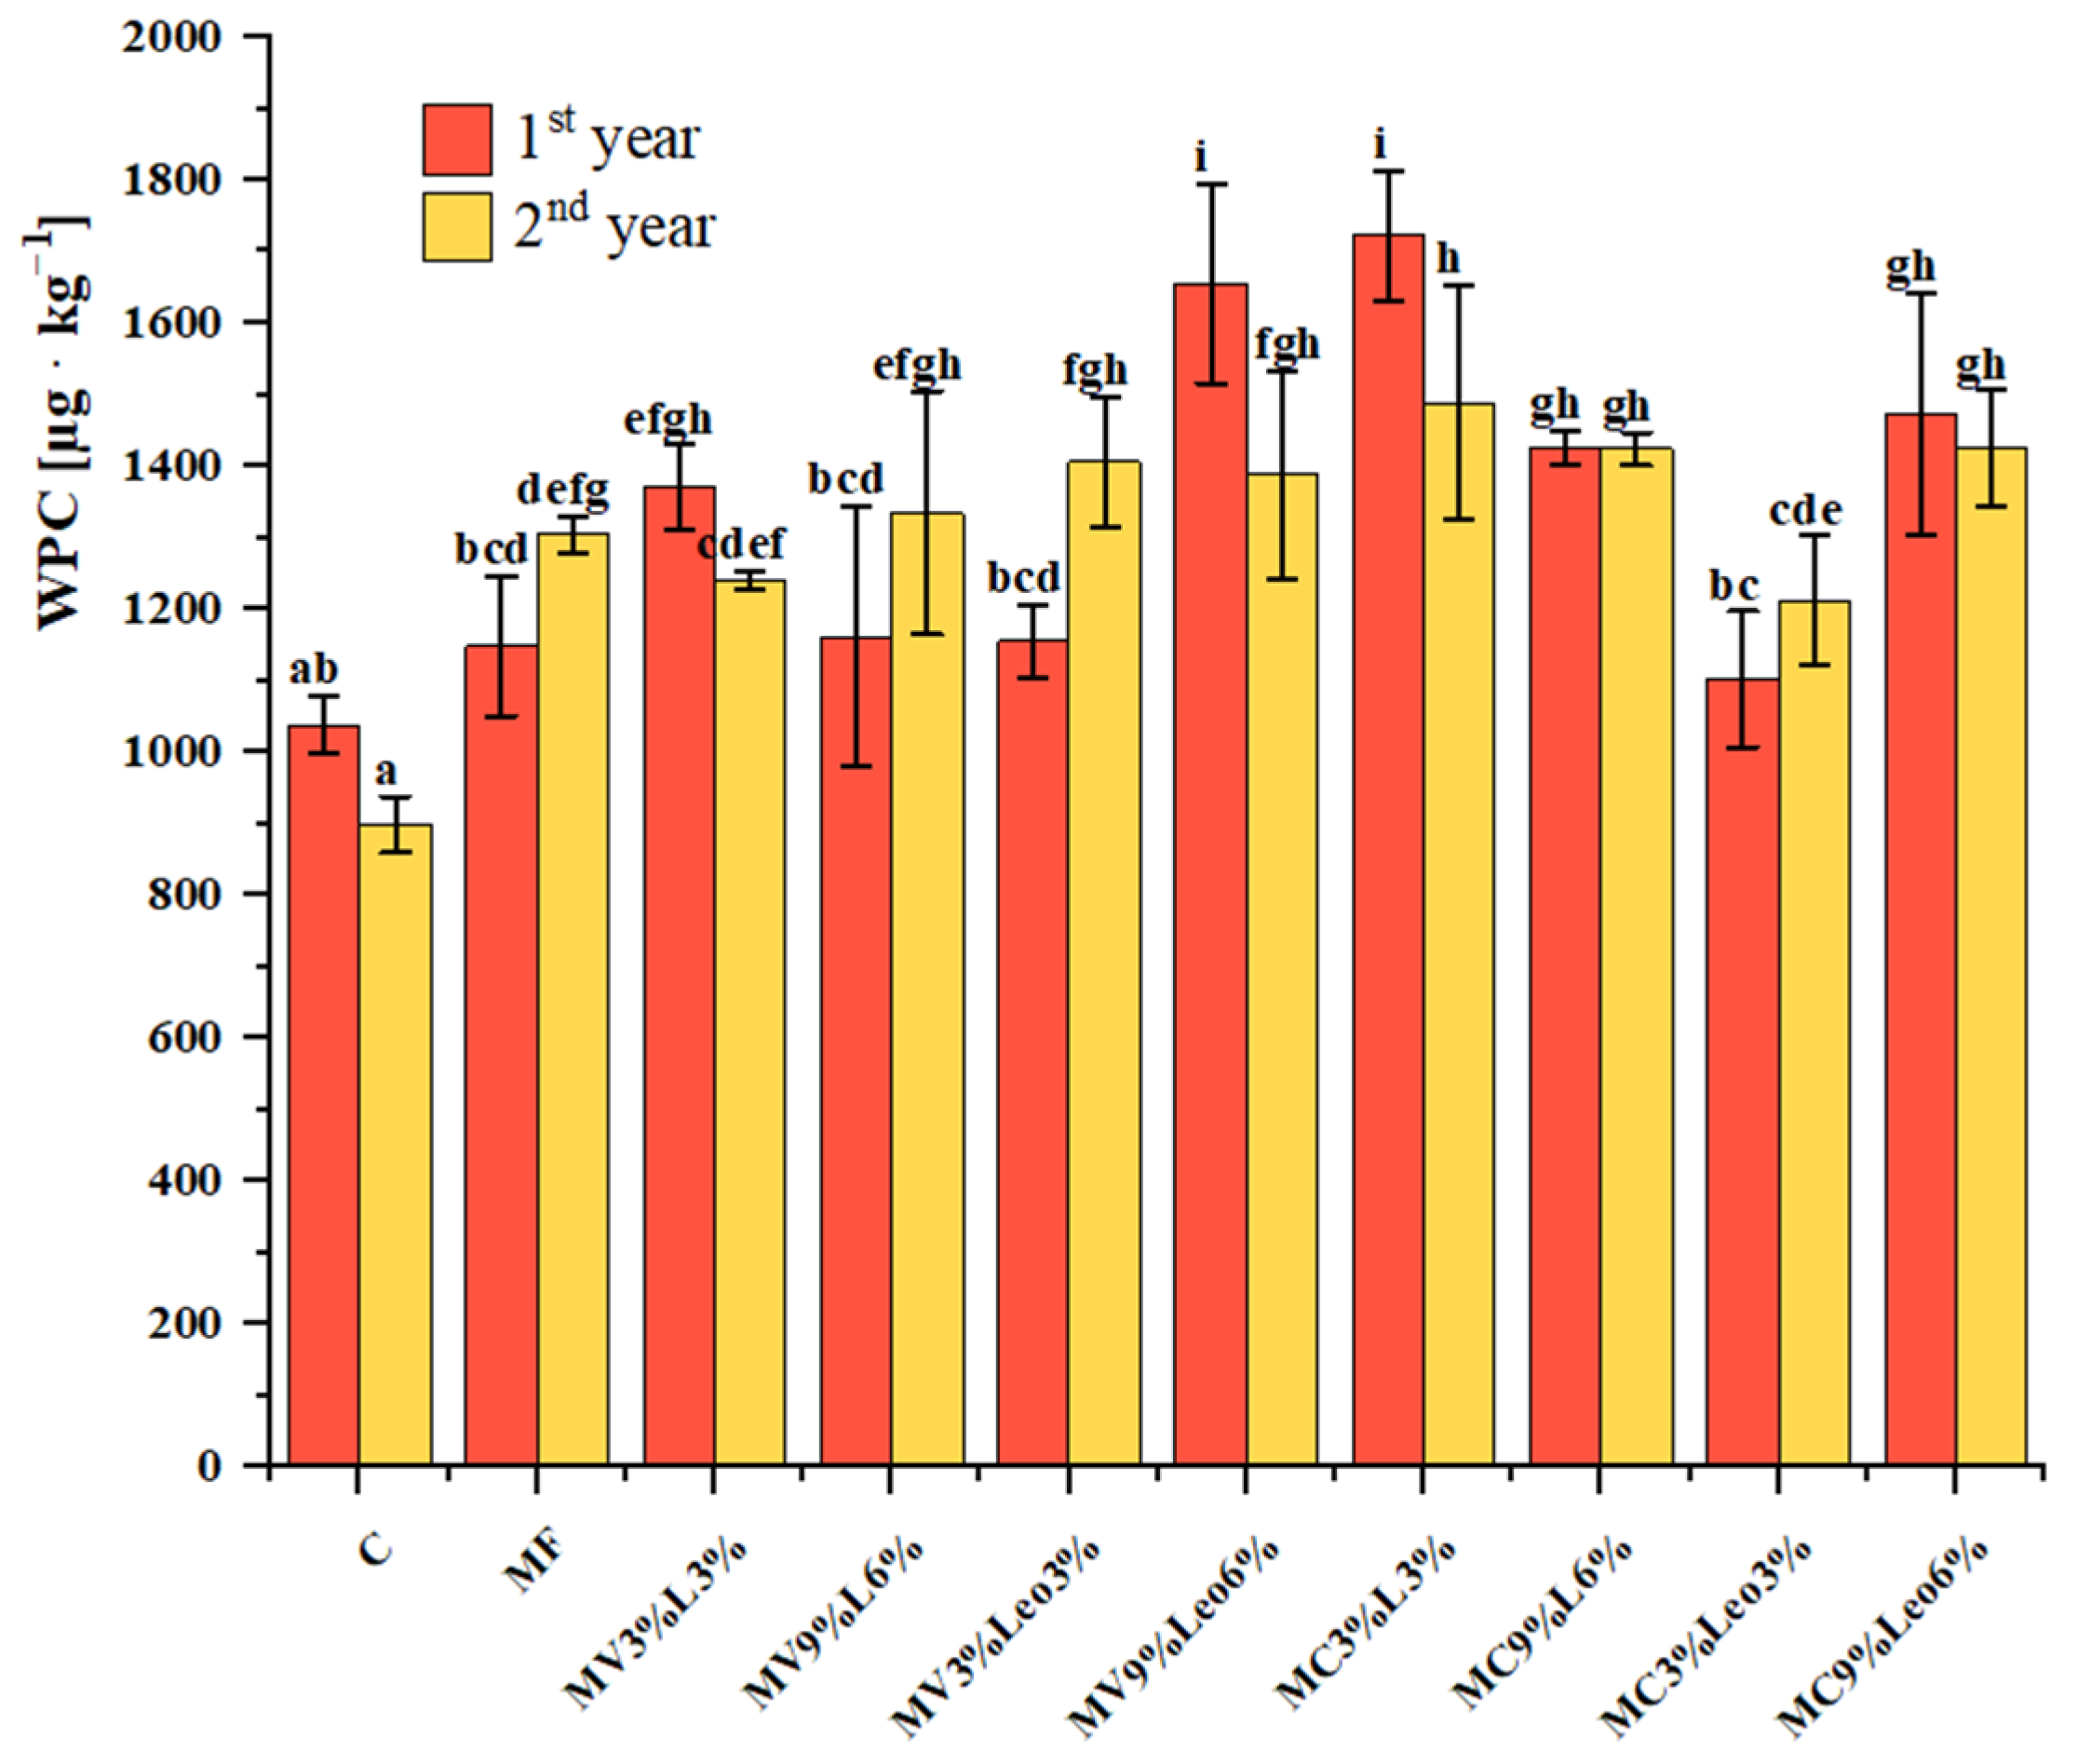
3.6. Water-Soluble Phenolic Compounds (WPC) in Soil

Phenolic compounds are crucial for the humification process of organic matter and are considered to be the major precursors of humic substances [57,58]. They occur in soil in soluble, absorbed, and polymerized forms and influence nutrient cycling and soil health. The results of our study indicate that mineral–organic mixtures significantly increased WPC levels, likely due to their acidifying effect on the soil. These findings are consistent with those reported by Min et al. [59]. The degradation and reactivity of phenols depend on their chemical structure and forms. Many phenolic compounds, including phenolic acids and tannins, are soluble in water. Microbial condensation and polymerization reactions of phenolic compounds with amino acids and proteins in the soil matrix result in the formation of higher molecular weight soil organic acids such as fulvic acids, humic acids, and humin. This humification process alters physicochemical processes in soils through modifications in soil health and qualitative characteristics [60]. Despite extensive research on phenols, there is ongoing debate regarding their transformations in soils and their impact on the rate of the soil organic matter decomposition. It is generally accepted that an elevated concentration of phenolic compounds in the soil solution reduces the intensity of soil organic matter decomposition, thereby promoting carbon sequestration and reducing carbon dioxide emissions. Our study revealed that the mineral–organic mixtures utilized had a substantial impact on the quantity of water-soluble phenolic compounds (WPC) (Figure 4). The WPC content determined after the first year of the experiment ranged from 1038 ± 40 μg · kg−1 in the control soil to 1722 ± 91 μg · kg−1 in the soil with the addition of MC3%L3%. However, after the second year, the determined values ranged from 899 ± 39 μg · kg−1 (treatment C) to 1489 ± 164 μg · kg−1 in the treatment with the addition of MC3%L3%. A reduction in WPC content after the second year was found in the treatments with the following additives: MV9%Leo6%, MC3%L3%, MV3%L3%, MC9%Leo6%, and C. In the remaining cases, the WPC content was higher or the same as in MC9%L6%.
The results showed that fertilization boosted the WPC content in both years of the study. The MC3%L3% and MV9%Leo6% treatments had the highest WPC content in both years, most likely due to the acidifying effect of these mixtures on the soil. Min et al. [59] reported that reducing soil pH increases the solubility of phenolic compounds and this relationship was confirmed in our study (Table 2, Figure 5). A positive correlation of WPC with CHA content and CHA:CFA ratio was also demonstrated (Figure 5). The conducted study is in agreement with literature reports where a decreasing proportion of phenolic compounds is observed with increasing degree of humification [58]. The content of phenolic compounds is also important in the context of heavy metal mobility [60]. An increase in WPC content compared to the control may suggest that the fertilizer mixtures used stimulated the production of phenols by plants or microorganisms.

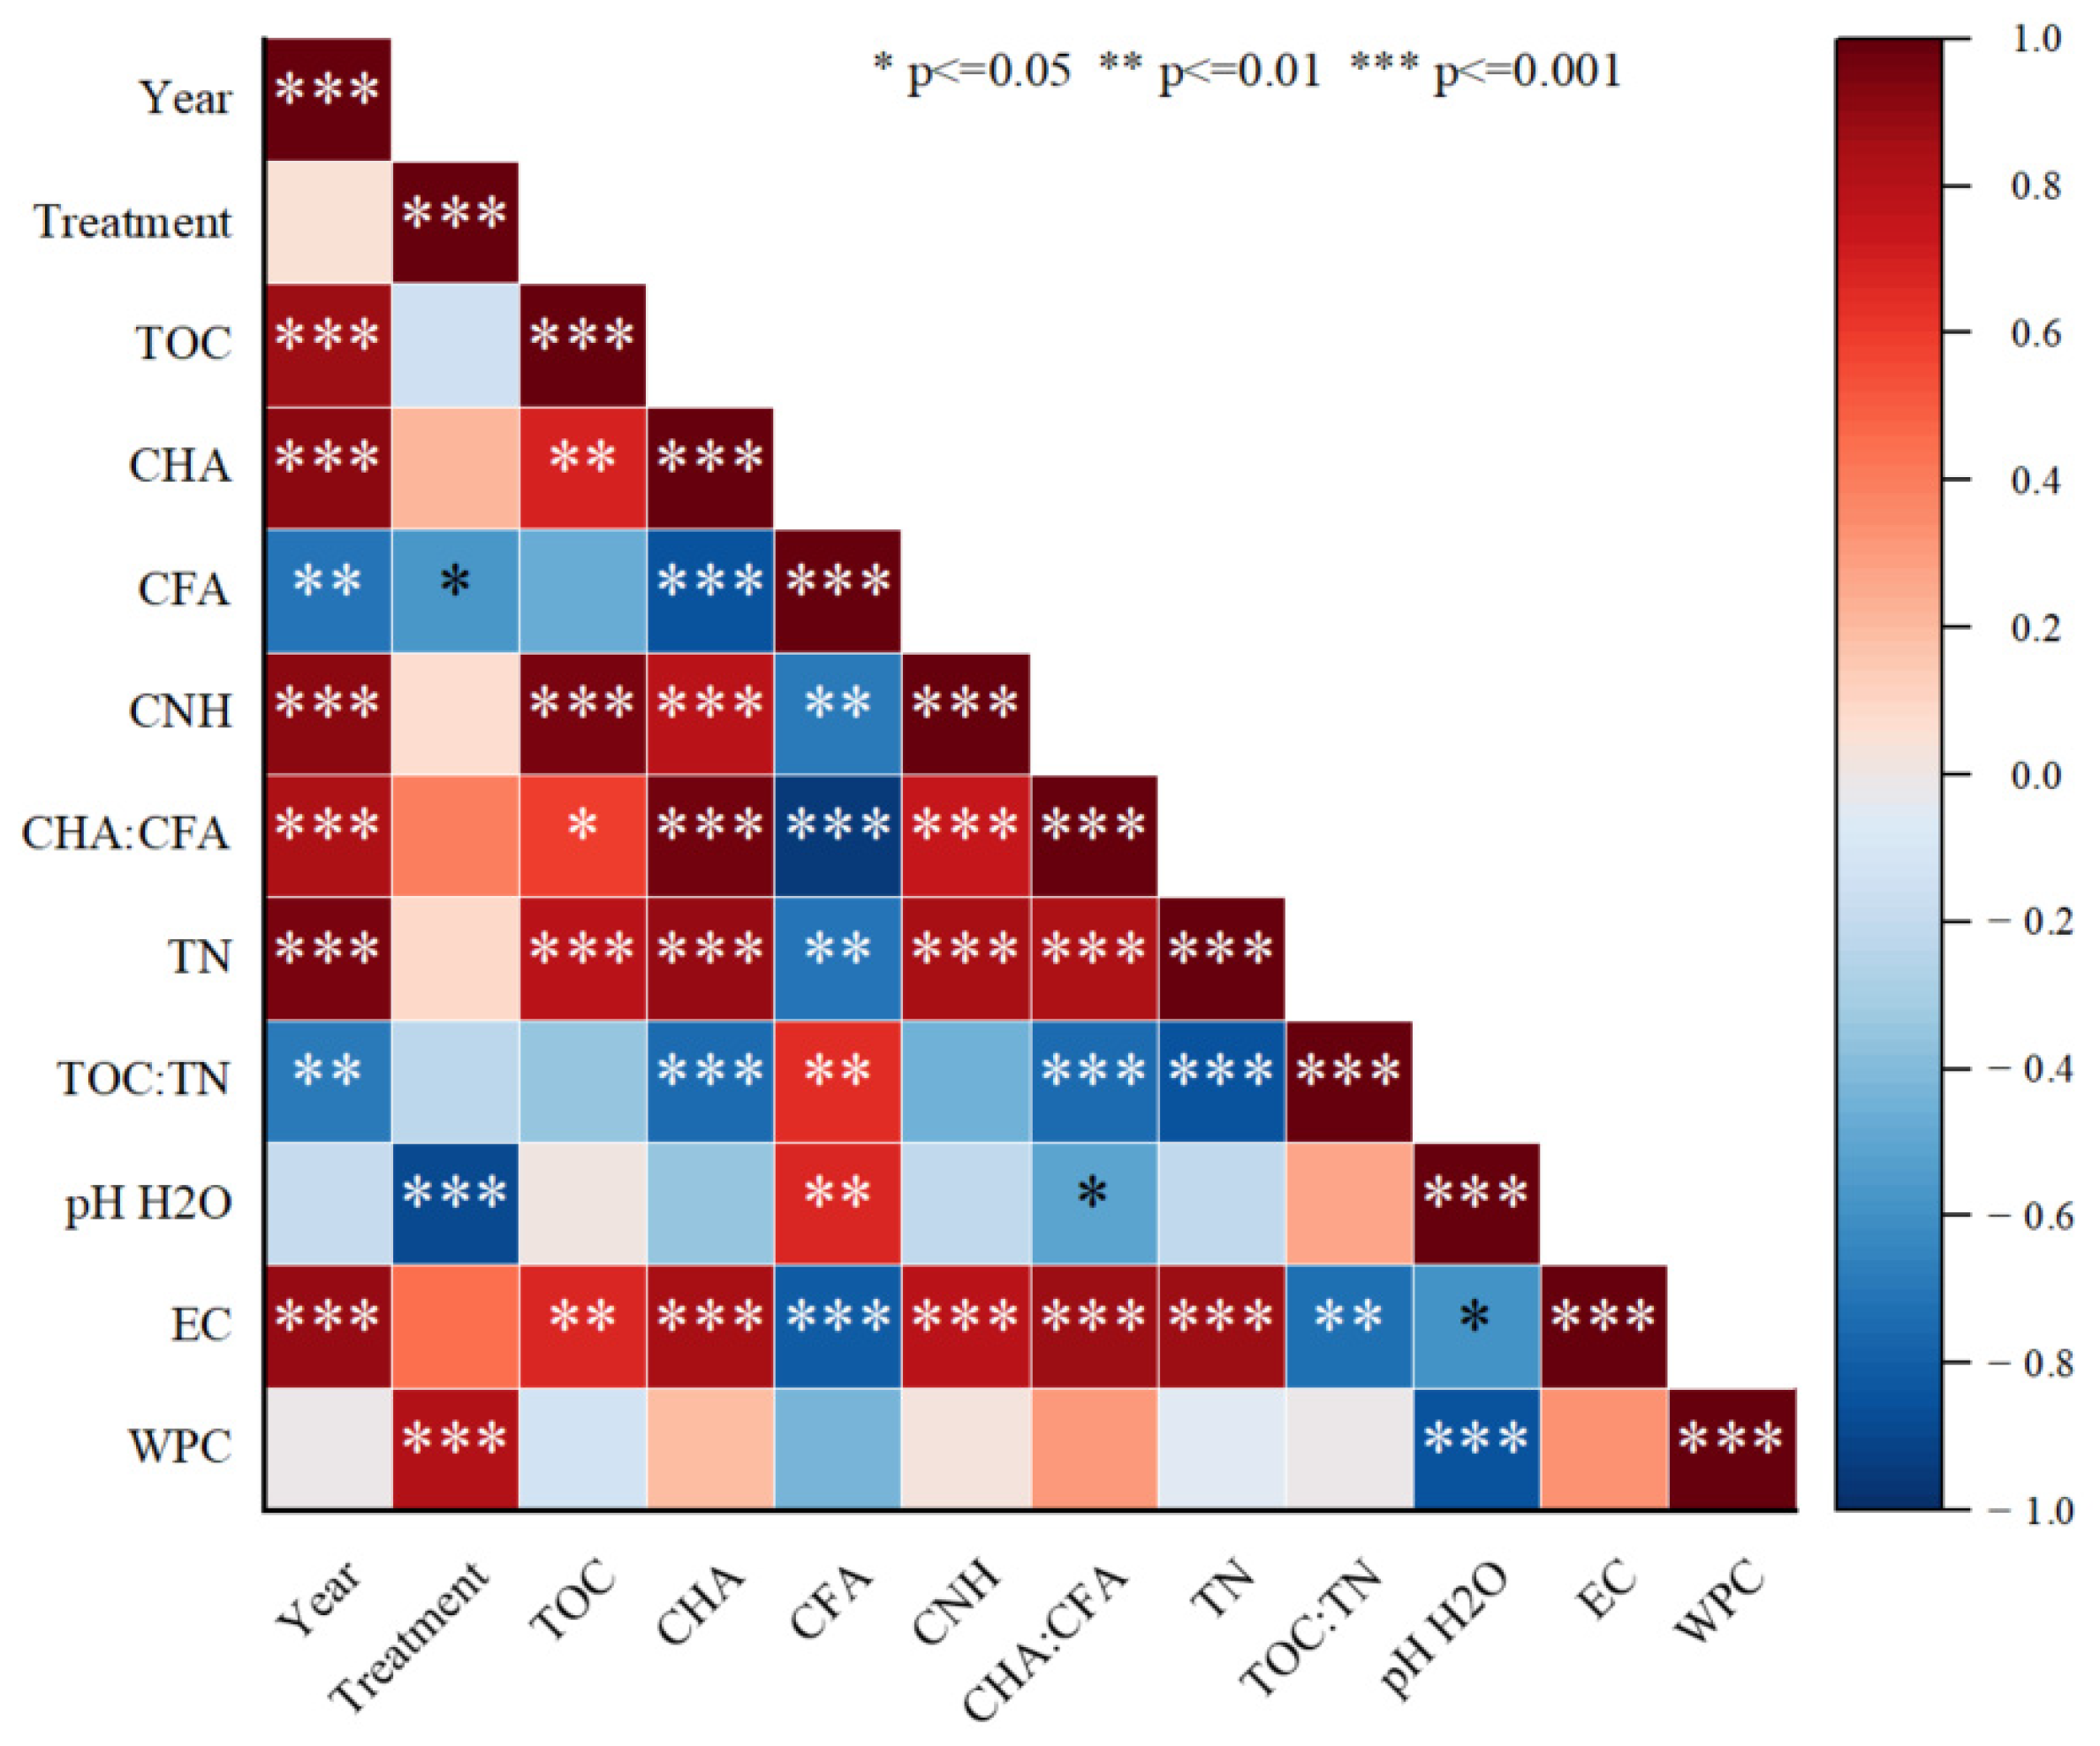
3.7. Pearson’s Correlation and Redundancy Analysis Among the Studied Parameters

The results of the statistical analysis, conducted using Pearson’s linear correlation, are presented in Figure 5. The analysis examined the relationship between the soil properties and the parameters under investigation, taking into account the year of the experiment and the type of treatment employed. A positive correlation was found between the year of the experiment and the determined values of TN, EC, TOC, CHA, and CNH. A notable negative relationship was observed between pH and EC. The Pearson’s correlation demonstrated the significant influence of mineral–organic mixtures on water-soluble phenolic compounds, emphasizing the role of fertilization and its impact on soil characteristics. The pH and EC values have important but different correlations with other parameters that may affect the mobility and availability of nutrients and contaminants in the soil. The chemical properties of the soil are significantly dependent on both the year of the experiment and the type of treatment used, which emphasizes the significant influence of fertilization on soil characteristics.

4. Future Perspective

Further studies should investigate the long-term effects of mineral–organic mixtures on soil health, crop yields, and greenhouse gas emissions. Assessing the economic feasibility of implementing these practices on a larger scale and under different environmental conditions would be valuable for promoting sustainable agriculture. In addition, understanding the mechanisms behind the observed changes in carbon fractions and humic substances will help to refine soil management strategies [61,62]. Further studies should address the specific mechanisms behind the observed interactions, providing deeper insights into the transformations of soil-phenolic compounds and their implications for soil health and fertility [60]. Moreover, it is recommended that the effects of mixtures incorporating zeolite composites, lignite, and leonardite on the properties, composition, and stability of soil organic matter under diverse climatic conditions be investigated, taking into account different soil types. Clearly, new and expanded research is needed to identify improvements in agricultural management practices and technologies that will contribute to increasing soil carbon stocks [49]. The results suggest that a combination of zeolite composites and organic additives (lignite/leonardite) may be a promising strategy for improving sandy soils. Under field conditions, their application would require doses adapted to the specific soil and cultivation system. Farmers are encouraged to integrate nutrient management by combining organic additives with inorganic fertilizers to improve the soil carbon pool and increase crop productivity in the long term. One of the main factors limiting the use of these additives on an industrial scale is their availability and the cost of production and transportation. Zeolites derived from fly ash can vary in composition depending on the source and require careful analysis before their agricultural use. The next recommended step is to carry out field experiments on different soil types to determine optimal application rates and methods. Further research should focus on the effects of additives on soil microbial composition, organic matter stability, and nutrient bioavailability.

5. Conclusions

Research on soil organic matter is important not only from a cognitive point of view, but also from the point of view of assessing soil health, fertility, and productivity. Our study showed that the introduction of new innovative mineral–organic mixtures into the soil resulted in an increase in the level of non-hydrolysable carbon, which suggests a greater stabilization of humic compounds and, at the same time, lower CO2 emissions. The mineral–organic mixtures used increased the organic carbon content of the soil after the second year of the experiment. In each of the treatments, regardless of the type of mixture used, the carbon content of fulvic acids was higher than the carbon content of humic acids. The values of CHA:CFA ratios obtained in all treatments after the second year of the study were higher compared to those obtained after the first year, with the greatest difference found in the soil with the addition of mixtures containing a double dose of organic additives. It was observed that the application of mineral and organic materials to the soil significantly increased the content of carbon and organic matter precursors in the soil, including phenolic compounds. After the application of mineral–organic mixtures, a positive trend in the qualitative composition of SOM was observed, as evidenced by changes in various functional groups identified by ATR-FTIR analysis. The results suggest that mineral–organic mixtures influence changes in specific functional groups present in the soil matrix compared to mineral fertilization alone. Analysis of the composition and quality of soil organic matter can be an important indicator of soil health. Further correlations of the obtained results with other soil properties will contribute to a comprehensive understanding of the interaction of various soil parameters. Our study showed that zeolites synthesized from fly ash can be a valuable addition to fertilizer mixtures and contribute to the improvement of soil properties.

Supplementary Materials

The following supporting information can be downloaded at: https://www.mdpi.com/article/10.3390/agriculture15070786/s1. Table S1. Chemical properties of components used for organic fertilizers formulation. Table S2. Monthly average temperature and humidity during the experiment.

Author Contributions

Conceptualization, R.J. and M.M.-H.; data curation, R.J. and R.B.; formal analysis, R.J., K.G., and M.M.-H.; funding acquisition, M.M.-H.; investigation, R.J., K.G., and M.M.-H.; methodology, R.J., K.G., R.B., and M.M.-H.; project administration, M.M.-H.; resources, R.J. and M.M.-H.; software, R.J., J.B.K., and A.H.L.; supervision, R.J. and M.M.-H.; visualization, R.J., J.B.K., and A.H.L.; writing—original draft, R.J. and M.M.-H.; writing—review and editing, R.J., J.B.K., K.G., R.B., L.M., A.H.L., and M.M.-H. All authors have read and agreed to the published version of the manuscript.

Funding

The “Fly ash as the precursors of functionalized materials for applications in environmental engineering, civil engineering and agriculture” no. POIR.04.04.00-00-14E6/18-00 project is carried out within the TEAM-NET program of the Foundation for Polish Science co-financed by the European Union under the European Regional Development Fund.

Institutional Review Board Statement

Not applicable.

Data Availability Statement

The original contributions presented in this study are included in the article/Supplementary Material. Further inquiries can be directed to the corresponding author.

Conflicts of Interest

The authors have no relevant financial or non-financial interests to disclose.

References

  1. Pandao, M.R.; Thakare, A.A.; Choudhari, R.J.; Navghare, N.R.; Sirsat, D.D.; Rathod, S.R. Soil Health and Nutrient Management. Int. J. Plant Soil Sci. 2024, 36, 873–883. [Google Scholar] [CrossRef]
  2. Bagnall, D.K.; Rieke, E.L.; Morgan, C.L.S.; Liptzin, D.L.; Cappellazzi, S.B.; Honeycutt, C.W. A Minimum Suite of Soil Health Indicators for North American Agriculture. Soil Secur. 2023, 10, 100084. [Google Scholar] [CrossRef]
  3. Maharjan, B.; Das, S.; Thapa, V.R.; Sharma Acharya, B. Soil Health Cycle. Agrosystems Geosci. Environ. 2024, 7, e20504. [Google Scholar] [CrossRef]
  4. Arriaga, F.J.; Guzman, J.; Lowery, B. Conventional Agricultural Production Systems and Soil Functions; Elsevier Inc.: Amsterdam, The Netherlands, 2017; ISBN 9780128054017. [Google Scholar]
  5. Wollenberg, E.; Vermeulen, S.J.; Girvetz, E.; Loboguerrero, A.M.; Ramirez-Villegas, J. Reducing Risks to Food Security from Climate Change. Glob. Food Secur. 2016, 11, 34–43. [Google Scholar] [CrossRef]
  6. Fróna, D.; Szenderák, J.; Harangi-Rákos, M. The Challenge of Feeding Theworld. Sustainability 2019, 11, 5816. [Google Scholar] [CrossRef]
  7. Yang, Q.; Zheng, F.; Jia, X.; Liu, P.; Dong, S.; Zhang, J.; Zhao, B. The Combined Application of Organic and Inorganic Fertilizers Increases Soil Organic Matter and Improves Soil Microenvironment in Wheat-Maize Field. J. Soils Sediments 2020, 20, 2395–2404. [Google Scholar] [CrossRef]
  8. Wolny-Koładka, K.; Jarosz, R.; Juda, M.; Mierzwa-Hersztek, M. Distinct Changes in Abundance of Culturable Microbial Community and Respiration Activities in Response to Mineral–Organic Mixture Application in Contaminated Soil. Sustainability 2022, 14, 15004. [Google Scholar] [CrossRef]
  9. Mondal, M.; Biswas, B.; Garai, S.; Sarkar, S.; Banerjee, H.; Brahmachari, K.; Bandyopadhyay, P.K.; Maitra, S.; Brestic, M.; Skalicky, M.; et al. Zeolites Enhance Soil Health, Crop Productivity and Environmental Safety. Agronomy 2021, 11, 448. [Google Scholar] [CrossRef]
  10. Ramesh, K.; Reddy, D.D. Zeolites and Their Potential Uses in Agriculture. In Advances in Agronomy; Elsevier: Amsterdam, The Netherlands, 2011; Volume 113, pp. 219–241. ISBN 9780123864734. [Google Scholar]
  11. Cataldo, E.; Salvi, L.; Paoli, F.; Fucile, M.; Masciandaro, G.; Manzi, D.; Masini, C.M.; Mattii, G.B. Application of Zeolites in Agriculture and Other Potential Uses: A Review. Agronomy 2021, 11, 1547. [Google Scholar] [CrossRef]
  12. Jarosz, R.; Szerement, J.; Gondek, K.; Mierzwa-Hersztek, M. The Use of Zeolites as an Addition to Fertilisers—A Review. Catena 2022, 213, 106125. [Google Scholar] [CrossRef]
  13. Megías-Sayago, C.; Bingre, R.; Huang, L.; Lutzweiler, G.; Wang, Q.; Louis, B. CO2 Adsorption Capacities in Zeolites and Layered Double Hydroxide Materials. Front. Chem. 2019, 7, 551. [Google Scholar] [CrossRef] [PubMed]
  14. Fan, Y.; Huang, R.; Liu, Q.; Cao, Q.; Guo, R. Synthesis of Zeolite A from Fly Ash and Its Application in the Slow Release of Urea. Waste Manag. 2023, 158, 47–55. [Google Scholar] [CrossRef] [PubMed]
  15. Liang, Z.; Liu, Z.; Yu, L.; Wang, W. Fly Ash-Based Zeolites: From Waste to Value—A Comprehensive Overview of Synthesis, Properties, and Applications. Chem. Eng. Res. Des. 2024, 212, 240–260. [Google Scholar] [CrossRef]
  16. Kim Thi Tran, C.; Rose, M.T.; Cavagnaro, T.R.; Patti, A.F. Lignite Amendment Has Limited Impacts on Soil Microbial Communities and Mineral Nitrogen Availability. Appl. Soil Ecol. 2015, 95, 140–150. [Google Scholar] [CrossRef]
  17. Akimbekov, N.S.; Digel, I.; Tastambek, K.T.; Sherelkhan, D.K.; Jussupova, D.B.; Altynbay, N.P. Low-Rank Coal as a Source of Humic Substances for Soil Amendment and Fertility Management. Agriculture 2021, 11, 1261. [Google Scholar] [CrossRef]
  18. Głąb, T.; Gondek, K.; Marcińska-Mazur, L.; Jarosz, R.; Mierzwa–Hersztek, M. Effect of Organic/Inorganic Composites as Soil Amendments on the Biomass Productivity and Root Architecture of Spring Wheat and Rapeseed. J. Environ. Manag. 2023, 344, 118628. [Google Scholar] [CrossRef]
  19. Głąb, T.; Jarosz, R.; Gondek, K.; Mierzwa-Hersztek, M. Maize Root Architecture and Biomass Productivity after Application of Organic and Inorganic Additives in Contaminated Soil. Ecol. Chem. Eng. 2024, 31, 75–87. [Google Scholar] [CrossRef]
  20. Dubey, A.; Mailapalli, D.R. Zeolite Coated Urea Fertilizer Using Different Binders: Fabrication, Material Properties and Nitrogen Release Studies. Environ. Technol. Innov. 2019, 16, 100452. [Google Scholar] [CrossRef]
  21. Nan, J.; Chen, X.; Chen, C.; Lashari, M.S.; Deng, J.; Du, Z. Impact of Flue Gas Desulfurization Gypsum and Lignite Humic Acid Application on Soil Organic Matter and Physical Properties of a Saline-Sodic Farmland Soil in Eastern China. J. Soils Sediments 2016, 16, 2175–2185. [Google Scholar] [CrossRef]
  22. Wolny-Koładka, K.; Marcińska-Mazur, L.; Jarosz, R.; Juda, M.; Lošák, T.; Mierzwa-Hersztek, M. Effect of Soil Application of Zeolite-Carbon Composite, Leonardite and Lignite on the Microorganisms. Ecol. Chem. Eng. 2022, 29, 553–563. [Google Scholar] [CrossRef]
  23. Wolny-Koładka, K.; Jarosz, R.; Marcińska-Mazur, L.; Gondek, K.; Lahori, A.H.; Szara-Bąk, M.; Lošák, T.; Szerement, J.; Mokrzycki, J.; Karcz, R.; et al. The Impact of Mineral and Organic Supplements on the Abundance of Selected Groups of Culturable Microorganisms in Soil Contaminated with Heavy Metals. J. Elem. 2023, 28, 595–617. [Google Scholar] [CrossRef]
  24. Chen, Z.; Huang, G.; Li, Y.; Zhang, X.; Xiong, Y.; Huang, Q.; Jin, S. Effects of the Lignite Bioorganic Fertilizer on Greenhouse Gas Emissions and Pathways of Nitrogen and Carbon Cycling in Saline-Sodic Farmlands at Northwest China. J. Clean. Prod. 2022, 334, 130080. [Google Scholar] [CrossRef]
  25. Akimbekov, N.; Qiao, X.; Digel, I.; Abdieva, G.; Ualieva, P.; Zhubanova, A. The Effect of Leonardite-Derived Amendments on Soil Microbiome Structure and Potato Yield. Agriculture 2020, 10, 147. [Google Scholar] [CrossRef]
  26. Ratanaprommanee, C.; Chinachanta, K.; Chaiwan, F.; Shutsrirung, A. Chemical Characterization of Leonardite and Its Potential Use as Soil Conditioner and Plant Growth Enhancement. Asia-Pac. J. Sci. Technol. 2017, 22, 1–10. [Google Scholar]
  27. IUSS Working Group WRB IUSS Working Group WRB. World Reference Base for Soil Resources. In International Soil Classification System for Naming Soils and Creating Legends for Soil Maps, 4th ed.; International Union of Soil Sciences: Vienna, Austria, 2022; Volume 13, ISBN 9798986245119. [Google Scholar]
  28. Mokrzycki, J.; Franus, W.; Panek, R.; Sobczyk, M.; Rusiniak, P.; Szerement, J.; Jarosz, R.; Marcińska-Mazur, L.; Bajda, T.; Mierzwa-Hersztek, M. Zeolite Composite Materials from Fly Ash: An Assessment of Physicochemical and Adsorption Properties. Materials 2023, 16, 2142. [Google Scholar] [CrossRef]
  29. Szerement, J.; Jurek, K.; Mokrzycki, J.; Jarosz, R.; Oleszczuk, P.; Mierzwa-Hersztek, M. Zeolite Composites from Fly Ashes Mixed with Leonardite as a Useful Addition to Fertilizer for Accelerating the PAHs Degradation in Soil. Soil Tillage Res. 2023, 230, 105701. [Google Scholar] [CrossRef]
  30. Zhang, H.; Dang, Z.; Zheng, L.C.; Yi, X.Y. Remediation of Soil Co-Contaminated with Pyrene and Cadmium by Growing Maize (Zea Mays L.). Int. J. Environ. Sci. Technol. 2009, 6, 249–258. [Google Scholar] [CrossRef]
  31. Salam, A.K.; Rizki, D.O.; Santa, I.T.D.; Supriatin, S.; Septiana, L.M.; Sarno, S.; Niswati, A. The Biochar-Improved Growth-Characteristics of Corn ( Zea Mays L.) in a 22-Years Old Heavy-Metal Contaminated Tropical Soil. In IOP Conference Series: Earth and Environmental Science; IOP Publishing: Bristol, UK, 2022; Volume 1034. [Google Scholar] [CrossRef]
  32. Kalembasa, S. Quick Method of Determination of Organic Carbon in Soil. Pol. J. Soil Sci. 1991, 24, 17–22. [Google Scholar]
  33. Guo, L.B.; Gifford, R.M. Soil Carbon Stocks and Land Use Change: A Meta Analysis. Glob. Change Biol. 2002, 8, 345–360. [Google Scholar] [CrossRef]
  34. Garcia-Pausas, J.; Rabissi, A.; Rovira, P.; Romanyà, J. Organic Fertilisation Increases C and N Stocks and Reduces Soil Organic Matter Stability in Mediterranean Vegetable Gardens. Land Degrad. Dev. 2017, 28, 691–698. [Google Scholar] [CrossRef]
  35. Jarosz, R.; Mierzwa-Hersztek, M.; Gondek, K.; Kopeć, M.; Lošák, T.; Marcińska-Mazur, L. Changes in Quantity and Quality of Organic Matter in Soil after Application of Poultry Litter and Poultry Litter Biochar—5-Year Field Experiment. Biomass Convers. Biorefinery 2022, 12, 2925–2934. [Google Scholar] [CrossRef]
  36. Spaccini, R.; Piccolo, A.; Conte, P.; Haberhauer, G.; Gerzabek, M.H. Increased Soil Organic Carbon Sequestration through Hydrophobic Protection by Humic Substances. Soil Biol. Biochem. 2002, 34, 1839–1851. [Google Scholar] [CrossRef]
  37. Aziz, Y.; Shah, G.A.; Rashid, M.I. ZnO Nanoparticles and Zeolite Influence Soil Nutrient Availability but Do Not Affect Herbage Nitrogen Uptake from Biogas Slurry. Chemosphere 2019, 216, 564–575. [Google Scholar] [CrossRef] [PubMed]
  38. Naz, M.; Akhtar, K.; Khan, A.; Nizamani, G.S. Agricultural Practices Can Reduce Soil Greenhouse Gas Emissions: Challenges and Future Perspectives. In Engineering Tolerance in Crop Plants Against Abiotic Stress; CRC Press: Boca Raton, FL, USA, 2021; pp. 263–274. ISBN 9781000462135. [Google Scholar]
  39. Brust, G.E. Management Strategies for Organic Vegetable Fertility; Elsevier Inc.: Amsterdam, The Netherlands, 2019; ISBN 9780128120606. [Google Scholar]
  40. Paul, E.A. The Nature and Dynamics of Soil Organic Matter: Plant Inputs, Microbial Transformations, and Organic Matter Stabilization. Soil Biol. Biochem. 2016, 98, 109–126. [Google Scholar] [CrossRef]
  41. Gaffney, J.S.; Marley, N.A.; Clark, S.B. Humic and Fulvic Acids and Organic Colloidal Materials in the Environment. In ACS Symposium Series; American Chemical Society: Washington, DC, USA, 1996; Volume 651. [Google Scholar] [CrossRef]
  42. Truc, M.T.; Yoshida, M. Effect of Zeolite on the Decomposition Resistance of of Organic Matter in Tropical Soils under Global Warming. Int. J. Environ. Chem. Ecol. Geol. Geophys. Eng. 2011, 5, 664–668. [Google Scholar]
  43. Doni, S.; Gispert, M.; Peruzzi, E.; Macci, C.; Mattii, G.B.; Manzi, D.; Masini, C.M.; Grazia, M. Impact of Natural Zeolite on Chemical and Biochemical Properties of Vineyard Soils. Soil Use Manag. 2021, 37, 832–842. [Google Scholar] [CrossRef]
  44. Zhang, B.; Xu, C.; Zhang, Z.; Hu, C.; He, Y.; Huang, K.; Pang, Q.; Hu, G. Response of Soil Organic Carbon and Its Fractions to Natural Vegetation Restoration in a Tropical Karst Area, Southwest China. Front. For. Glob. Change 2023, 6, 1172062. [Google Scholar] [CrossRef]
  45. Murindangabo, Y.T.; Kopecký, M.; Konvalina, P.; Ghorbani, M.; Perná, K.; Nguyen, T.G.; Bernas, J.; Baloch, S.B.; Hoang, T.N.; Eze, F.O.; et al. Quantitative Approaches in Assessing Soil Organic Matter Dynamics for Sustainable Management. Agronomy 2023, 13, 1776. [Google Scholar] [CrossRef]
  46. The World Bank Enhancing Carbon Stocks and Reducing CO2 Emissions in Agriculture and Natural Resource Management Projects; World Bank: Washington, DC, USA, 2012.
  47. Amoah-Antwi, C.; Kwiatkowska-Malina, J.; Thornton, S.F.; Fenton, O.; Malina, G.; Szara, E. Restoration of Soil Quality Using Biochar and Brown Coal Waste: A Review. Sci. Total Environ. 2020, 722, 137852. [Google Scholar]
  48. Zhang, W.; Xu, M.; Wang, X.; Huang, Q.; Nie, J.; Li, Z.; Li, S.; Hwang, S.W.; Lee, K.B. Effects of Organic Amendments on Soil Carbon Sequestration in Paddy Fields of Subtropical China. J. Soils Sediments 2012, 12, 457–470. [Google Scholar] [CrossRef]
  49. Singh, B.P.; Setia, R.; Wiesmeier, M.; Kunhikrishnan, A. Agricultural Management Practices and Soil Organic Carbon Storage; Elsevier Inc.: Amsterdam, The Netherlands, 2018; ISBN 9780128127667. [Google Scholar]
  50. Rutkowska, A.; Piku, D. Effect of Crop Rotation and Nitrogen Fertilization on the Quality and Quantity of Soil Organic Matter. Soil Process. Curr. Trends Qual. Assess. 2013, 249, 267. [Google Scholar] [CrossRef]
  51. Pradhan, S.; Hedberg, J.; Rosenqvist, J.; Jonsson, C.M.; Wold, S.; Blomberg, E.; Wallinder, I.O. Influence of Humic Acid and Dihydroxy Benzoic Acid on the Agglomeration, Adsorption, Sedimentation and Dissolution of Copper, Manganese, Aluminum and Silica Nanoparticles-A Tentative Exposure Scenario. PLoS ONE 2018, 13, e0192553. [Google Scholar] [CrossRef] [PubMed]
  52. Volkov, D.S.; Rogova, O.B.; Proskurnin, M.A. Organic Matter and Mineral Composition of Silicate Soils: FTIR Comparison Study by Photoacoustic, Diffuse Reflectance, and Attenuated Total Reflection Modalities. Agronomy 2021, 11, 1879. [Google Scholar] [CrossRef]
  53. Volkov, D.S.; Krivoshein, P.K.; Proskurnin, M.A. Detonation Nanodiamonds: A Comparison Study by Photoacoustic, Diffuse Reflectance, and Attenuated Total Reflection Ftir Spectroscopies. Nanomaterials 2020, 10, 2501. [Google Scholar] [CrossRef]
  54. Dudek, M.; Kabała, C.; Łabaz, B.; Mituła, P.; Bednik, M.; Medyńska-Juraszek, A. Mid-Infrared Spectroscopy Supports Identification of the Origin of Organic Matter in Soils. Land 2021, 10, 215. [Google Scholar] [CrossRef]
  55. Mylotte, R.; Verheyen, V.; Reynolds, A.; Dalton, C.; Patti, A.F.; Chang, R.R.; Burdon, J.; Hayes, M.H.B. Isolation and Characterisation of Recalcitrant Organic Components from an Estuarine Sediment Core. J. Soils Sediments 2015, 15, 211–224. [Google Scholar] [CrossRef]
  56. Müller, C.M.; Pejcic, B.; Esteban, L.; Piane, C.D.; Raven, M.; Mizaikoff, B. Infrared Attenuated Total Reflectance Spectroscopy: An Innovative Strategy for Analyzing Mineral Components in Energy Relevant Systems. Sci. Rep. 2014, 4, 6764. [Google Scholar] [CrossRef]
  57. Mierzwa-Hersztek, M.; Gondek, K.; Nawrocka, A.; Pińkowska, H.; Bajda, T.; Stanek-Tarkowska, J.; Szostek, M. FT-IR Analysis and the Content of Phenolic Compounds in Exogenous Organic Matter Produced from Plant Biomass. J. Elem. 2019, 24, 879–896. [Google Scholar] [CrossRef]
  58. Ziolkowska, A.; Debska, B.; Banach-Szott, M. Transformations of Phenolic Compounds in Meadow Soils. Sci. Rep. 2020, 10, 19330. [Google Scholar] [CrossRef]
  59. Min, K.; Freeman, C.; Kang, H.; Choi, S.U. The Regulation by Phenolic Compounds of Soil Organic Matter Dynamics under a Changing Environment. BioMed Res. Int. 2015, 2015, 825098. [Google Scholar] [CrossRef]
  60. Misra, D.; Dutta, W.; Jha, G.; Ray, P. Interactions and Regulatory Functions of Phenolics in Soil-Plant-Climate Nexus. Agronomy 2023, 13, 280. [Google Scholar] [CrossRef]
  61. Liptzin, D.; Norris, C.E.; Cappellazzi, S.B.; Mac Bean, G.; Cope, M.; Greub, K.L.H.; Rieke, E.L.; Tracy, P.W.; Aberle, E.; Ashworth, A.; et al. An Evaluation of Carbon Indicators of Soil Health in Long-Term Agricultural Experiments. Soil Biol. Biochem. 2022, 172, 108708. [Google Scholar] [CrossRef]
  62. Rubin, R.; Oldfield, E.; Lavallee, J.; Griffin, T.; Mayers, B.; Sanderman, J. Climate Mitigation through Soil Amendments: Quantification, Evidence, and Uncertainty. Carbon Manag. 2023, 14, 2217785. [Google Scholar] [CrossRef]
Figure 1. Humic compound fractions in the soil after the first and second years of the experiment; ±standard deviation (SD), n = 4; means labeled with the same letters do not differ significantly according to Duncan’s test at significance level of p ≤ 0.05. Factor: treatment × year.
Agriculture 15 00786 g001
Figure 2. Soil carbon stocks (ZC) in the soil after the first and second years of the experiment; ±standard deviation (SD), n = 4; means labeled with the same letters do not differ significantly according to Duncan’s test at significance level of p ≤ 0.05. Factor: treatment × year.
Agriculture 15 00786 g002
Figure 3. ATR-FTIR spectra of soil samples from individual treatments in the range of 1600–400 cm−1.
Agriculture 15 00786 g003
Figure 4. Content of water-soluble phenolic compounds (WPC) in the soil after the 1first and second years of the experiment; ±standard deviation (SD), n = 4; means labeled with the same letters do not differ significantly according to Duncan’s test at significance level of p ≤ 0.05. Factor: treatment × year.
Agriculture 15 00786 g004
Figure 5. Pearson’s correlation between carbon fractions, soil chemical properties, treatment, and year of the experiment. Positive correlations are represented by brown color and negative correlation are represented by navy blue color. * indicates 0.01 < p ≤ 0.05, ** indicates 0.001 < p ≤ 0.01, *** indicates p ≤ 0.001; TOC—total organic carbon; CHA—humic acid carbon; CFA—fulvic acid carbon; CNH—non-hydrolyzing carbon fraction; CHA:CFA—ratio; TN—total nitrogen content; TOC:TN—ratio; pH H2O—pH determined in water; EC—electrical conductivity; WPC—water-soluble phenolic compounds.
Agriculture 15 00786 g005
Table 1. Description of experimental treatments.
SymbolTreatment Description
CControl soil without any additivities
MFSoil with addition of only mineral (NPK) fertilization
MV3%L3%Soil with 94% NPK, 3% zeolite–vermiculite composite and 3% lignite
MV9%L6%Soil with 85% NPK, 9% zeolite–vermiculite composite and 6% lignite
MV3%Leo3%Soil with 94% NPK, 3% zeolite–vermiculite composite and 3% leonardite
MV9%Leo6%Soil with 85% NPK, 9% zeolite–vermiculite composite and 6% leonardite
MC3%L3%Soil with 94% NPK, 3% zeolite–carbon composite and 3% lignite
MC9%L6%Soil with 85% NPK, 9% zeolite–carbon composite and 6% lignite
MC3%Leo3%Soil with 94% NPK, 3% zeolite–carbon composite and 3% leonardite
MC9%Leo6%Soil with 85% NPK, 9% zeolite–carbon composite and 6% leonardite
Table 2. The pH and EC values in the soil following the first and second year of the experiment.
TreatmentpH 1st YearpH 2nd YearEC 1st Year
µS · cm−1
EC 2nd Year
µS · cm−1
T 1st Year mmol(+) · kg−1T 2nd Year mmol(+) · kg−1
C5.91 d ± 0.105.97 d ± 0.12365.8 a ± 58.6341.3 a ± 9.2106.5 c ± 1.8129.8 d ± 5.1
MF5.28 abc ± 0.065.34 c ± 0.16426.7 b ± 46.9762.7 j ± 20.893.7 a ± 3.6137.6 ef ± 3.2
MV3%L3%5.22 abc ± 0.125.17 abc ± 0.13564.7 g ± 53.3709.5 i ± 15.194.6 a ± 1.3133.3 def ± 1.8
MV9%L6%5.30 abc ± 0.075.25 abc ± 0.18330.3 a ± 14.6640.7 h ± 49.1100.7 abc ± 3.8131.1 de ± 0.8
MV3%Leo3%5.31 bc ± 0.165.24 abc ± 0.13525.5 efg ± 28.2699.3 i ± 52.999.6 abc ± 2.9131.9 def ± 1.8
MV9%Leo6%5.23 abc ± 0.055.09 a ± 0.14499.5 def ± 55.11111.7 l ± 33.0101.9 bc ± 3.9132.0 def ± 1.0
MC3%L3%5.12 ab ± 0.125.15 abc ± 0.13544.3 fg ± 11.8708.3 ij ± 23.894.4 a ± 3.7131.7 def ± 5.2
MC9%L6%5.24 abc ± 0.065.27 abc ± 0.18448.7 bcd ± 4.2698.0 i ± 43.699.0 ab ± 4.0138.5 f ± 5.6
MC3%Leo3%5.25 abc ± 0.165.10 a ± 0.05441.0 bcd ± 9.11263.3 m ± 62.7104.8 bc ± 3.4138.4 f ± 4.0
MC9%Leo6%5.27 abc ± 0.055.15 abc ± 0.13484.0 cde ± 18.0824.5 k ± 19.6100.4 abc ± 9.1126.6 d ± 9.0
EC—electric conductivity; T—total cation sorption capacity. ±—standard deviation (SD); n = 4; means labeled with the same letters do not differ significantly according to Duncan’s test at significance level of p ≤0.05. Factors: treatment × year.
Table 3. The content of soil organic carbon (TOC), total nitrogen (TN), and the TOC:TN ratio in soil after the first and the second year of the experiment.
TreatmentTOC
1st Year
TOC
2nd Year
TN
1st Year
TN
2nd Year
TOC:TN
1st Year
TOC:TN
2nd Year
g · kg−1 DMg · kg−1 DMg · kg−1 DMg · kg−1 DM
C6.12 abcdefgh ± 0.446.23 gh ± 0.810.477 bc ± 0.0500.512 cd ± 0.04112.9 abcde ± 1.513.4 abcde ± 1.5
MF5.61 abcd ± 0.366.42 defgh ± 0.410.435 abc ± 0.0820.449 abc ± 0.09314.3 bcde ± 2.315.0 cde ± 4.6
MV3%L3%5.13 a ± 0.285.57 abcd ± 0.130.402 ab ± 0.0620.585 de ± 0.04812.8 abcd ± 0.79.6 a ± 1.0
MV9%L6%5.87 abcdef ± 0.296.72 efg ± 0.330.401 ab ± 0.0820.524 cde ± 0.05515.0 cde ± 2.813.0 abcde ± 2.1
MV3%Leo3%5.27 abc ± 0.736.82 gh ± 0.240.376 a ± 0.0510.509 cd ± 0.06314.2 bcde ± 2.713.5 bcde ± 1.7
MV9%Leo6%6.17 cdefgh ± 0.346.52 efgh ± 0.890.377 a ± 0.0500.609 e ± 0.06216.6 e ± 2.710.7 ab ± 0.5
MC3%L3%5.73 abcde ± 0.566.84 gh ± 0.400.377 a ± 0.0960.525 cde ± 0.05015.7 de ± 2.813.1 abcde ± 1.2
MC9%L6%5.94 abcdefg ± 0.646.87 h ± 0.190.452 abc ± 0.0580.595 de ± 0.03213.2 abcde ± 0.511.6 abc ± 0.8
MC3%Leo3%5.14 a ± 0.356.86 h ± 0.660.401 ab ± 0.0040.595 de ± 0.06912.8 abcd ± 0.911.7 abc ± 2.4
MC9%Leo6%5.24 ab ± 0.816.06 bcdefgh ± 0.940.402 ab ± 0.0500.515 cd ± 0.02914.3 bcde ± 4.311.8 abc ± 1.6
±standard deviation (SD), n = 4; means labeled with the same letters do not differ significantly according to Duncan’s test at significance level of p ≤0.05. Factor: treatment × year.
Table 4. The CHA:CFA ratio in the soil after the first and second years of the experiment.
CHA:CFA
Treatment1st year2nd year
C0.260 abc ± 0.0600.293 abcd ± 0.039
MF0.165 a ± 0.0180.463 def ± 0.055
MV3%L3%0.294 abcd ± 0.1260.536 f ± 0.163
MV9%L6%0.264 abc ± 0.1470.362 bcde ± 0.033
MV3%Leo3%0.239 ab ± 0.1360.458 def ± 0.152
MV9%Leo6%0.176 a ± 0.0300.413 bcdef ± 0.060
MC3%L3%0.420 cdef ± 0.0690.475 ef ± 0.132
MC9%L6%0.316 abcde ± 0.0380.464 def ± 0.048
MC3%Leo3%0.355 bcde ± 0.1450.399 bcdef ± 0.081
MC9%Leo6%0.263 abc ± 0.0210.489 ef ± 0.207
±standard deviation (SD), n = 4; means labeled with the same letters do not differ significantly according to Duncan’s test at significance level of p ≤ 0.05. Factor: treatment × year.
Disclaimer/Publisher’s Note: The statements, opinions and data contained in all publications are solely those of the individual author(s) and contributor(s) and not of MDPI and/or the editor(s). MDPI and/or the editor(s) disclaim responsibility for any injury to people or property resulting from any ideas, methods, instructions or products referred to in the content.

