
Whole-Genome Identification and Analysis of Carbohydrate Esterase Gene Family in Colletotrichum graminicola


Abstract
1. Introduction
2. Results
2.1. Identification of CE Genes and Analysis of Their Physicochemical Properties
2.2. Phylogenetic Analysis
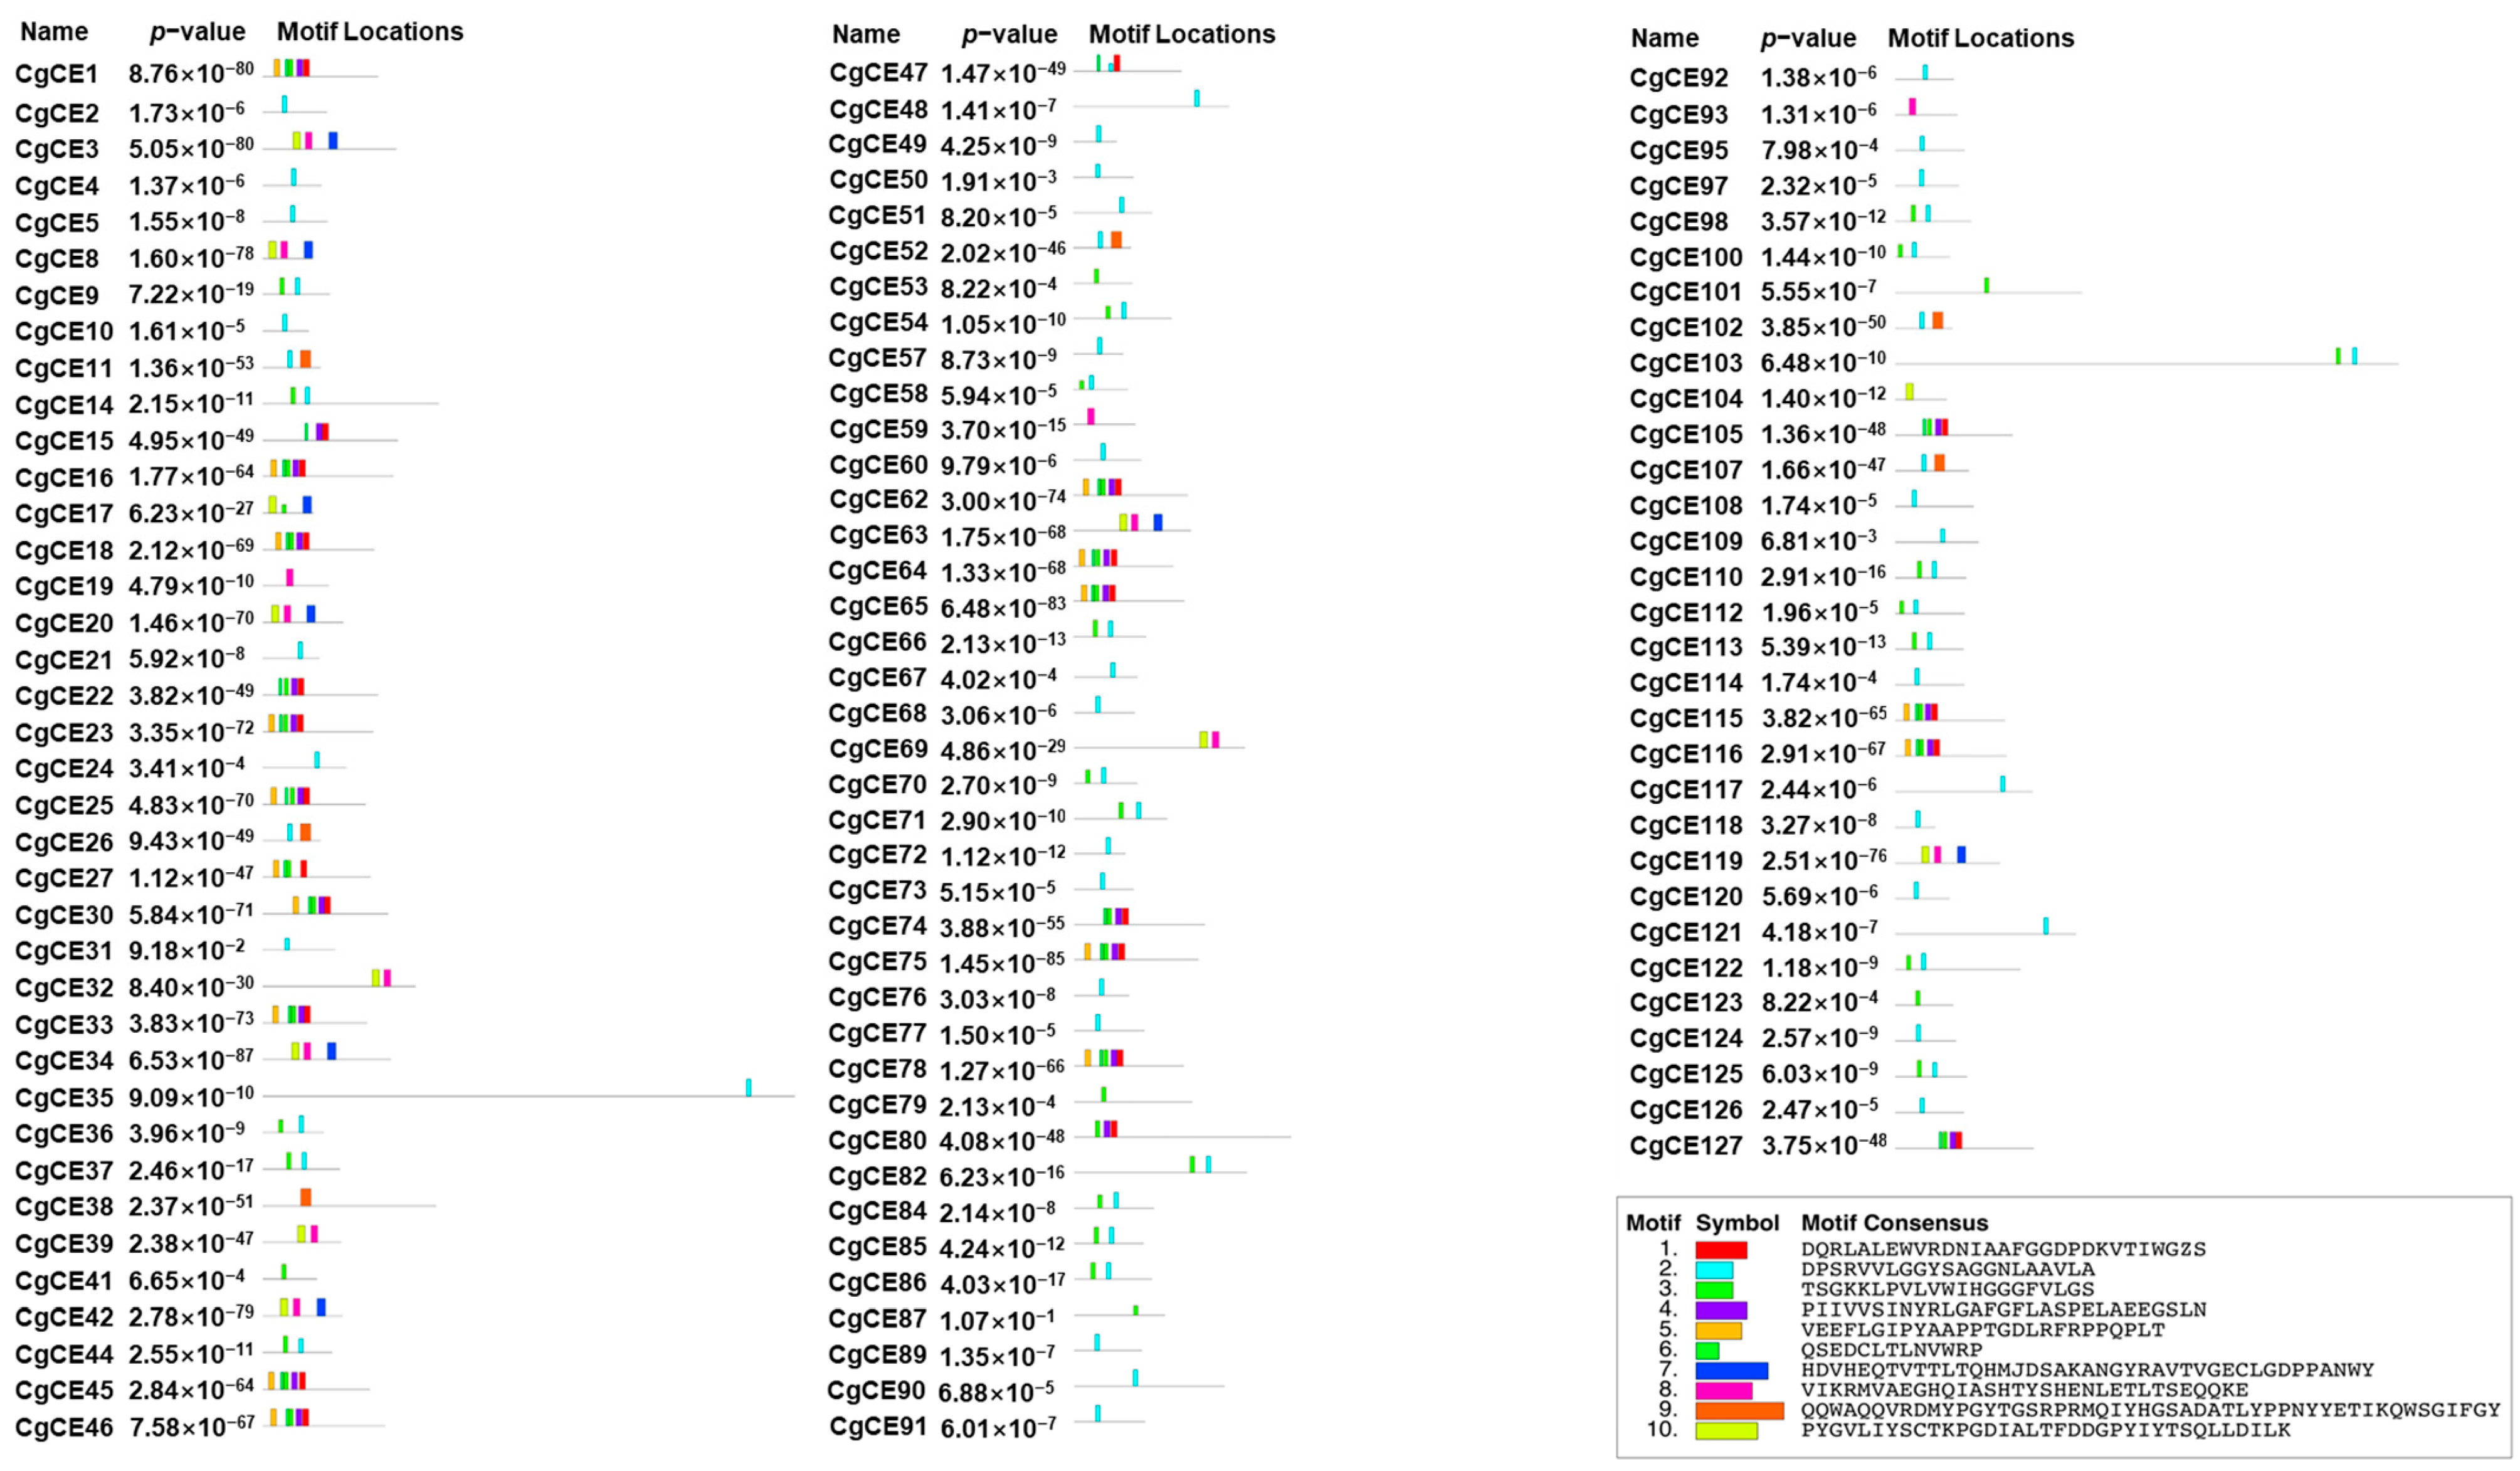
2.3. Structural Analysis of CgCEs
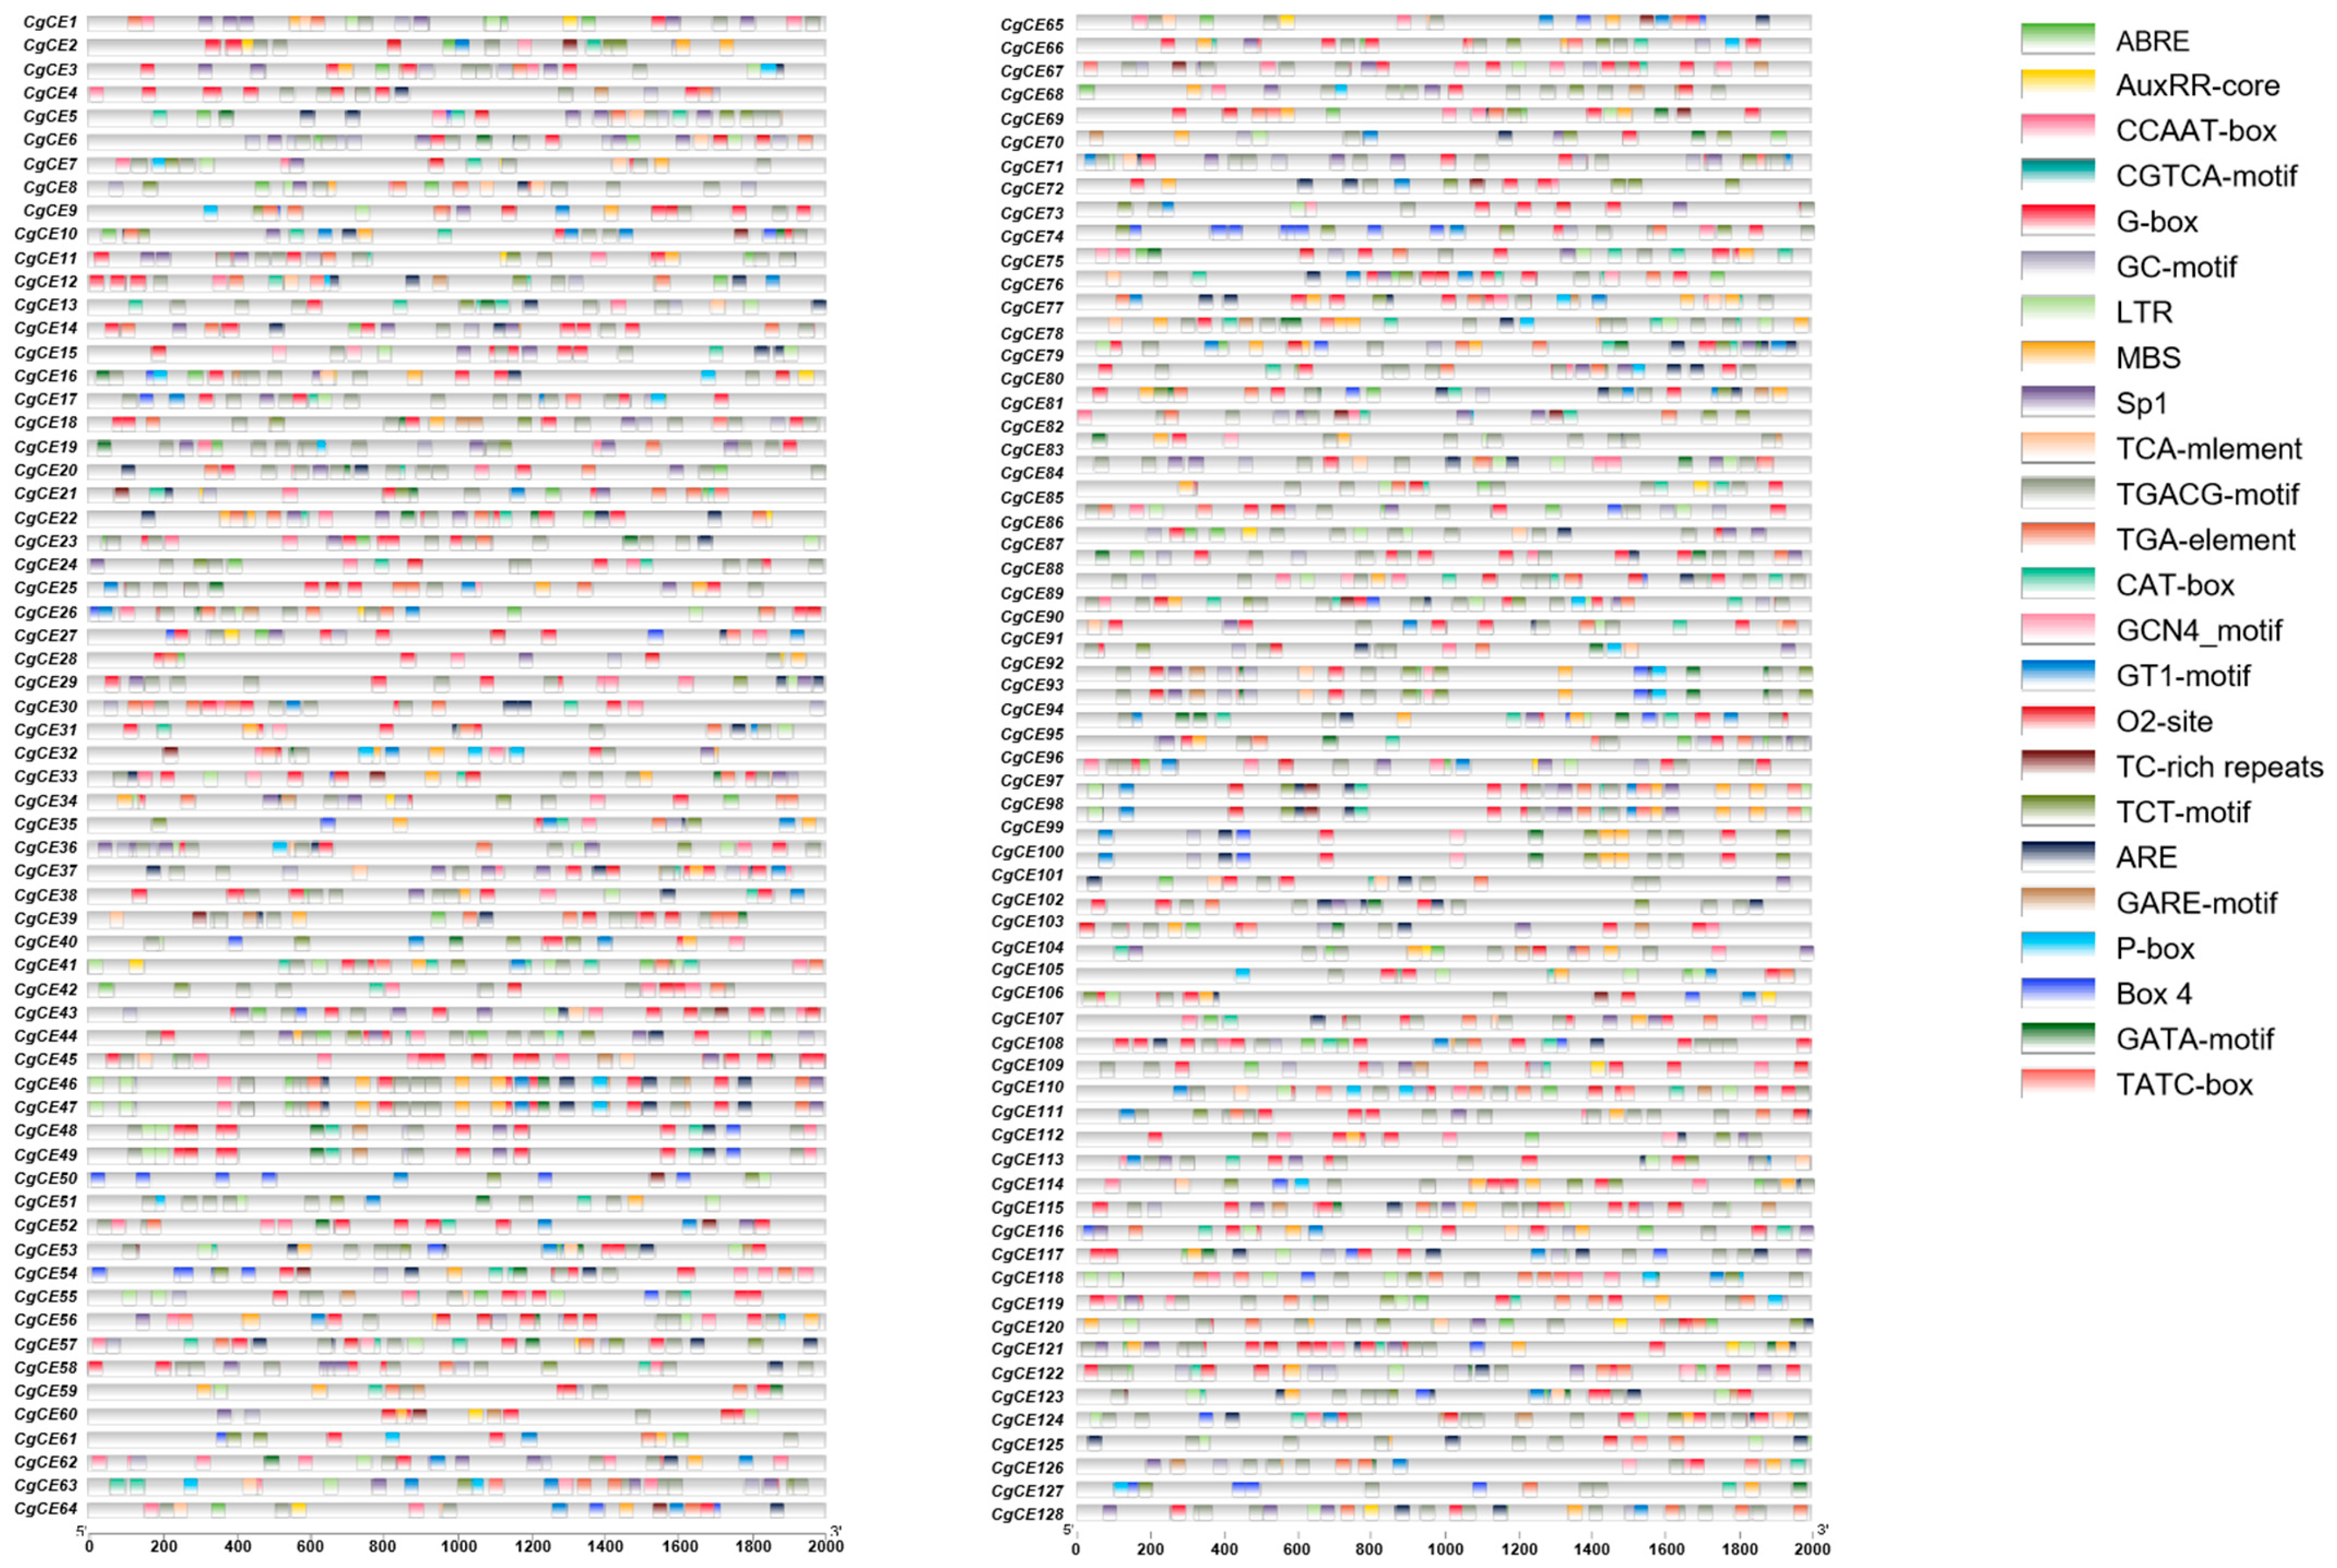
2.4. Analysis of the Promoter Regulatory Elements of CgCEs
2.5. Gene Ontology (GO) Enrichment Analysis of CgCEs
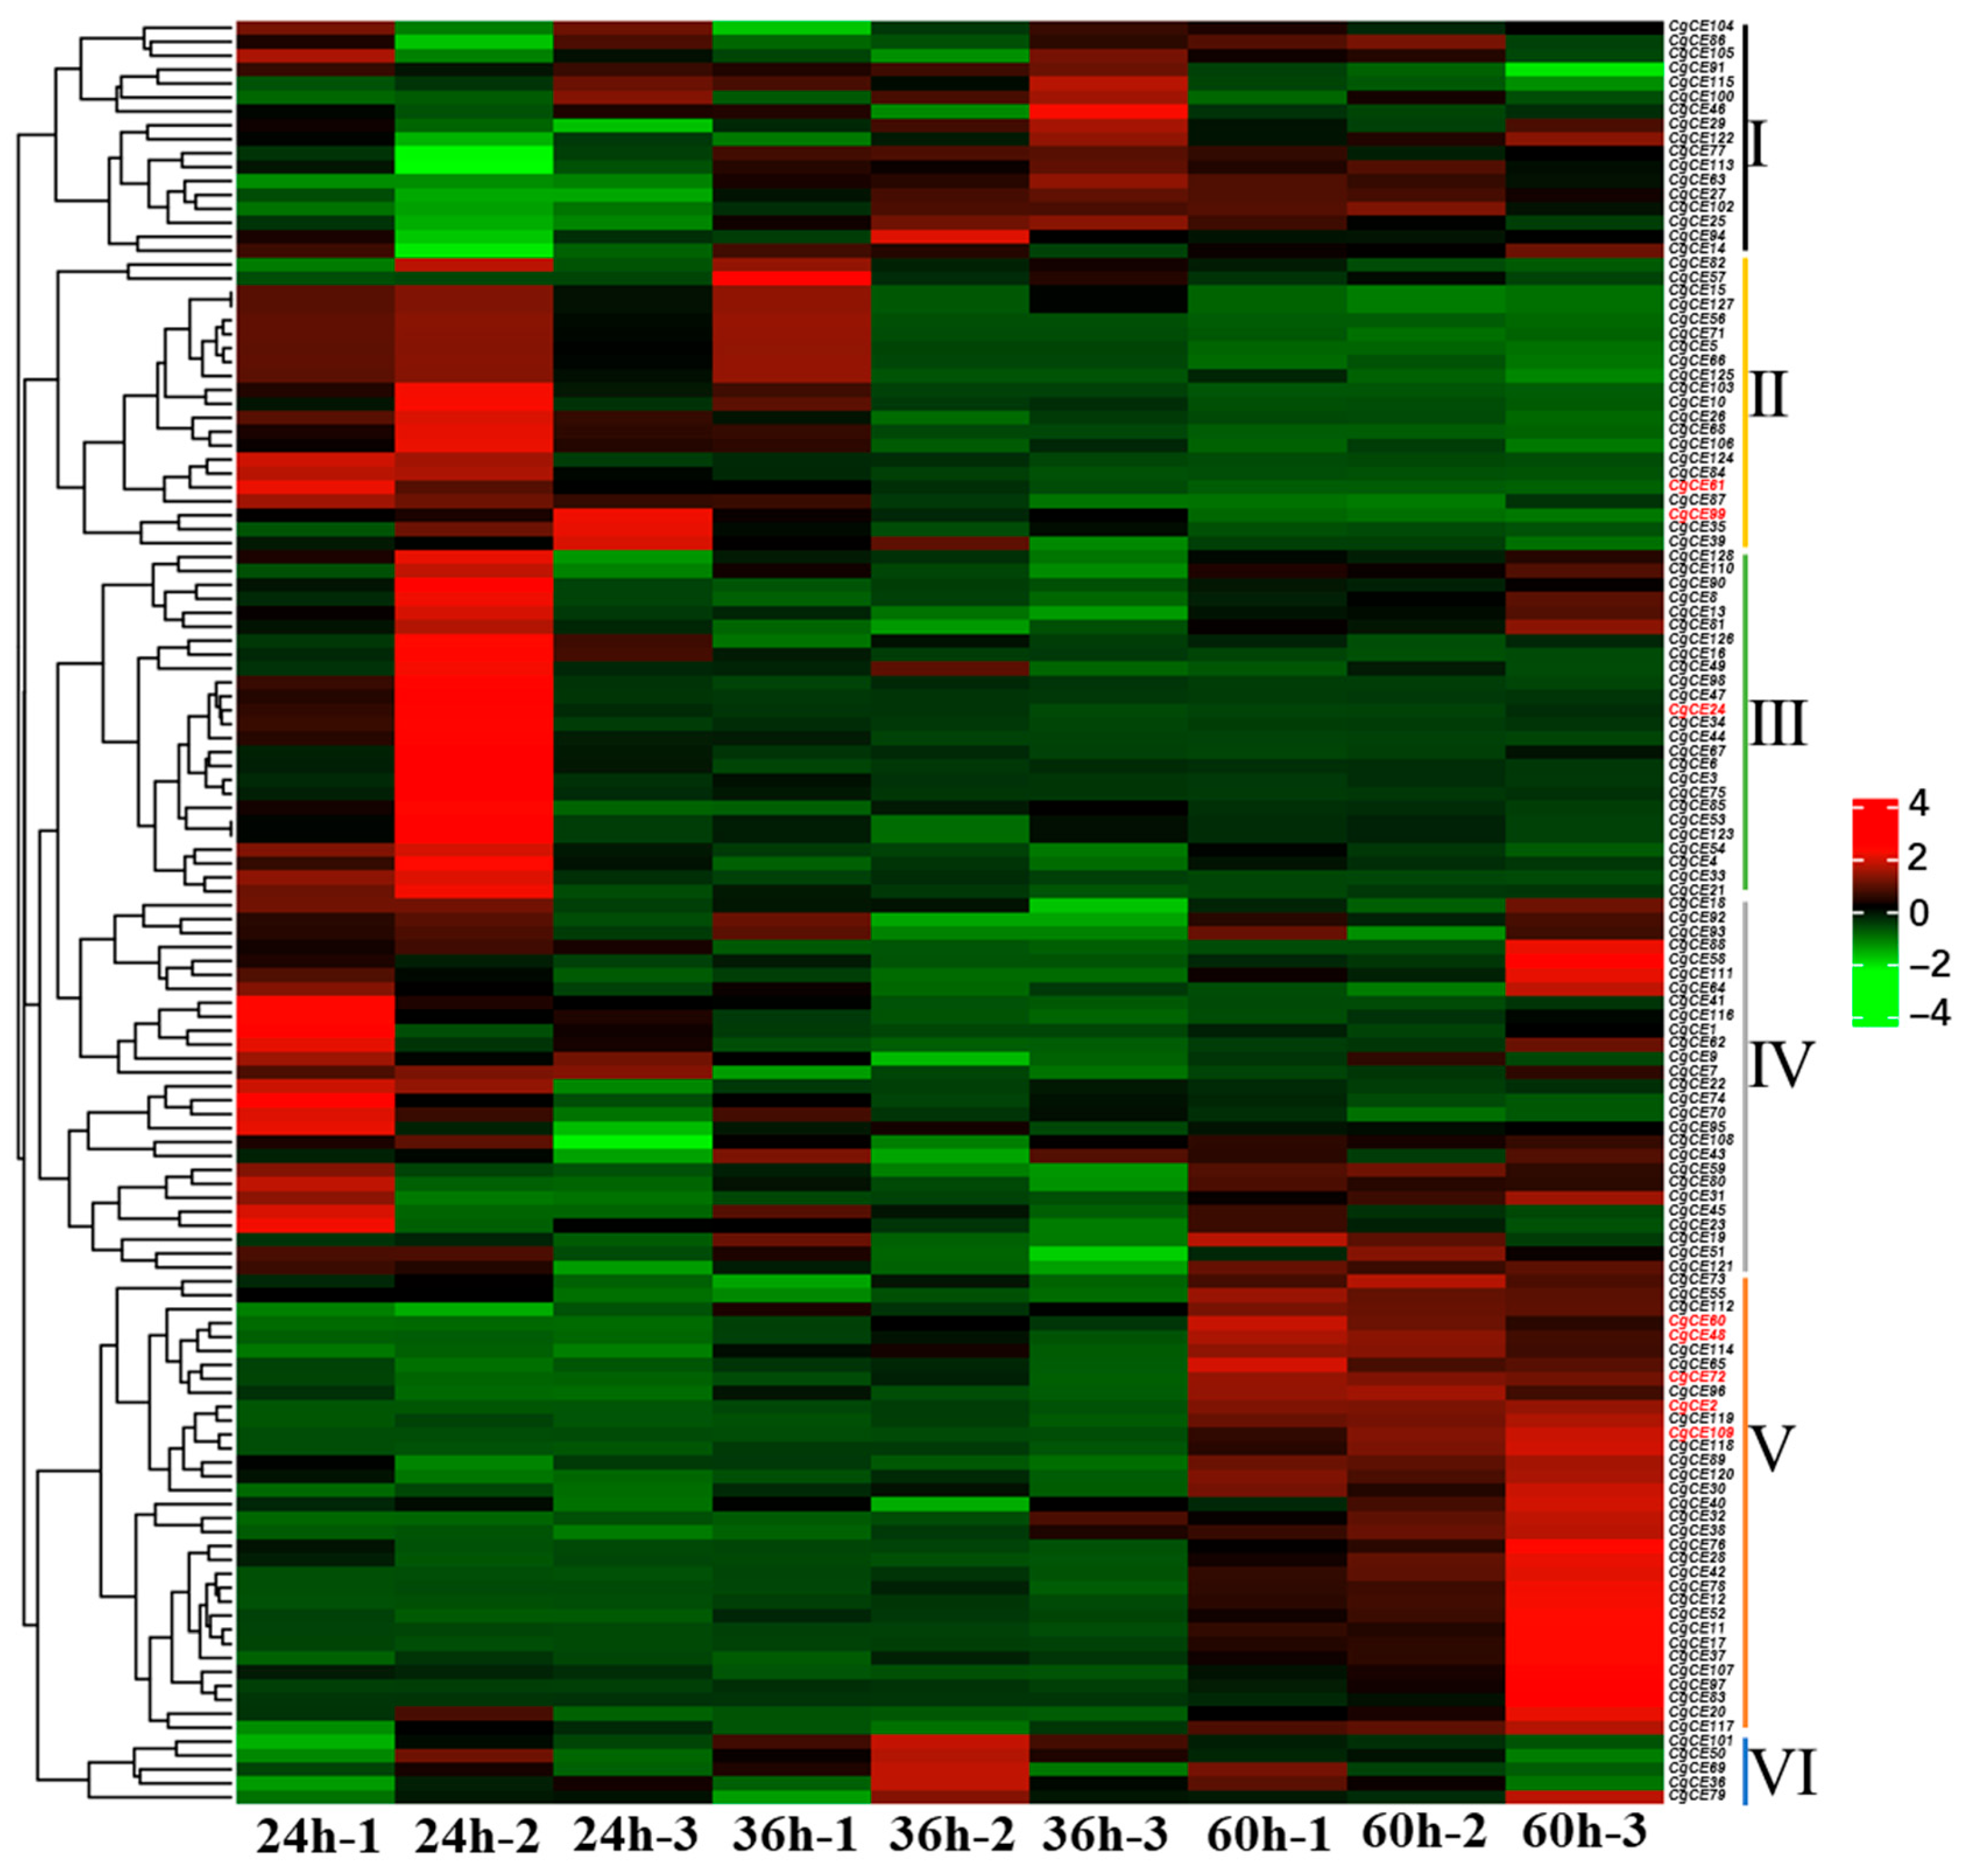
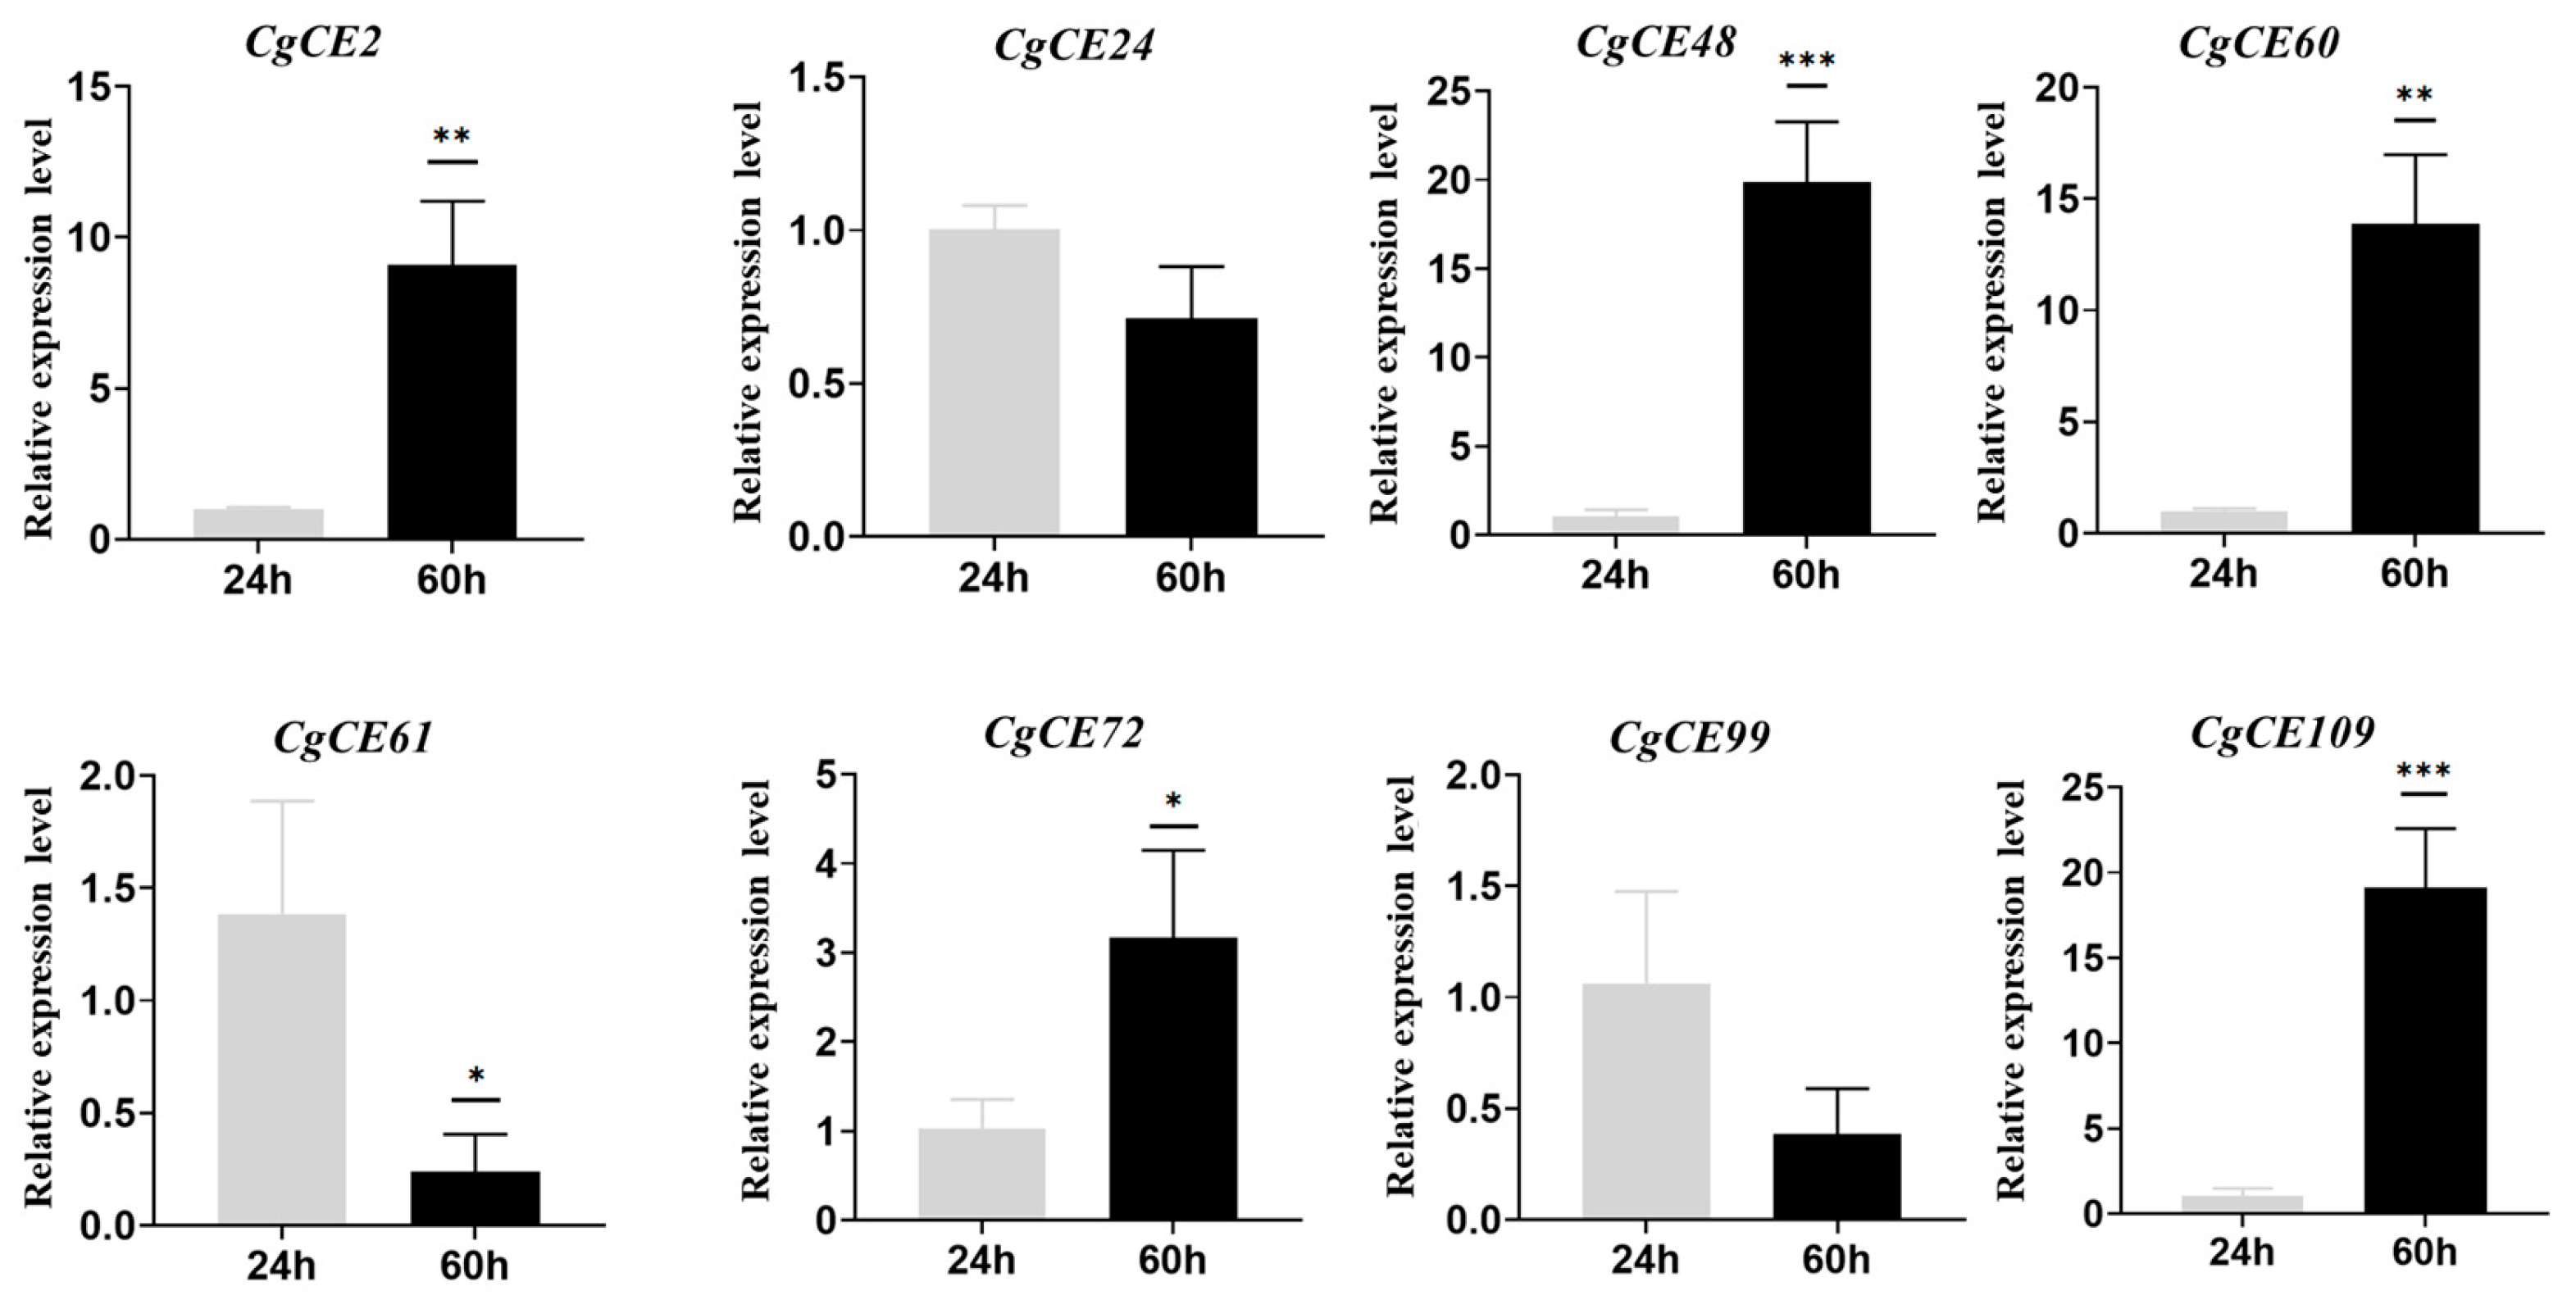
2.6. CgCE Gene Expression Pattern Analysis
3. Discussion
4. Materials and Methods
4.1. Identification and Analysis of CgCE Genes
4.2. Phylogenetic Analysis
4.3. Gene Structures and Protein Motifs
4.4. Promoter Region Analysis and GO Analysis
4.5. Analysis of CgCE Gene Expression Patterns
4.6. RT-qPCR
4.7. Statistical Analysis
5. Conclusions
Supplementary Materials
Author Contributions
Funding
Institutional Review Board Statement
Data Availability Statement
Conflicts of Interest
References
- Kiely, L.J.; Hickey, R.M. Characterization and analysis of food-sourced carbohydrates. Methods Mol. Biol. 2022, 2370, 67–95. [Google Scholar] [PubMed]
- Cantarel, B.L.; Coutinho, P.M.; Rancurel, C.; Bernard, T.; Lombard, V.; Henrissat, B. The Carbohydrate-Active EnZymes Database (CAZy): An expert resource for glycogenomics. Nucleic Acids Res. 2009, 37, D233–D238. [Google Scholar] [PubMed]
- Biely, P. Microbial carbohydrate esterases deacetylating plant polysaccharides. Biotechnol. Adv. 2012, 30, 1575–1588. [Google Scholar]
- Fries, M.; Ihrig, J.; Brocklehurst, K.; Shevchik, V.E.; Pickersgill, R.W. Molecular basis of the activity of the phytopathogen pectin methylesterase. EMBO J. 2007, 26, 3879–3887. [Google Scholar] [CrossRef]
- Armendáriz–Ruiz, M.; Rodríguez–González, J.A.; Camacho–Ruíz, R.M.; Mateos–Díaz, J.C. Carbohydrate esterases: An overview. Methods Mol. Biol. 2018, 1835, 39–68. [Google Scholar]
- Caffall, K.H.; Mohnen, D. The structure; function; and biosynthesis of plant cell wall pectic polysaccharides. Carbohydr. Res. 2009, 344, 1879–1900. [Google Scholar]
- Austin, P.R.; Brine, C.J.; Castle, J.E.; Zikakis, J.P. Chitin: New facets of research. Science 1981, 212, 749–753. [Google Scholar] [CrossRef]
- Raval, R.; Raval, K.; Moerschbacher, B.M. Enzymatic modification of chitosan using chitin deacetylase isolated from Bacillus cereus. Open Access Sci. Rep. 2013, 2, 1–4. [Google Scholar]
- Hirano, S. Chitin biotechnology applications. Biotechnol. Annu. Rev. 1996, 2, 237–258. [Google Scholar]
- Chong, S.L.; Nissilä, T.; Ketola, R.A.; Koutaniemi, S.; Derba–Maceluch, M.; Mellerowicz, E.J.; Tenkanen, M.; Tuomainen, P. Feasibility of using atmospheric pressure matrix–assisted laser desorption/ionization with ion trap mass spectrometry in the analysis of acetylated xylooligosaccharides derived from hardwoods and Arabidopsis thaliana. Anal. Bioanal. Chem. 2011, 401, 2995–3009. [Google Scholar]
- Joseleau, J.P.; Comtat, J.; Ruel, K. Chemical structure of xylans and their interaction in the plant cell walls. Xylans Xylanases 1991, 179, 356–364. [Google Scholar]
- Naran, R.; Black, S.; Decker, S.R.; Azadi, P. Extraction and characterization of native heteroxylans from delignified corn stover and aspen. Cellulose 2009, 16, 661–675. [Google Scholar] [CrossRef]
- Marques, G.; Gutiérrez, A.; del Río, J.C.; Evtuguin, D.V. Acetylated heteroxylan from agave sisalana and its behavior in alkaline pulping and TCF/ECF bleaching. Carbohydr. Polym. 2010, 81, 517–523. [Google Scholar] [CrossRef]
- Evtuguin, D.V.; Tomás, J.L.; Silva, A.M.; Neto, C.P. Characterization of an acetylated heteroxylan from Eucalyptus globulus Labill. Carbohydr. Res. 2003, 338, 597–604. [Google Scholar] [CrossRef]
- Van Dongen, F.E.M.; Van Eylen, D.; Kabel, M.A. Characterization of substituents in xylans from corn cobs and stover. Carbohydr. Polym. 2011, 86, 722–731. [Google Scholar] [CrossRef]
- MUELLER, D.S.; WISE, K.A.; SISSON, A.J.; Allen, T.M.; Bergstrom, G.C.; Bissonnette, K.M.; Bradley, C.A.; Byamukama, E.; Chilvers, M.I.; Collins, M.I.; et al. Corn yield loss estimates due to diseases in the United States and Ontario, Canada, from 2016 to 2019. Plant Health Prog. 2020, 21, 238–247. [Google Scholar] [CrossRef]
- Mei, J.; Li, Z.; Zhou, S.; Chen, X.; Wilson, R.; Liu, W. Effector secretion and stability in the maize anthracnose pathogen Colletotrichum graminicola requires N-linked protein glycosylation and the ER chaperone pathway. New Phytol. 2023, 240, 1449–1466. [Google Scholar] [CrossRef]
- Frey, T.J.; Weldekidan, T.; Colbert, T.; Wolters, P.J.C.C.; Hawk, J.A. Fitness evaluation of Rcg1, a locus that confers resistance to Colletotrichum graminicola (Ces.) G.W. Wils. Using Near-Isogenic Maize Hybrids. Crop Sci. 2011, 51, 1551–1563. [Google Scholar] [CrossRef]
- O’Connell, R.J.; Thon, M.R.; Hacquard, S.; Amyotte, S.G.; Kleemann, J.; Torres, M.F.; Damm, U.; Buiate, E.A.; Epstein, L.; Alkan, N.; et al. Lifestyle transitions in plant pathogenic Colletotrichum fungi deciphered by genome and transcriptome analyses. Nat. Genet. 2012, 44, 1060–1065. [Google Scholar] [CrossRef]
- Wang, Y.; Li, H.; Chang, J.; Zhang, Y.; Li, J.; Jia, S.; Shi, Y. Genome-wide identification and analysis of glycosyltransferases in Colletotrichum graminicola. Microorganisms 2024, 12, 2551. [Google Scholar] [CrossRef]
- Wang, Y.; Huang, Q.; Chen, X.; Li, H.; Chang, J.; Zhang, Y.; Wang, Y.; Shi, Y. Genome-wide Identification and analysis of carbohydrate-binding modules in Colletotrichum graminicola. Int. J. Mol. Sci. 2025, 26, 919. [Google Scholar] [CrossRef] [PubMed]
- Ludwig, N.; Löhrer, M.; Hempel, M.; Mathea, S.; Schliebner, I.; Menzel, M.; Kiesow, A.; Schaffrath, U.; Deising, H.B.; Horbach, R. Melanin is not required for turgor generation but enhances cell–wall rigidity in appressoria of the corn pathogen Colletotrichum Graminicola. Mol. Plant Microbe Interact. 2014, 27, 315–327. [Google Scholar] [CrossRef] [PubMed]
- Crouch, J.A.; Clarke, B.B.; White, J.F., Jr.; Hillman, B.I. Systematic analysis of the falcate–spored Colletotrichum graminicolous and a description of six new species from warm–season grasses. Mycologia 2009, 101, 717–732. [Google Scholar] [CrossRef] [PubMed]
- Jiao, C.; Chen, L.; Sun, C.; Jiang, Y.; Zhai, L.; Liu, H.; Shen, Z. Evaluating national ecological risk of agricultural pesticides from 2004 to 2017 in China. Environ. Pollut. 2020, 259, 113778. [Google Scholar] [CrossRef]
- Gong, A.; Jing, Z.; Zhang, K.; Tan, Q.; Wang, G.; Liu, W. Bioinformatic analysis and functional characterization of the CFEM proteins in maize anthracnose fungus Colletotrichum Graminicola. J. Integr. Agr. 2020, 19, 541–550. [Google Scholar] [CrossRef]
- Lescot, M.; Déhais, P.; Thijs, G.; Marchal, K.; Moreau, Y.; Van de Peer, Y.; Rouzé, P.; Rombauts, S. PlantCARE, a database of plant cis–acting regulatory elements and a portal to tools for in silico analysis of promoter sequences. Nucleic Acids Res. 2002, 30, 325–327. [Google Scholar] [CrossRef]
- Higo, K.; Ugawa, Y.; Iwamoto, M.; Korenaga, T. Plant cis–acting regulatory DNA elements (PLACE) database: 1999. Nucleic Acids Res. 1999, 27, 297–300. [Google Scholar] [CrossRef]
- Xu, G.; Guo, C.; Shan, H.; Kong, H. Divergence of duplicate genes in exon–intron structure. Proc. Natl. Acad. Sci. USA 2012, 109, 1187–1192. [Google Scholar] [CrossRef]
- Xuan, C.; Feng, M.; Li, X.; Hou, Y.; Wei, C.; Zhang, X. Genome–wide identification and expression analysis of chitinase genes in watermelon under abiotic stimuli and Fusarium oxysporum infection. Int. J. Mol. Sci. 2024, 25, 638. [Google Scholar] [CrossRef]
- Hernandez–Garcia, C.M.; Finer, J.J. Identification and validation of promoters and cis–acting regulatory elements. Plant Sci. 2014, 217–218, 109–119. [Google Scholar] [CrossRef]
- Wang, L.Y.; Zhang, Y.; Fu, X.Q.; Zhang, T.T.; Ma, J.W.; Zhang, L.D.; Qian, H.M.; Tang, K.X.; Li, S.; Zhao, J.Y. Molecular cloning, characterization; and promoter analysis of the isochorismate synthase (AaICS1) gene from Artemisia annua. J. Zhejiang Univ. Sci. B 2017, 18, 662–673. [Google Scholar] [PubMed]
- Wang, Y.; Shi, Y.; Li, H.; Wang, S.; Wang, A. Whole genome identification and biochemical characteristics of the Tilletia horrida cytochrome P450 gene family. Int. J. Mol. Sci. 2024, 25, 10478. [Google Scholar] [CrossRef] [PubMed]
- Pu, J.; Li, M.; Mao, P.; Zhou, Q.; Liu, W.; Liu, Z. Genome-wide identification of the q-type C2H2 transcription factor family in alfalfa (Medicago sativa) and expression analysis under different abiotic stresses. Genes 2021, 12, 1906. [Google Scholar] [CrossRef] [PubMed]
- Li, L.; Tang, J.; Wu, A.; Fan, C.; Li, H. Genome–wide identification and functional analysis of the GUX gene family in Eucalyptus grandis. Int. J. Mol. Sci. 2024, 25, 8199. [Google Scholar] [CrossRef]
- Li, W.; Wang, H.; Yu, D. Arabidopsis WRKY transcription factors WRKY12 and WRKY13 oppositely regulate flowering under Short–Day conditions. Mol. Plant 2016, 9, 1492–1503. [Google Scholar]
- Yu, Y.; Liu, Z.; Wang, L.; Kim, S.G.; Seo, P.J.; Qiao, M.; Wang, N.; Li, S.; Cao, X.; Park, C.M.; et al. WRKY71 accelerates flowering via the direct activation of FLOWERING LOCUS T and LEAFY in Arabidopsis thaliana. Plant J. 2016, 85, 96–106. [Google Scholar]
- Zhang, C.Q.; Xu, Y.; Lu, Y.; Yu, H.X.; Gu, M.H.; Liu, Q.Q. The WRKY transcription factor OsWRKY78 regulates stem elongation and seed development in rice. Planta 2011, 234, 541–554. [Google Scholar] [CrossRef]
- Yu, H.; Zhang, J.; Fan, J.; Jia, W.; Lv, Y.; Pan, H.; Zhang, X. Infection-specific transcriptional patterns of the maize pathogen Cochliobolus heterostrophus unravel genes involved in asexual development and virulence. Mol. Plant Pathol. 2024, 25, e13413. [Google Scholar]
- Eisermann, I.; Weihmann, F.; Krijger, J.J.; Kröling, C.; Hause, G.; Menzel, M.; Pienkny, S.; Kiesow, A.; Deising, H.B.; Wirsel, S.G.R. Two genes in a pathogenicity gene cluster encoding secreted proteins are required for appressorial penetration and infection of the maize anthracnose fungus Colletotrichum graminicola. Environ. Microbiol. 2019, 21, 4773–4791. [Google Scholar]
- Sanz-Martín, J.M.; Pacheco-Arjona, J.R.; Bello-Rico, V.; Vargas, W.A.; Monod, M.; Díaz-Mínguez, J.M.; Thon, M.R.; Sukno, S.A. A highly conserved metalloprotease effector enhances virulence in the maize anthracnose fungus Colletotrichum graminicola. Mol. Plant Pathol. 2016, 17, 1048–1062. [Google Scholar] [CrossRef]
- Shi, X.; Xia, X.; Mei, J.; Gong, Z.; Zhang, J.; Xiao, Y.; Duan, C.; Liu, W. Genome sequence resource of a Colletotrichum graminicola field strain from China. Mol. Plant Microbe Interact. 2023, 36, 447–451. [Google Scholar] [CrossRef] [PubMed]
- Wilkins, M.R.; Gasteiger, E.; Bairoch, A.; Sanchez, J.C.; Williams, K.L.; Appel, R.D.; Hochstrasser, D.F. Protein identification and analysis tools in the ExPASy server. Methods Mol. Biol. 1999, 112, 531–552. [Google Scholar] [PubMed]
- Subramanian, B.; Gao, S.; Lercher, M.J.; Hu, S.; Chen, W.H. Evolview v3: A webserver for visualization, annotation, and management of phylogenetic trees. Nucleic Acids Res. 2019, 47, W270–W275. [Google Scholar] [CrossRef]
- Hu, B.; Jin, J.; Guo, A.Y.; Zhang, H.; Luo, J.; Gao, G. GSDS 2.0: An upgraded gene feature visualization server. Bioinformatics. 2015, 31, 1296–1297. [Google Scholar] [CrossRef]
- Bailey, T.L.; Boden, M.; Buske, F.A.; Frith, M.; Grant, C.E.; Clementi, L.; Ren, J.; Li, W.W.; Noble, W.S. MEME SUITE: Tools for motif discovery and searching. Nucleic Acids Res. 2009, 37, W202–W208. [Google Scholar] [CrossRef]
- Chen, C.; Wu, Y.; Li, J.; Wang, X.; Zeng, Z.; Xu, J.; Liu, Y.; Feng, J.; Chen, H.; He, Y.; et al. TBtools-II: A "one for all, all for one" bioinformatics platform for biological big-data mining. Mol. Plant. 2023, 16, 1733–1742. [Google Scholar] [CrossRef]
- Mu, H.; Chen, J.; Huang, W.; Huang, G.; Deng, M.; Hong, S.; Ai, P.; Gao, C.; Zhou, H. OmicShare tools: A zero–code interactive online platform for biological data analysis and visualization. Imeta 2024, 3, e228. [Google Scholar] [CrossRef]


| Proposed Gene Name | Gene ID | Superfamily | CDS Length (bp) | Protein Length (aa) | Mw (KDa) | PI | GRAVY | Predicted Subcellular Localization |
|---|---|---|---|---|---|---|---|---|
| CgCE1 | EVM0000041 | CE10 | 1728 | 575 | 62.2 | 5.56 | −0.163 | extracellular, including cell wall |
| CgCE2 | EVM0000082 | CE5 | 963 | 320 | 33.38 | 5.06 | −0.266 | extracellular, including cell wall |
| CgCE3 | EVM0000127 | CE4 | 2001 | 666 | 71.88 | 5.35 | 0.046 | plasma membrane |
| CgCE4 | EVM0000327 | CE10 | 885 | 294 | 32.7 | 6.83 | 0.858 | mitochondrion |
| CgCE5 | EVM0000354 | CE10 | 975 | 324 | 35.87 | 5.22 | −0.419 | cytoskeleton |
| CgCE6 | EVM0000406 | CE5 | 657 | 218 | 22.79 | 5.67 | 0.135 | extracellular, including cell wall |
| CgCE7 | EVM0000448 | CE3 | 804 | 267 | 28.66 | 5.06 | −0.056 | extracellular, including cell wall |
| CgCE8 | EVM0000618 | CE4 | 753 | 250 | 27.21 | 4.93 | −0.274 | extracellular, including cell wall |
| CgCE9 | EVM0000742 | CE10 | 1008 | 335 | 37.07 | 5.48 | −0.187 | cytosol |
| CgCE10 | EVM0000896 | CE5 | 693 | 230 | 24.05 | 5.77 | −0.155 | extracellular, including cell wall |
| CgCE11 | EVM0000955 | CE10 | 870 | 289 | 30.89 | 8.84 | −0.167 | extracellular, including cell wall |
| CgCE12 | EVM0000976 | CE12 | 792 | 263 | 28.14 | 9.24 | −0.095 | extracellular, including cell wall |
| CgCE13 | EVM0001025 | CE12 | 783 | 260 | 27.41 | 4.85 | −0.135 | extracellular, including cell wall |
| CgCE14 | EVM0001088 | CE10 | 2631 | 876 | 95.61 | 6.23 | −0.476 | mitochondrion |
| CgCE15 | EVM0001101 | CE10 | 2025 | 674 | 74.04 | 4.79 | −0.253 | extracellular, including cell wall |
| CgCE16 | EVM0001121 | CE10 | 1956 | 651 | 68.66 | 4.81 | −0.286 | extracellular, including cell wall |
| CgCE17 | EVM0001137 | CE4 | 765 | 254 | 27.15 | 7.68 | −0.113 | extracellular, including cell wall |
| CgCE18 | EVM0001148 | CE10 | 1671 | 556 | 62.03 | 5.81 | −0.329 | extracellular, including cell wall |
| CgCE19 | EVM0001168 | CE4 | 990 | 329 | 37.85 | 5.58 | −0.63 | cytosol |
| CgCE20 | EVM0001222 | CE4 | 1209 | 402 | 42.98 | 5.01 | −0.319 | extracellular, including cell wall |
| CgCE21 | EVM0001274 | CE5 | 849 | 282 | 30.12 | 8.55 | 0.03 | extracellular, including cell wall |
| CgCE22 | EVM0001394 | CE10 | 1728 | 575 | 61.32 | 5.9 | −0.16 | mitochondrion |
| CgCE23 | EVM0001905 | CE10 | 1656 | 551 | 60.55 | 5.31 | −0.279 | cytosol |
| CgCE24 | EVM0001952 | CE1 | 1251 | 416 | 46.39 | 6.28 | −0.338 | cytosol |
| CgCE25 | EVM0002004 | CE10 | 1542 | 513 | 56.27 | 4.72 | −0.142 | extracellular, including cell wall |
| CgCE26 | EVM0002064 | CE1 | 870 | 289 | 30.95 | 7.65 | −0.209 | extracellular, including cell wall |
| CgCE27 | EVM0002115 | CE10 | 1617 | 538 | 57.25 | 4.59 | −0.087 | extracellular, including cell wall |
| CgCE28 | EVM0002178 | CE2 | 1536 | 511 | 55.6 | 5.35 | −0.122 | extracellular, including cell wall |
| CgCE29 | EVM0002192 | CE14 | 1047 | 348 | 38.2 | 7.73 | −0.307 | cytosol_mitochondrion |
| CgCE30 | EVM0002202 | CE10 | 1878 | 625 | 67.12 | 6.46 | −0.101 | cytosol |
| CgCE31 | EVM0002514 | CE1 | 1086 | 361 | 40.3 | 5.86 | −0.314 | cytosol |
| CgCE32 | EVM0002515 | CE4 | 2286 | 761 | 81.84 | 6.17 | −0.105 | extracellular, including cell wall |
| CgCE33 | EVM0002914 | CE10 | 1566 | 521 | 55.04 | 5.15 | 0.012 | extracellular, including cell wall |
| CgCE34 | EVM0002966 | CE4 | 1920 | 639 | 66.12 | 6.45 | −0.29 | extracellular, including cell wall |
| CgCE35 | EVM0003070 | CE10 | 7947 | 2648 | 288.11 | 6.2 | −0.122 | extracellular, including cell wall |
| CgCE36 | EVM0003146 | CE1 | 915 | 304 | 32.38 | 6.05 | 0.03 | extracellular, including cell wall |
| CgCE37 | EVM0003231 | CE10 | 1158 | 385 | 42.24 | 8.31 | −0.286 | mitochondrion |
| CgCE38 | EVM0003289 | CE1 | 2592 | 863 | 94.04 | 8.95 | 0.098 | plasma membrane |
| CgCE39 | EVM0003589 | CE4 | 1176 | 391 | 41.89 | 4.85 | −0.243 | extracellular, including cell wall |
| CgCE40 | EVM0003593 | CE16 | 927 | 308 | 33.32 | 4.49 | 0.044 | extracellular, including cell wall |
| CgCE41 | EVM0003606 | CE3 | 816 | 271 | 29.86 | 6.07 | −0.295 | cytoskeleton |
| CgCE42 | EVM0003618 | CE4 | 1200 | 399 | 43.08 | 6.81 | −0.179 | extracellular, including cell wall |
| CgCE43 | EVM0003652 | CE4 | 1929 | 642 | 70.28 | 5.74 | −0.266 | mitochondrion |
| CgCE44 | EVM0003752 | CE10 | 1041 | 346 | 37.28 | 5.48 | 0.003 | cytosol |
| CgCE45 | EVM0003815 | CE10 | 1605 | 534 | 59.94 | 6.4 | −0.399 | peroxisome |
| CgCE46 | EVM0003847 | CE10 | 1833 | 610 | 66.42 | 5.6 | −0.188 | extracellular, including cell wall |
| CgCE47 | EVM0004162 | CE10 | 1623 | 540 | 56.78 | 7.5 | 0.078 | extracellular, including cell wall |
| CgCE48 | EVM0004283 | CE10 | 2334 | 777 | 87.03 | 4.9 | −0.327 | extracellular, including cell wall |
| CgCE49 | EVM0004290 | CE5 | 654 | 217 | 21.98 | 6.02 | 0.109 | extracellular, including cell wall |
| CgCE50 | EVM0004486 | CE1 | 906 | 301 | 33.85 | 8.38 | −0.337 | mitochondrion |
| CgCE51 | EVM0004596 | CE10 | 1185 | 394 | 44.61 | 9.65 | −0.279 | mitochondrion |
| CgCE52 | EVM0004622 | CE1 | 867 | 288 | 30.5 | 8.18 | −0.103 | extracellular, including cell wall |
| CgCE53 | EVM0004635 | CE3 | 891 | 296 | 31.91 | 4.71 | 0.001 | extracellular, including cell wall |
| CgCE54 | EVM0004691 | CE10 | 1476 | 491 | 54.82 | 6.88 | −0.24 | mitochondrion |
| CgCE55 | EVM0004748 | CE12 | 750 | 249 | 26.46 | 5.75 | −0.127 | extracellular, including cell wall |
| CgCE56 | EVM0004803 | CE3 | 1107 | 368 | 40.88 | 5.18 | −0.419 | cytoskeleton |
| CgCE57 | EVM0004811 | CE5 | 750 | 249 | 26.08 | 5.33 | −0.071 | extracellular, including cell wall |
| CgCE58 | EVM0005092 | CE15 | 822 | 273 | 30 | 8.94 | −0.237 | extracellular, including cell wall |
| CgCE59 | EVM0005152 | CE4 | 933 | 310 | 35.54 | 5.44 | −0.54 | cytoskeleton |
| CgCE60 | EVM0005295 | CE1 | 1023 | 340 | 37.67 | 5.23 | −0.136 | extracellular, including cell wall |
| CgCE61 | EVM0005306 | CE3 | 726 | 241 | 24.95 | 4.83 | 0.119 | extracellular, including cell wall |
| CgCE62 | EVM0005332 | CE10 | 1719 | 572 | 61.5 | 4.58 | 0.03 | extracellular, including cell wall |
| CgCE63 | EVM0005686 | CE4 | 1764 | 587 | 59.16 | 5.02 | −0.152 | extracellular, including cell wall |
| CgCE64 | EVM0005870 | CE10 | 1500 | 499 | 55.78 | 5.61 | −0.31 | nucleus |
| CgCE65 | EVM0005918 | CE10 | 1665 | 554 | 60.99 | 5.50 | −0.264 | extracellular, including cell wall |
| CgCE66 | EVM0006071 | CE10 | 1092 | 363 | 41.09 | 6.01 | −0.493 | mitochondrion |
| CgCE67 | EVM0006162 | CE5 | 924 | 307 | 31.91 | 5.80 | 0.087 | extracellular, including cell wall |
| CgCE68 | EVM0006271 | CE1 | 882 | 293 | 30.83 | 5.91 | 0.072 | mitochondrion |
| CgCE69 | EVM0006315 | CE4 | 2478 | 825 | 89.21 | 6.12 | −0.262 | extracellular, including cell wall |
| CgCE70 | EVM0006622 | CE10 | 921 | 306 | 33.25 | 5.09 | −0.202 | cytosol |
| CgCE71 | EVM0006844 | CE10 | 1353 | 450 | 50.81 | 5.48 | −0.159 | cytosol |
| CgCE72 | EVM0007096 | CE5 | 750 | 249 | 25.73 | 4.86 | 0.184 | extracellular, including cell wall |
| CgCE73 | EVM0007201 | CE10 | 867 | 288 | 32.14 | 5.09 | −0.281 | cytosol |
| CgCE74 | EVM0007448 | CE10 | 1899 | 632 | 68.15 | 5.05 | −0.166 | plasma membrane |
| CgCE75 | EVM0007455 | CE10 | 1803 | 600 | 65.59 | 4.94 | −0.156 | extracellular, including cell wall |
| CgCE76 | EVM0007471 | CE10 | 801 | 266 | 28.30 | 4.92 | 0.013 | extracellular, including cell wall |
| CgCE77 | EVM0007645 | CE5 | 1023 | 340 | 34.36 | 5.16 | −0.001 | extracellular, including cell wall |
| CgCE78 | EVM0007714 | CE10 | 1593 | 530 | 57.78 | 5.93 | −0.186 | extracellular, including cell wall |
| CgCE79 | EVM0007728 | CE1 | 1716 | 571 | 62.83 | 6.11 | −0.223 | mitochondrion |
| CgCE80 | EVM0007815 | CE10 | 3147 | 1048 | 114.63 | 5.70 | −0.143 | cytosol |
| CgCE81 | EVM0007953 | CE12 | 765 | 254 | 27.61 | 5.97 | −0.15 | cytosol |
| CgCE82 | EVM0007971 | CE10 | 2508 | 835 | 95.92 | 6.72 | −0.423 | cytosol |
| CgCE83 | EVM0008001 | CE16 | 1143 | 380 | 40.04 | 4.64 | −0.003 | extracellular, including cell wall |
| CgCE84 | EVM0008060 | CE10 | 1161 | 386 | 43.29 | 8.09 | −0.096 | mitochondrion |
| CgCE85 | EVM0008211 | CE10 | 1011 | 336 | 36.25 | 5.66 | −0.029 | cytosol |
| CgCE86 | EVM0008226 | CE10 | 1134 | 377 | 41.84 | 5.83 | −0.236 | cytosol |
| CgCE87 | EVM0008257 | CE9 | 1320 | 439 | 46.91 | 5.59 | −0.070 | mitochondrion |
| CgCE88 | EVM0008267 | CE16 | 1035 | 344 | 37.59 | 5.32 | −0.124 | extracellular, including cell wall |
| CgCE89 | EVM0008341 | CE5 | 987 | 328 | 33.59 | 5.32 | −0.185 | extracellular, including cell wall |
| CgCE90 | EVM0008636 | CE10 | 2184 | 727 | 81.42 | 9.43 | −0.411 | mitochondrion |
| CgCE91 | EVM0008653 | CE1 | 1032 | 343 | 38.57 | 5.41 | −0.443 | cytosol |
| CgCE92 | EVM0008781 | CE10 | 900 | 299 | 32.51 | 5.91 | −0.129 | extracellular, including cell wall |
| CgCE93 | EVM0008811 | CE4 | 954 | 317 | 36.68 | 5.33 | −0.606 | cytosol |
| CgCE94 | EVM0009004 | CE8 | 993 | 330 | 34.92 | 8.62 | −0.149 | extracellular, including cell wall |
| CgCE95 | EVM0009041 | CE1 | 1065 | 354 | 39.13 | 6.74 | −0.225 | cytosol |
| CgCE96 | EVM0009064 | CE8 | 1236 | 411 | 44.48 | 5.02 | −0.151 | extracellular, including cell wall |
| CgCE97 | EVM0009089 | CE1 | 978 | 325 | 33.48 | 8.27 | −0.091 | extracellular, including cell wall |
| CgCE98 | EVM0009119 | CE10 | 1164 | 387 | 42.67 | 5.94 | −0.192 | cytosol |
| CgCE99 | EVM0009168 | CE12 | 876 | 291 | 30.88 | 7.03 | −0.208 | extracellular, including cell wall |
| CgCE100 | EVM0009371 | CE10 | 843 | 280 | 31.57 | 6.09 | −0.32 | cytoskeleton |
| CgCE101 | EVM0009479 | CE10 | 2859 | 952 | 104.33 | 5.34 | −0.376 | mitochondrion |
| CgCE102 | EVM0009532 | CE1 | 879 | 292 | 30.8 | 8.18 | −0.088 | extracellular, including cell wall |
| CgCE103 | EVM0009598 | CE10 | 7689 | 2562 | 281.5 | 5.97 | −0.149 | plasma membrane |
| CgCE104 | EVM0009626 | CE4 | 792 | 263 | 30.61 | 9.69 | −0.254 | mitochondrion |
| CgCE105 | EVM0009763 | CE10 | 1797 | 598 | 65.31 | 4.7 | −0.159 | extracellular, including cell wall |
| CgCE106 | EVM0009964 | CE8 | 1035 | 344 | 37.62 | 9.19 | −0.177 | extracellular, including cell wall |
| CgCE107 | EVM0010126 | CE1 | 1128 | 375 | 39.81 | 6.29 | −0.048 | extracellular, including cell wall |
| CgCE108 | EVM0010143 | CE1 | 1203 | 400 | 42.95 | 5.74 | −0.233 | cytosol |
| CgCE109 | EVM0010192 | CE1 | 1278 | 425 | 47.63 | 5.38 | −0.173 | cytoskeleton |
| CgCE110 | EVM0010694 | CE10 | 1089 | 362 | 38.46 | 5.02 | −0.076 | cytosol |
| CgCE111 | EVM0010772 | CE16 | 885 | 294 | 31.77 | 5.3 | −0.018 | extracellular, including cell wall |
| CgCE112 | EVM0010805 | CE1 | 1065 | 354 | 39.67 | 5.6 | −0.309 | cytosol |
| CgCE113 | EVM0010845 | CE10 | 1047 | 348 | 37.63 | 5.82 | −0.051 | cytosol |
| CgCE114 | EVM0010929 | CE1 | 1059 | 352 | 38.23 | 4.85 | 0.006 | cytosol |
| CgCE115 | EVM0011053 | CE10 | 1680 | 559 | 60.21 | 4.76 | −0.205 | extracellular, including cell wall |
| CgCE116 | EVM0011097 | CE10 | 1707 | 568 | 62.49 | 5.16 | −0.21 | extracellular, including cell wall |
| CgCE117 | EVM0011119 | CE10 | 2100 | 699 | 77.72 | 5.75 | −0.166 | mitochondrion |
| CgCE118 | EVM0011152 | CE5 | 618 | 205 | 20.46 | 6.7 | 0.272 | extracellular, including cell wall |
| CgCE119 | EVM0011272 | CE4 | 1605 | 534 | 56.8 | 5.86 | −0.364 | extracellular, including cell wall |
| CgCE120 | EVM0011291 | CE5 | 834 | 277 | 28.63 | 5.42 | 0.034 | extracellular, including cell wall |
| CgCE121 | EVM0011300 | CE10 | 2766 | 921 | 103.28 | 5.26 | −0.486 | plasma membrane |
| CgCE122 | EVM0011392 | CE1 | 1917 | 638 | 71.29 | 6.4 | −0.52 | cytosol |
| CgCE123 | EVM0011443 | CE3 | 891 | 296 | 31.91 | 4.71 | 0.001 | extracellular, including cell wall |
| CgCE124 | EVM0011496 | CE10 | 933 | 310 | 33.55 | 5.21 | −0.011 | cytosol |
| CgCE125 | EVM0011686 | CE10 | 1101 | 366 | 40 | 5.27 | −0.242 | cytosol |
| CgCE126 | EVM0011848 | CE10 | 1056 | 351 | 39.13 | 7.86 | −0.179 | mitochondrion |
| CgCE127 | EVM0011904 | CE10 | 2121 | 706 | 75.46 | 5.33 | −0.139 | extracellular, including cell wall |
| CgCE128 | EVM0011910 | CE3 | 741 | 246 | 27.85 | 5.54 | −0.552 | cytosol_nucleus |
Disclaimer/Publisher’s Note: The statements, opinions and data contained in all publications are solely those of the individual author(s) and contributor(s) and not of MDPI and/or the editor(s). MDPI and/or the editor(s) disclaim responsibility for any injury to people or property resulting from any ideas, methods, instructions or products referred to in the content. |
© 2025 by the authors. Licensee MDPI, Basel, Switzerland. This article is an open access article distributed under the terms and conditions of the Creative Commons Attribution (CC BY) license (https://creativecommons.org/licenses/by/4.0/).
Share and Cite
Zhu, W.; Wang, L.; Li, H.; Shi, Y.; Chang, J.; Wang, S.; Liu, X.; Ma, P.; Zhao, J.; Liu, Y.; et al. Whole-Genome Identification and Analysis of Carbohydrate Esterase Gene Family in Colletotrichum graminicola. Agriculture 2025, 15, 781. https://doi.org/10.3390/agriculture15070781
Zhu W, Wang L, Li H, Shi Y, Chang J, Wang S, Liu X, Ma P, Zhao J, Liu Y, et al. Whole-Genome Identification and Analysis of Carbohydrate Esterase Gene Family in Colletotrichum graminicola. Agriculture. 2025; 15(7):781. https://doi.org/10.3390/agriculture15070781
Chicago/Turabian StyleZhu, Wenting, Limin Wang, Honglian Li, Yan Shi, Jiaxin Chang, Senbo Wang, Xu Liu, Penghao Ma, Jinzhang Zhao, Yan Liu, and et al. 2025. "Whole-Genome Identification and Analysis of Carbohydrate Esterase Gene Family in Colletotrichum graminicola" Agriculture 15, no. 7: 781. https://doi.org/10.3390/agriculture15070781
APA StyleZhu, W., Wang, L., Li, H., Shi, Y., Chang, J., Wang, S., Liu, X., Ma, P., Zhao, J., Liu, Y., & Wang, Y. (2025). Whole-Genome Identification and Analysis of Carbohydrate Esterase Gene Family in Colletotrichum graminicola. Agriculture, 15(7), 781. https://doi.org/10.3390/agriculture15070781