Article

Apple Watercore Grade Classification Method Based on ConvNeXt and Visible/Near-Infrared Spectroscopy

1
Faculty of Mechanical and Electrical Engineering, Kunming University of Science and Technology, Kunming 650093, China
2
Modern Postal College, ShiJiaZhuang Posts and Telecommunications Technical College, Shijiazhuang 050021, China
3
Faculty of Mechanical and Electrical Engineering, Kunming University, Kunming 650214, China
4
School of Rail Transportation, Soochow University, Suzhou 215131, China
5
Ninglang Hengtai Agricultural Investment and Development Co., Ltd., Lijiang 674300, China
*
Authors to whom correspondence should be addressed.
Agriculture 2025, 15(7), 756; https://doi.org/10.3390/agriculture15070756
Submission received: 28 February 2025 / Revised: 25 March 2025 / Accepted: 26 March 2025 / Published: 31 March 2025
(This article belongs to the Section Digital Agriculture)

Abstract

:
To address the issues of insufficient rigor in existing methods for quantifying apple watercore severity and the complexity and low accuracy of traditional classification models, this study proposes a method for watercore quantification and a classification model based on a deep convolutional neural network. Initially, visible/near-infrared transmission spectral data of apple samples were collected. The apples were then sliced into 4.5 mm thick sections using a specialized tool, and image data of each slice were captured. Using BiSeNet and RIFE algorithms, a three-dimensional model of the watercore regions was constructed from the apple slices to calculate the watercore severity, which was subsequently categorized into five distinct levels. Next, methods such as the Gramian Angular Summation Field (GASF), Gram Angular Difference Field (GADF), and Markov Transition Field (MTF) were applied to transform the one-dimensional spectral data into two-dimensional images. These images served as input for training and prediction using the ConvNeXt deep convolutional neural network. The results indicated that the GADF method yielded the best performance, achieving a test set accuracy of 98.73%. Furthermore, the study contrasted the classification and prediction of watercore apples using traditional methods with the existing quantification approaches for watercore levels. The comparative results demonstrated that the proposed GADF-ConvNeXt model is more straightforward and efficient, achieving superior performance in classifying watercore grades. Furthermore, the newly proposed quantification method for watercore levels proved to be more effective.

1. Introduction

Watercore is a common physiological disorder in apples [1], primarily caused by significant temperature variations between day and night in the growing environment. These conditions hinder the timely conversion of sorbitol transported by apple leaves [2]. As a prevalent disorder, watercore not only affects apples but also occurs in other fruits such as pineapples [3,4] and pears [5]. The primary manifestation of watercore in apples appears during the ripening stage, where the flesh cells near the core and vascular bundles become saturated with a translucent water-soaked substance. This substance gradually spreads outward as the apple matures [6], yet it remains imperceptible from the exterior. While watercore is technically a disorder, a moderate degree of watercore can enhance the apple’s texture and flavor, thereby increasing its market value. Such apples are particularly favored by consumers. However, if watercored apples are stored for extended periods, the watercore diminishes, often leading to internal decay or browning [7], which severely impacts their quality, marketability, and edibility. Due to the internal nature of watercore, it cannot be visually detected. Moreover, there is currently a lack of efficient and practical methods for its detection. Traditional approaches to identifying watercore in apples are often destructive and irreversible, rendering them unsuitable for large-scale applications.
In recent years, scholars, both domestically and internationally, have conducted extensive research on the detection of watercore in apples. Techniques such as density measurement, thermal imaging, CT, nuclear magnetic resonance, and electrical property indices [8,9,10] have been successfully employed to achieve the non-destructive detection of apple watercore. Compared with traditional detection methods, these approaches avoid damaging the apple and enable non-destructive testing. However, they suffer from drawbacks such as time consumption, high costs, and low recognition rates, which hinder their widespread application and promotion. Vis/NIR spectroscopy has emerged as a popular technique for non-destructive testing in recent years. It offers advantages such as simplicity in operation, rapid processing, and high accuracy, making it widely applicable in the non-destructive testing of fruits and vegetables [11,12,13,14], as well as pesticide residue detection [15,16,17]. Han Donghai et al. [18] successfully detected watercore in apples by leveraging the spectral intensity differences at a single wavelength of 810 nm between watercore-affected and normal apples. Wang Jiahua et al. [19] employed a CCD detector incorporating Germany’s MUT core technology to collect Vis/NIR transmission spectra of sample apples within a wavelength range of 500–1100 nm. The light source consisted of six 50 W quartz halogen lamps. After performing first-order derivative preprocessing on the spectral data, they selected the spectral range of 560–835 nm and constructed a PLS model using TQ Analystsoftware(V6.2, Thermo Fisher Scientific, Waltham, MA, USA). Their model achieved classification accuracies of 100%, 96.7%, and 98.8% for apples affected by brown rot, watercore, and normal apples, respectively. Guo Junxian et al. [20] built a custom NIR transmission spectroscopy system to acquire spectral data from both normal apples and suspected watercore apples. This system comprised two 100 W tungsten–halogen lamps as light sources, an NIR spectrometer (USB2000+, Ocean Optics, Dunedin, FL, USA), and additional accessories, covering a wavelength range of 600–1200 nm. After preprocessing the spectral data, they extracted spectral features using a manifold learning method and applied the k-nearest neighbors (KNN) algorithm to determine the presence of watercore, enabling effective identification of watercore in Xinjiang’s Bingtangxin Red Fuji apples. Chang et al. [21] developed a custom-built device for the online acquisition of Vis/NIR spectral data from apples. The system incorporated a QE65000 spectrometer (Ocean Optics, USA) with a wavelength range of 400–1200 nm and a resolution of 0.78 nm, illuminated by two 150 W tungsten–halogen lamps. Using spectral data from 550 to 950 nm, they established a model for watercore detection and severity classification. However, the classification accuracy for watercore severity was suboptimal. Zihan Chen et al. [22] proposed a detection method based on optical parameter inversion and the MobileNetV3 model, achieving successful identification of watercore and severity grading. Their model yielded classification accuracies of 99.05% for binary classification, 96.77% for three-class classification, and 94.45% for four-class classification. Zhiming Guo et al. [23] developed a portable Vis/NIR transmission spectroscopy system to collect spectral data from apples. This system utilized an SE2050 spectrometer (OTO Photonics, Hsinchu, Taiwan, China) with a wavelength range of 500–1100 nm and two 100 W tungsten–halogen lamps as the light source. By integrating chemometric methods, they achieved non-destructive measurements of apple quality parameters, including SSC content, watercore severity, firmness, and pH. Their CARS-CNN model demonstrated a predictive correlation coefficient of 0.943 for watercore severity in the test set. These studies collectively indicate that Vis/NIR spectroscopy can effectively detect the presence of watercore, classify its severity, and predict its extent. However, two significant challenges remain. First, traditional approaches for building classification or predictive models based on Vis/NIR spectral data involve a cumbersome process of preprocessing combinations, wavelength selection, and classification methods to optimize model performance [11,13,17,19,20,21,23]. The accuracy of models varies significantly depending on the chosen wavelength selection method, highlighting the need for a more streamlined and effective model construction approach. Second, current research on watercore severity primarily relies on the cross-sectional area of watercore lesions for classification [7,21,22,23,24,25,26,27]. Given that watercore develops internally and distributes unevenly within the apple, using a single cross-section as the basis for quantifying overall severity lacks precision. Therefore, more accurate computational methods are needed to quantify watercore severity comprehensively, considering its overall spatial distribution within the apple.
With the significant advancement in computational power and the rapid progress in the field of computer vision, deep learning and other artificial intelligence technologies have achieved groundbreaking developments, leading to the widespread adoption of end-to-end deep learning models. Convolutional neural networks (CNNs), as one of the quintessential algorithms in deep learning, have undergone extensive evolution since their introduction by LeCun et al. in 1998 [28]. Building upon the original CNN framework, numerous neural network architectures have emerged, such as AlexNet [29], VGGNet [30], ResNet [31], and EfficientNet [32], which excel in processing high-dimensional visible/near-infrared spectral data and extracting deeper insights into their intrinsic features. Currently, CNNs are predominantly employed for spectral data feature extraction, pattern recognition, and regression analysis, with most studies utilizing one-dimensional spectral data as input and implementing relatively simple custom-built network structures. For instance, Cai Jianrong et al. [33] employed a handheld acquisition system to gather spectral data of citrus and utilized a self-designed one-dimensional CNN (1D-CNN) to predict the soluble solid content of citrus. Their network, comprising seven layers including input, convolution, pooling, fully connected, and output layers, adopted a model-based transfer learning method and achieved a root mean square error of 0.531 on the prediction set. Similarly, Yang Sen et al. [34] collected near-infrared spectral data from four rice varieties, preprocessed the data using detrending and useless variable elimination methods to remove redundant spectral features, enhanced the dataset, and subsequently utilized 1D-CNN for classification and prediction, achieving a test set accuracy of up to 98.12%. Furthermore, Chen Chengwu et al. [35] acquired near-infrared spectral data of processed pollen typhae, applied four preprocessing methods, employed CNNs for feature extraction and pattern recognition, and identified the optimal predictive model for the degree of carbonization of pollen typhae based on a comparative analysis of preprocessing methods. However, previous studies [36] have shown that converting one-dimensional data into two-dimensional images can more authentically capture the inherent characteristics of the data. When coupled with deep convolutional neural networks with superior feature extraction capabilities, this approach enables simpler and more effective classification and prediction. In recent years, some research has explored transforming one-dimensional near-infrared spectral data into two-dimensional images for classification or prediction tasks. For example, Huang Haixia et al. [37] investigated forest soil in the Dongfanghong Forest Farm of the Dailing Forestry Experimental Bureau in the Xiaoxing’an Mountains. By padding one-dimensional spectral data with zeros, they transformed the data into images and employed a residual neural network algorithm to establish a predictive model for soil carbon content, achieving a test set determination coefficient and root mean square error of 0.821 and 7.146, respectively. Similarly, Xu XY et al. [38] collected near-infrared spectral data of 1360 maize seeds from 12 varieties across eight regions, utilized the Gramian Angular Field (GAF) method to convert one-dimensional spectral data into images, and built a GAF-VGGNet model for maize seed origin classification, achieving an accuracy of 96.81%. Feng G et al. [39] applied the GAF method to transform near-infrared spectral data of seven soil types into images, which were then input into a self-developed convolutional neural network with a multi-scale spatial attention mechanism for predicting soil trace element content. The results demonstrated that this model exhibited superior performance compared to state-of-the-art techniques in statistical comparisons.
This paper proposes a novel method for quantifying the severity of watercore in apples. First, the Vis/NIR transmission spectral data of apples are collected. The apples are then precisely sliced into thin sections, each with a uniform thickness of 4.5 mm, using a specialized cutting tool. Image data of each apple slice are subsequently acquired. By integrating image recognition with a layered stacking approach, the spatial distribution of watercore within the apple is reconstructed. This reconstructed structure is then compared to the apple as a whole to compute the severity of watercore. Building on this foundation, this study selects both watercore-affected and healthy apples as research subjects and introduces a classification model based on a deep convolutional neural network for grading watercore severity. Apples are first categorized into different watercore levels based on the computed severity. Their one-dimensional Vis/NIR transmission spectral data are then transformed into two-dimensional images, which are used to train and predict watercore severity levels via the deep convolutional neural network, thereby enabling automated classification of watercore severity in apples.

2. Experiments and Methods

2.1. Experiment

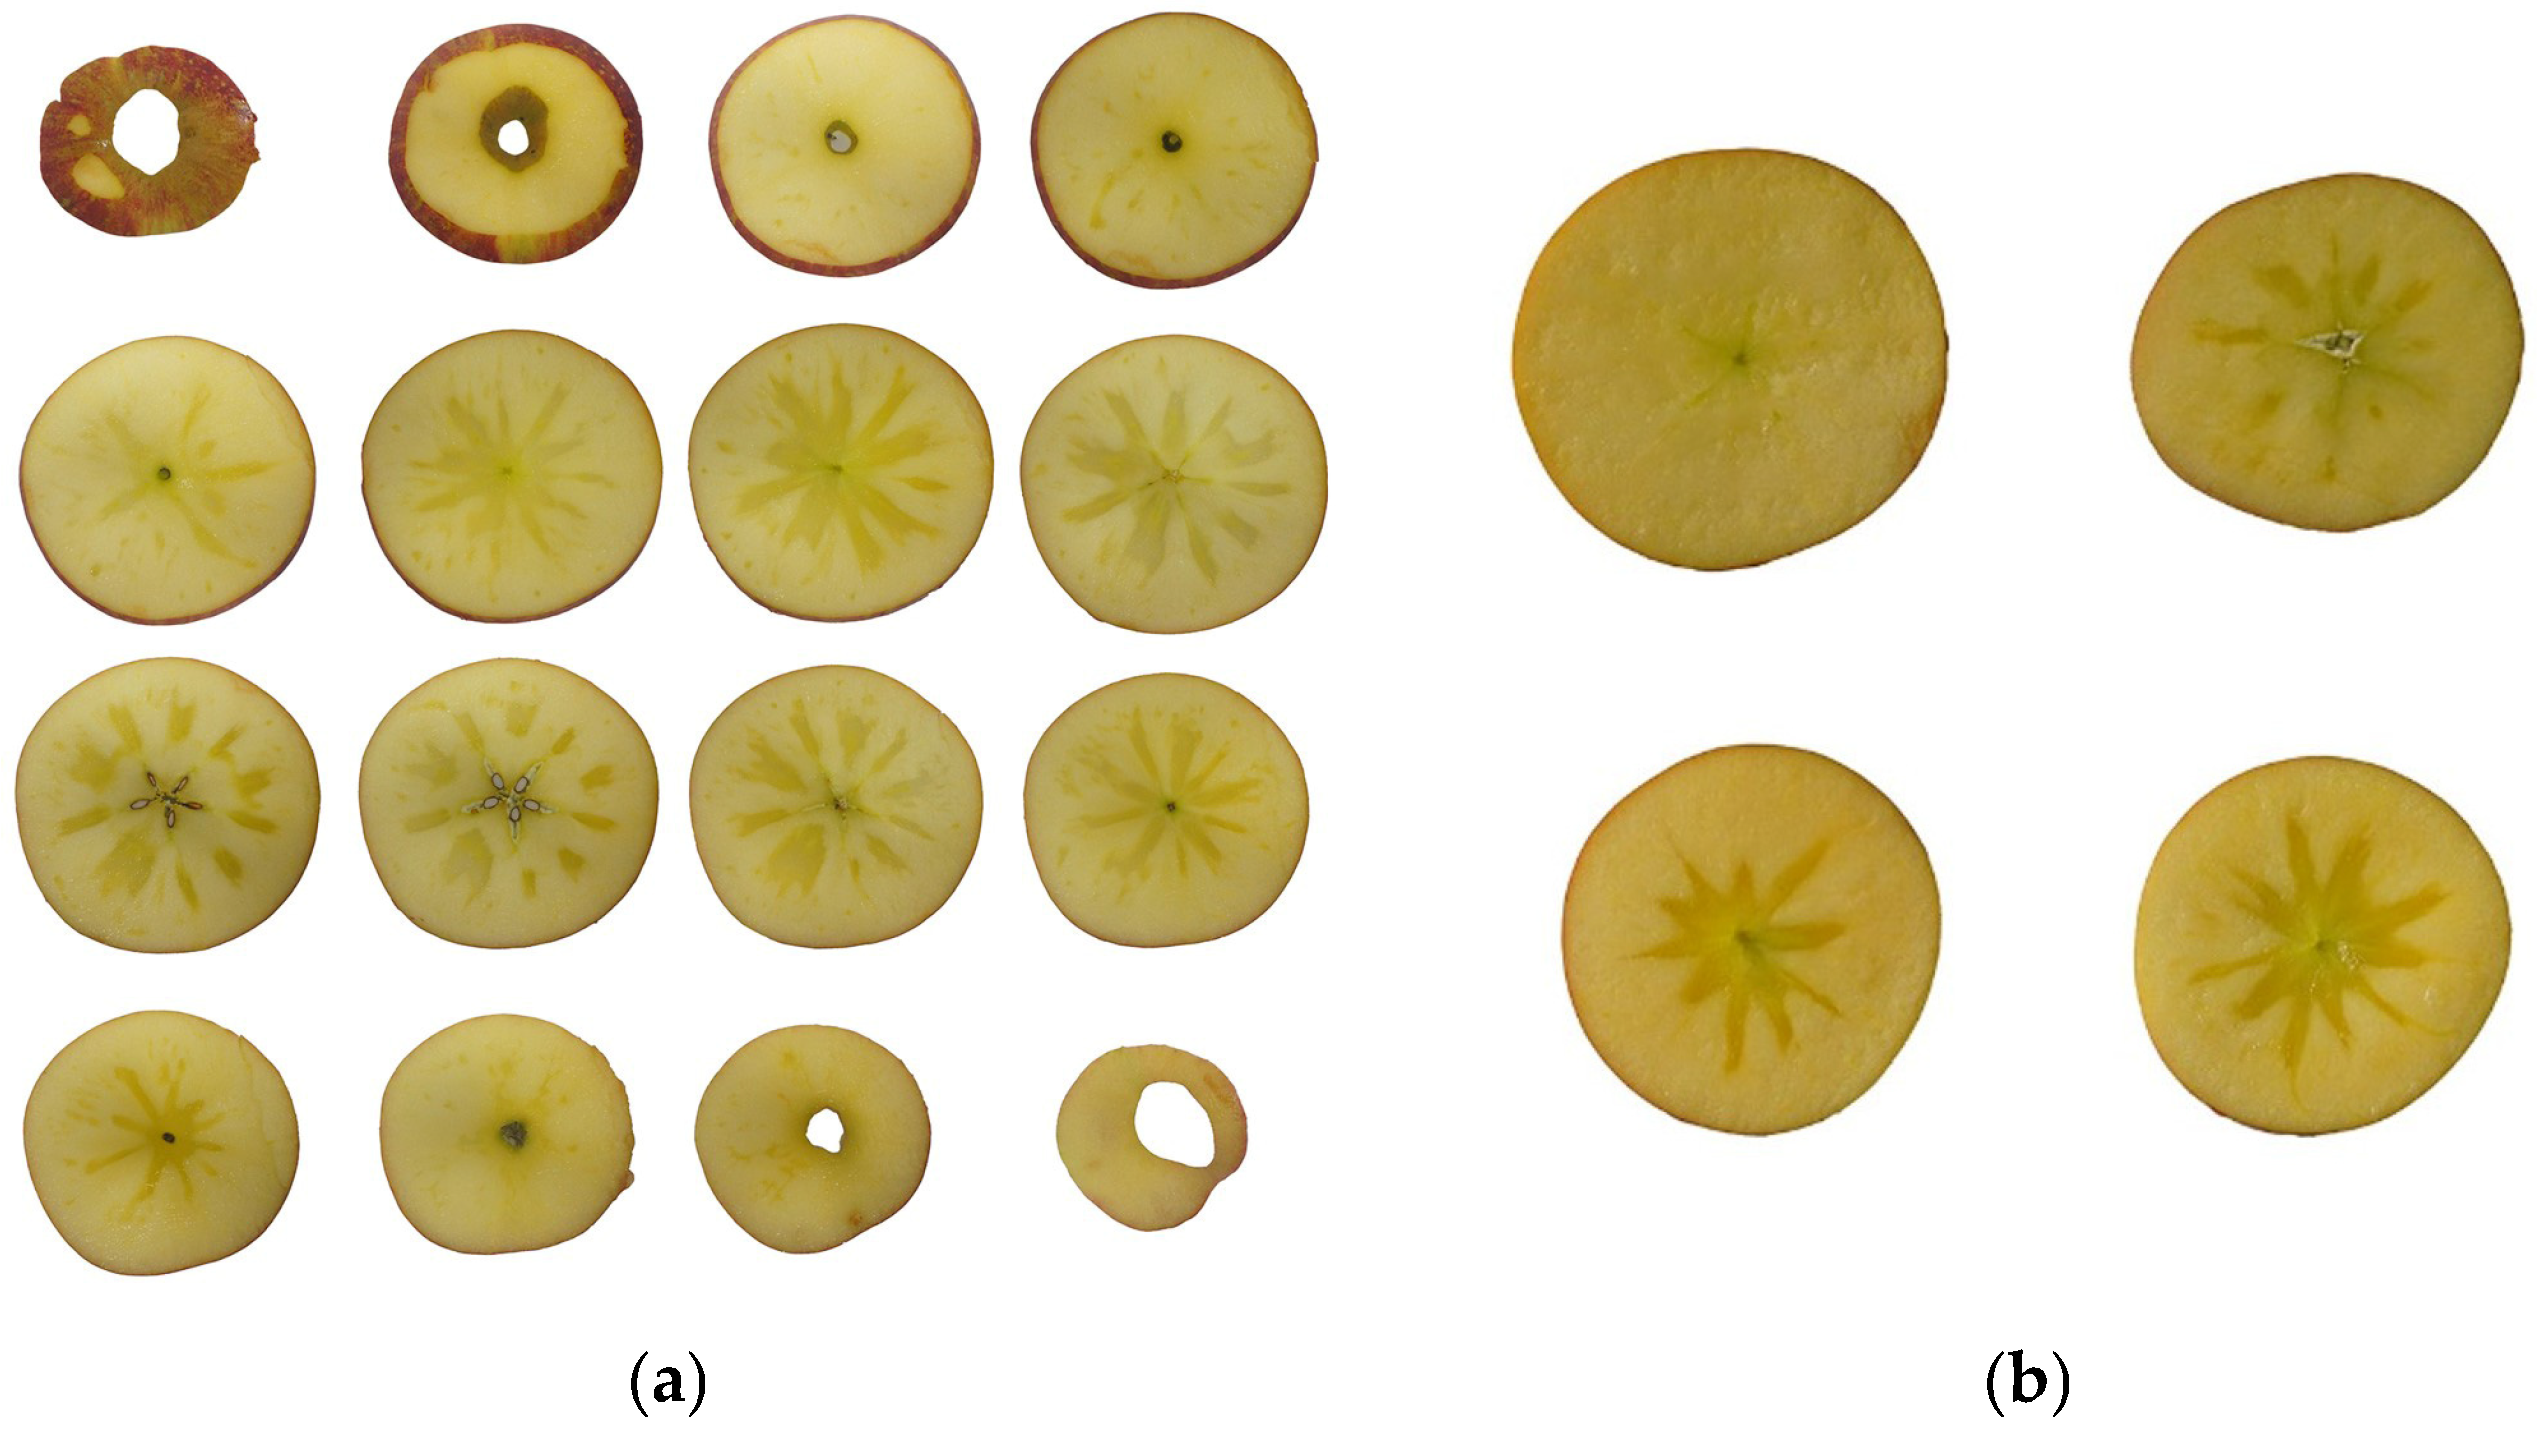
2.1.1. Experimental Samples

The apple samples analyzed in this study were gathered from an orchard in Zhaotong, Yunnan Province, China, between October and December 2023. Farmers randomly selected both undamaged apples and those suspected of having watercore from various trees. A total of 800 apples were acquired in multiple rounds, with each batch containing 100 specimens. To ensure safe transport, all batches were individually wrapped in protective sleeves and delivered to the laboratory. Upon arrival, the apples were carefully unpacked and arranged in a single layer. They were then left at room temperature for 12 hours before being gently wiped to remove any surface dirt or dust. A thorough inspection followed, verifying that each fruit remained intact and unblemished. Finally, a unique identification number was assigned to every sample.

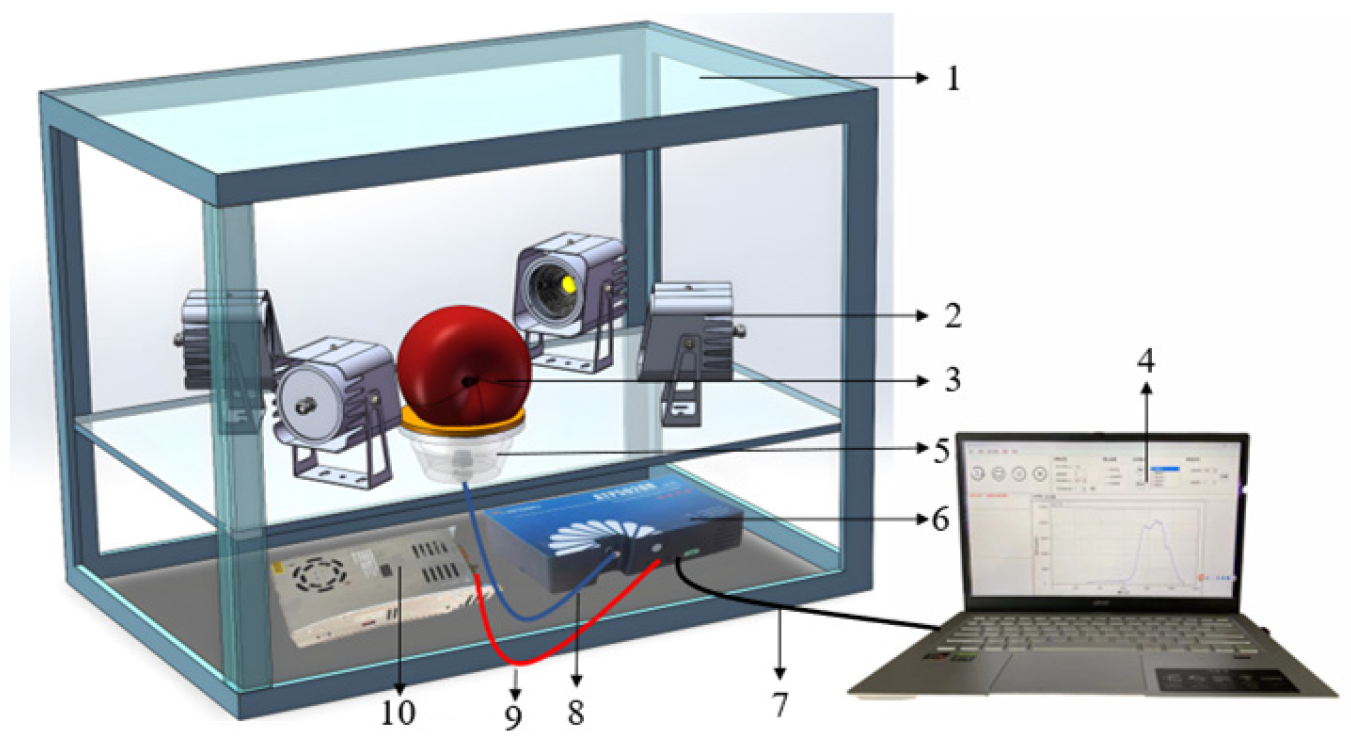
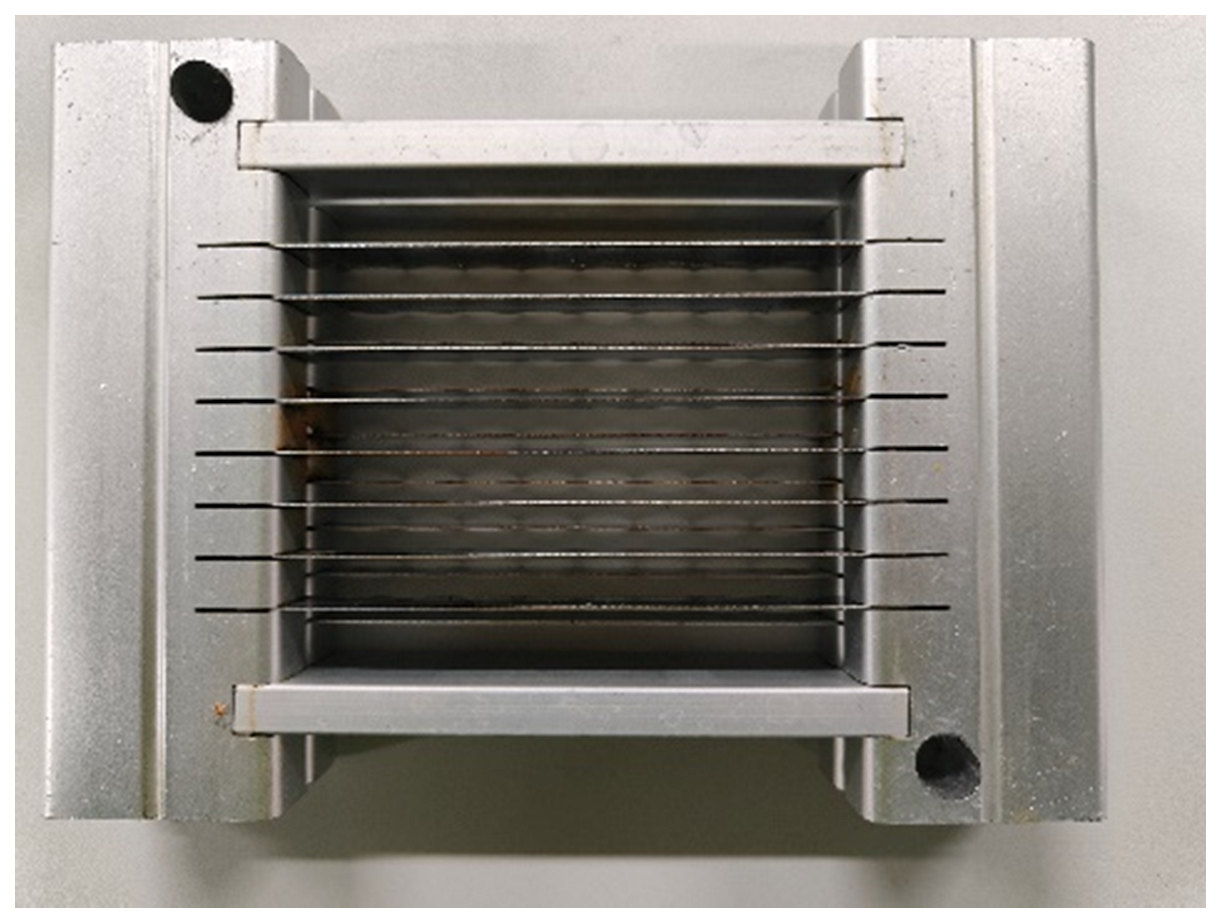
2.1.2. Experimental Instruments

The Vis/NIR transmission spectral data of the apples were collected using a custom-built acquisition platform, as depicted in Figure 1.
The setup primarily includes a black box, four halogen lamps (OSRAM, 12 V, 100 W), fiber optics, a spectrometer (Optosky, ATP5020R, Xiamen, China), data cables, transformers, a computer, and a fruit holder for positioning the apples. The spectrometer operates within a wavelength range of 300–1100 nm. Spectral data are collected and processed using the Optosky Spectra software (V3.1, Optosky, Xiamen, China), which is designed to be fully compatible with the spectrometer.
The slicing tool employed for the apple samples is a bespoke knife. As illustrated in Figure 2, the blade section of the tool features an offset arrangement of two sets of blades, enabling precise slicing with a thickness of 4.5 mm [40]. The apple slice images were captured using a digital camera—Sony NEX-5T—with approximately 16.1 million effective pixels.

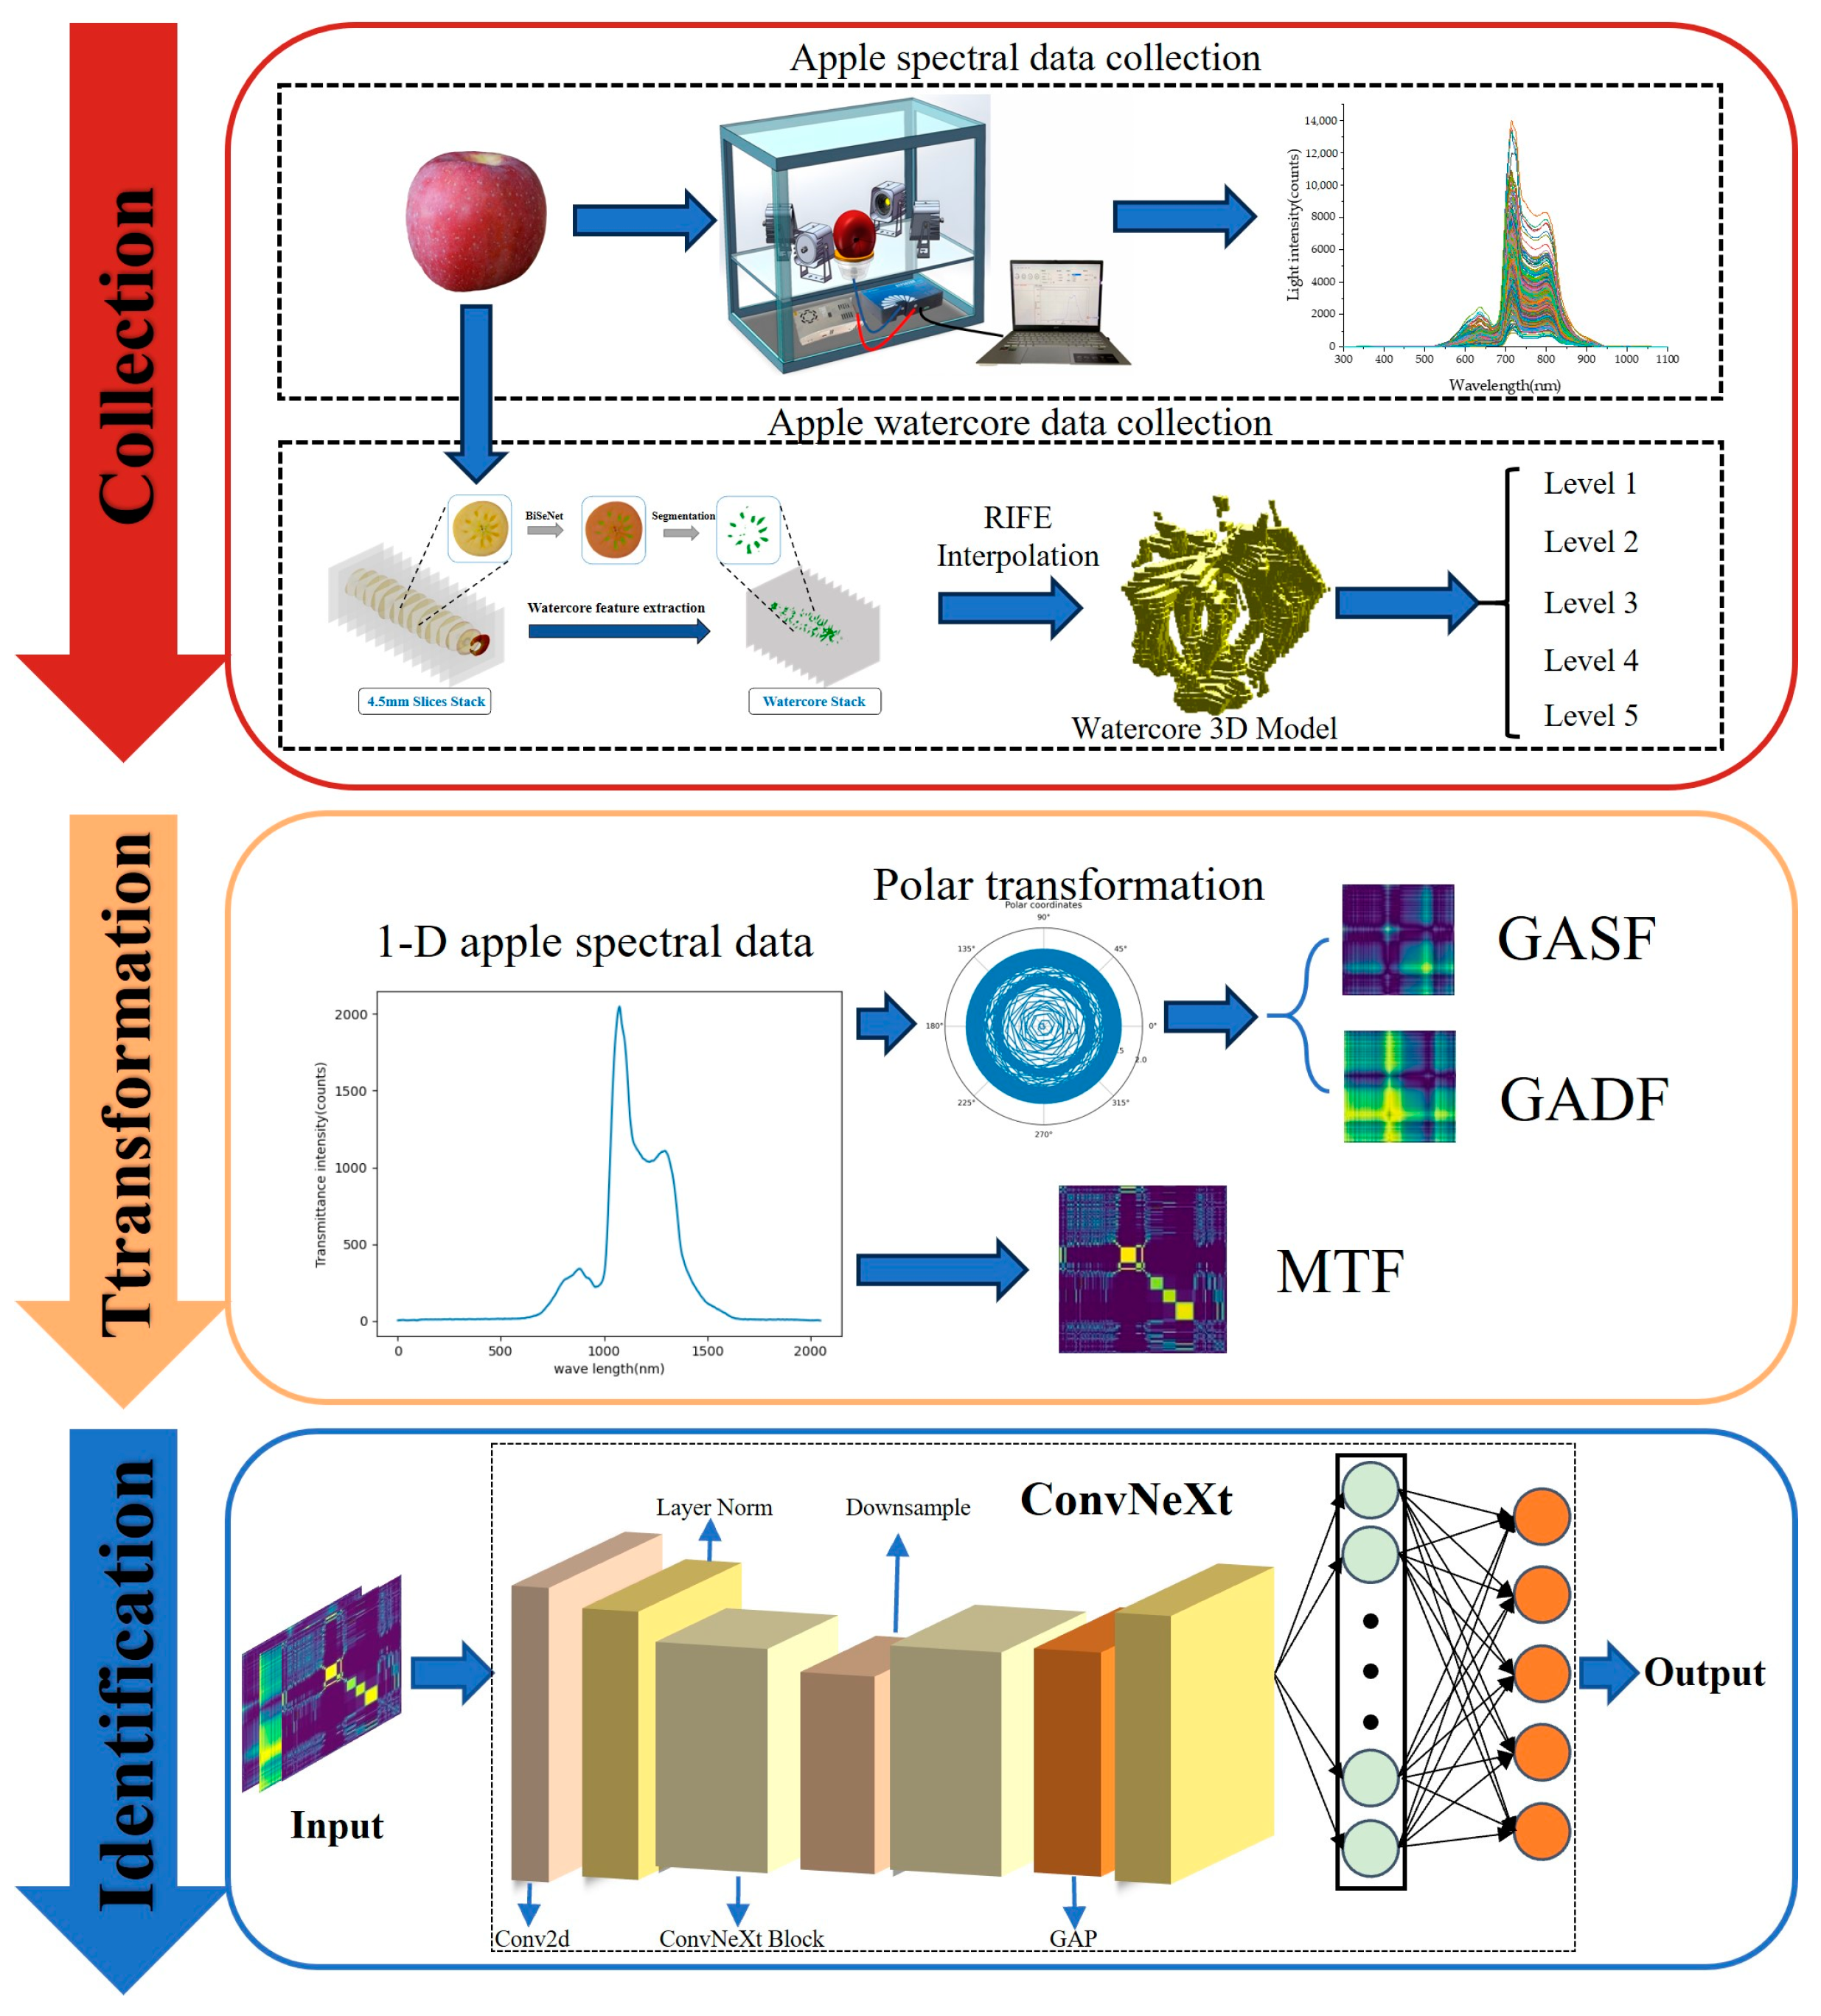
2.1.3. Data Collection

Prior to acquiring spectral data, the spectrometer was allowed to warm up for 30 minutes. Following this, dark and reference spectra were captured to perform the necessary calibration. The spectral acquisition settings were configured with an integration time of 100 ms, a filter parameter of 2, and five average scans. The length of the individual Vis/NIR spectral data collected for each apple was 2048. During spectral data acquisition, it was crucial to ensure that the apple was in direct contact with the bottom of the fruit cup without any gaps. The acquisition software, provided by the spectrometer manufacturer, was set to a continuous mode, and data collection began once the spectral signal became stable. The apples were arranged so that their stem axes were aligned perpendicular to the direction of the light source, and measurements were taken at 120° intervals. For each direction, the transmission spectrum was determined by averaging three consecutive readings. Every 10 minutes during the spectral collection process, the dark and reference spectra were re-acquired to maintain accuracy in the measurements.
After collecting the spectral data of apples, the fruit was sliced along its equatorial plane using a precision blade. Each slice was then examined for the presence of watercore, with photographic documentation taken for every individual section. As illustrated in Figure 3a, the image displays multiple slices from a single apple after sectioning. In this figure, the distinctly colored central region of each slice represents the watercore-affected area. Figure 3b presents a single slice from apples exhibiting varying degrees of watercore severity.

2.2. Methods

2.2.1. The Method of One-Dimensional Spectral Data Transformation to Two-Dimensional Images

The Gramian Angular Field (GAF) method [41] is a data dimensionality transformation technique based on polar coordinate Gram matrices, enabling the conversion of one-dimensional data into two-dimensional images.
The GAF encoding process involves several specific steps. In the initial step, a one-dimensional time series X = x 1 , x 2 , x 3 , , x n , containing n data points, is normalized to a range between −1 and 1. The normalized series is denoted as X = x 1 , x 2 , x 3 , , x n . The normalization procedure is mathematically represented by Equation (1):
x ~ i = x i x m a x + x i x m i n x m a x x m i n
In this context, x ~ i denotes each element in the normalized one-dimensional time series, whereas xi refers to each element in the original time series.
In the second step, the data are transformed into polar coordinates, with the corresponding calculation expressed in Equation (2):
= arccos x ~ l , 1 x ~ l 1 , x ~ l X ~ r = t i N , t i N
In this case, ti denotes the timestamp, and N refers to the number of equal intervals into which the unit length of the polar coordinate is divided. This approach for representing a one-dimensional time series in polar coordinates offers two main advantages: (1) the transformation is bijective, ensuring a one-to-one correspondence between x ~ l and ; (2) it maintains the temporal information of the original series, with the time value being determinable from the radial coordinate.
In the third step, the relationship between each time point is characterized through trigonometric functions and angle formulas. This can be represented in two different forms, as indicated in Equations (3) and (4).
G A S F = cos 1 + 1 cos 1 + n cos 2 + 1 cos 2 + n cos i + i cos n + 1 cos n + n
G A D F = sin 1 1 sin 1 n sin 2 1 sin 2 n sin i i sin n 1 sin n n
In this context, GASF stands for the Gramian Angular Summation Field, and GADF represents the Gramian Angular Difference Field. The symbol i _i denotes the angle in polar coordinates corresponding to the i th time point in the time series. This can alternatively be written as follows:
G A S F = X ~ · X ~ I X ~ 2 · I X ~ 2 G A D F = I X ~ 2 · X ~ X ~ I X ~ 2
In this case, I represents a unit row vector, and the inner product is modified by incorporating a penalty term to minimize the influence of noise.
The Markov Transition Field (MTF) [41], akin to the Gramian Angular Field (GAF), is a technique designed for analyzing time series data and is primarily used to capture transition patterns and dynamic changes within sequences. The steps for calculating the MTF are as follows:
Step 1: A one-dimensional time series X = x 1 , x 2 , x 3 , , x n with n points is divided into Q quantile regions based on the amplitude values at different time points. Each data point is mapped to a specific quantile region, qi (j ∈ [1, Q]), according to its unique characteristics.
Step 2: The Markov transition matrix W is constructed, as shown in Equation (6),
W = w 11 w 12 w 21 w 22 w 1 Q w 2 Q w Q 1 w Q 2 w Q Q
where wij represents the probability of data points transitioning from quantile region qi to quantile region qj.
Step 3: Since the Markov transition matrix exhibits low dependency on the temporal dynamics of the time series X and the step size, neglecting temporal and positional information may result in the loss of critical details inherent to the original data. Therefore, the Markov Transition Field M is constructed, as expressed in Equation (7),
M = m 11 m 12 m 21 m 22 m 1 Q m 2 Q m Q 1 m Q 2 m Q Q
where mij represents the probability of data points transitioning from quantile region qi to quantile region qj.
Vis/NIR spectral data are usually expressed as spectral vectors containing multiple wavelengths, which are typically collected at distinct time points rather than changing over time. Although Vis/NIR spectral data are not naturally one-dimensional time series, various time series analysis methods can still be applied to analyze and interpret them. These methods facilitate a deeper understanding of spectral variations, enabling more precise qualitative and quantitative analyses of the samples. Regardless of whether the data pertain to temporal sequences or non-temporal datasets, most analytical approaches are versatile and widely applicable. Consequently, image transformation techniques can be utilized to convert Vis/NIR spectral data into two-dimensional images. Such transformations unveil patterns and trends within the spectral data, providing valuable insights for tasks such as classification, clustering, and prediction, thereby enabling further in-depth analyses.

2.2.2. The Method for Quantifying Apple Watercore Severity

Existing methods for quantifying the severity of apple watercore primarily rely on the proportion of watercore area or its distribution within a single plane of the apple. To more comprehensively account for the internal distribution of watercore, a novel method is proposed based on the RIFE (Real-Time Intermediate Flow Estimation for Video Frame Interpolation) algorithm [42]. RIFE, introduced by Zhewei Hang et al. [42], is a deep learning-based video frame interpolation algorithm specifically designed to enhance frame rates in real time. The core innovation of RIFE lies in its use of optical flow estimation to generate intermediate frames between adjacent frames. By employing the IFNet (Intermediate Flow Network) architecture, RIFE directly estimates bidirectional optical flow between two input frames and optimizes the interpolation process with time-weighted adjustments, resulting in high-quality interpolated frames.
The proposed method involves slicing the apple and collecting image data of each slice. The watercore features of each slice are extracted using BiSeNet [43]. These extracted features are then stacked in the same sequence as the original slices and assigned corresponding thicknesses to reconstruct the initial 3D model of the apple’s watercore. Subsequently, the RIFE interpolation method is applied to this initial 3D model. Transitional feature images are generated between two slices containing watercore characteristics. Finally, the initial model is integrated with the RIFE-interpolated model to synthesize the final 3D model of the apple’s watercore. This process, as illustrated in Figure 4, enables a direct comparison between the reconstructed 3D model of the watercore and the entire apple. By calculating the proportion of the watercore in the reconstructed model relative to the whole apple, the severity of the watercore is determined. This method is merely a labeling approach for apple watercore levels and does not constitute a non-destructive detection method.

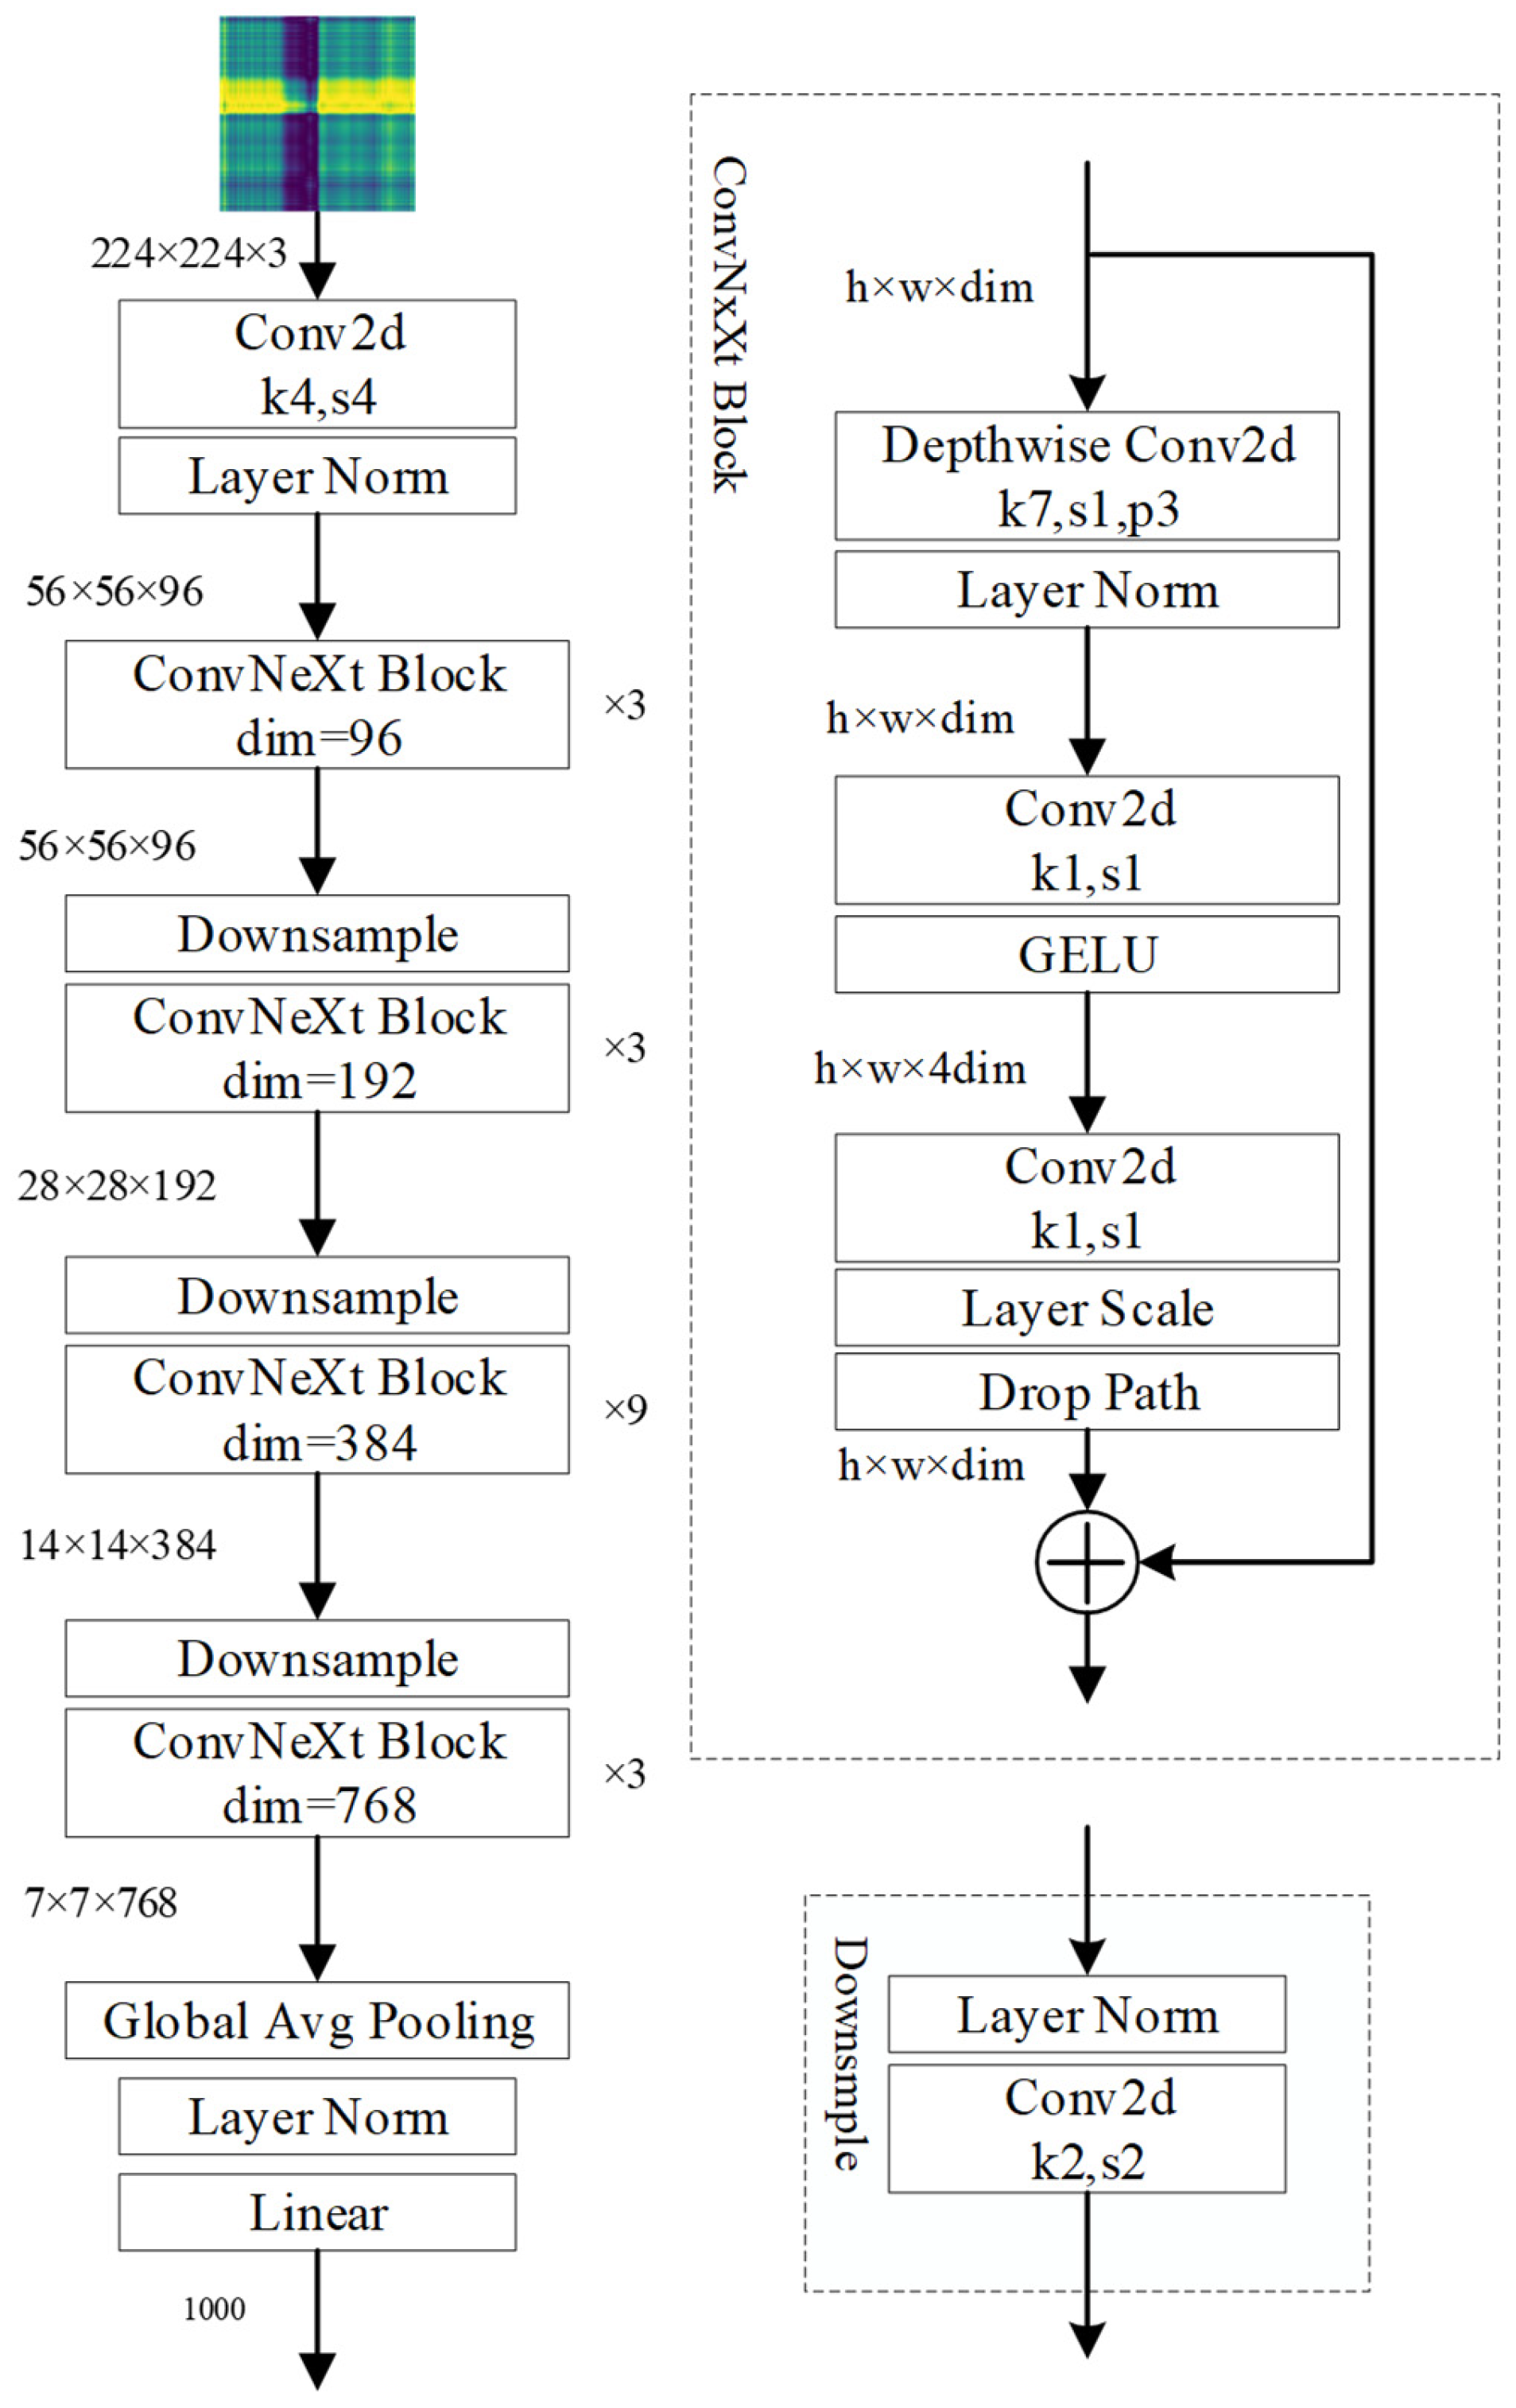
2.2.3. Apple Watercore Grading Method Based on Deep Convolutional Neural Networks and Visible/Near-Infrared Spectroscopy

The ConvNeXt network [44], proposed by Zhuang Liu et al. in 2022, is a purely convolutional neural network that integrates advanced training techniques and architectural designs from transformers into the ResNet50 network. This includes features such as reversed bottlenecks, convolutional kernels, and intricate micro-designs, resulting in significantly improved performance. The structure of the ConvNeXt network is illustrated in Figure 5.
Figure 6 shows the flowchart for the research on the apple watercore grading method based on deep convolutional neural networks and visible/near-infrared spectroscopy. The process of this method is divided into three main steps: The first step is data collection. This involves collecting the Vis/NIR spectroscopy data of the sample apples, with a wavelength range of 300–1100 nm and 2048 bands. Then, the apples are sliced and photographed, and the watercore degree of the apples is calculated using BiSeNet and RIFE. The watercore grading data of the sample apples are also collected. The second step is data transformation. Three methods, GASF, GADF, and MTF, are used to convert the collected one-dimensional spectral data into two-dimensional images. To ensure the full visualization of the apple spectral data, the spectral data are transformed into two-dimensional images without overlap. The third step is recognition. The two-dimensional images from the second step are randomly divided into training and test sets in an 8:2 ratio. The labels of the two-dimensional images are the apple sugar core grades calculated in the first step. The training set is then input into the model to train the ConvNeXt network, completing the training and saving the parameters. The model’s classification performance is validated using the test set, and the final results are output, with the weight parameters saved, completing the construction of the final model. The third step also includes processes such as selecting the optimal image transformation method.

3. Results

All the training and experiments described in this paper were performed on a personal computer with the following configuration: an Intel i7-13700 k processor (CPU), an NVIDIA GeForce RTX 4090 24 GB (NVIDIA, Santa Clara, CA, USA) graphics card, a Windows 11 operating system, and a Python 3.9 environment. The ConvNeXt-T network model was built using the PyTorch (Meta Platforms, Menlo Park, CA, USA) framework.

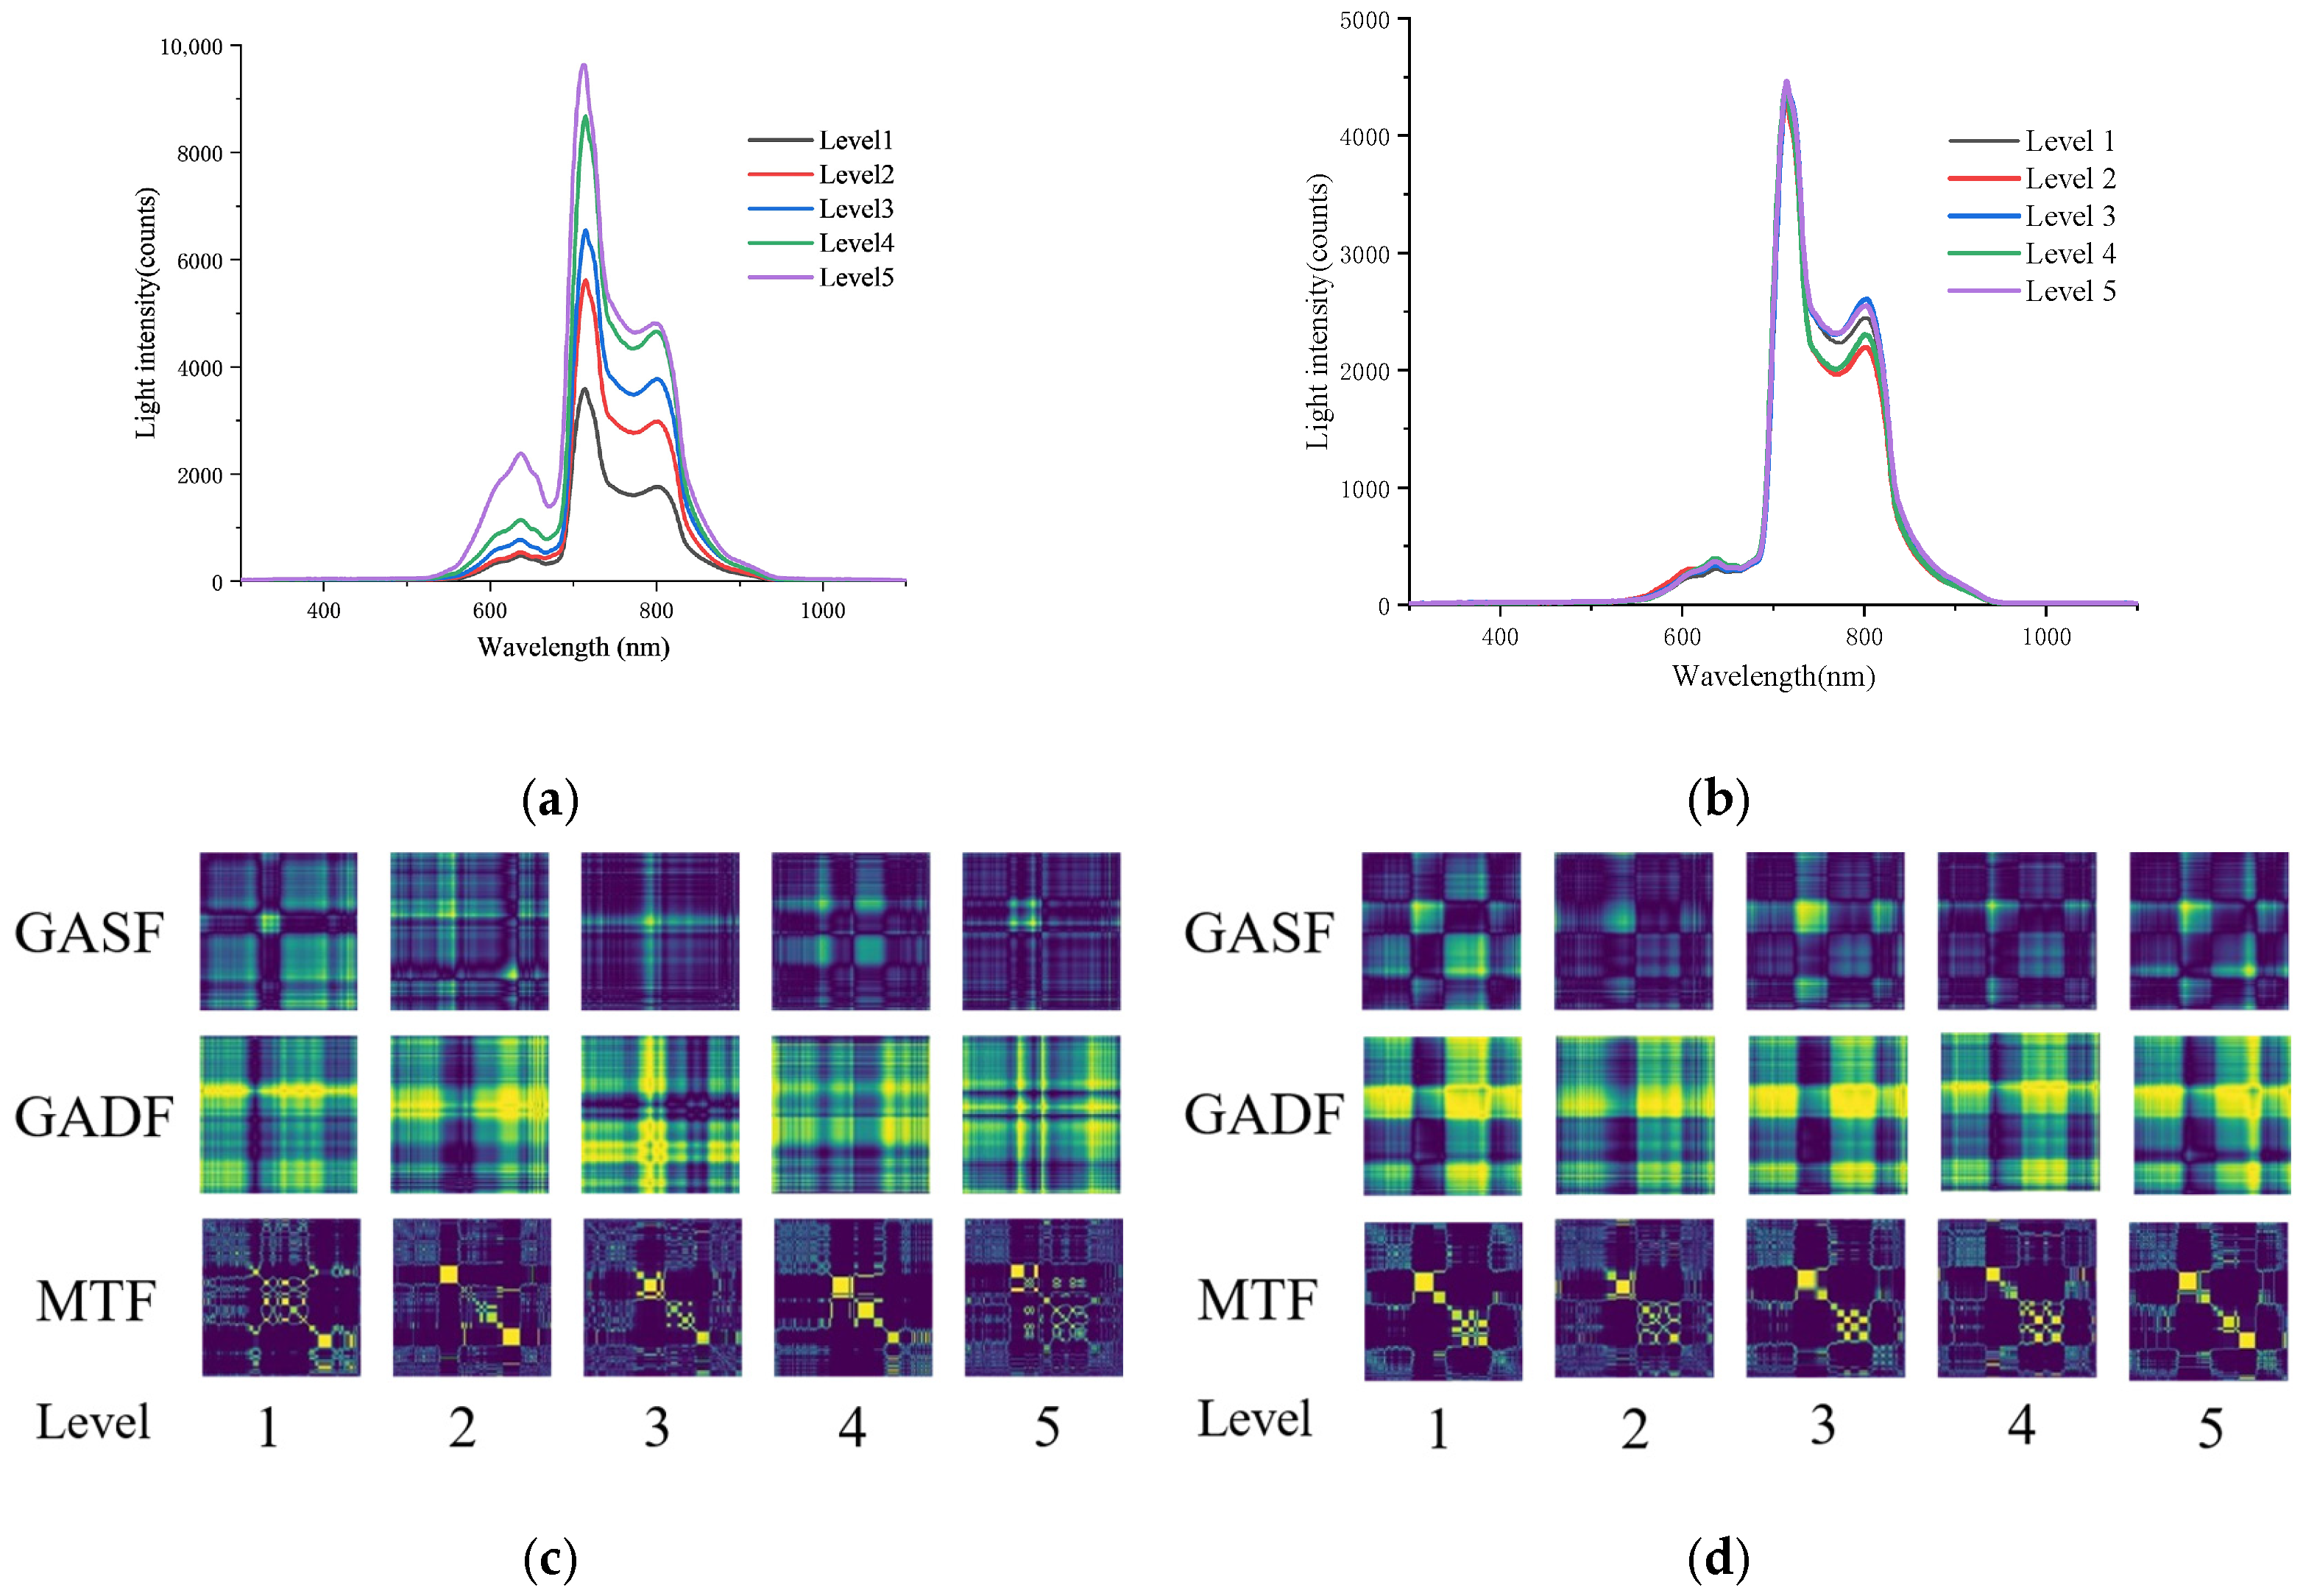
3.1. Results of Data Collection

The apple samples used in this study totaled 800, with the collected Vis/NIR spectral data illustrated in Figure 7.
Among the 800 apple samples, 626 exhibited watercore, while 174 were classified as normal apples. Utilizing the method for quantifying apple watercore levels proposed earlier, the watercore levels of all samples were calculated. For the 626 watercore apples, the maximum watercore level reached 11.89%, the minimum was 0.09%, the average was 2.22%, and the variance of the watercore level data was 2.87. Based on the watercore level data and existing apple watercore grading methods, the apples were ultimately divided into five grades. For simplicity, normal apples were designated as Level 1; those with watercore levels below 1% as Level 2; levels between 1% and 2% as Level 3; levels between 2% and 3% as Level 4; and levels exceeding 3% as Level 5. The count and proportion of apples in each grade within the total sample are presented in Table 1.

3.2. Transformation of One-Dimensional Spectral Data into Two-Dimensional Images

This study primarily employed three methods—GASF, GADF, and MTF—to convert one-dimensional data into two-dimensional images. Apple watercore levels were classified into five distinct grades. Under normal circumstances, apples with higher watercore levels exhibit greater light transmittance in the watercore region [45]. Consequently, the Vis/NIR spectral intensity values increase with higher watercore grades, as illustrated in Figure 8a. However, due to the uneven distribution of watercore within apples, sample variability, and data collection errors, certain data do not show a consistent increase in light intensity values with higher watercore levels. In some cases, spectral data from different watercore grades may overlap or intersect, as shown in Figure 8b, which complicates classification for such data. Figure 8c,d illustrate the conversion of one-dimensional spectral data into two-dimensional images. In these figures, each row represents the conversion results for different spectral data using the same method, while each column corresponds to the results of different methods applied to the same spectral data. In the figures, GASF, GADF, and MTF denote the image conversion methods, while numbers 1–5 represent the watercore grades. Figure 8c shows the images derived from the data in Figure 8a. It is evident that the images produced by different methods for the same spectral data exhibit significant differences. Moreover, spectral data from different watercore grades that show considerable variation under the same method also yield distinctly different images. Figure 8d depicts the images obtained from the data in Figure 8b. Even for spectral data with minimal differences between grades, the resulting images still exhibit noticeable distinctions. Therefore, converting one-dimensional data into two-dimensional images can more effectively highlight the characteristics of the original data. When combined with the robust feature extraction capabilities of deep convolutional neural networks, this approach facilitates more accurate classification and prediction.
Furthermore, an essential parameter in converting images using GASF, GADF, and MTF is the resolution of the resulting images. The original spectral data have a length of 2048. Without compression, the generated image dimensions would be 2048 × 2048, resulting in an exceedingly large data volume, which significantly hinders training efficiency. Thus, dimensionality reduction is necessary to compress the data. Preliminary experimental results [46] indicated that when the image resolution is set to 256 × 256, the training efficiency and achievable classification accuracy reach an optimal balance. Therefore, in this study, the images generated from one-dimensional spectral data using different methods were uniformly resized to 256 × 256.

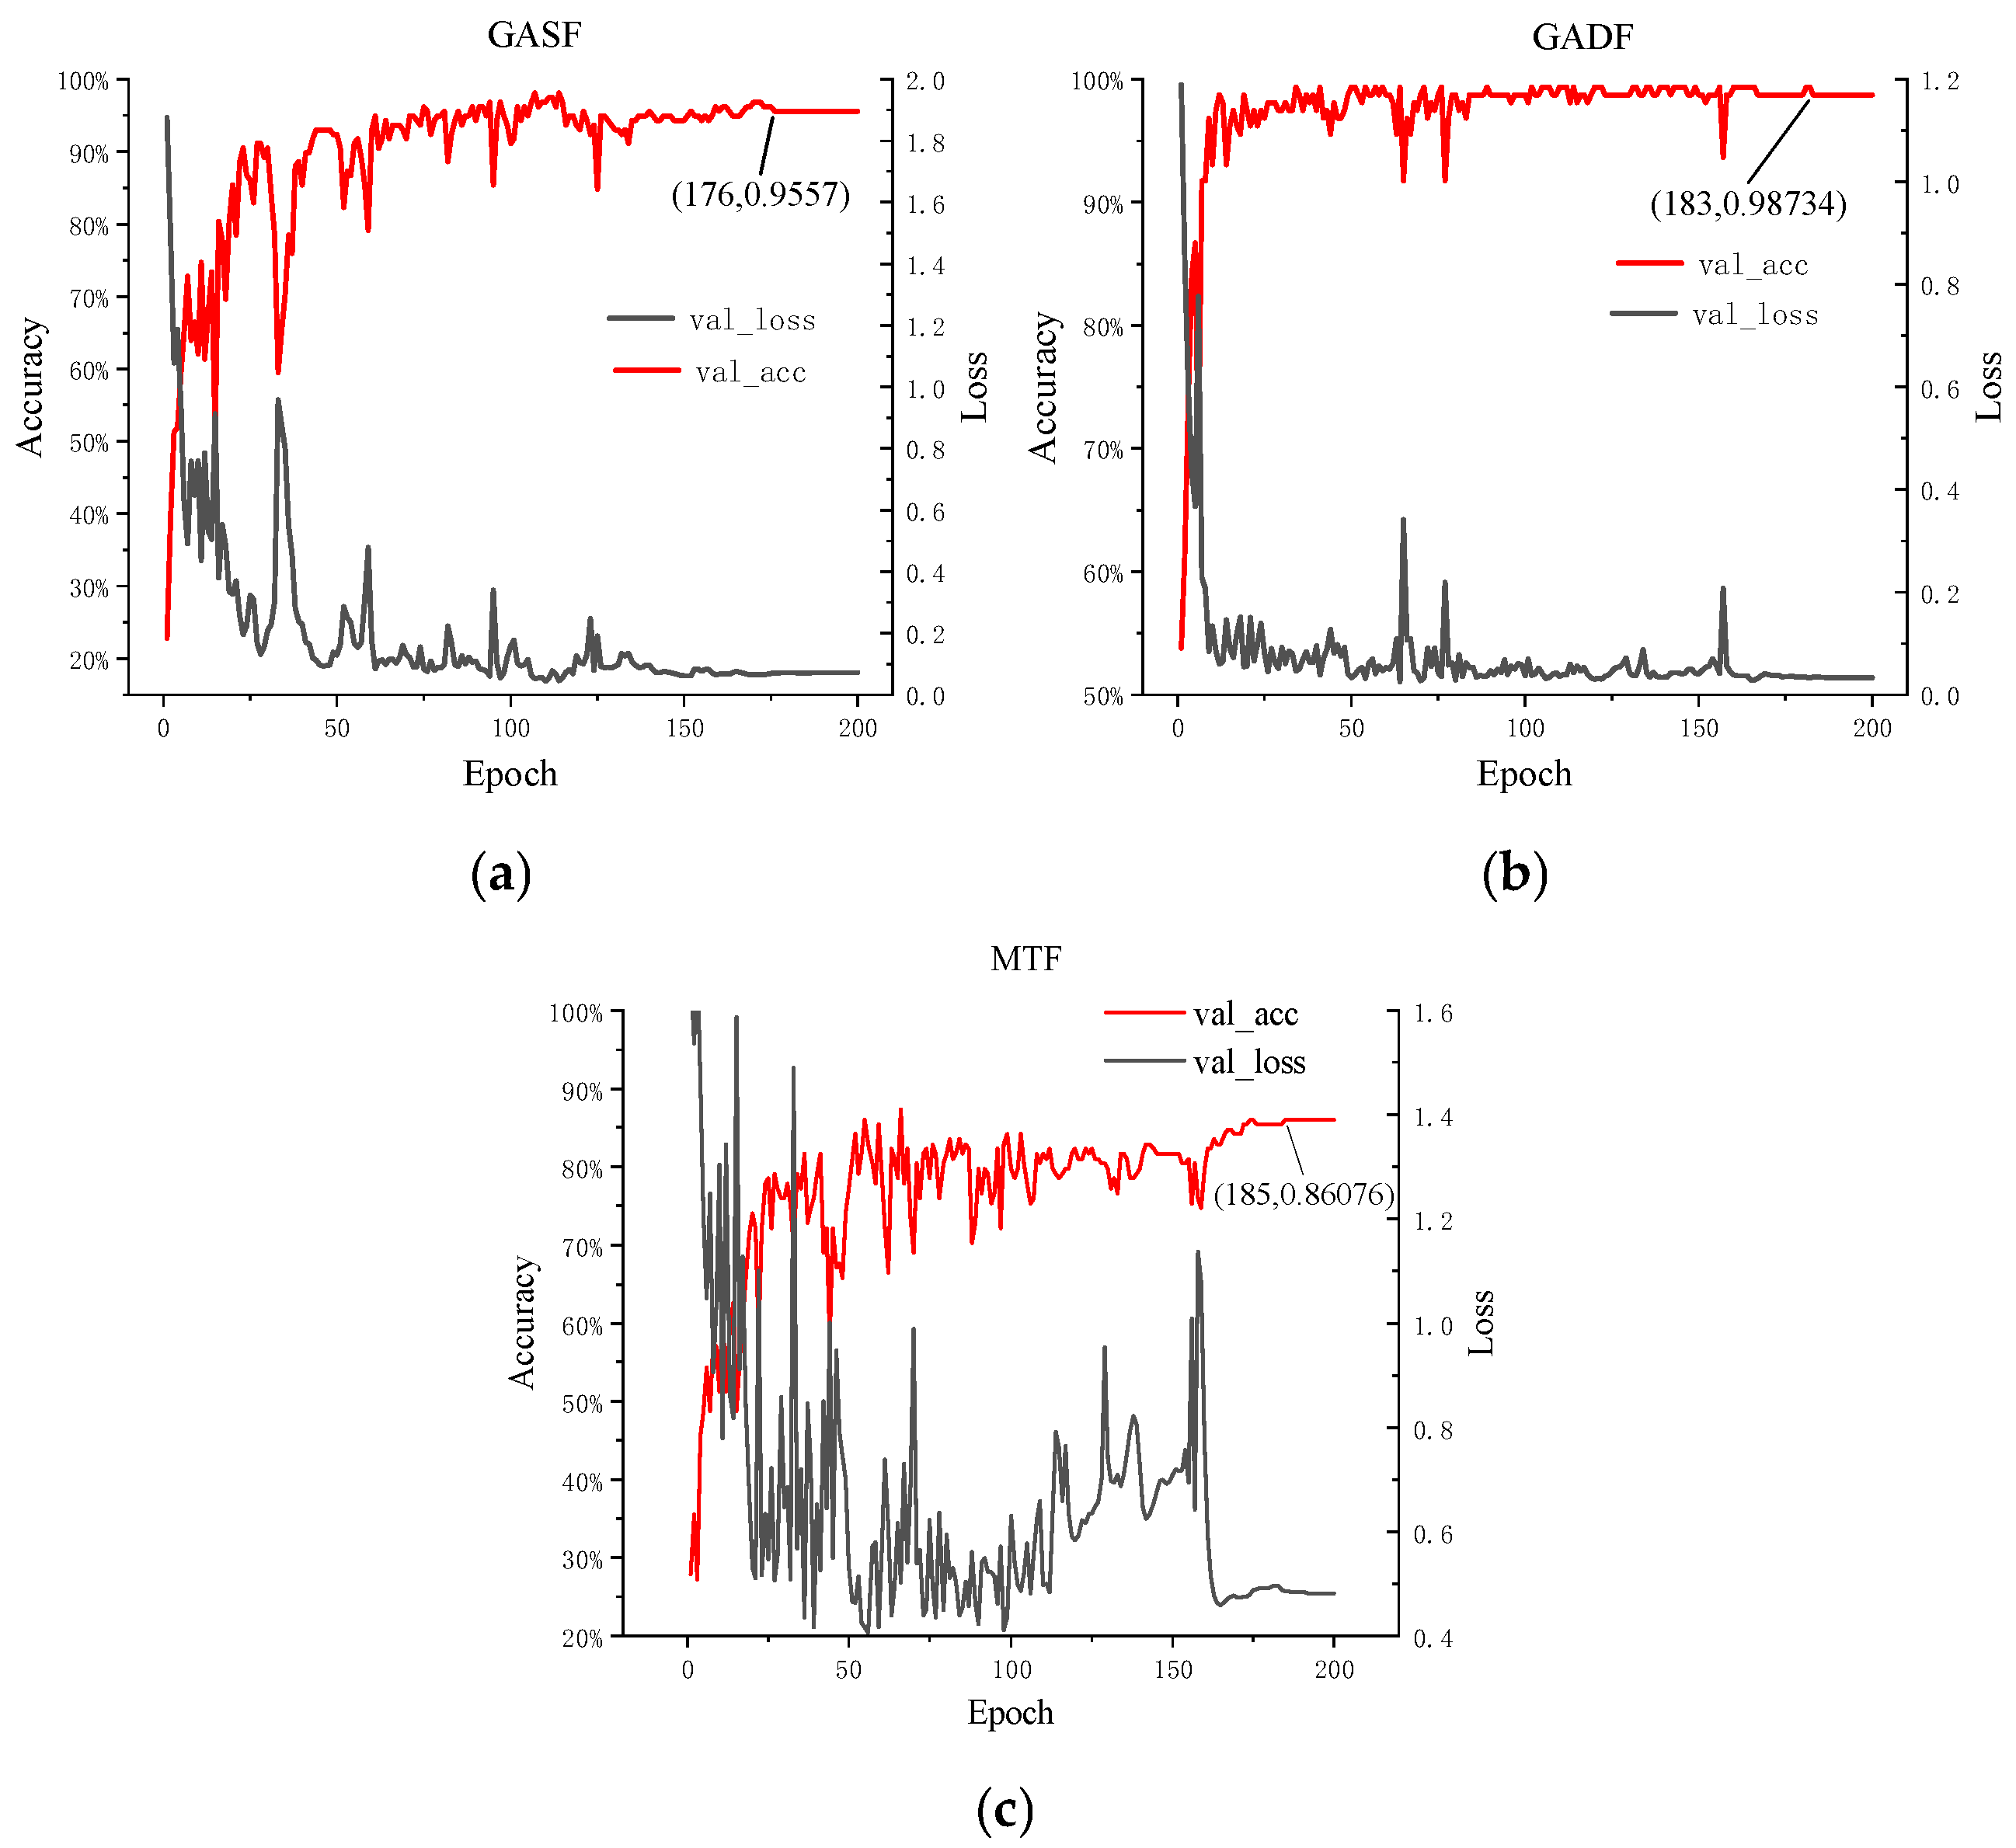
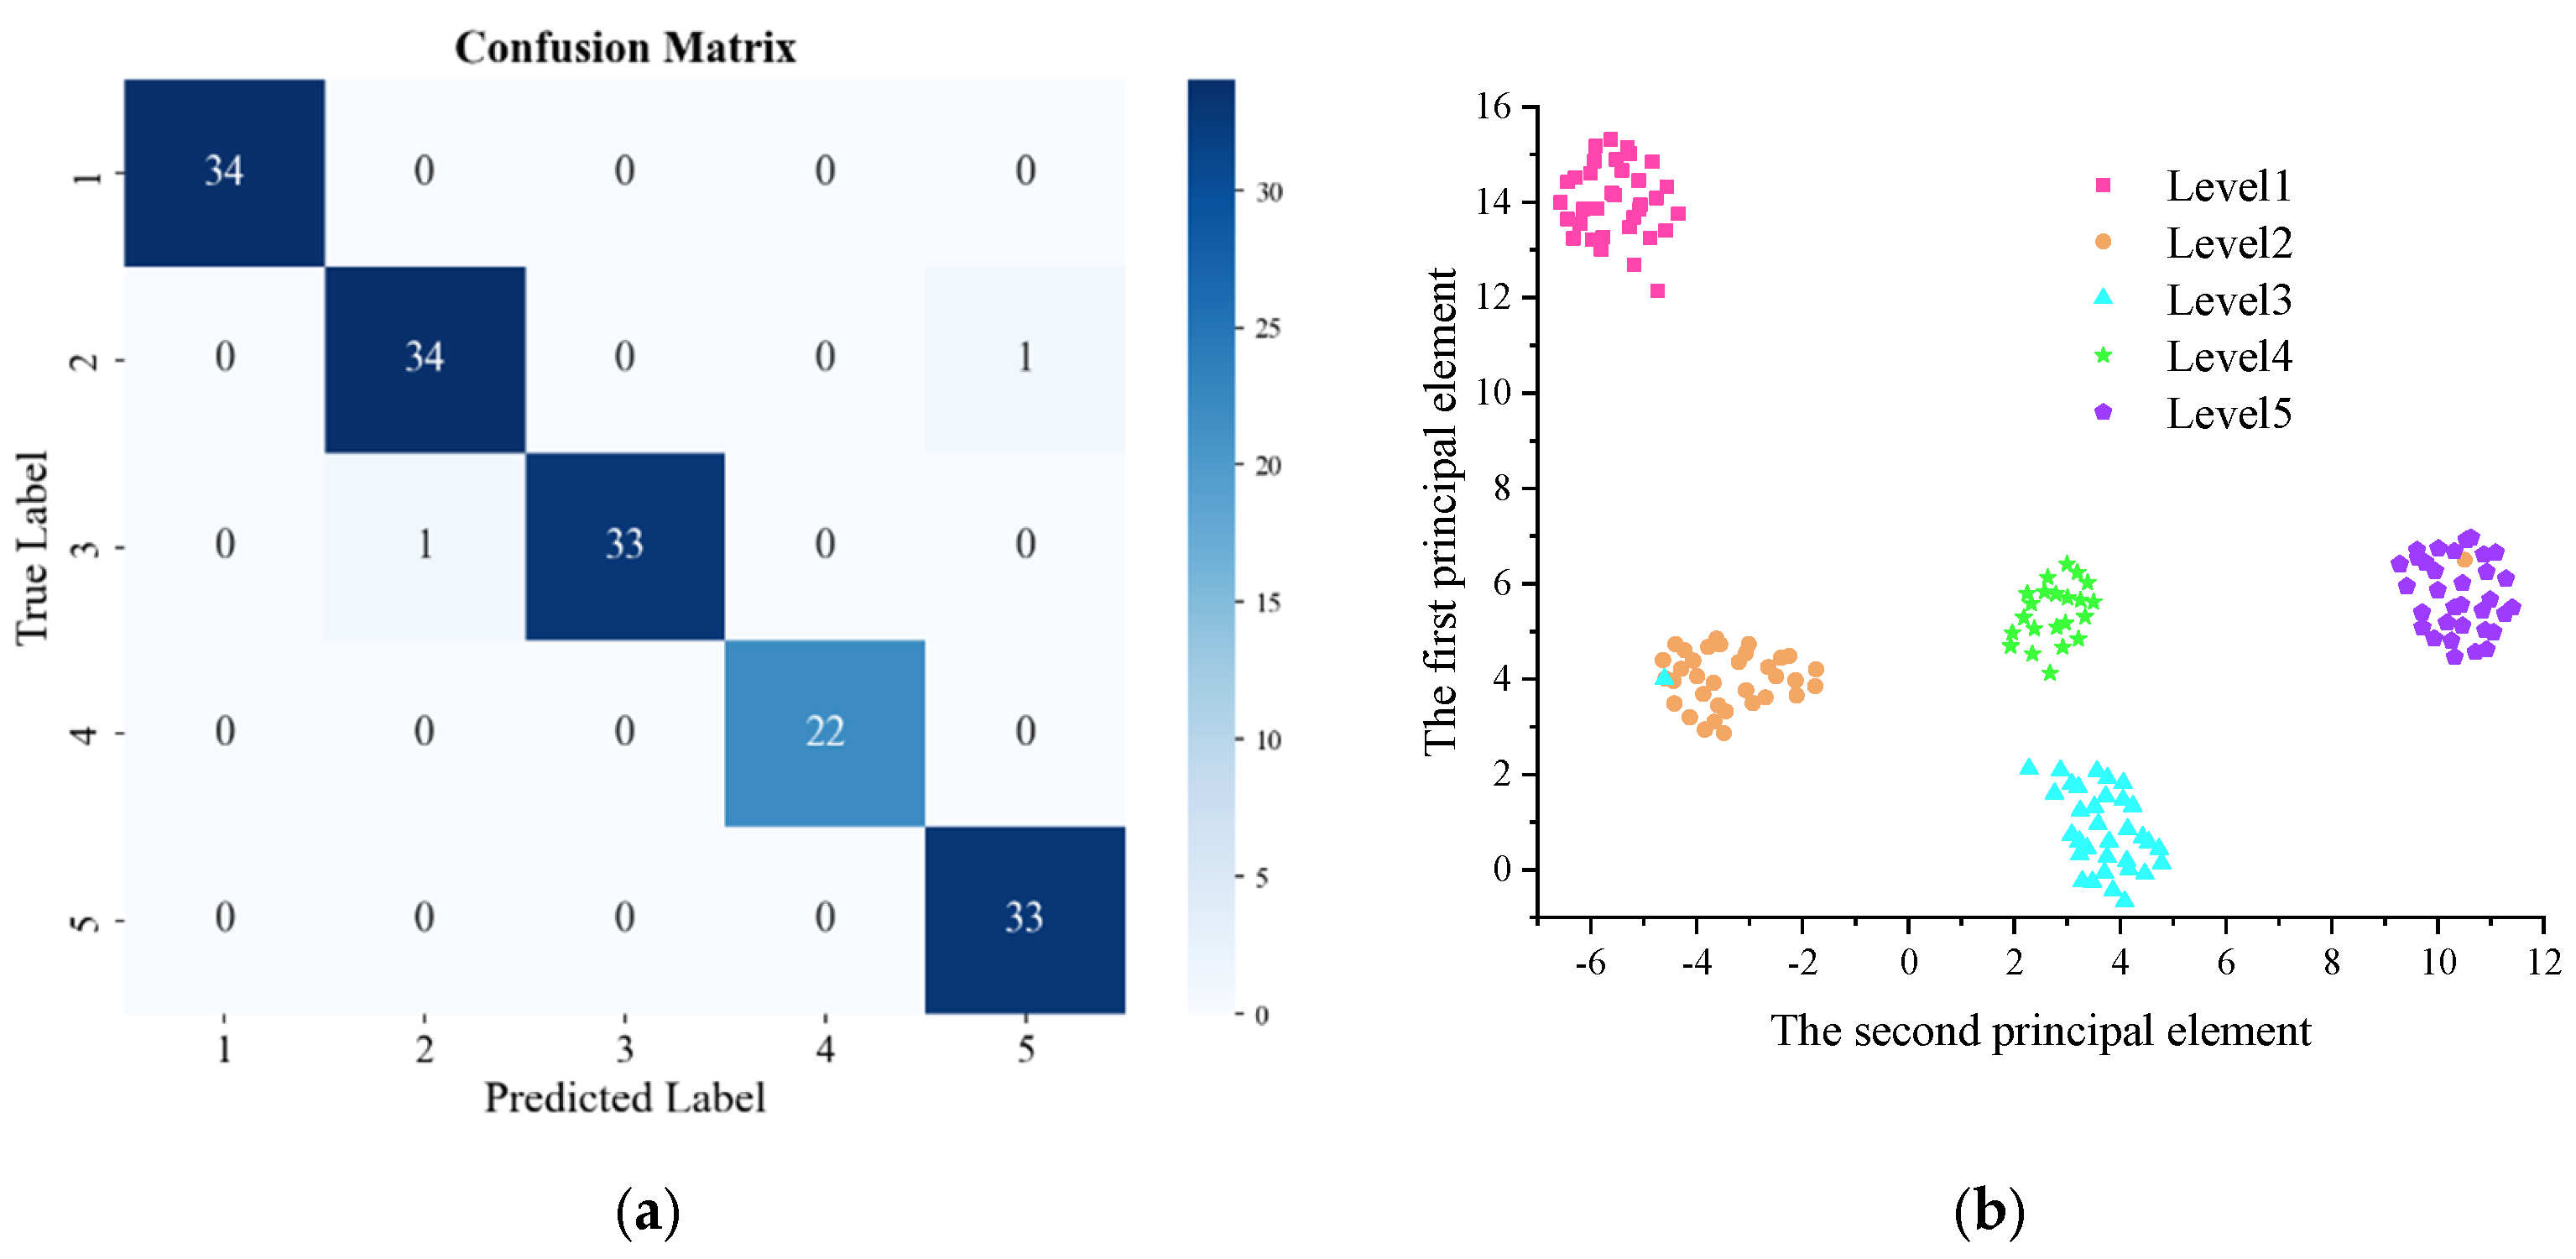
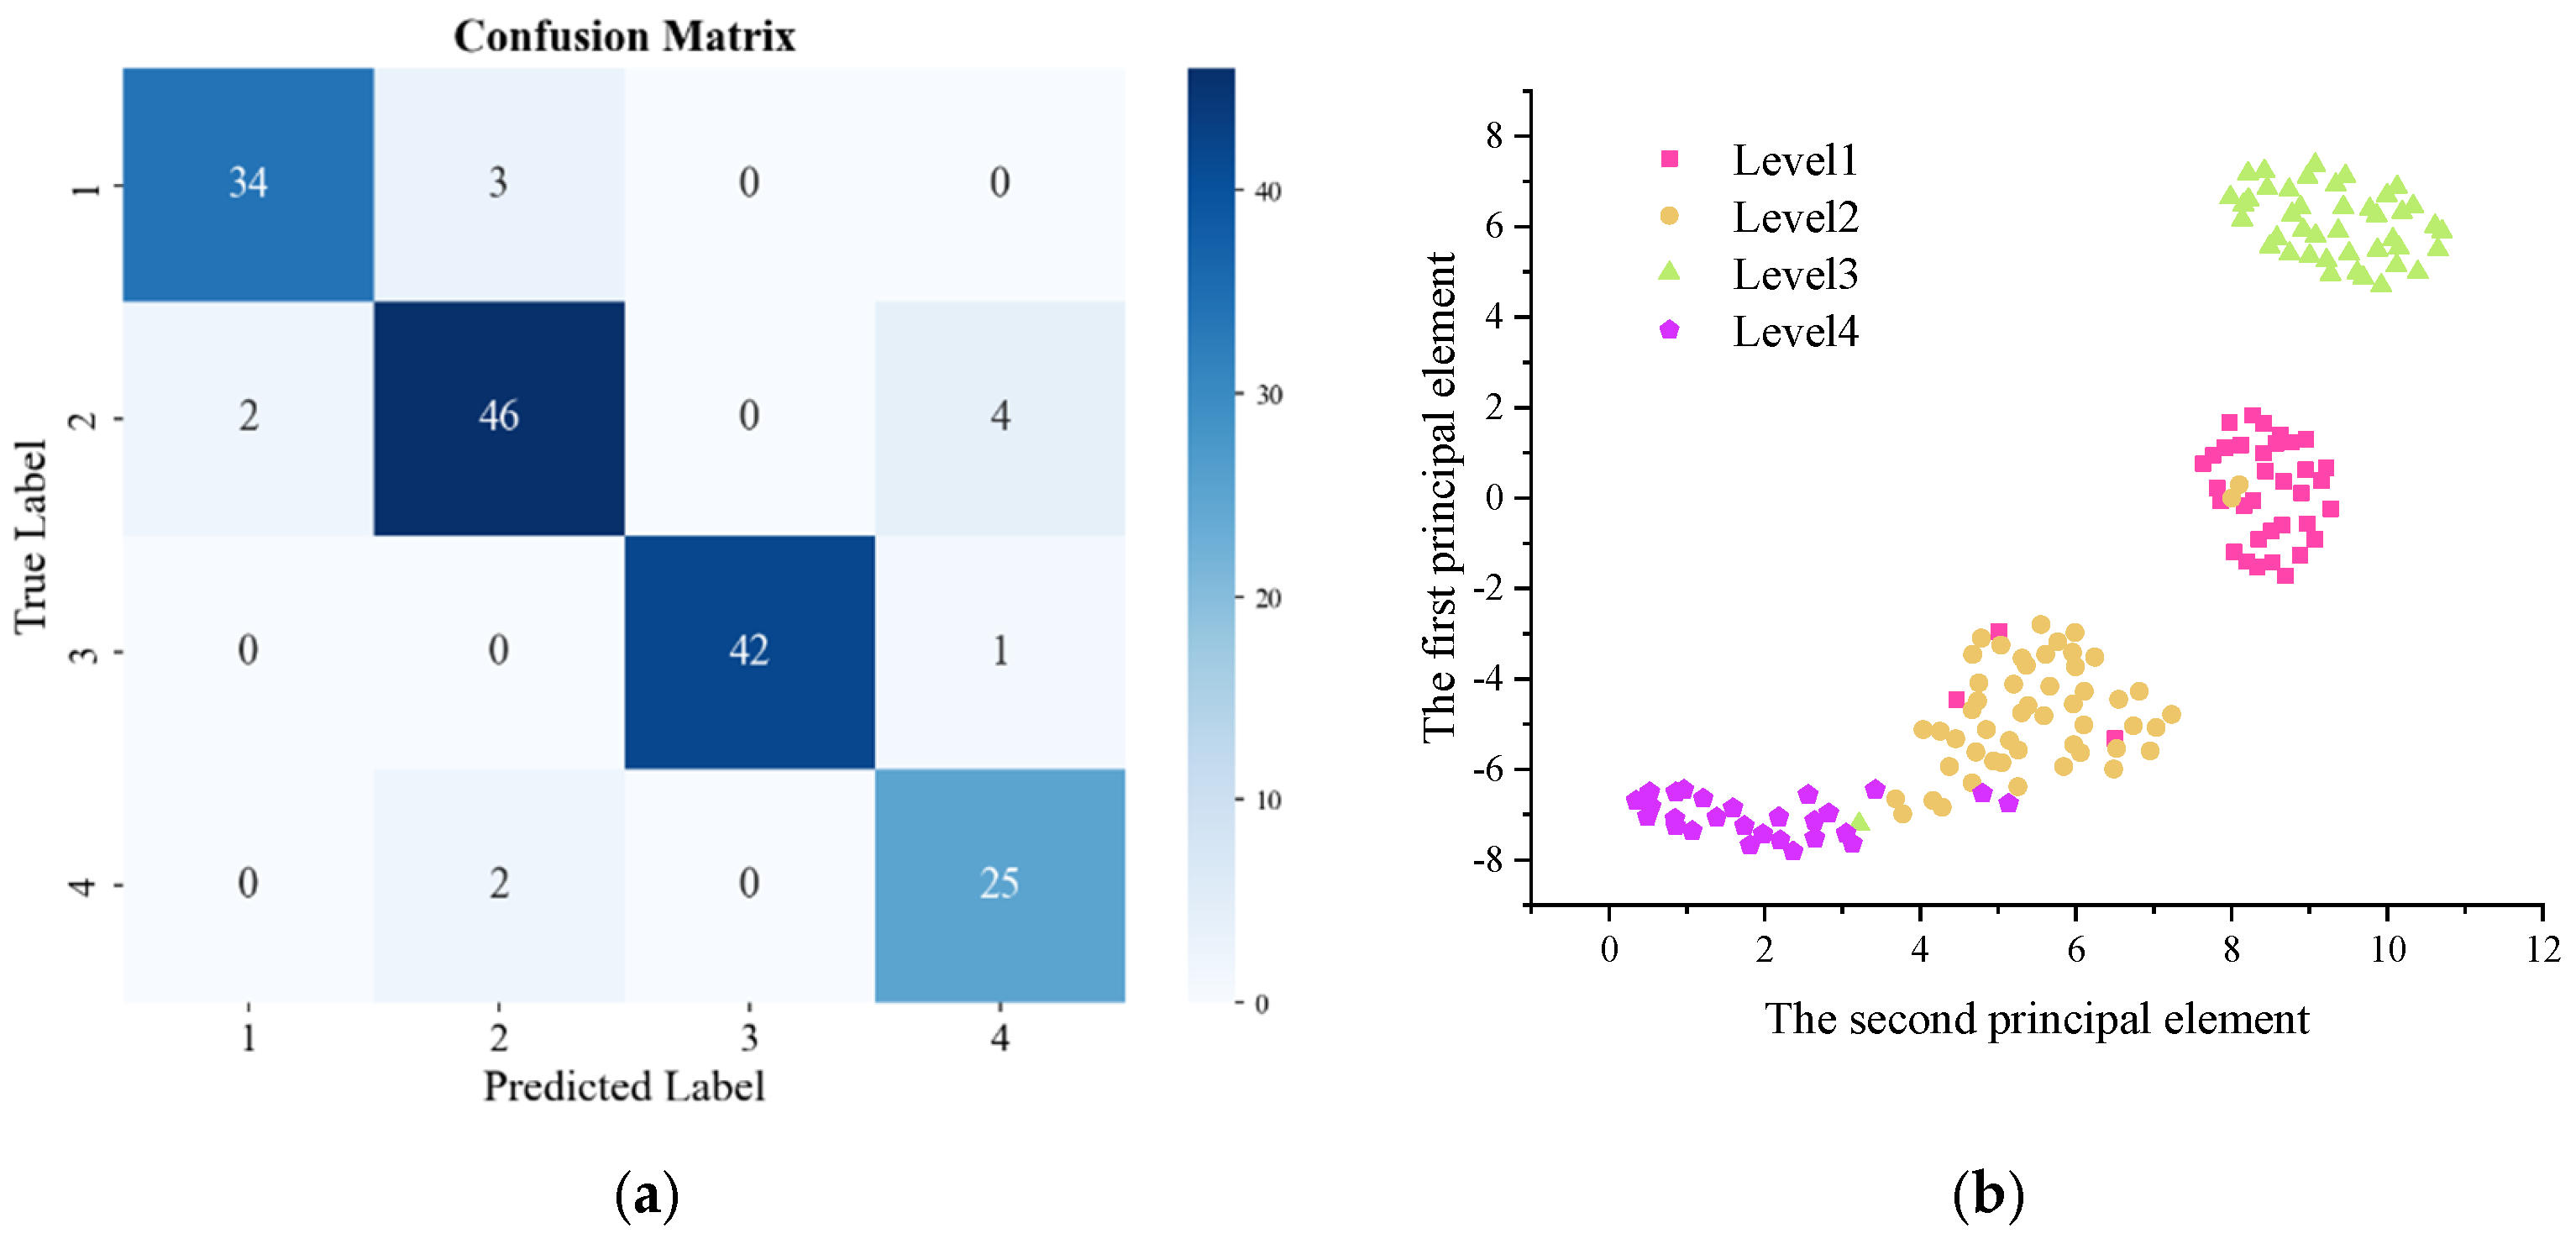
3.3. Training Results of ConvNeXt

The images generated by the GASF, GADF, and MTF methods were used as inputs, with the dataset divided into training and testing sets. The division results are presented in Table 2.
Figure 9 illustrates the accuracy and loss curves of the test set during the 200-epoch training process. In the figure, subplots (a), (b), and (c) represent the accuracy and loss value changes of the test sets predicted by the ConvNeXt network using images converted through GASF, GADF, and MTF, respectively. The red curves denote accuracy, while the black curves indicate loss values. As observed in Figure 9, the images generated by the GASF method achieved convergence at the 176th epoch, with a final accuracy of 95.57%. The images from the GADF method converged at the 183rd epoch, reaching an accuracy of 98.73%. Meanwhile, the MTF method achieved convergence at the 185th epoch, yielding an accuracy of 86.08%. Among these, the test set accuracy of the GADF method was the highest. Furthermore, a comparison of the training curves revealed that the convergence process for images produced by the GADF method was notably smoother throughout training. Evidently, among the three image generation methods, GADF proved to be the optimal approach, with the GADF-ConvNeXt model delivering the most effective classification performance for apple watercore grading.
The MTF method generates images by performing matrix decomposition and transformation on the data. By compressing the data and extracting primary features, it converts the data into a lower-dimensional matrix representation. However, this approach may lead to the loss of some details, particularly in capturing nonlinear relationships. Although GAF (including GADF and GASF) also compresses data during image transformation, its compression technique, Piecewise Aggregate Approximation (PAA), simplifies the data while retaining their overall trends and patterns. Consequently, images generated using the MTF method exhibit less effective training and prediction performance compared to those generated by GAF. Both GADF and GASF share the same initial computational steps: data normalization followed by mapping into polar coordinates. The distinction between GADF and GASF lies in their subsequent calculations. As shown in Equation (4), GADF creates images by computing the difference in sine functions, whereas GASF generates images by calculating the sum of cosine functions, as described in Equation (3). Given that the Vis/NIR spectral data of apples exhibit nonlinear characteristics, GADF’s approach of calculating the sine function difference proves advantageous in capturing subtle variations and patterns within nonlinear data. In contrast, GASF emphasizes the overall trends and changes in the data by computing the sum of cosine functions. This approach, while effective for highlighting general patterns, may fail to capture finer details within certain nonlinear datasets. Consequently, GADF outperforms GASF in handling nonlinear data.
Using the GADF method, one-dimensional spectral data were transformed into two-dimensional images and trained with the ConvNeXt network, achieving a test accuracy of 98.73%. Figure 10 illustrates the classification results of the test set using the GADF method. Figure 10a presents the confusion matrix of the test set classification results, where the horizontal and vertical axes (1–5) correspond to watercore Levels 1 through 5. Figure 10b depicts the two-dimensional visualization of the test set classification features, with five distinct colors representing the five watercore levels. As shown in Figure 10, after 200 training epochs with the ConvNeXt network model, among the 158 test samples, only 2 were misclassified. Specifically, one apple with a watercore level of 2 was classified as Level 5, and another with a watercore level of 3 was classified as Level 2. All other classifications for apples of varying watercore levels were accurate. Thus, the proposed GADF-ConvNeXt method demonstrates strong classification capability for distinguishing apples of different watercore levels in the test samples based on Vis/NIR spectral data.

4. Discussion

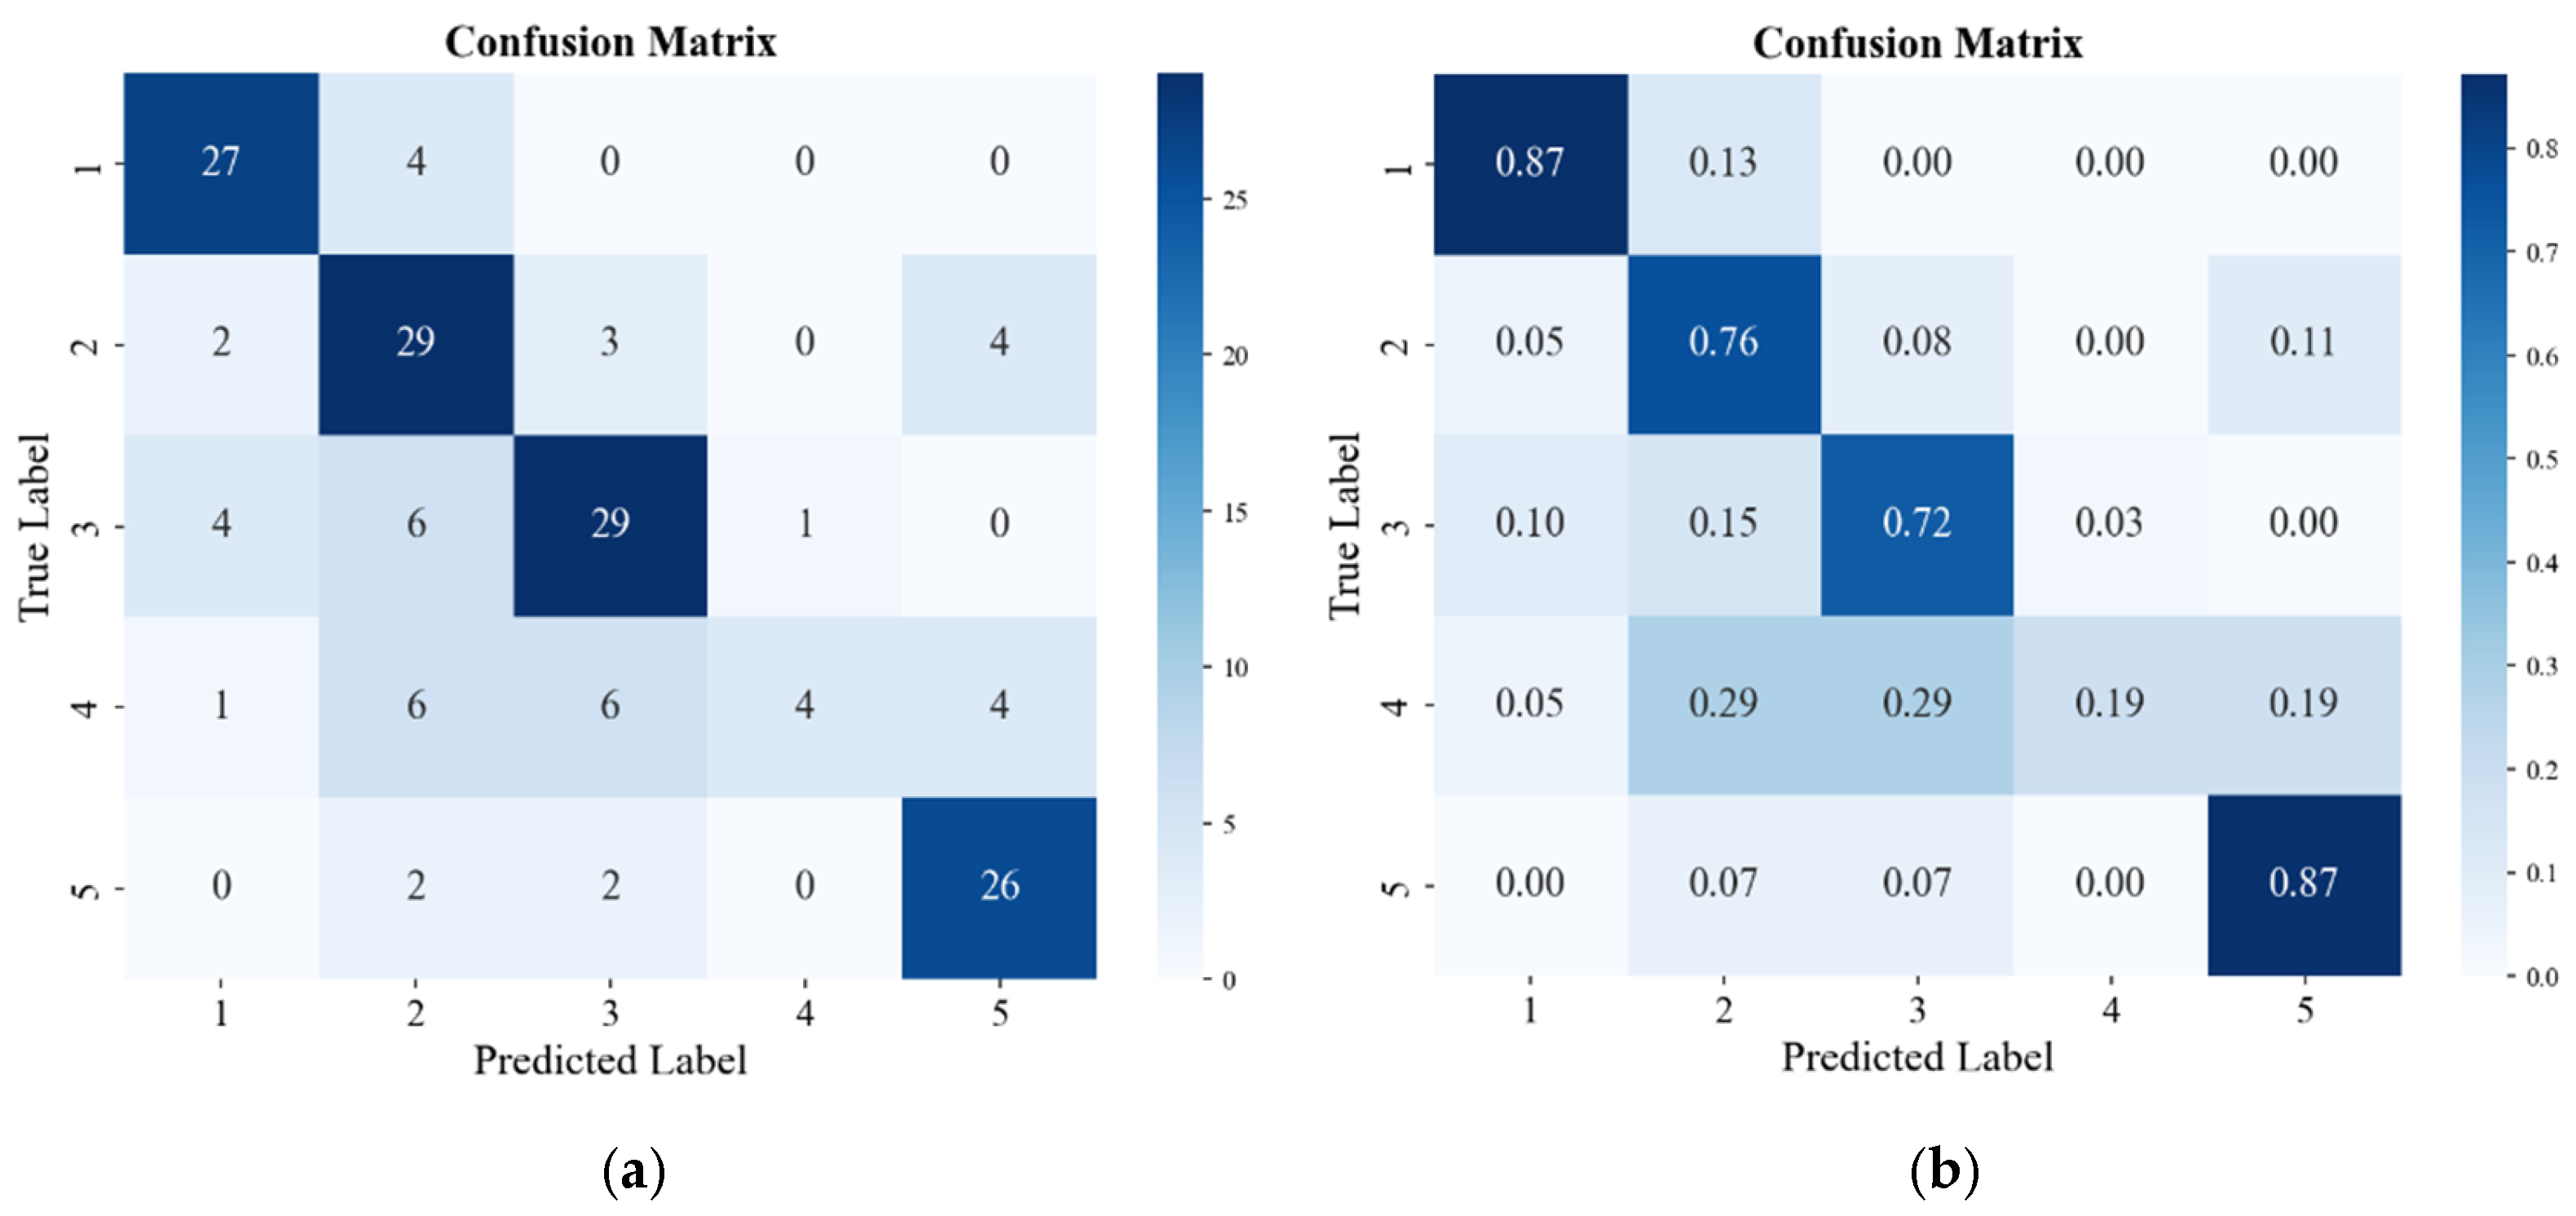
4.1. Recognition Results of Traditional Methods

Traditional methods for classifying apple Vis/NIR spectral data typically involve preprocessing, feature extraction and selection, and pattern recognition (with parameter optimization) to establish classification models. To demonstrate the simplicity and effectiveness of the GADF-ConvNeXt approach for apple watercore level classification, four preprocessing techniques were selected: Min-Max Normalization (MMS), Standard Normal Variate (SNV), Multiplicative Scatter Correction (MSC), and Standardization. Additionally, four feature extraction methods were chosen: Principal Component Analysis (PCA), Successive Projections Algorithm (SPA), Competitive Adaptive Reweighted Sampling (CARS), and Uninformative Variable Elimination (UVE). Two classifiers, Support Vector Machines (SVMs) and Random Forest (RF), were employed. These methods are currently among the most commonly used approaches for developing an apple watercore model. The SPXY algorithm (sample set partitioning based on joint x-y distance) was used for dataset partitioning, with a 4:1 train–test split ratio. By combining different preprocessing techniques, feature extraction methods, and classifiers, the SNV-MMS-PCA-SVM model achieved the highest test accuracy of 71.88%. In this model, PCA retained the first ten principal components, and SVM parameters were optimized using the Honey Badger Algorithm (HBA) [47]. Figure 11 shows the confusion matrix of the classification predictions for the test set.
Figure 11a presents the confusion matrix for the classification predictions of the test set using traditional methods, illustrating the number of correct and incorrect classifications. Figure 11b depicts the proportions of correct and incorrect classifications. As shown in Figure 11, when employing traditional methods for classifying apple watercore levels, significant misclassifications are observed across all five levels. Among them, Level 4 exhibits the poorest prediction results, with only 4 out of 21 samples correctly classified, corresponding to an accuracy of merely 0.19. For the remaining four watercore levels, the classification accuracies also fail to exceed 0.9. Compared to the GADF-ConvNeXt approach, traditional methods not only involve intricate and cumbersome combinations of methodologies—for instance, Guo et al. [20]., in their study on apple watercore identification, applied 10 spectral preprocessing techniques, 12 feature extraction methods, and 4 pattern recognition algorithms to Vis/NIR spectral transmission data, ultimately constructing an optimal classification model through exhaustive permutations—but also exhibit relatively inferior classification accuracy. For example, Chang et al. [21] attempted to classify apples with varying degrees of watercore severity, yet their final classification accuracy ranged merely between 87.32% and 91.67%. In contrast, the GADF-ConvNeXt approach operates in an almost end-to-end fashion: after a minimal preprocessing step, the one-dimensional spectral data of apples are transformed into images using the GADF method, followed by training and recognition via ConvNeXt. This streamlined process not only simplifies model construction but also achieves superior classification accuracy, making GADF-ConvNeXt a more efficient and effective solution.

4.2. Classification Results of Existing Apple Watercore Quantification Methods

Current studies on apple watercore quantification primarily rely on measuring the proportion of the watercore in a single cross-sectional slice. Based on such quantification methods [21], apple watercore can be categorized into four levels. The cross-sectional area of the watercore from the slice at the largest diameter of the apple is used as the standard for quantification. Specifically, a watercore area proportion of less than 1% corresponds to Level 1, 1–5% to Level 2, 5–10% to Level 3, and greater than 10% to Level 4. Using this grading method, the 800 apples in this study were divided into different watercore levels and analyzed with the GADF-ConvNeXt method for training and prediction. The dataset was split with an 8:2 ratio, and the model was trained over 200 epochs. The classification accuracy of the test set reached 92.45%. The classification results are illustrated in Figure 12.
Figure 12a,b present the confusion matrix and the two-dimensional scatter plot of the test set classification results, respectively. In Figure 12a, the horizontal and vertical axes labeled 1–4 correspond to watercore Levels 1 through 4. The figure reveals that classification errors exist across all watercore levels in the test set. Specifically, for Level 1, three apples were misclassified as Level 2; for Level 2, two apples were misclassified as Level 1, and four were misclassified as Level 4; for Level 3, one apple was misclassified as Level 4; and for Level 4, two apples were misclassified as Level 2. Evidently, according to the apple watercore grading method proposed by Chang et al. [21], when employing the same approach, the classification accuracy for a four-tier system is only 92.45%. Similarly, the method introduced by Zihan Chen et al. [22] yields an accuracy of 95.32% for four-level classification. In stark contrast, the approach presented in this study achieves a remarkable 98.73% accuracy for a five-tier classification, thereby demonstrating the superior rationality of our proposed method for quantifying apple watercore severity.

5. Conclusions

This study addresses the limitations of existing methods for quantifying apple watercore severity, which lack rigor, as well as the complexity involved in constructing traditional classification models for watercore assessment. To this end, we propose a method for quantifying apple watercore severity and introduce a classification model based on deep convolutional neural networks, leading to the following conclusions:
(1) This study presents a novel apple watercore severity quantification method based on the BiSeNet and RIFE algorithms. Unlike previous studies that quantify watercore severity solely based on the proportion of watercore in a single cross-section [7,21,22,23,24,25,26,27], the proposed method reconstructs the spatial morphology of watercore, accounting for its actual distribution within the apple. Furthermore, by comparing the classification and prediction performance of the GADF-ConvNeXt model using both the conventional method and the proposed approach, we demonstrate that our method offers a more rational and accurate assessment of watercore severity. However, due to constraints associated with apple slicing tools, discrepancies between the actual apple slices obtained and the idealized state may introduce deviations in the computed severity levels. Future work will focus on improving both the experimental tools and methodologies to enhance accuracy.
(2) Three methods—GASF, GADF, and MTF—were employed to transform the collected one-dimensional spectral data of apples into two-dimensional images. Compared to the original one-dimensional spectral data, the transformed images exhibit more distinct feature information, effectively highlighting the differences within the Vis/NIR spectrum data. This transformation facilitates the subsequent feature extraction and pattern recognition process using deep convolutional neural networks.
(3) ConvNeXt was employed to train and predict the five watercore levels of apples, yielding test set accuracy rates of 95.57%, 98.73%, and 86.08% for the GASF, GADF, and MTF methods, respectively. Among these, the GADF-ConvNeXt model demonstrated the highest classification performance for apple watercore levels. Additionally, when using traditional methods for watercore level classification, a combination of various preprocessing and feature extraction techniques resulted in the SNV–MMS–PCA–SVM model, which achieved a maximum test set accuracy of only 71.88%. In contrast, the GADF-ConvNeXt model proposed in this study eliminates the need for complex method [11,13,17,19,20,21,23] combinations while attaining superior accuracy, making it a more streamlined and effective approach. Furthermore, this method is well suited for the classification and prediction of other near-infrared spectral data [38,39]. However, ConvNeXt’s large model size imposes high computational demands, necessitating future efforts to optimize the network architecture and make it lightweight.

Author Contributions

Methodology, C.Z. and Z.Y.; writing—original draft preparation, C.Z.; writing—review and editing, C.Z., Z.Y., Y.T. and W.Z.; investigation, P.G., Y.M., H.W. and D.H.; data curation, Z.Y., Y.M. and H.W.; funding acquisition, Y.T., W.Z. and Q.L. All authors have read and agreed to the published version of the manuscript.

Funding

This research was funded by People′s Government of Yunnan Province grant number YNWR-QNBJ-2018-349; This research was funded by Ministry of Science and Technology of the People′s Republic of China grant number 2021FYD1100407; This research is supported by the Hebei Province College Research Center for Express Intelligent Technology and Equipment Applications, with the funder being the Hebei Education Department.

Institutional Review Board Statement

Not applicable.

Data Availability Statement

The data supporting this study can be obtained upon request from the corresponding author. However, due to privacy considerations and the presence of undisclosed intellectual property, these data are not accessible to the public.

Conflicts of Interest

Author Quan Lu was employed by the company Ninglang Hengtai Agricultural Investment and Development Co., Ltd. The remaining authors declare that the research was conducted in the absence of any commercial or financial relationships that could be construed as a potential conflict of interest.

References

  1. Jiang, Y.; Wang, Z.; Jia, C. Research progress on pathogenesis of watercore in apple. China Fruits 2022, 1, 8–14. [Google Scholar] [CrossRef]
  2. Feng, J.; Han, X.; Song, S.; Wang, H.; Xie, P.; Yang, H.; Li, S.; Wu, Y. Fruit quality characters and causes of watercore apple in high altitude areas of Guizhou. J. South. Agric. 2021, 52, 1273–1281. [Google Scholar] [CrossRef]
  3. Yao, Y.; Wu, Y.; Li, M.; Fu, Q.; Liu, S.; Zhu, Z.; Zhang, X. Analysis and Microscopic Observation of Paraffin Sections of Pineapple Pulp in Watercore. Chin. J. Trop. Crops 2023, 44, 2514–2519. [Google Scholar] [CrossRef]
  4. Xu, S.; Lu, H.; Wang, X.; Qiu, G.; Wang, C.; Liang, X. Nondestructive detection method for pineapple water core based on visible/near infrared spectroscopy. Trans. Chin. Soc. Agric. Eng. 2021, 37, 287–294. [Google Scholar] [CrossRef]
  5. Gao, J.; Ma, H.; Liu, D.; Fang, X.; Liu, X. The Difference Analysis of Non Targeted Metabonomics on Different Metabolites in Watercore Pyrus pyrifolia. Mol. Plant Breed. 2021, 19, 8297–8304. [Google Scholar] [CrossRef]
  6. Liu, X.; Zhang, H.; Dong, T.; Wang, F. Advances in rsearch on nondestructive detection method for apple watercore disease and its control. J. Fruit Sci. 2008, 5, 721–726. Available online: https://www.cabidigitallibrary.org/doi/full/10.5555/20083263939 (accessed on 24 March 2025).
  7. Zhou, W.; Li, W.; Wang, A.; Wu, Z.; Hu, A. Quality Changes of Sugar Core Red Fuji Apple under Two Storage Conditions. Xinjiang Agric. Sci. 2020, 57, 1431–1442. [Google Scholar] [CrossRef]
  8. Cavalieri, R.P.; Hyde, G.M.; MacQuarrie, P.R. Hydraulic sorting of watercore apples. In Proceedings of the International Postharvest Science Conference Postharvest 96 464, Taupo, New Zealand, 4–9 August 1996; pp. 103–108. [Google Scholar] [CrossRef]
  9. Herremans, E.; Melado-Herreros, A.; Defraeye, T.; Verlinden, B.; Hertog, M.; Verboven, P.; Val, J.; Fernández-Valle, M.; Bongaers, E.; Estrade, P.; et al. Comparison of X-ray CT and MRI of watercore disorder of different apple cultivars. Postharvest Biol. Technol. 2014, 87, 42–50. [Google Scholar] [CrossRef]
  10. Wang, R.; Wang, D.; Ren, X.; Ma, H. Nondestructive detection of apple watercore disease based on electric features. Trans. Chin. Soc. Agric. Eng. 2018, 34, 129–136. [Google Scholar] [CrossRef]
  11. Gao, S.; Wang, Q. Non-destructive testing of red globe grape sugar content and moisture content based on visible/near infrared spectroscopy transmission technology. Chin. Opt. 2021, 14, 566–577. [Google Scholar] [CrossRef]
  12. Liu, Y.; Xu, H.; Sun, X.; Rao, Y. Non-destructive measurement of tomato maturity by near-infrared diffuse transmission spectroscopy. Laser Technol. 2019, 43, 25–29. [Google Scholar] [CrossRef]
  13. Zhang, P.; Li, J.; Feng, X.; Wang, B.; Chen, S.; Zhou, Z. Prediction of Maturity of Mopan persimmon Using Near Infrared Diffuse Reflectance Spectroscopy. Food Res. Dev. 2013, 34, 91–94. [Google Scholar] [CrossRef]
  14. Zhou, J.; Sun, R.; Yu, D.; Lv, Y.; Han, Y. Identification of fig maturity based on near-infrared spectroscopy and partial least square-discriminant analysis. Food Mach. 2020, 36, 107–111. [Google Scholar] [CrossRef]
  15. Wang, X.; Hua, Z.; He, W. Research progress in infrared spectroscopy for detection of pesticide residue in jujube. J. Food Saf. Qual. 2020, 11, 4394–4400. [Google Scholar] [CrossRef]
  16. Chen, S.; Zhao, Q.; Dong, D. Application of Near Infrared Spectroscopy Combined with Comparative Principal Component Analysis for Pesticide Residue Detection in Fruit. Spectrosc. Spectr. Anal. 2020, 40, 917–921. [Google Scholar] [CrossRef]
  17. Zhang, X.; Jiang, X.; Zhang, N.; Shi, L. Detection of Chlorpyrifos Residue in Aksu Red Fuji Apples Using Near-Infrared Spectroscopy. Jiangsu Agric. Sci. 2018, 46, 162–166. [Google Scholar] [CrossRef]
  18. Han, D.; Liu, X.; Zhao, L.; Wang, Z.; Tu, R.; Qiao, W. Research of Nondestructive Detection of Apple Watercore by Optical Means. Trans. Chin. Soc. Agric. Mach. 2004, 35, 143–146. [Google Scholar] [CrossRef]
  19. Wang, J.; Sun, X.; Pan, L.; Sun, Q.; Han, H. Discrimination of Brownheart and Watercore of Apples Based on Energy Spectrum of Visible /Near Infrared Transmittance. Spectrosc. Spectr. Anal. 2008, 28, 2098–2102. [Google Scholar] [CrossRef]
  20. Guo, J.; Ma, Y.; Guo, Z.; Huang, H.; Shi, Y.; Zhou, J. Watercore Identification of Xinjiang Fuji Apple Based on Manifold Learning Algorithm and Near Infrared Transmission Spectroscopy. Spectrosc. Spectr. Anal. 2020, 40, 2415–2420. [Google Scholar] [CrossRef]
  21. Chang, H.; Wu, Q.; Yan, J.; Luo, X.; Xu, H. On-line evaluation of watercore in apples by visible/near infrared spectroscopy. In Proceedings of the 2019 ASABE Annual International Meeting, American Society of Agricultural and Biological Engineers, Boston, MA, USA, 7–10 July 2019; p. 1. [Google Scholar] [CrossRef]
  22. Chen, Z.; Wang, H.; Wang, J.; Xu, H.; Mei, N.; Zhang, S. Non-Destructive Detection Method of Apple Watercore: Optimization Using Optical Property Parameter Inversion and MobileNetV3. Agriculture 2024, 14, 1450. [Google Scholar] [CrossRef]
  23. Guo, Z.; Zou, Y.; Sun, C.; Jayan, H.; Jiang, S.; EI-Seedi, H.R.; Zou, X. Nondestructive determination of edible quality and watercore degree of apples by portable Vis/NIR transmittance system combined with CARS-CNN. J. Food Meas. Charact. 2024, 18, 4058–4073. [Google Scholar] [CrossRef]
  24. Wang, H.; Yuan, J.; Liu, T.; Chen, L.; Ban, Z.; Duan, L.; Wang, L.; Tang, Y.; Li, X.; Li, J. Fruit canopy position and harvest period affect watercore development and quality of the ′Fuji′ apple cultivar fruit. Sci. Hortic. 2023, 311, 111793. [Google Scholar] [CrossRef]
  25. Zhang, Y.; Wang, Z.; Tian, X.; Yang, X.; Cai, Z.; Li, J. Online analysis of watercore apples by considering different speeds and orientations based on Vis/NIR full-transmittance spectroscopy. Infrared Phys. Technol. 2022, 122, 104090. [Google Scholar] [CrossRef]
  26. Wang, C.; Zhai, M.; Li, H.; Mo, X.; Zha, Z.; Wu, J. Detection of sub-healthy apples with watercore based on visible/near-infrared transmission spectroscopy. Food Mach. 2024, 40, 117–125+182. [Google Scholar] [CrossRef]
  27. Zhang, Y.; Liu, Y.; Tong, P.; Tang, L.; Xu, Q.; Wang, J. Effects of Different Storage Conditions on Quality and Saccharine of Aksu Apple. Xinjiang Agric. Sci. 2021, 58, 493–501. [Google Scholar] [CrossRef]
  28. LeCun, Y.; Bottou, L.; Bengio, Y.; Haffner, P. Gradient-based learning applied to document recognition. Proc. IEEE 1998, 86, 2278–2324. [Google Scholar] [CrossRef]
  29. Krizhevsky, A.; Sutskever, I.; Hinton, G.E. Imagenet classification with deep convolutional neural networks. Commun. ACM 2017, 60, 84–90. [Google Scholar] [CrossRef]
  30. Simonyan, K.; Zisserman, A. Very deep convolutional networks for large-scale image recognition. arXiv 2014, arXiv:1409.1556. [Google Scholar] [CrossRef]
  31. He, K.; Zhang, X.; Ren, S.; Sun, J. Deep residual learning for image recognition. In Proceedings of the IEEE Conference on Computer Vision and Pattern Recognition, Las Vegas, NV, USA, 27–30 June 2016; pp. 770–778. Available online: https://openaccess.thecvf.com/content_cvpr_2016/papers/He_Deep_Residual_Learning_CVPR_2016_paper.pdf (accessed on 25 March 2025).
  32. Tan, M.; Le, Q. Efficientnet: Rethinking model scaling for convolutional neural networks. In Proceedings of the International Conference on Machine Learning, PMLR, Long Beach, CA, USA, 9–15 June 2019; pp. 6105–6114. Available online: https://proceedings.mlr.press/v97/tan19a/tan19a.pdf (accessed on 25 March 2025).
  33. Cai, J.; Huang, C.; Ma, L.; Zhai, L.; Guo, Z. Hand-Held Visible/Near Infrared Nondestructive Detection System for Soluble Solid Content in Mandarin by 1D-CNN Model. Spectrosc. Spectr. Anal. 2023, 43, 2792–2798. [Google Scholar] [CrossRef]
  34. Yang, S.; Zhang, X.; Wang, Z.; Lei, C.; Song, W. Rice variety detection based on near-infrared spectroscopy and deep learning data augmentation. Trans. Chin. Soc. Agric. Eng. 2023, 39, 250–257. [Google Scholar] [CrossRef]
  35. Chen, C.; Wang, T.; Hu, K.; Bao, B.; Yan, H.; Yang, C. Identification Method of Pollen Typhae Processed Products Based on Convolutional Neural Network and Voting Mechanism. Spectrosc. Spectr. Anal. 2022, 42, 3361–3367. [Google Scholar] [CrossRef]
  36. Guo, P.; Zhang, W.; Cui, B.; Guo, Z.; Zhao, C.; Yin, Z.; Liu, B. Multi-condition fault diagnosis method of rolling bearing based on enhanced deep convolutional neural network. J. Vib. Eng. 2025, 38, 96–108. [Google Scholar] [CrossRef]
  37. Huang, H.; Li, Y.; Zhang, Z. A NIR Prediction Model for Forest Soil Carbon Content Based on ResNet. For. Eng. 2023, 39, 164–171. [Google Scholar] [CrossRef]
  38. Xu, X.; Fu, C.; Gao, Y.; Kang, Y.; Zhang, W. Research on the Identification Method of Maize Seed Origin Using NIR Spectroscopy and GAF-VGGNet. Agriculture 2024, 14, 466. [Google Scholar] [CrossRef]
  39. Feng, G.; Li, Z.; Zhang, J.; Wang, M. Multi-Scale Spatial Attention-Based Multi-Channel 2D Convolutional Network for Soil Property Prediction. Sensors 2024, 24, 4728. [Google Scholar] [CrossRef] [PubMed]
  40. Yin, Z.; Zhao, C.; Zhang, W.; Guo, P.; Ma, Y.; Wu, H.; Hu, D.; Lu, Q. Nondestructive detection of apple watercore disease content based on 3D watercore model. Ind. Crops Prod. 2025, 34, 129–136. [Google Scholar] [CrossRef]
  41. Wang, Z.; Oates, T. Encoding time series as images for visual inspection and classification using tiled convolutional neural networks. In Proceedings of the Workshops at the Twenty-Ninth AAAI Conference on Artificial Intelligence, Menlo Park, CA, USA, 25–30 January 2015; p. 1. Available online: https://cdn.aaai.org/ocs/ws/ws0115/10179-46015-1-PB.pdf (accessed on 25 March 2025).
  42. Huang, Z.; Zhang, T.; Heng, W.; Shi, B.; Zhou, S. Real-time intermediate flow estimation for video frame interpolation. In European Conference on Computer Vision; Springer Nature: Cham, Switzerland, 2022; pp. 624–642. Available online: https://arxiv.org/pdf/2011.06294 (accessed on 25 March 2025).
  43. Yin, Z.; Zhang, W.; Zhao, C. Method of extracting characteristics of watercore in cross section of watercore apple based on BiSeNet. Huazhong Agric. Univ. 2023, 42, 209–215. [Google Scholar] [CrossRef]
  44. Liu, Z.; Mao, H.; Wu, C.Y.; Feichtenhofer, C.; Darrell, T.; Xie, S. A convnet for the 2020s. In Proceedings of the IEEE/CVF Conference on Computer Vision and Pattern Recognition, New Orleans, LA, USA, 18–24 June 2022; pp. 11976–11986. Available online: https://openaccess.thecvf.com/content/CVPR2022/papers/Liu_A_ConvNet_for_the_2020s_CVPR_2022_paper.pdf (accessed on 25 March 2025).
  45. Chang, H. Research and Development of On-Line Non-Destructive Detecting Method and Grading Equipment of Apple Watercore and Soluble Solids Content. Ph.D. Thesis, Zhejiang University, Hangzhou, China, 2021. [Google Scholar] [CrossRef]
  46. Zhao, C.; Yin, Z.; Zhang, W.; Guo, P.; Ma, Y. Identification of apple watercore based on ConvNeXt and Vis/NIR spectra. Infrared Phys. Technol. 2024, 142, 105575. [Google Scholar] [CrossRef]
  47. Zhao, C.; Yin, Z.; Zhang, W.; Guo, P.; Ma, Y. Classification of Watercore Apples Based on Visible/Near Infrared Transmission Spectroscopy Combined with Honey Badger Algorithm- Support Vector Machine. Food Sci. Technol. 2023, 48, 253–259. [Google Scholar] [CrossRef]
Figure 1. Schematic diagram of the experimental platform: (1) black box; (2) halogen lamp; (3) apple samples; (4) computer; (5) fruit cup; (6) portable spectrometer; (7) data cable; (8) optical fiber; (9) power cable; (10) transformer.
Agriculture 15 00756 g001
Figure 2. Blade.
Figure 2. Blade.
Agriculture 15 00756 g002
Figure 3. Experimental picture of apple slices. (a) All slice pictures are of a single apple. (b) A single slice of an apple with different degrees of watercore.
Agriculture 15 00756 g003
Figure 4. The process of constructing a three-dimensional model of apple watercore.
Agriculture 15 00756 g004
Figure 5. Structure diagram of the ConvNeXt network.
Agriculture 15 00756 g005
Figure 6. Flowchart for apple watercore grading method based on deep convolutional neural networks and visible/near-infrared spectroscopy.
Agriculture 15 00756 g006
Figure 7. Vis/NIR spectral data of apples.
Agriculture 15 00756 g007
Figure 8. Differences in data and results of image conversion: (a) data with significant variability; (b) data with minor variability; (c) results of image conversion of data with significant variability; (d) results of image conversion of data with minor variability.
Agriculture 15 00756 g008
Figure 9. Curve diagram of test set results: (a) testing set for GASF; (b) testing set for GADF; (c) testing set for MTF.
Agriculture 15 00756 g009
Figure 10. The classification results of the test set for the method proposed in this paper: (a) confusion matrix; (b) scatter plot of classification results.
Agriculture 15 00756 g010
Figure 11. Classification results of the test set using traditional methods: (a) confusion matrix for quantity; (b) confusion matrix for percentage.
Agriculture 15 00756 g011
Figure 12. The classification results of the test set for existing apple watercore quantification methods: (a) confusion matrix; (b) scatter plot of classification results.
Agriculture 15 00756 g012
Table 1. Quantity and proportion of apple watercore at different levels.
CategoriesTotalLevel 1Level 2Level 3Level 4Level 5
Quantity800174177170112167
Proportion100%21.75%22.13%21.25%14%20.88%
Table 2. Results of dataset partitioning.
CategoriesLevel 1Level 2Level 3Level 4Level 5Total
Training set14014213690134642
Test set3435342233158
Disclaimer/Publisher’s Note: The statements, opinions and data contained in all publications are solely those of the individual author(s) and contributor(s) and not of MDPI and/or the editor(s). MDPI and/or the editor(s) disclaim responsibility for any injury to people or property resulting from any ideas, methods, instructions or products referred to in the content.

