Article

Influence of Groundwater Depth on Soil Ion Distribution in the Agricultural Irrigation Areas of Northwest China

1
The Institute of Hydrogeology and Environmental Geology, Chinese Academy of Geological Science, Shijiazhuang 050061, China
2
School of Environmental Studies and State Key Laboratory of Biogeology and Environmental Geology, China University of Geosciences, Wuhan 430078, China
3
College of Geosciences and Engineering, North China University of Water Resource and Electric Power, Zhengzhou 450045, China
4
Technology Innovation Center of Geothermal & Hot Dry Rock Exploration and Development, Ministry of Natural Resources, Shijiazhuang 050061, China
5
School of Water Resources and Environment, China University of Geosciences (Beijing), Beijing 100083, China
6
PowerChina Beijing Engineering Corporation, Beijing 100024, China
*
Author to whom correspondence should be addressed.
Agriculture 2025, 15(7), 747; https://doi.org/10.3390/agriculture15070747
Submission received: 19 February 2025 / Revised: 30 March 2025 / Accepted: 30 March 2025 / Published: 31 March 2025
(This article belongs to the Section Agricultural Soils)

Abstract

Extensive and unregulated groundwater extraction for irrigation in the arid inland basins of Northwest China has led to a continuous increase in groundwater depth in agricultural irrigation areas. This has significantly altered the distribution of soil ions, making it difficult to predict their evolution and dynamic patterns. In this study, we used a space-for-time substitution approach to elucidate the evolution of the soil ion distribution under changing groundwater depths. Experiments were conducted in three typical irrigation areas with varying groundwater depths, that is, below 5 m, 5–10 m, and above 10 m in Korla, Xinjiang, China. Soil samples were collected from five profiles at depths of 0–180 cm to measure the soil moisture, salinity, and major ion content. An innovative research framework was developed to examine the relationship between groundwater depth and soil ion distribution using ion ratios, principal components, hierarchical clustering, and correlation analyses. This framework aims to reveal the dynamics, correlations, and mechanisms of soil moisture, salinity, ion distribution, and representative ion composition as groundwater depth increases in the arid agricultural irrigation areas of Northwest China. The results showed that as groundwater depth increased, the soil chemical type shifted from Ca-SO4 to Na-SO4 and mixed types, with an increase in SO42− and Na+ content in the soil profile. Soil moisture, salinity, sodium adsorption ratio (SAR), and total dissolved solids (TDS) were significantly higher in shallow groundwater than in deep groundwater. Groundwater depth was negatively correlated with soil moisture, salinity, and major cations and anions (K+, Na+, Ca2+, Mg2+, Cl, SO42−, and NO3). Meanwhile, a positive correlation exists between groundwater depth and CO32−. The dynamic distribution of soil ions is primarily governed by groundwater depth and is influenced by multiple factors. Evaporation is the dominant factor in shallow groundwater areas, whereas the mineral composition of rocks plays a crucial role in deep groundwater areas. These findings provide scientific support for strategic agricultural water-resource management policies and sustainable development strategies in arid regions.

1. Introduction

In the context of global climate change and intense human activity, arid regions are facing increasingly severe water shortages. As a critical water resource in arid areas, groundwater plays an irreplaceable role in maintaining the ecological balance and supporting socioeconomic development [1,2]. However, fluctuations in groundwater depth directly affect the efficient use of groundwater resources and profoundly impact soil moisture and salinity dynamics [3,4,5]. This, in turn, has far-reaching effects on agricultural production, ecological environments, and human living conditions. In the Yinchuan Plain of Ningxia, irrigation with Yellow River water has led to the accumulation of Na+, Cl, and SO42− ions in surface soils, triggering secondary salinization. This process elevates soil pH to levels exceeding 8.5, significantly inhibiting the productivity of key crops such as maize and rice [6]. Groundwater depth affects the current soil moisture content and the long-term dynamics of soil moisture. Seasonal changes in groundwater depth lead to periodic fluctuations in soil moisture content [7]. When the groundwater depth is shallow, it can easily rise to the soil surface through capillary action, bringing salt to the soil surface. Under strong evaporation, salts tend to accumulate on the soil surface, leading to salinization [8]. Conversely, when the groundwater depth is too deep, its impact on the surface soil moisture content and salinity is limited [9]. However, the impact on the main components of soil salinity, soluble ions, cannot be excluded.
The influence of groundwater depth on soil-soluble ions is a complex and critical ecological process with different migration mechanisms among the soil-soluble ions [10]. When groundwater depth fluctuates, the distribution, composition, and ratios of soluble ions change, thereby affecting soil fertility and vegetation growth [11,12]. Generally, when the groundwater depth is shallow, soil-soluble ions are more easily influenced by groundwater and rise to the surface soil through capillary action, thus increasing the accessibility of these ions to plants [13]. Conversely, when the groundwater depth is greater, the migration of these ions is restricted, which may affect healthy plant growth [14]. Therefore, in agricultural systems where the groundwater depth is controlled by irrigation or other methods, it is essential to consider the potential impact of groundwater on soil-soluble ions. The quantitative expression of the relationship among groundwater depth, soil moisture, salinity, and soluble ions has become a focal point in achieving sustainable agricultural production.
A range of advanced techniques has been used by researchers worldwide to analyze the distribution, recharge, and discharge pathways of soil moisture and salinity, including intensive observations, hydrological experiments, and isotope tracing [10,15,16]. Hydrochemical methods, including Piper diagrams, Gibbs diagrams, and ion ratios, play a crucial role in determining water quality and its controlling mechanisms and in examining water–rock interactions and cation exchange [17,18]. Multivariate analysis of soil moisture and salinity data, such as principal components analysis (PCA), hierarchical cluster analysis (HCA), and correlation analysis, are valuable tools. PCA simplifies multivariate datasets, such as ion composition, without losing important information [19,20] and can be used to classify observations [21]. The HCA groups a set of data or objects based on their similarities [22]. Correlation analysis was used to identify the relationships between multiple variables.
Although previous studies have examined the effects of groundwater depth on soil moisture and salinity in different regions, there is a need for further research on the differential distribution and formation mechanisms of soil moisture, salinity, and soluble ions within the same area with significant variations in groundwater depth. This is particularly true for studies on the distribution of soil moisture, salinity, and soluble ions under substantial changes in groundwater depth, with the arid agricultural irrigation areas of Northwest China serving as typical examples. The study area was located on the alluvial plain of the Konqi River at the edge of the Tarim Basin at the southern foot of the Tianshan Mountains in an arid inland basin with sparse annual precipitation (58 mm on average) and intense evaporation (2540 mm on average) [23]. In recent years, intense human activities such as large-scale water-saving irrigation have led to the unregulated extraction of groundwater, causing a significant decline in groundwater depth. This has substantially altered the distribution of soil moisture, salinity, and ions, making their evolutionary trends and dynamic patterns difficult to predict.
Therefore, in this study, we aimed to employ a space-for-time substitution approach within the same region using traditional hydrochemical analysis methods combined with multivariate statistical analysis to investigate the dynamic distribution mechanisms of soil moisture, salinity, and soluble ions at different groundwater depths (<5 m, 5–10 m, and >10 m). We aimed to elucidate the mechanisms by which changes in groundwater depth influence soil moisture and salinity dynamics in arid agricultural irrigation areas. We hypothesize that groundwater depth significantly affects soil moisture, salinity, and the distribution of soluble ions, with distinct differentiation patterns under varying depth conditions. These findings are critical for understanding the hydrogeological processes in arid regions, developing effective water resource management and land use policies, and providing scientific evidence and technical support for the sustainable development of arid regions.

2. Materials and Methods

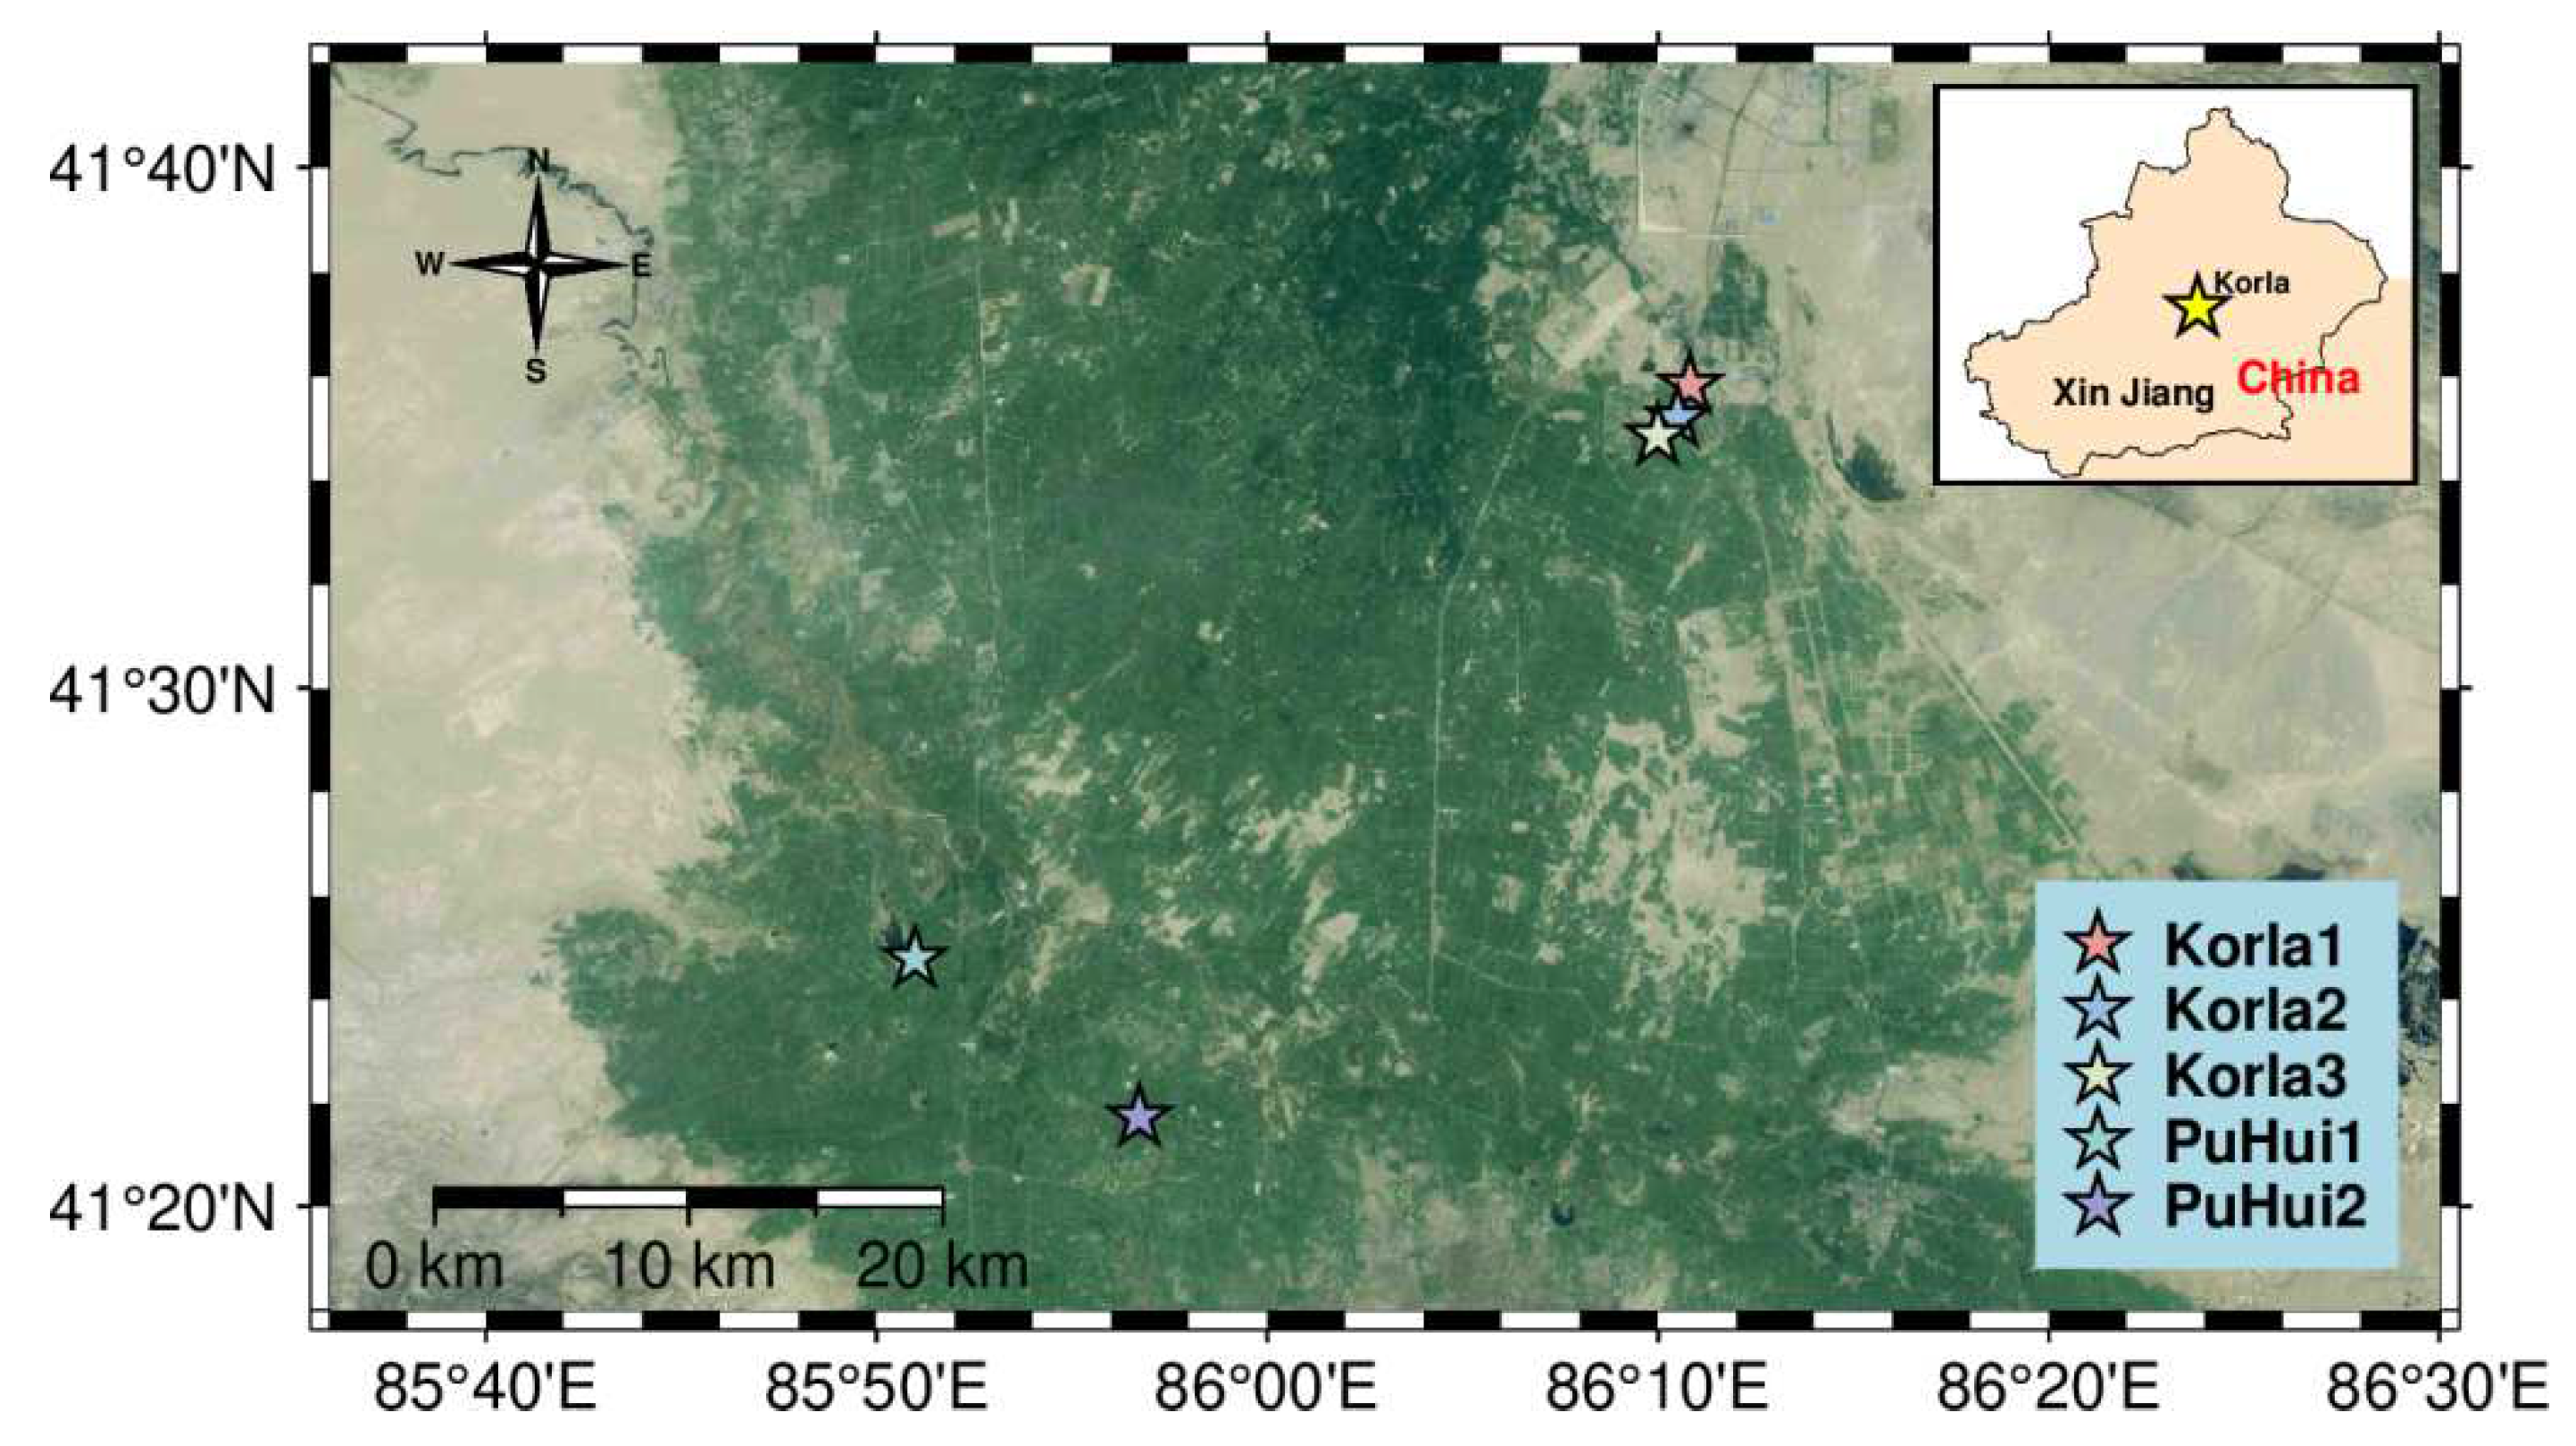
2.1. Experimental Site Overview

To use a space-for-time substitution approach, five experimental sites (Korla1, Korla2, Korla3, PuHui1, and PuHui2) were selected within the study area based on varying groundwater depths (<5 m, 5–10 m, and >10 m). All the sites were located in Korla City, Bayingolin Mongol Autonomous Prefecture, Xinjiang Uyghur Autonomous Region, China. Soil samples were taken from Korla 1 site before spring irrigation (7 April 2024) and after (20 April 2024), which were recorded as sampling sites Korla1-1 and Korla1-2, respectively. The rest of the sampling sites were collected once after spring irrigation. The altitude of the sampling sites primarily ranges between 880 and 900 m, with an average annual temperature of 11.5 °C. Summers are warm, winters are relatively cool, and there are significant diurnal temperature variations. Because of the arid, low-rainfall conditions and abundant sunshine, crops are often cultivated using drip irrigation with mulch. Common crops include cotton, tomato, cumin, and corn. Korla1, Korla2, and Korla3 sampling sites are located at the Water Conservancy Research Institute of Bayingolin Administration Bureau of Tarim River Basin, with groundwater depths ranging from 15.77 to 16.53 m throughout the year. The PuHui1 sampling site with a groundwater depth of 2.97–3.21 m and PuHui2 sampling site with a groundwater depth of 5.87–6.33 m are located at the Puhui Farm in Korla City. The specific locations and details of the sampling sites are shown in Figure 1 and Table 1.

2.2. Soil Sampling and Groundwater Depth Monitoring

Soil samples were collected before and after spring irrigation in April 2024. At each sampling site, the soil samples were collected at a depth of 180 cm. From depths of less than 80 cm, every 10 cm, and from 80 to 180 cm, samples were collected every 20 cm. The extracted soil samples were immediately sealed in soil sample bags and air-dried before soil salinity was measured. Simultaneously with soil sampling, the soil water content (SWC) at each sampling depth was measured using time-domain reflectometry [24].
A laser-marked water level meter (Model 102, Solinst, Georgetown, ON, Canada) was used to monitor groundwater depths at the Water Conservancy Research Institute of the Bayingolin Administration Bureau of the Tarim River Basin and PuHui Farm. The latitude, longitude, and elevation of the sampling sites were recorded using a handheld Global Positioning System device (UniStrong G130BD; UniStrong Science & Technology Co., Ltd., Beijing, China).

2.3. Soil Salinity and Soil Ion Testing

Ion content in soils, soil electrical conductivity (EC1:5), pH, and TDS were measured using an extract from a soil-to-water mixture at a ratio of 1:5. The mixture was shaken, centrifuged, and filtered before testing. EC1:5 and pH were determined using a pH-EC water quality tester (H1991301, HANNA, Vimodrone, Italy), whereas TDS was measured using a JENCO TDS meter (3010M, JENCO Electronics Ltd., Shanghai, China). The final results were obtained by averaging the measurements from three replicates.
Before testing for soil ions, the soil samples in the sample bags were air-dried, ground, and passed through a 1 mm sieve. Anions in the soil, including Cl, SO42−, and NO3, were determined using a Dionex ion chromatograph (ICS1100, Dionex Corporation, Sunnyvale, CA, USA). CO32− and HCO3 were measured using the titration method. Ca2+, Mg2+, Na+, K+, Fe, and Mn were analyzed using an inductively coupled plasma optical emission spectrometer (5100 ICP-OES, Agilent Technologies, Santa Clara, CA, USA). Because ICP-OES measures free-state elements in water, Fe represents the sum of Fe2+ and Fe3+. Meanwhile, Mn represents the sum of Mn2+ and the other oxidation states. Tests were conducted at the State Key Laboratory of Biogeology and Environmental Geology, China University of Geosciences (Wuhan, China).

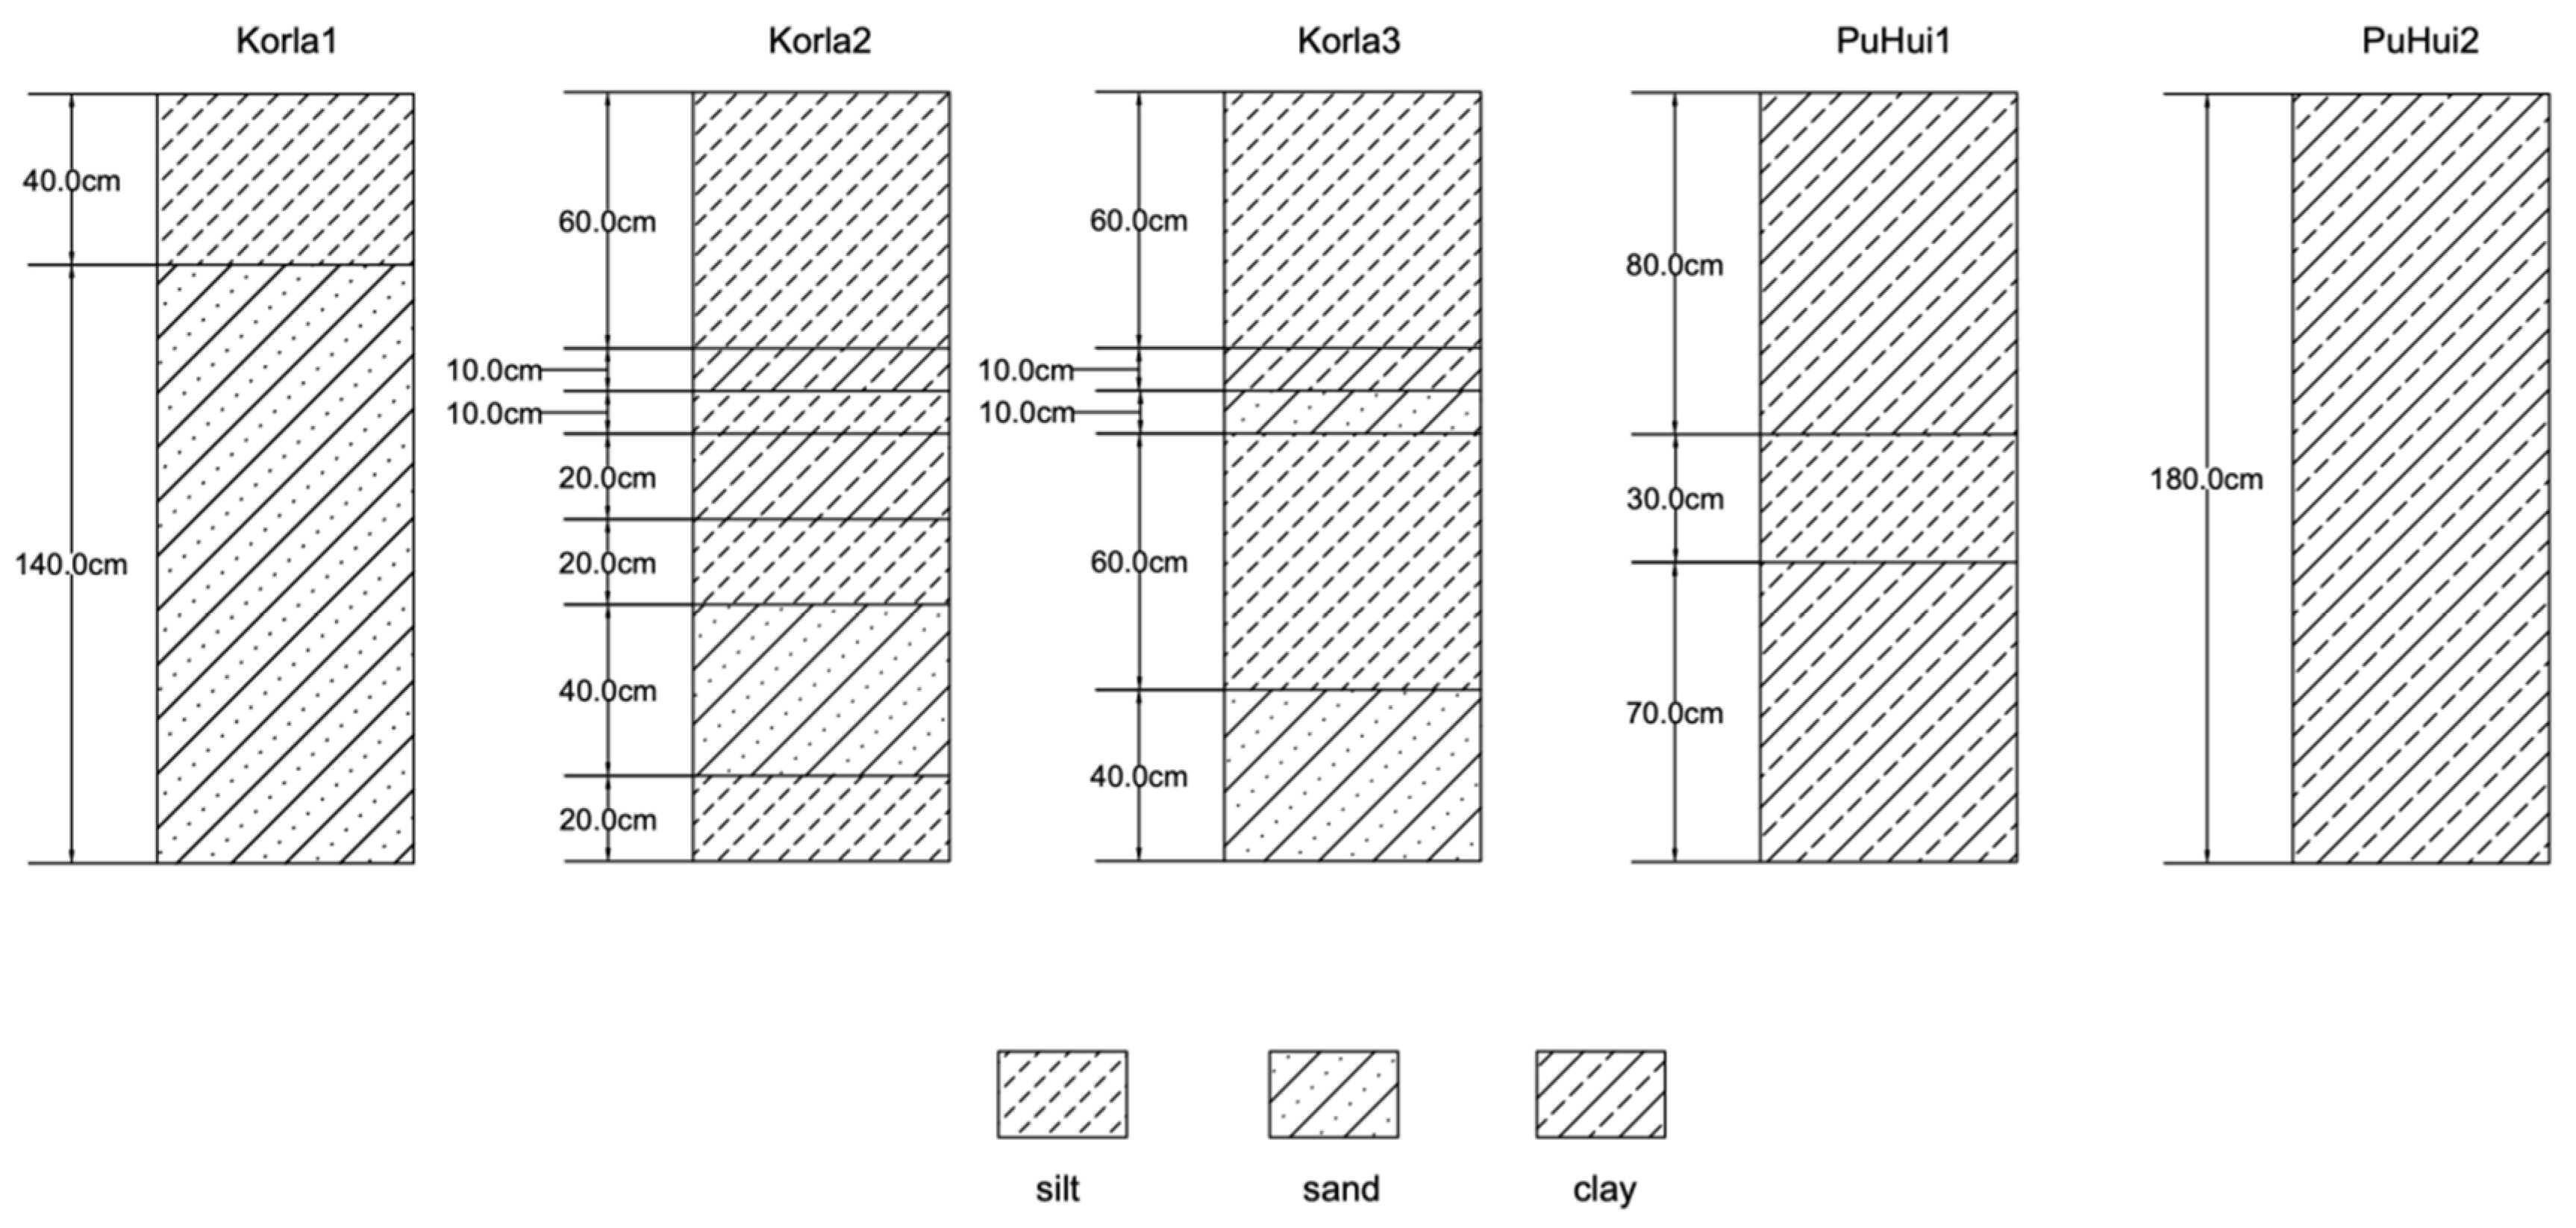
2.4. Soil Texture Analysis

Soil texture and grain size distribution were determined using a QT-2002 type automatic laser particle size analyzer (Beijing Channel Scientific Instruments Co., Ltd., Beijing, China), with a measurement range of 0.1 μm to 600 μm and <1% repeat error. The soil texture classification follows the USDA soil texture classification system. The soil at sampling sites in Korla is predominantly silt and sandy soil, whereas the sampling sites in the Puhui region are mainly characterized by clay (Figure 2).

2.5. Data Analysis Method

2.5.1. Analysis of Soil Representative Ion Content

The ratio of different ions in the soil can provide valuable information regarding its chemical and biological properties, which is important for agriculture, environmental protection, and land management [25]. Therefore, the concentration or relative abundance of these ions is indicative of soil biochemical characteristics. The representative ion concentrations analyzed in this study included cations (Ca2+, Mg2+, Na+, K+, Fe, and Mn) and anions (Cl, SO42−, NO3, CO32−, and HCO3). Major ions are the primary components of soil salinity, whereas trace element ions are important for healthy vegetation growth [18,26]. Relative ion concentrations included the soil SAR and Cl/SO42− ratio. The SAR measures the relative concentration of Na+ to Ca2+ and Mg2+ in the soil and is a key indicator for evaluating the effects of soluble salts on plant growth and soil structure [27].
The SAR is calculated as follows:
S A R = [ N a + ] / ( 0.5 [ C a 2 + ] + 0.5 [ M g 2 + ] ) 0.5
where [Na+] [Ca2+] [Mg2+] represent the concentrations of Na+ Ca2+ Mg2+ in the soil extract (mg L−1).
A higher SAR value indicates a higher relative concentration of Na+ in the soil, which can lead to poorer soil structure and signal a risk of soil salinization. This, in turn, affects the transport of water and nutrients and plant growth [28]. The main anions in the soil are Cl and SO42−, and changes in the Cl/SO42− ratio can reflect alterations in the composition of soil anions. Because Cl is more mobile in water than SO42−, the Cl/SO42− ratio can reveal the state of salt leaching in the soil [17].

2.5.2. PCA and HCA

PCA is a commonly used dimensionality reduction technique that helps to identify the most significant variation trends in a multidimensional dataset. Through PCA, multiple variables can be simplified into principal components that effectively capture the main directions of variation in the data. In this study, PCA was applied to analyze the research variables of soil samples under different groundwater depth conditions. Raw data were preprocessed using Z-score standardization, followed by the computation of the covariance matrix. The covariance matrix is then subjected to eigenvalue decomposition to identify the eigenvalues and corresponding eigenvectors. The two largest eigenvalues and their corresponding eigenvectors were selected. These two eigenvectors represented the first principal component (PC1) and second principal components (PC2). These two principal components were combined as column vectors to form a 2xN projection matrix, where N represents the number of original features (17 in this study, this includes the 15 indicators presented in Table 2, along with SAR and Cl/SO42−, with 17 feature vectors corresponding to the hierarchical clustering). The standardized original data were projected onto a new two-dimensional space defined by these two principal components, resulting in a reduced-dimensional representation of the data.
Similar to PCA, hierarchical clustering first requires standardization of the raw data. The clustering objects in this study were all soil samples, and the similarity between the objects was calculated using Euclidean distance. Initially, each object was treated as an individual cluster, and a distance matrix was constructed based on the distances between all the clusters. The two closest clusters were identified and merged into a new cluster. The distance matrix was updated to reflect the new cluster structure. This process is repeated until all the objects are merged into a single cluster. In this study, the Ward method was used to merge the clusters [19].

2.5.3. Correlation Analysis and Statistical Testing

Correlation analysis was used to examine the relationships among anions, cations, electrical conductivity, and other soil variables. The Pearson correlation coefficient was used to determine whether there was a linear correlation between pairs of variables (p < 0.05). The K–S test (p > 0.05) was used to assess whether a dataset followed a normal distribution [29]. Tukey’s HSD (honest significant difference) post hoc test (p < 0.05) was used in the analysis of variance (ANOVA) to determine significant differences between means [30].

2.6. Limitations

The current sampling strategy is predominantly confined to a single temporal point. Future research will prioritize the design of long-term monitoring experiments to investigate the dynamic distribution of soil ions over extended periods. Additionally, while this study has primarily focused on the influence of groundwater on soil ion distribution, other potential driving factors have not been systematically analyzed. Subsequent work will aim to quantitatively assess diverse drivers affecting soil ion distribution across temporal scales, employing time-series analyses to elucidate their relative contributions and interactions.

3. Results

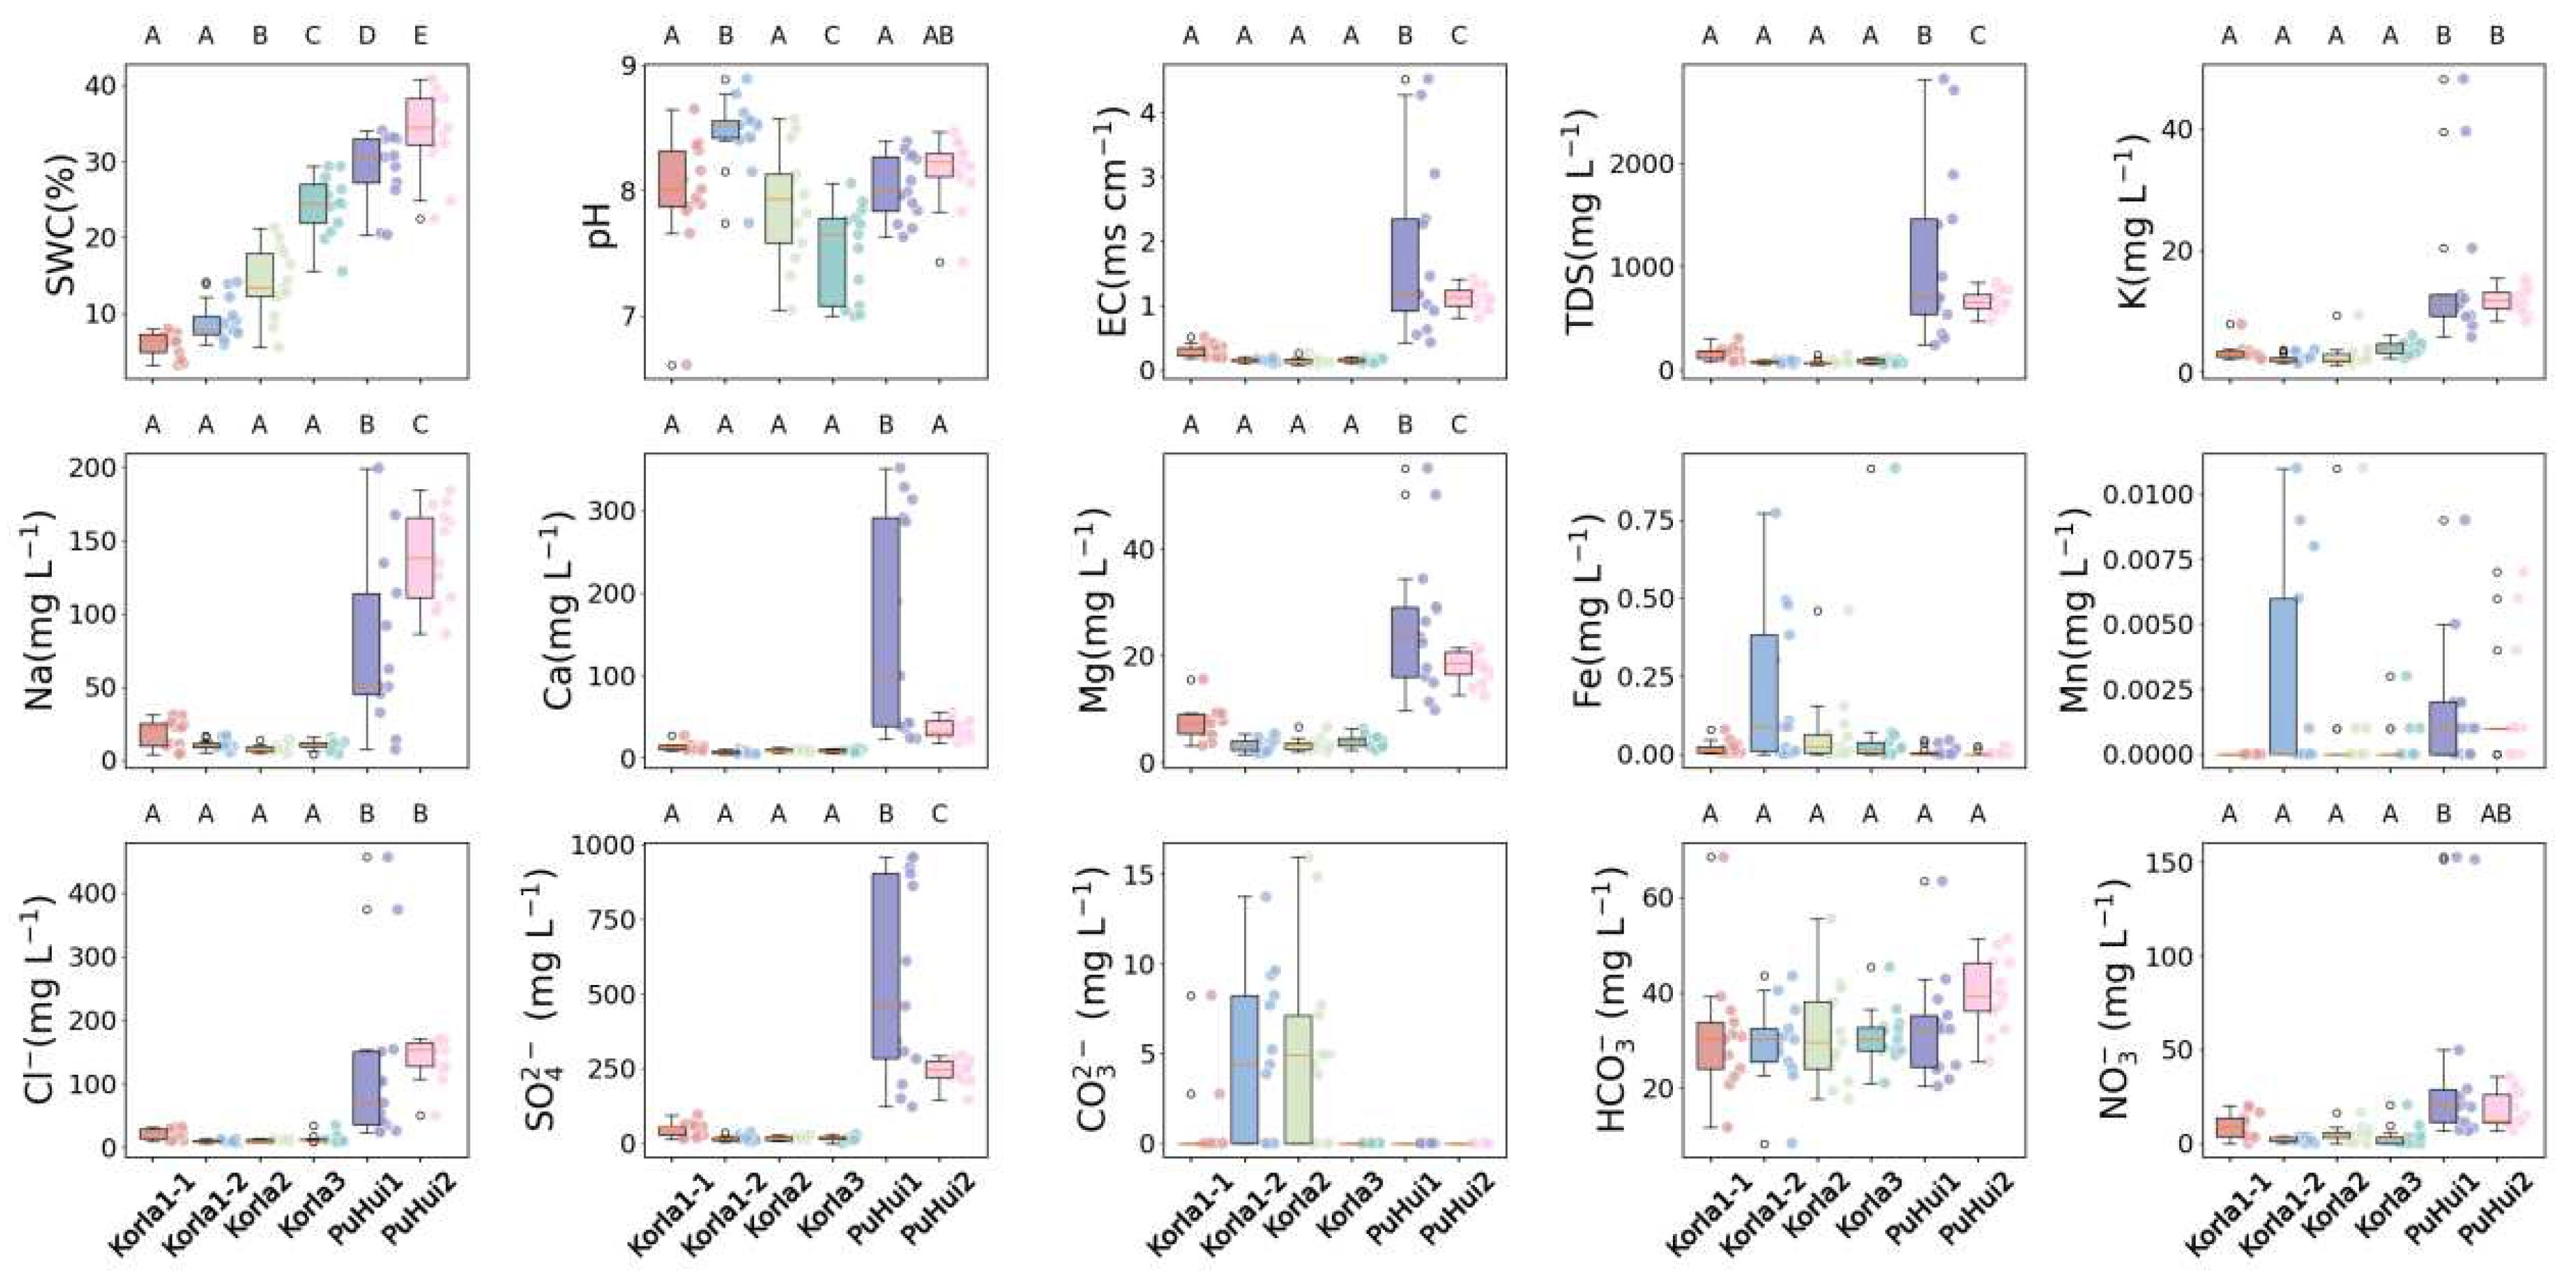
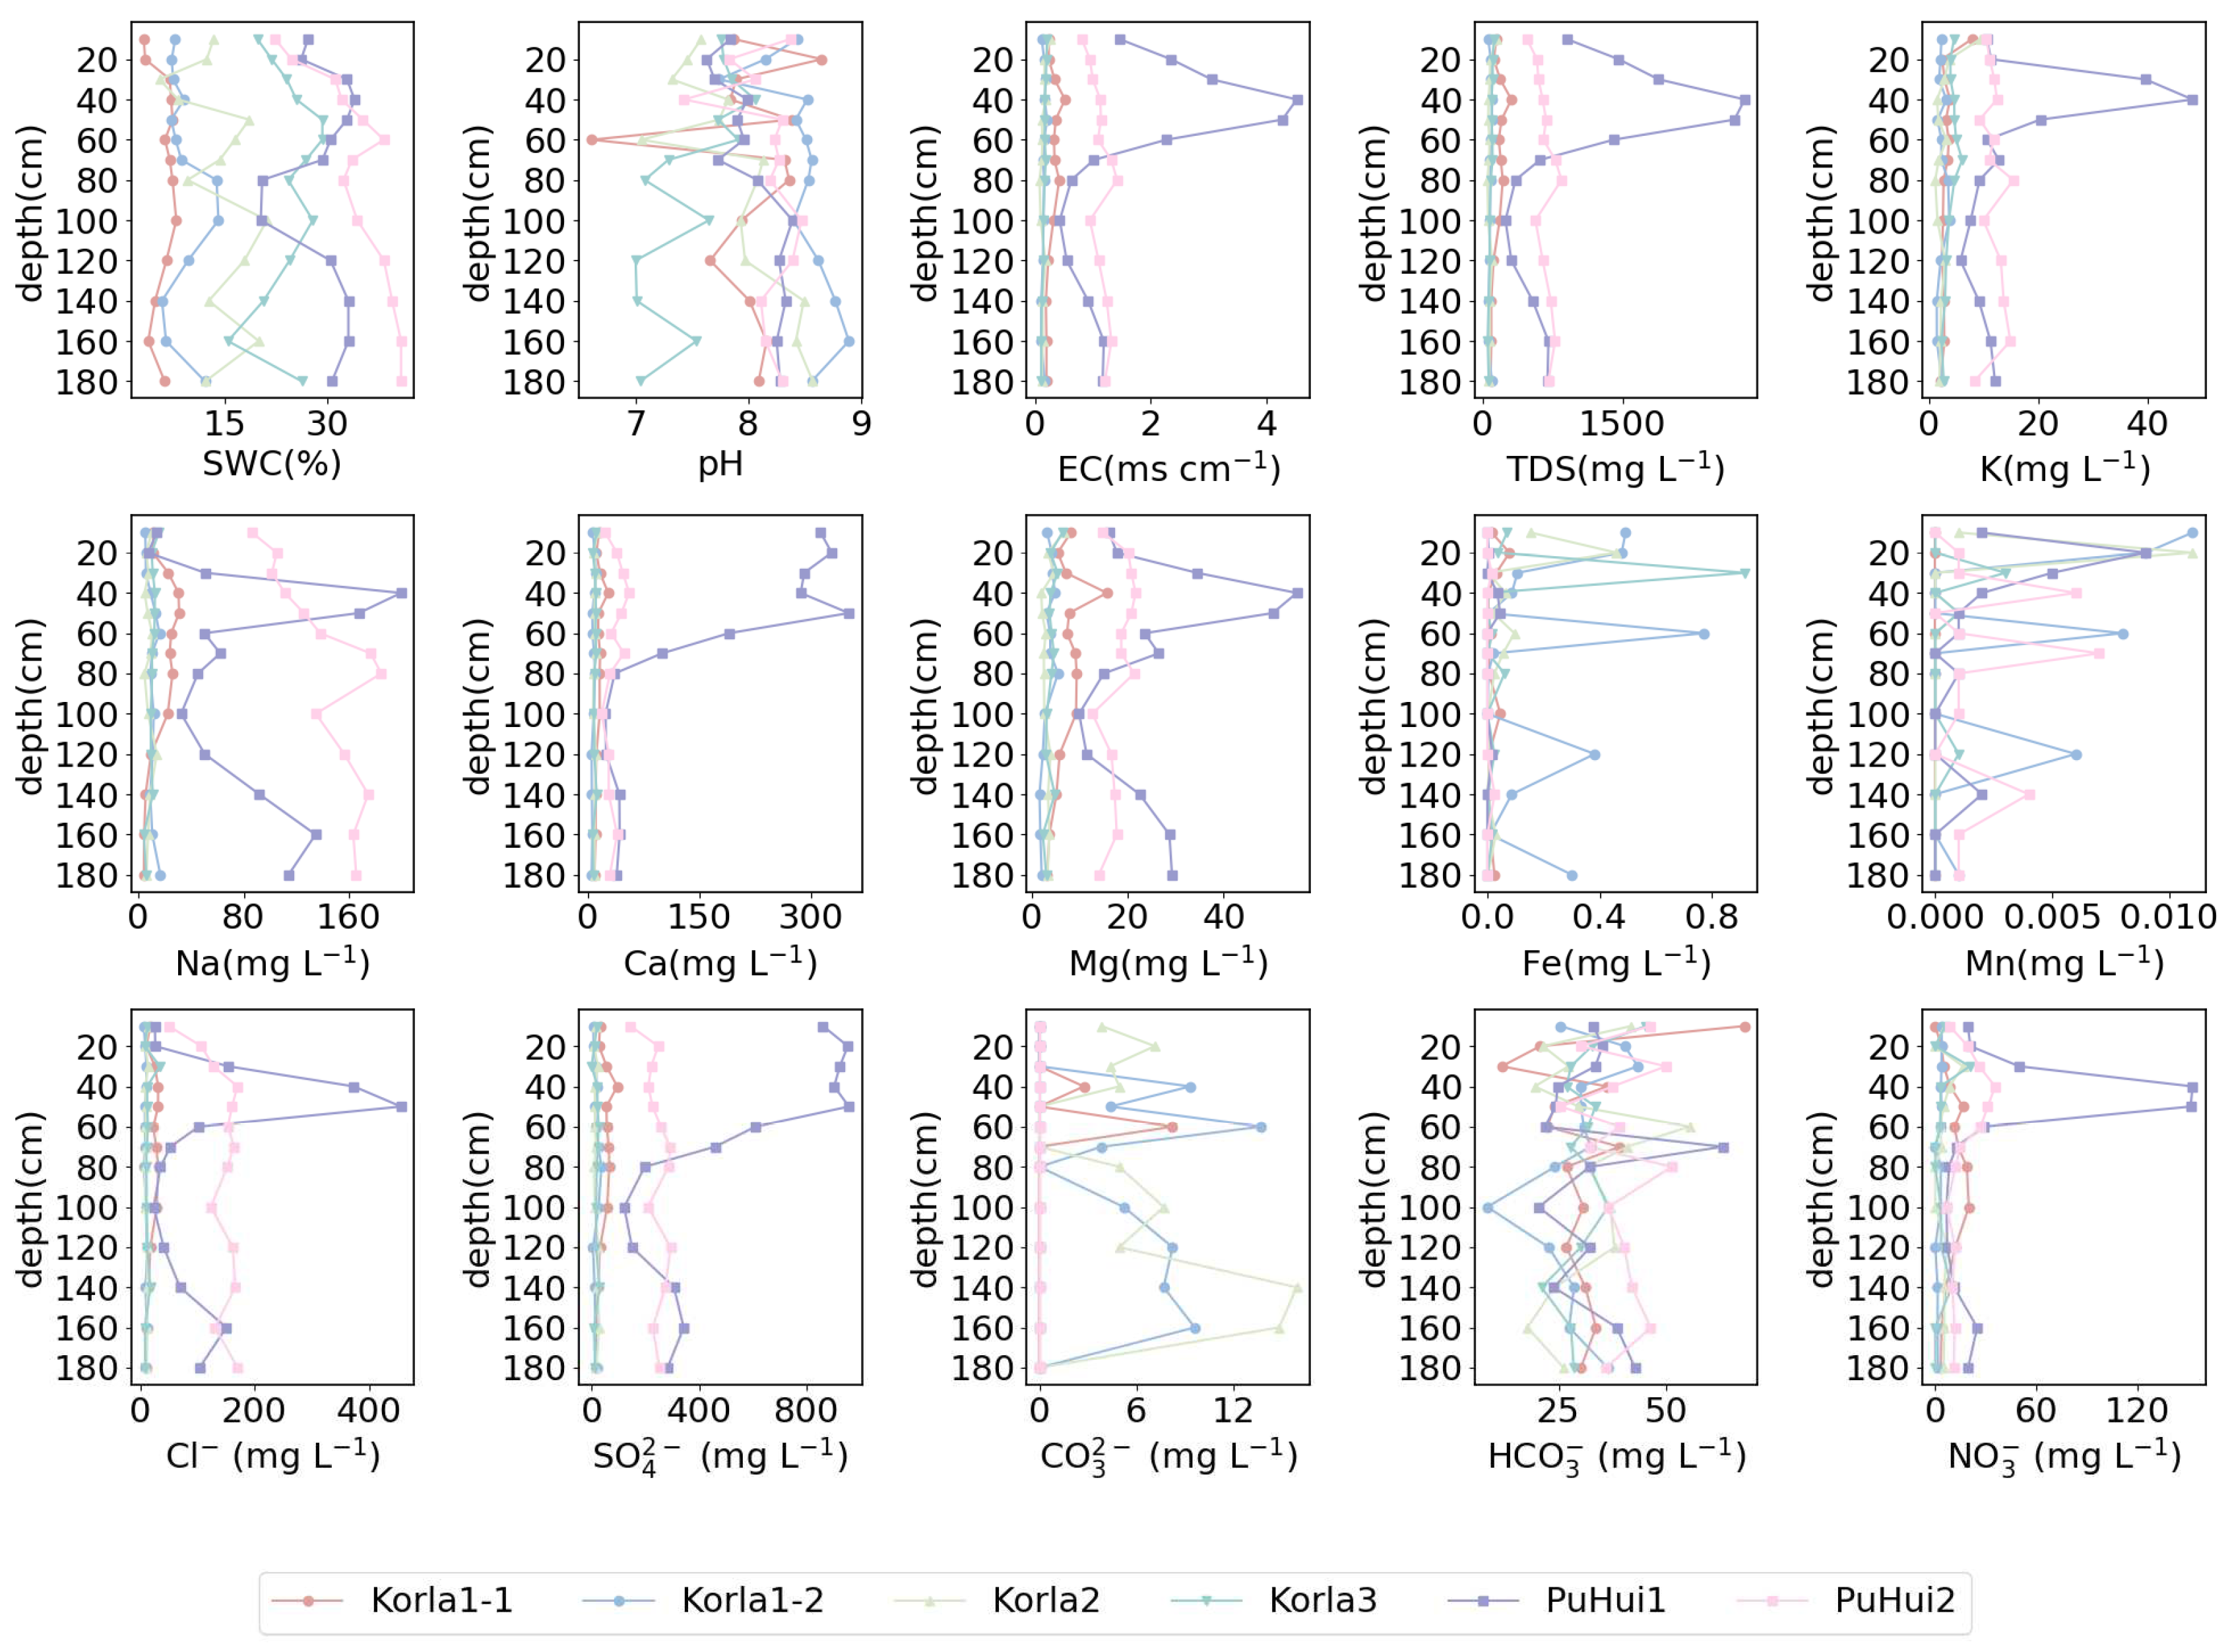
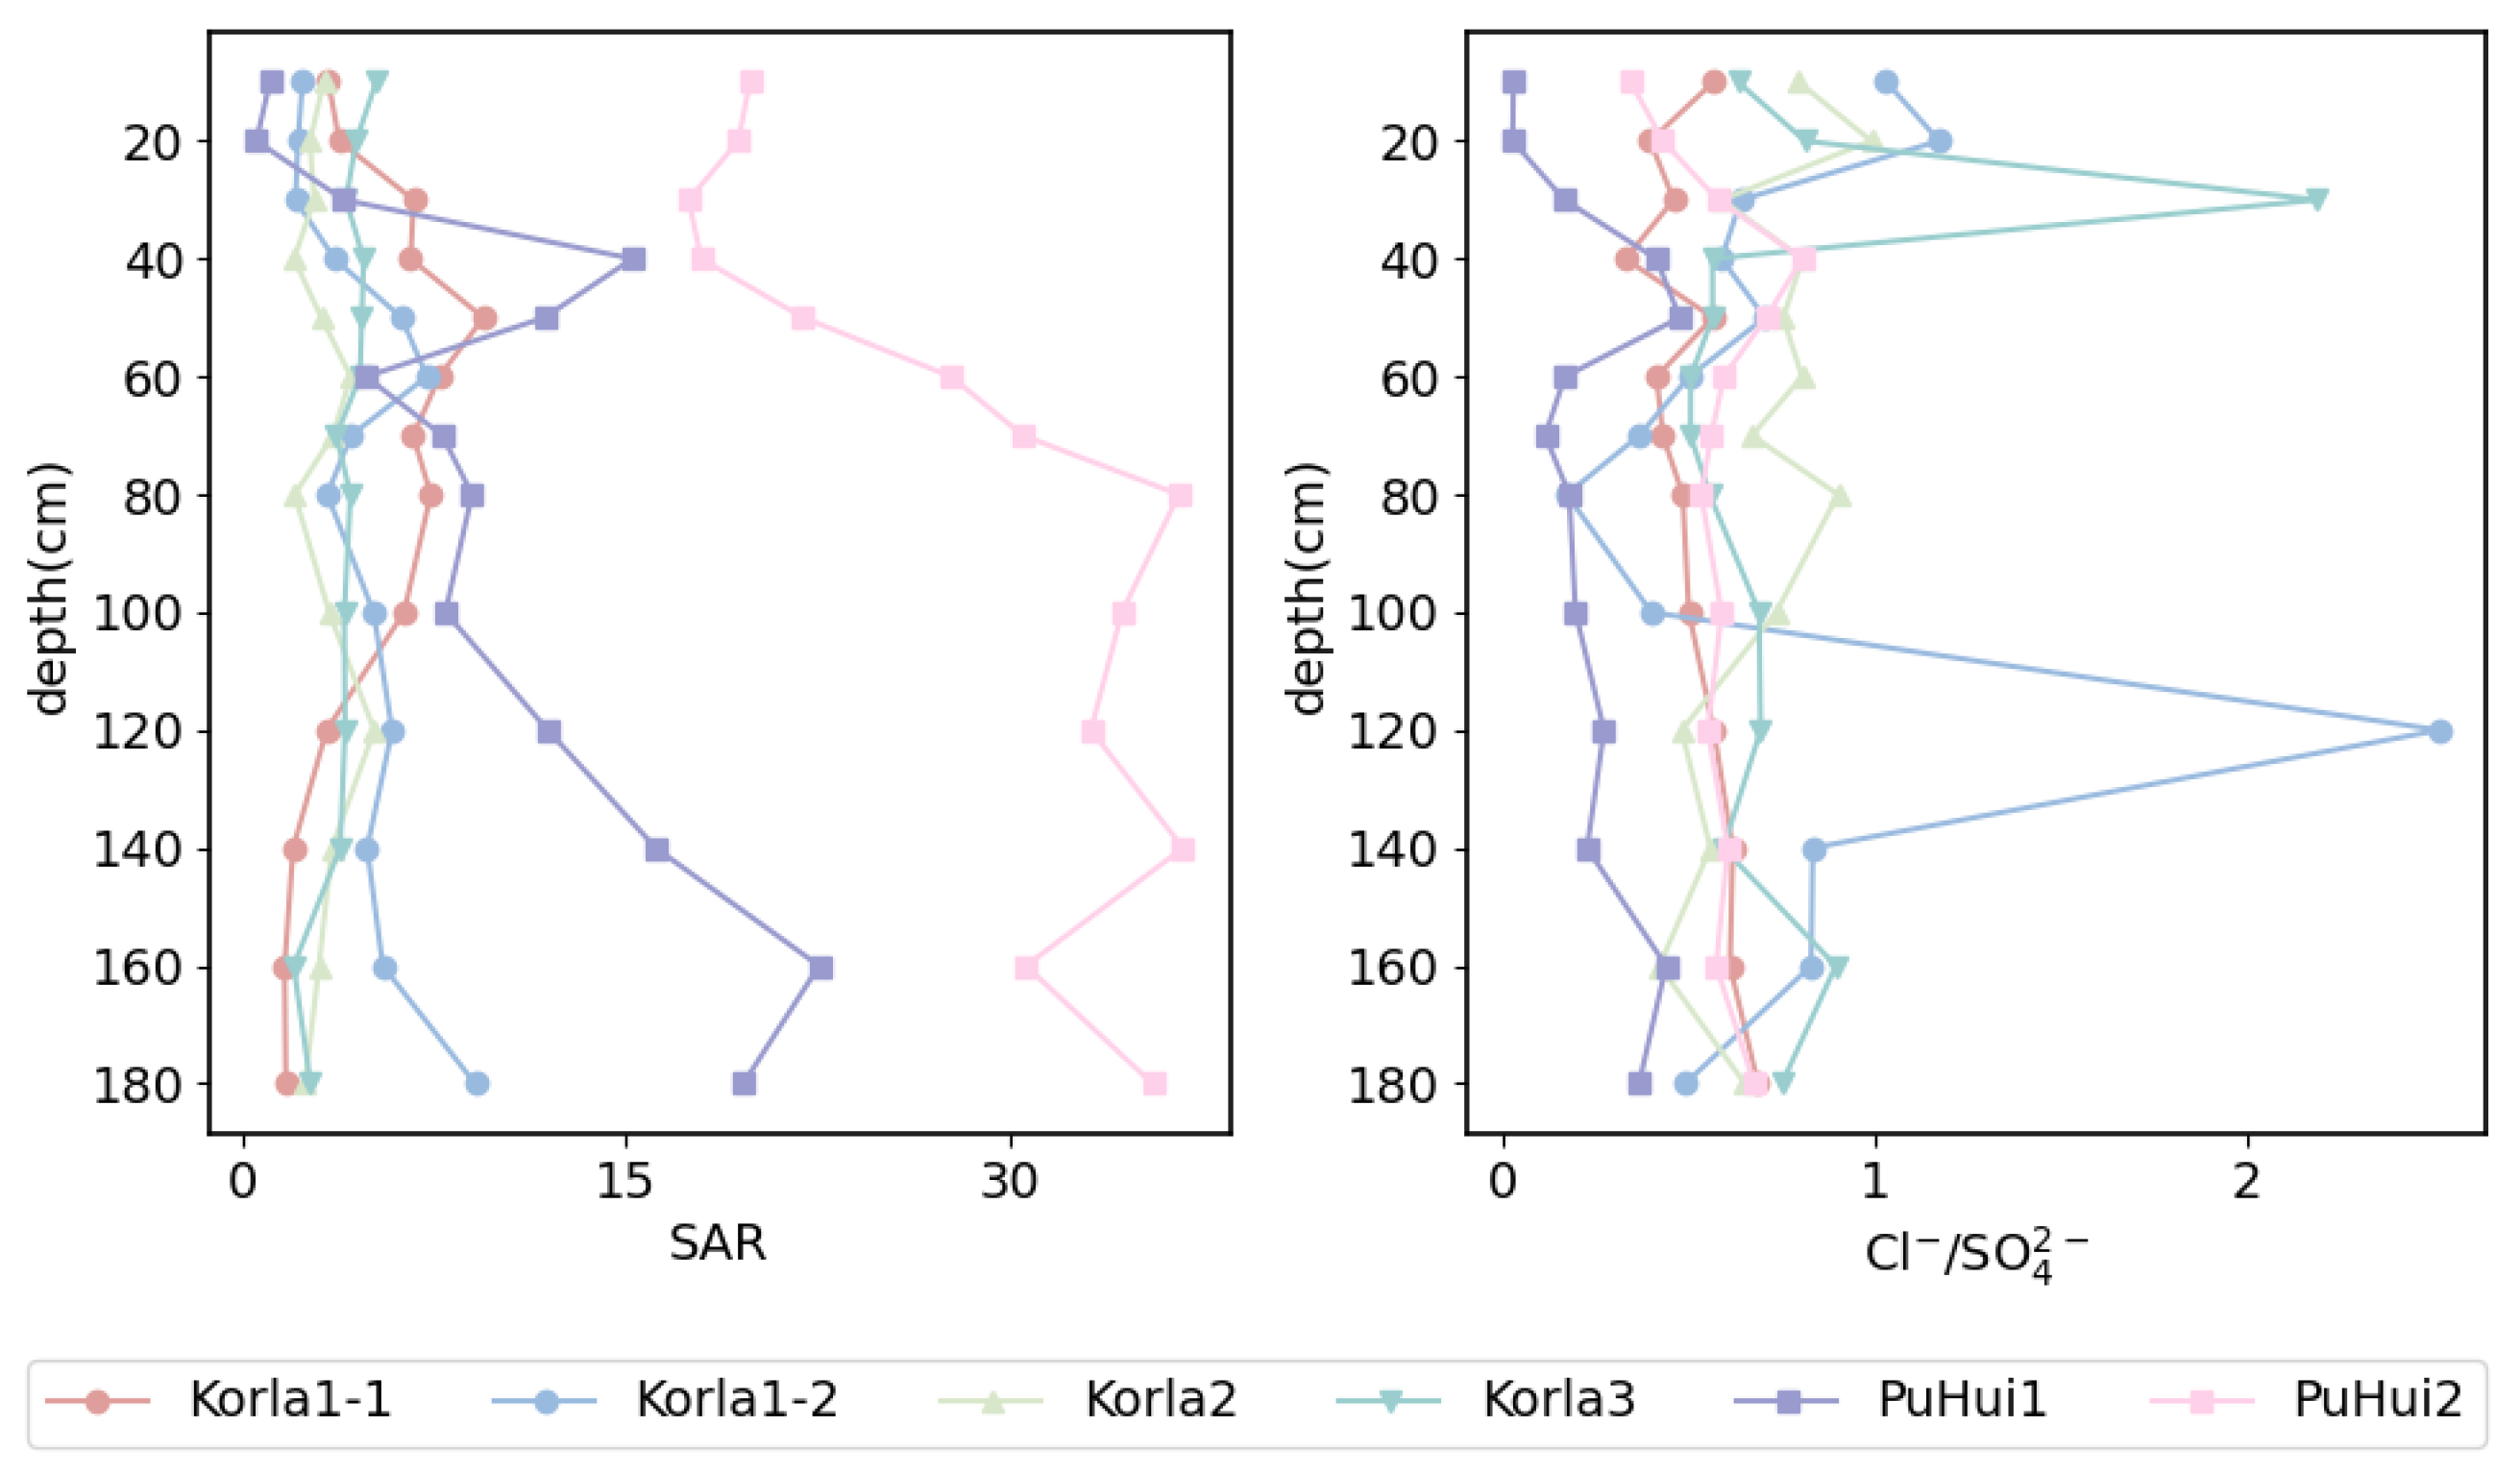
3.1. Soil Water, Salt, and Ion Distribution at Different Groundwater Depths

Table 2 provides the statistical characteristics of the soil moisture and salinity in the study area. The coefficient of variation (CV) was used to measure the degree of variability of soil properties. A CV of less than 10% reflects low-intensity variation, 10–100% indicates moderate-intensity variation, and greater than 100% indicates high-intensity variation [31]. Trace element ions, Fe, and Mn exhibited a high degree of variability, falling into the category of high-intensity variation. However, due to their low concentrations, trace element ions and CO32− may distort the CV and distribution [32]. Most other common ions in the soil showed moderate variations in intensity. Soil pH showed the least variation and was classified as low-intensity variation. Most of the pH values in the study area were greater than 7, indicating predominantly alkaline soils, which is consistent with the findings of Zhang et al. [31]. The variability in ion concentrations at PuHui1 was higher than at the other sampling points, suggesting that shallower groundwater depths may augment ion distribution variability. Except for the trace element ions and CO32−, most soil variables exhibited a normal distribution (p > 0.05).
According to the results of the Piper trilinear diagram (Figure 3), the chemical type of soluble salt in PuHui1 soil was primarily Ca-SO4. Meanwhile, in PuHui2, it was mainly Na-SO4. Korla1-1, Korla1-2, Korla2, and Korla3 sites exhibited mixed types. Korla1-1 is characterized as a Ca-Mg-SO4-Cl type. Some of the soluble salts in Korla1-2 share a chemical composition similar to Korla1-1. Meanwhile, others display a Na-K-CO3-HCO3 type, potentially influenced by factors such as irrigation. In Korla2, some salts are similar to those in Korla1-1, whereas others show a Ca-HCO3 type. The soluble salts in Korla3 were similar in chemical composition to those in Korla1-1.
As shown in Figure 4, the SWC in PuHui1 and PuHui2 was higher than in Korla1, Korla2, and Korla3 (p < 0.05), indicating that shallower groundwater depths may contribute to increased SWC. This is consistent with previous research findings [8,33]. However, the pH values across the different sampling sites showed no clear pattern, suggesting that groundwater depth may have had a minimal impact on pH. The EC and TDS values in the PuHui area were significantly higher than those in the Korla area (p < 0.05). Generally, soil salinity is positively correlated with electrical conductivity, suggesting that shallow groundwater depths may increase soil salinity [8,33]. The major ionic components of soluble salts in the soil (e.g., K+, Na+, Ca2+, Mg2+, SO42−, and Cl) are higher in the PuHui area compared to Korla. Meanwhile, trace elements like Fe, Mn, and CO32− do not follow this trend. This suggests that groundwater depth primarily influences the major ionic components of soil-soluble salts, with a minimal impact on trace elements.
Contrary to the traditional phenomenon of surface salt accumulation in arid soils [34], the soil salinity in the study area was relatively concentrated at depths of 20–80 cm (Figure 5). This was particularly the case in PuHui1, where salinity is concentrated at 40–60 cm. This may be due to irrigation practices leaching salts downward, causing them to migrate to the subsurface layers. The water and salt distribution in PuHui1 have a typical inverted “S” shape. This indicates that the shallow soil layers are highly influenced by intense evaporation and irrigation, leading to higher water and salt content. Meanwhile, the deeper layers are influenced by groundwater and capillary rise, resulting in higher water and salt levels, with the middle layers being less affected by lower water and salt content [35]. In PuHui1, Ca2+ and SO42− concentrations were higher at depths of 20–40 cm, whereas Na+ and Cl concentrations were lower. This was likely because Na+ and Cl are more easily leached by water than by Ca2+ and SO42−. In contrast, the other sampling sites had lower coefficients of variation in the ion distribution, indicating a more uniform distribution. The distribution of trace elements and CO32− and HCO3 ions across the sampling sites does not show any distinct patterns.
In the study area, the total salt content in the soil at all sampling sites, calculated as the sum of eight major ions (K+, Na+, Ca2+, Mg2+, Cl, SO42−, CO32−, and HCO3), was <3 g/kg, indicating that the soils were non-saline [31]. This may be attributed to the use of water-saving irrigation techniques, such as drip irrigation in the study area. This prevents soil salt accumulation that could result from excessive irrigation [36]. Moreover, the groundwater depth at the sampling sites was relatively deep, exceeding 3 m, which reduced the influence of groundwater on soil salinity.

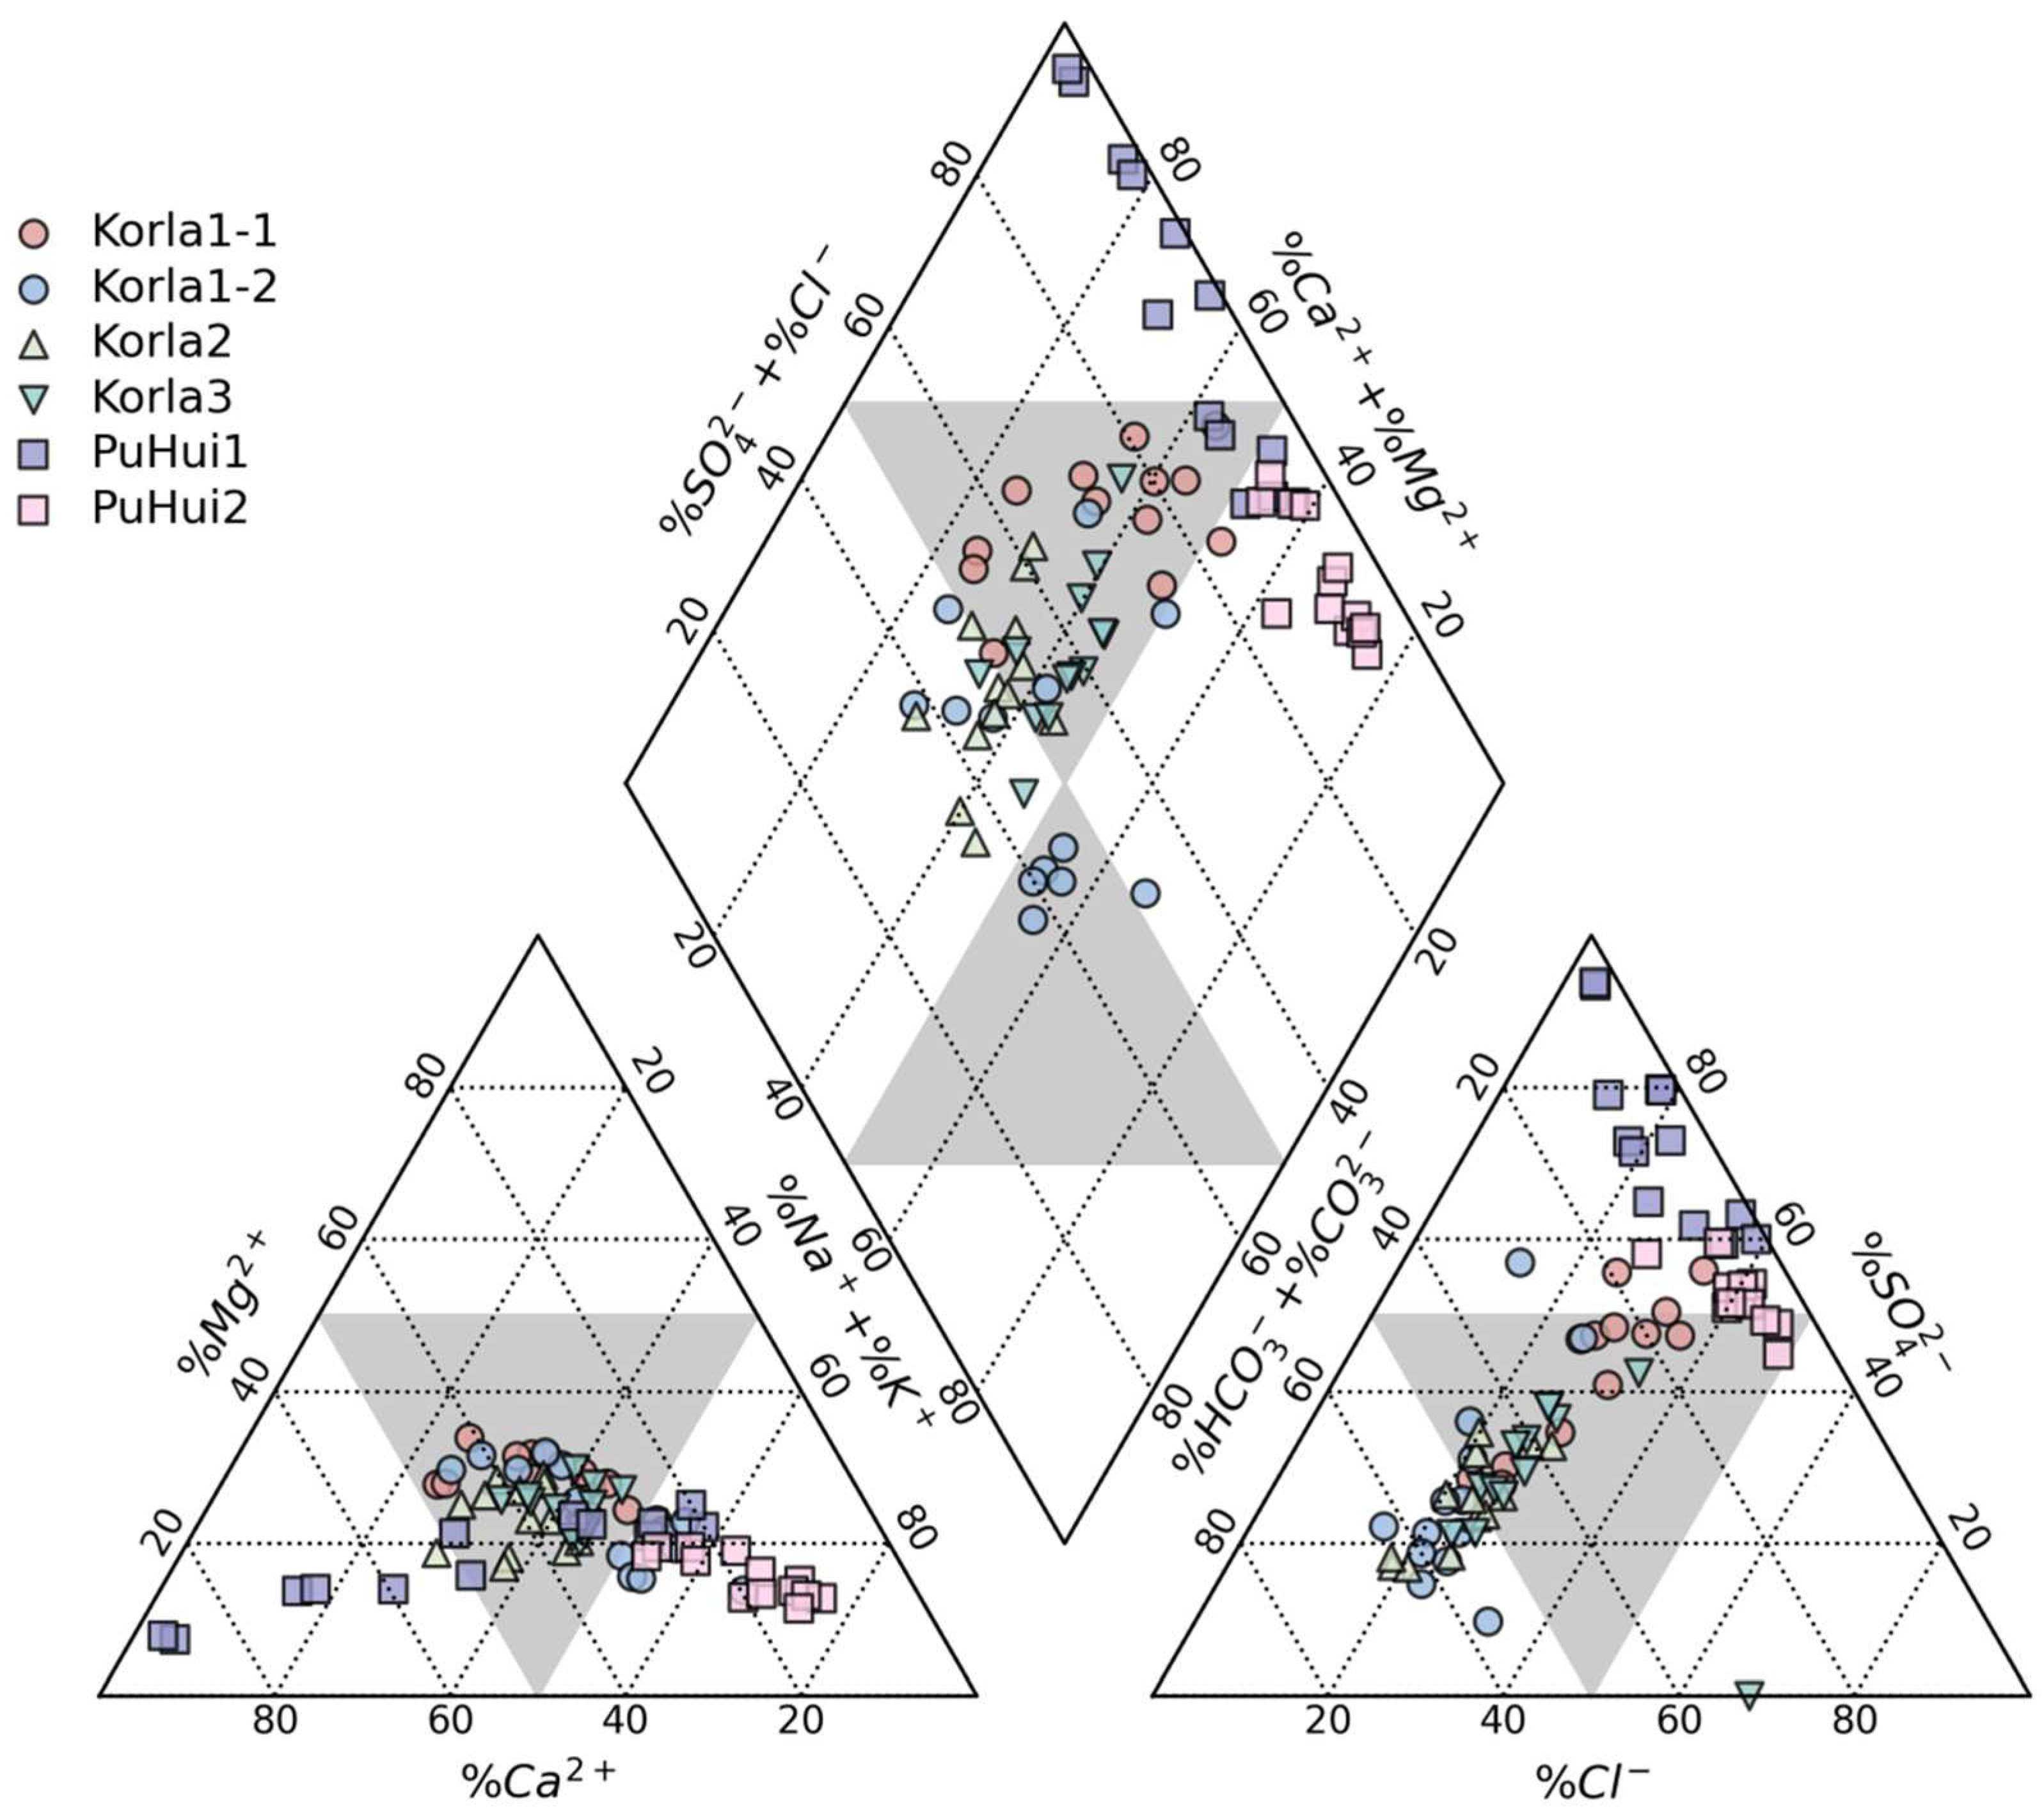
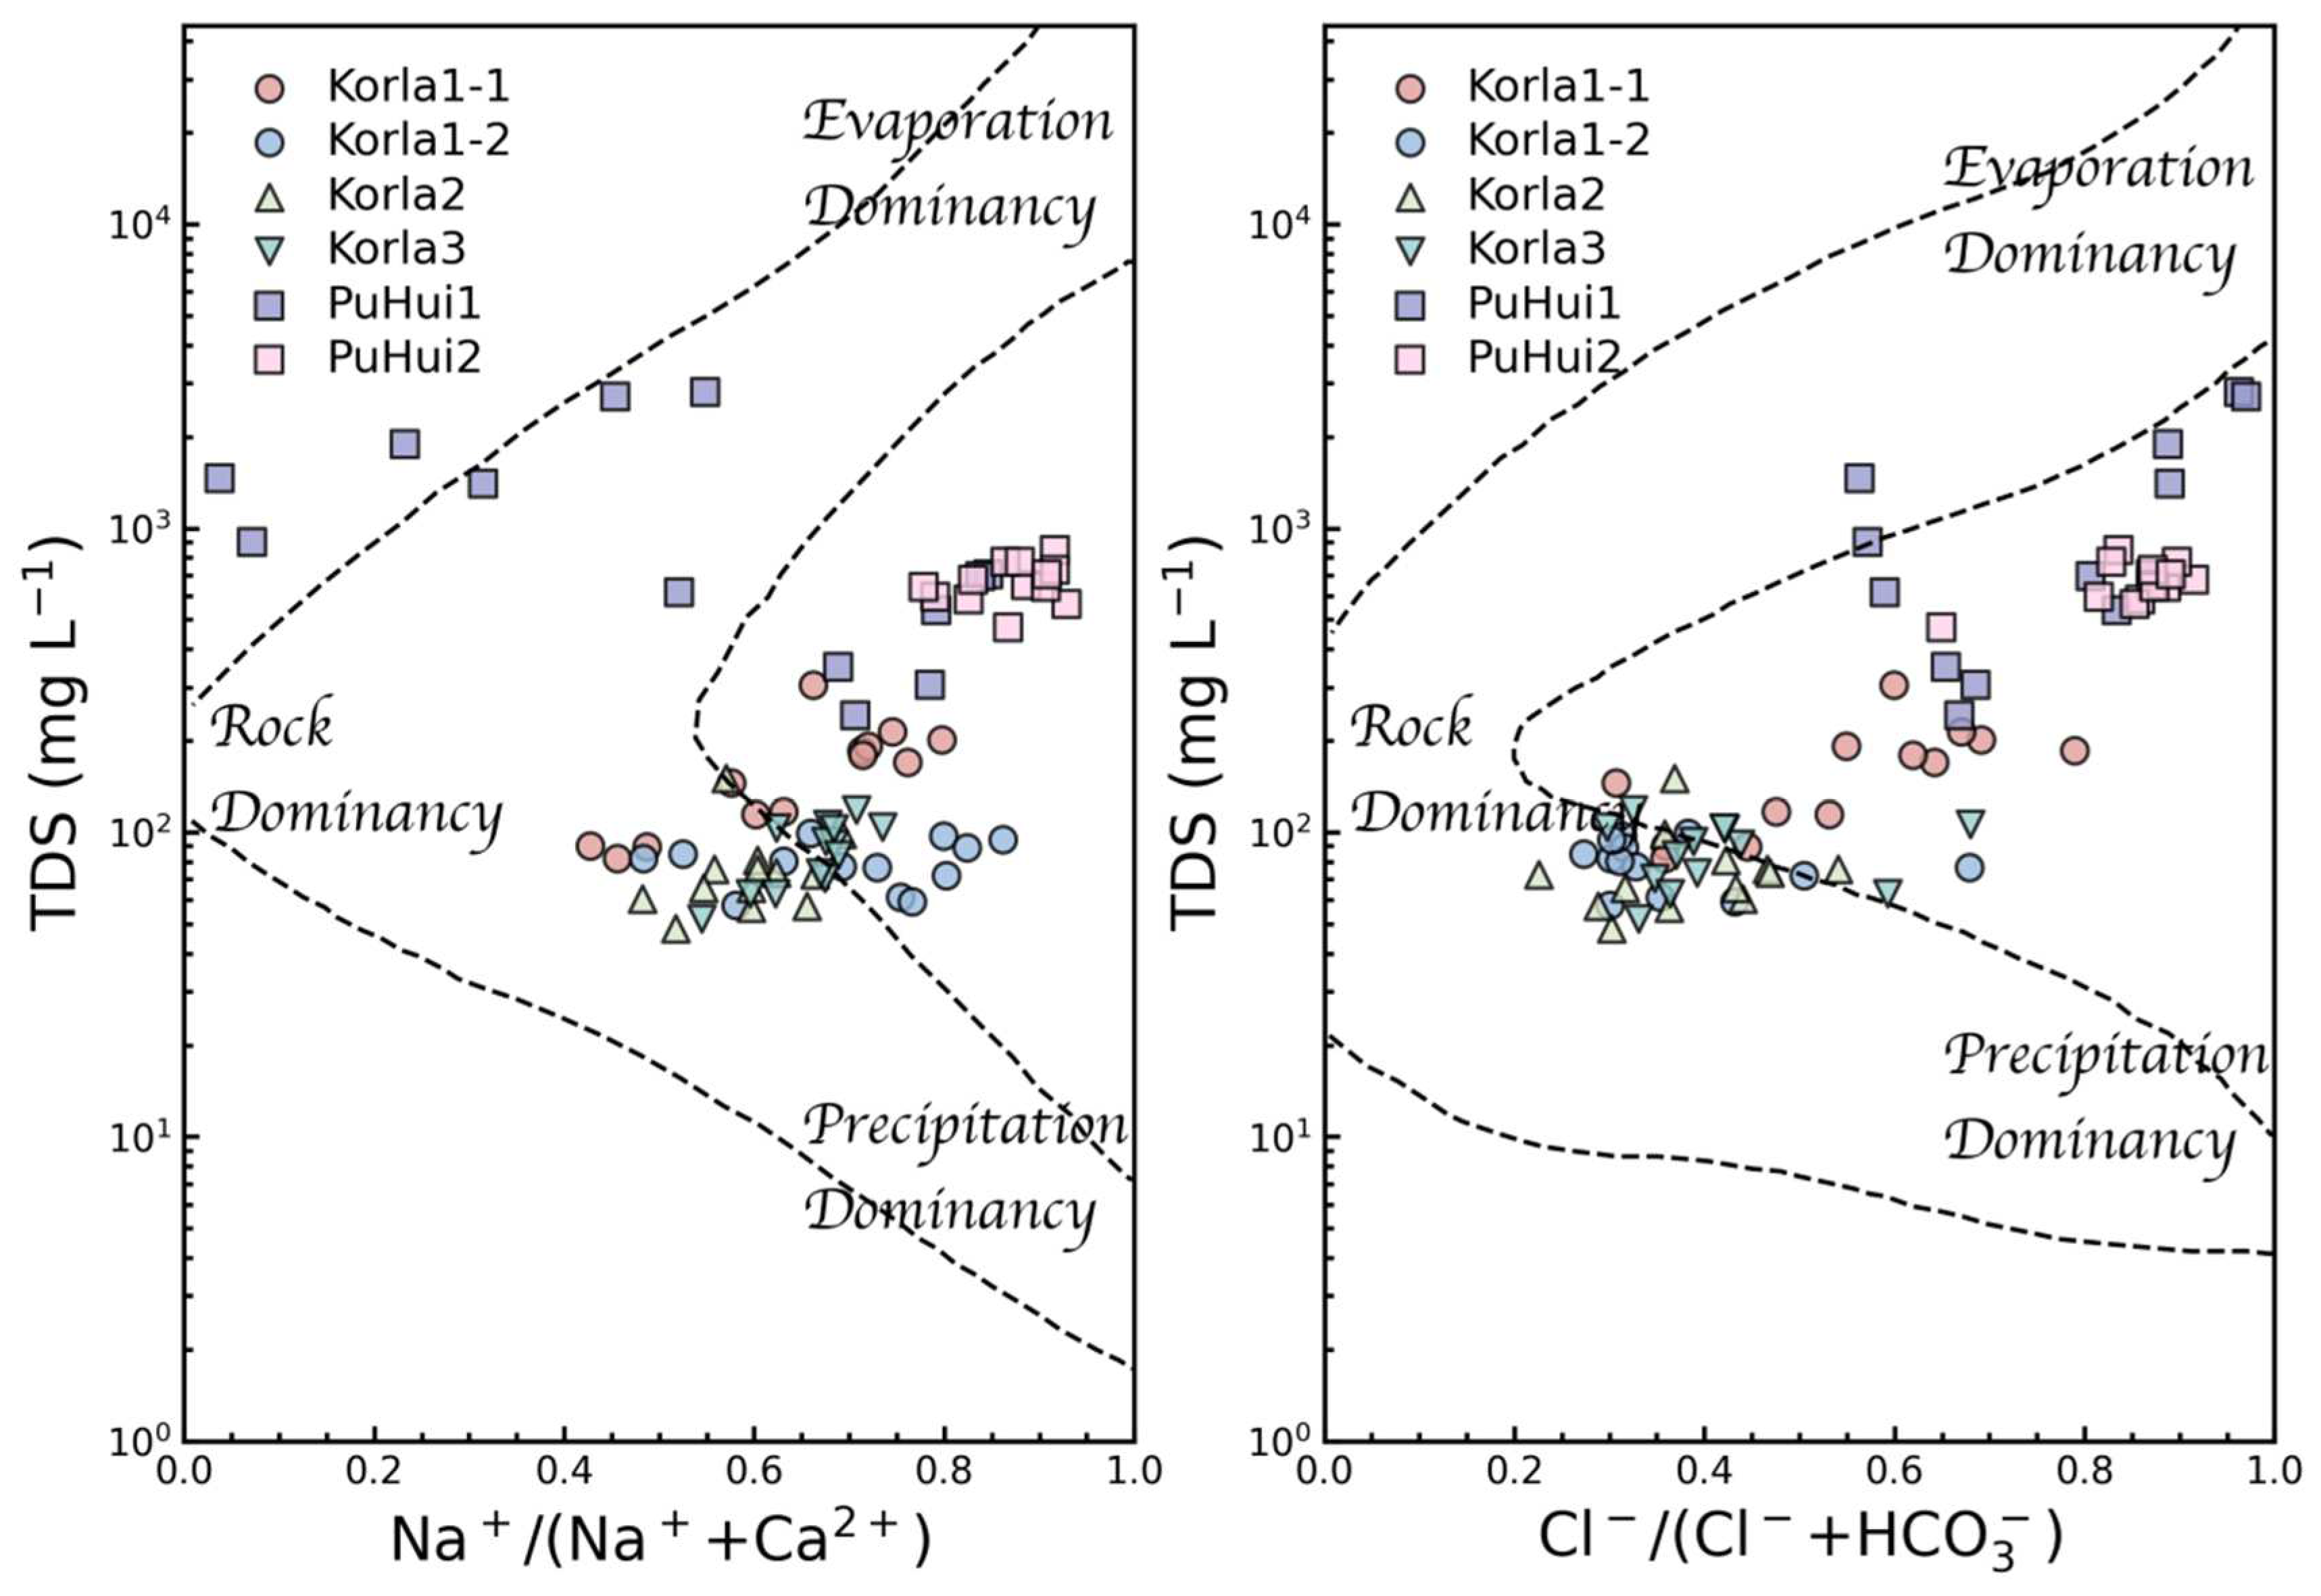
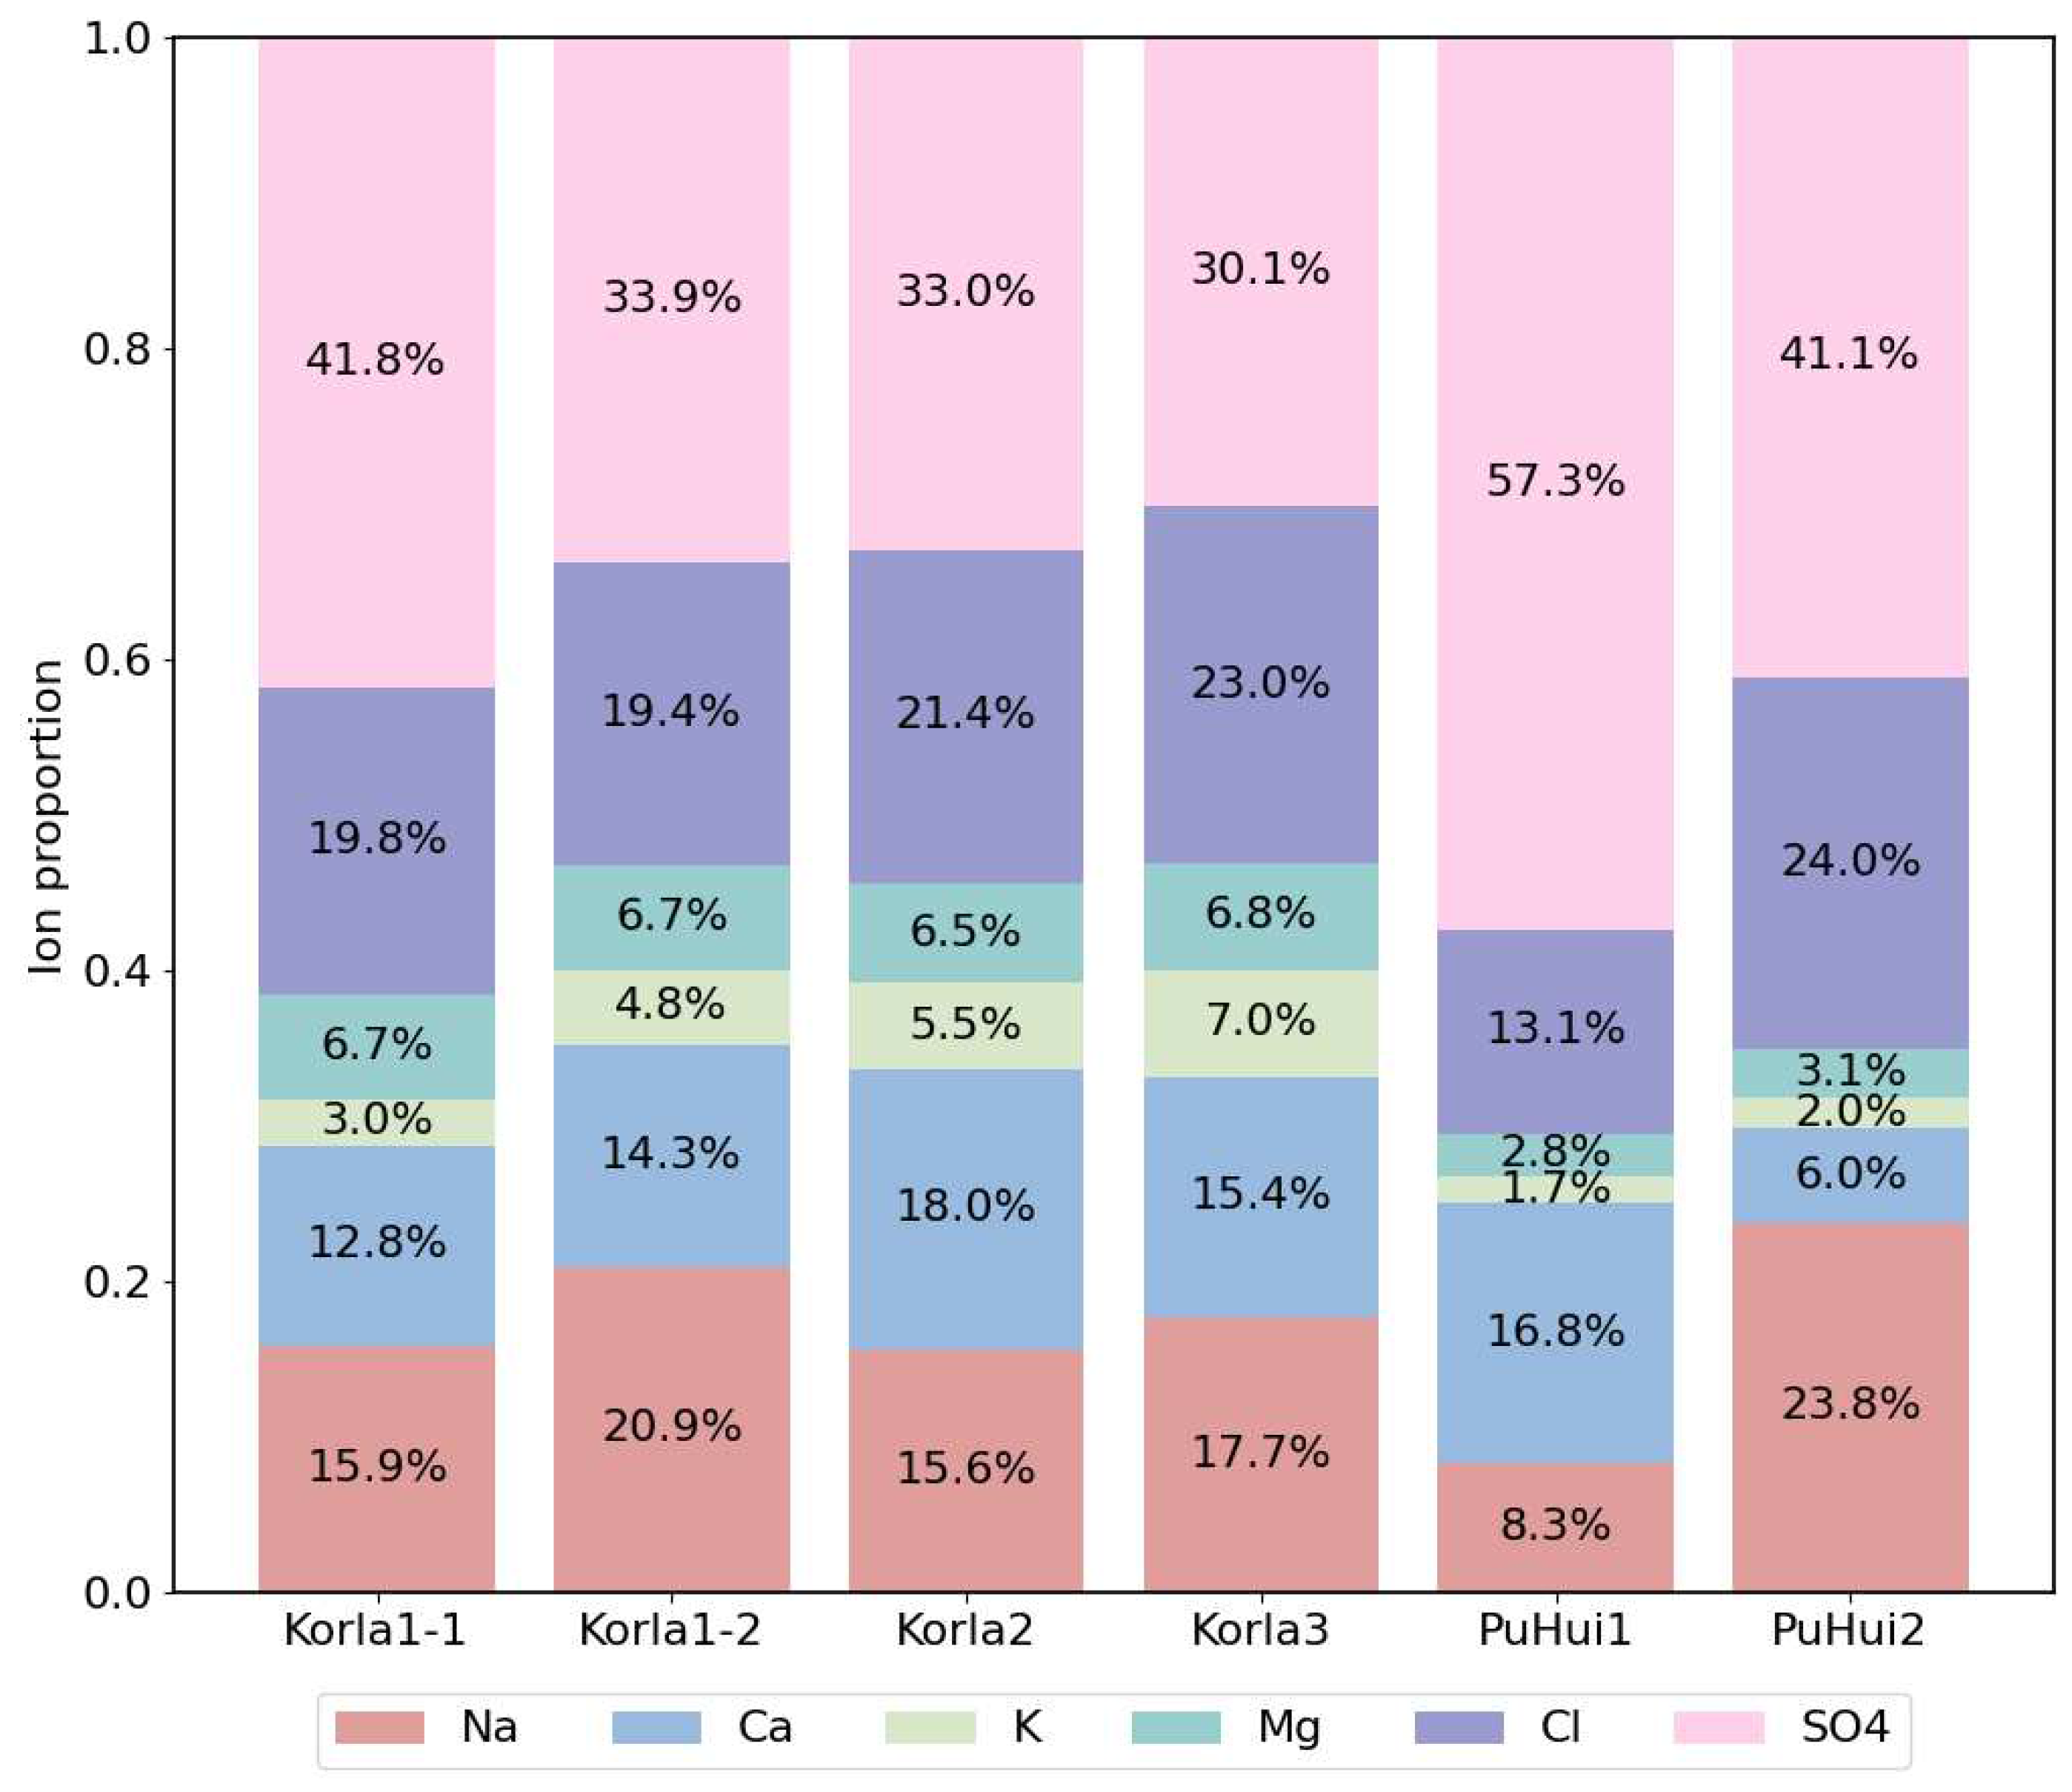
3.2. Analysis of Soil Representative Ion Composition at Different Groundwater Depths

In the PuHui area, sampling sites showed an increasing trend in SAR with depth (Figure 6). This indicates that as depth increased, the ratio of Na+ to Ca2+ and Mg2+ gradually increased. This may be the result of irrigation causing a downward movement of Na+, which is easily transported by water. The significantly higher SAR in the PuHui area compared with that in the Korla area (p < 0.05) suggests that a shallower groundwater depth may increase the SAR. Therefore, in regions with shallow groundwater, particular attention should be paid to the impact of SAR on soil structure. In contrast, the overall SAR distribution in the Korla area showed little variation with depth.
The distribution of the Cl/SO42− ratio shows a trend of increasing at shallower depths, followed by a decrease and leveling off (Figure 6). This pattern is likely related to factors such as anthropogenic irrigation, in which irrigation water leaches Cl to a certain depth, with minimal impact at greater depths. The Cl/SO42− ratio shows little variation between the Korla and PuHui areas, indicating that the groundwater depth may have a limited effect on the Cl/SO42− ratio.
In Figure 7, TDS is generally higher in PuHui1 than in PuHui2, followed by Korla1-1 and the other sampling points in the Korla area. The TDS distribution in Korla1-2, Korla2, and Korla3 were relatively concentrated, with little variation. These results imply that shallower groundwater depths increase soil salinity. After spring irrigation, the soil TDS in Korla decreased. The chemical composition of the soil at the sampling sites in the PuHui area was more influenced by evaporation and other mixed factors, whereas in the Korla area, the soil chemical composition was primarily affected by rock components. Non-evaporative effects are attributed to the deep and confined nature of groundwater [37]. In areas with shallow groundwater, the soil chemical composition is strongly influenced by evaporation. However, beyond a critical depth, the impact of phreatic evaporation on the chemical composition of the surface soil is limited [37].
In the study area, SO42− accounted for the largest proportion at all sampling sites. This was followed by Na+, Ca2+, and Cl, which accounted for considerable proportions. Meanwhile, K+ and Mg2+ occupied smaller proportions (Figure 8). The proportions of K+ and Mg2+ in the PuHui area were significantly lower than those in the Korla area. After spring irrigation, the proportion of SO42− in the PuHui area was higher than that in the Korla area. This may be related to factors such as soil-rock mineral types, groundwater depth, and human activities. In areas with greater groundwater depth, vegetation experiences water stress, leading to reduced absorption of K+ and Mg2+ and resulting in higher proportions of K+ and Mg2+ in the soil and a lower proportion of SO42− [20].

3.3. Influencing Mechanisms of Groundwater Depth on Soil Ion Distribution

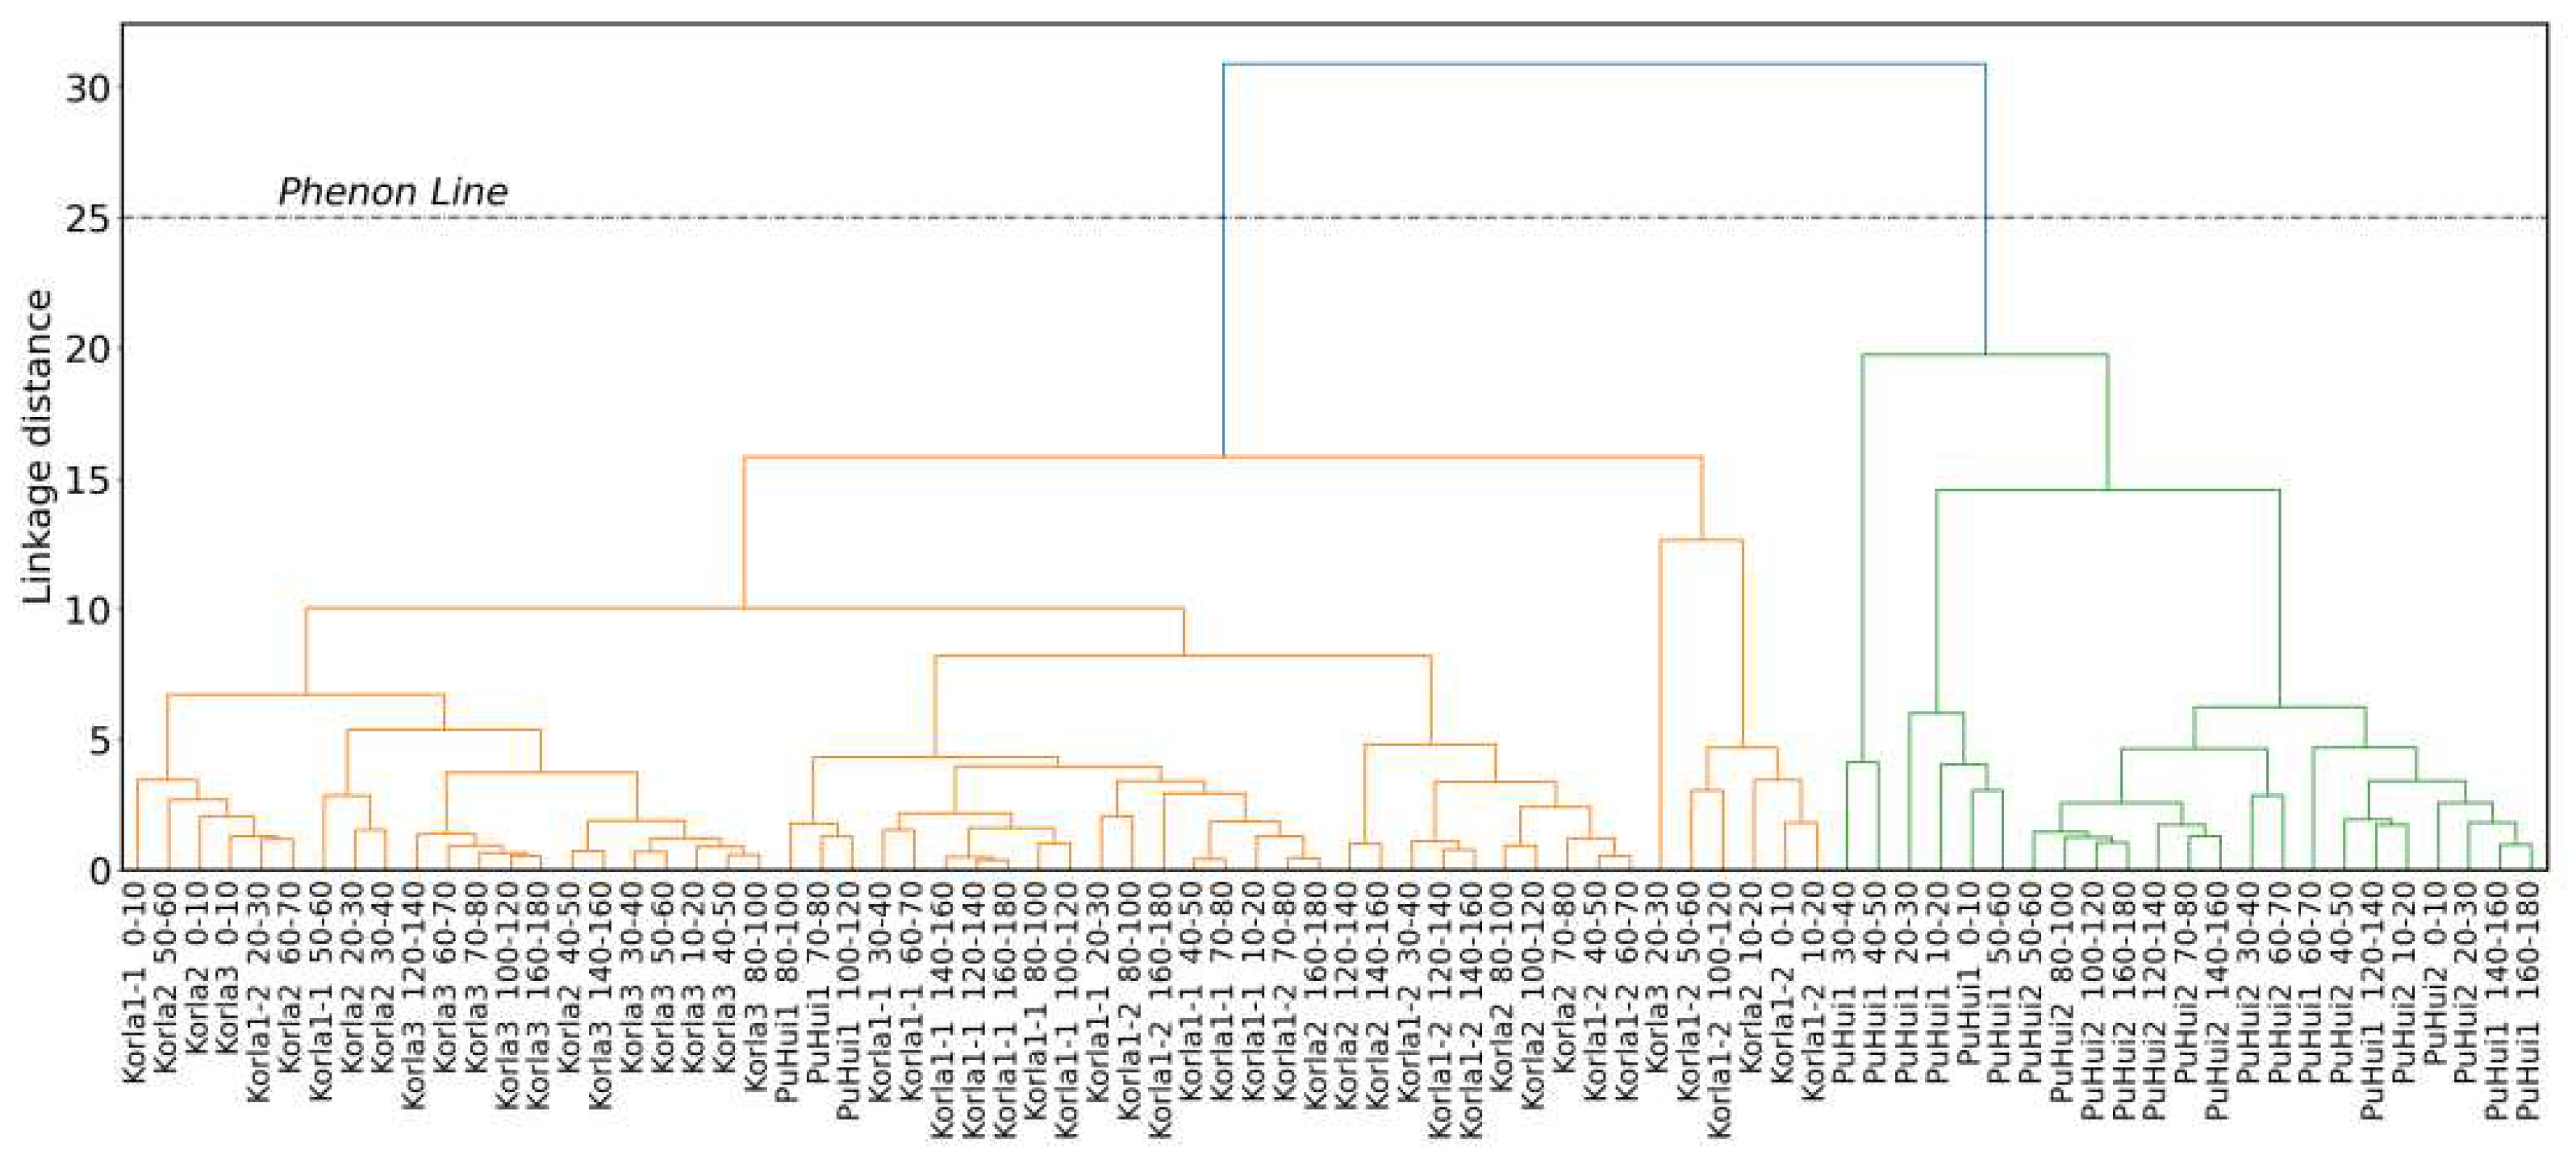
3.3.1. PCA and Difference Analysis

To identify the dominant factors driving soil salinization and assess spatial heterogeneity across regions, PCA was applied to datasets from the Korla area (Korla1-1, Korla1-2, Korla2, and Korla3), PuHui (PuHui1 and PuHui2), and all combined sites. PCA efficiently reduced multidimensional data into orthogonal principal components (PCs) while preserving critical variance. The cumulative variance explained by PC1 and PC2 reached 55.76% (Korla), 80.34% (PuHui1), 63.03% (PuHui2), and 61.43% (all sites) (Figure 9). This demonstrates PCA’s capability to retain essential data structure, particularly in PuHui1 where 80.34% variance was captured, indicating highly linear relationships among variables. In the Korla area, PC1 (39.12% variance) was dominated by Na+, TDS, and SO42−, collectively representing salinity indicators (Figure 9a, Table 3). PC2 (16.64% variance) highlighted pH, Fe, and Mn, potentially reflecting redox dynamics or trace metal behavior. Figure 9a shows a strong correlation between Na+ and Cl and Mg2+ and SO42−, which may be related to the composition of rock minerals or anthropogenic factors. TDS and EC values show a strong correlation with Na+, Cl, Mg2+, SO42−, and Ca2+, which are the main ionic sources of salinity. In PuHui1, there was a strong correlation between Ca2+ and SO42− (Figure 9b). The TDS and EC values showed a strong correlation with K+, NO3, Mg2+, SO42−, and Ca2+. In PuHui2, most feature vectors, such as TDS, EC, and SO42− contributed negatively to PC1. The TDS and EC values were strongly correlated with K+, SO42−, and Cl. In the Korla area, PuHui1, PuHui2, TDS, and EC consistently showed a high degree of correlation (Figure 9a–c). The TDS and EC values were negatively correlated with SWC in the Korla area. Owing to the limited impact of deep groundwater, this may be related to anthropogenic irrigation leaching, which maintains the soil at a higher water content while maintaining a lower salinity. In contrast, TDS and EC values in PuHui1 and PuHui2 were positively correlated with SWC, potentially because the shallower groundwater brought water and salt into the soil, with strong evaporation further enhancing soil salinity.
The distribution of samples in PC1 and PC2 helped us understand the similarities and differences among the various samples (Figure 9e). As shown in Figure 9d and Table 3, the primary contributors to PC1 across all sampling points were feature vectors, such as TDS, EC, K+, Mg2+, SO42−, and Cl. Meanwhile, PC2 was mainly influenced by Fe, Mn, and HCO3. Korla1-1 was predominantly located on the right side of Figure 9e with considerable dispersion, indicating a substantial variation in PC1 and a relatively minor variation in PC2. Korla1-2 and Korla2 exhibited significant variations in PC2, with less variation in PC1. Korla3 showed relatively small differences in PC1 and PC2. PuHui1 and PuHui2 showed substantial differences in PC1 and PC2. After spring irrigation, the differences in soil chemical characteristics decreased. Meanwhile, the chemical composition of soils with shallower groundwater depths showed greater variability, which is consistent with previous conclusions. As shown in Figure 9e, there is considerable overlap between the Korla and PuHui sampling points. This indicates that some soil sample feature vectors from the two regions exhibited similarities in their distributions on the two principal components. However, because PCA only considers the principal components and overlooks certain details, it is sensitive to noise and outliers and is less suitable for separating complex nonlinear structures. Therefore, certain bias may exist when assessing the similarity between individual soil samples. Therefore, this study used HCA to analyze the similarities among the different samples.
The results in Figure 10 indicate that below the phenon line, apart from a few PuHui area soil samples clustered with those from Korla, the soil samples from PuHui and Korla generally formed two distinct groups. This suggests that the overall values of the feature vectors in the PuHui soil samples differed substantially from those of Korla. Within the orange and green clusters, the internal similarity of soil samples from the same sampling site tended to be higher than that between samples from different sampling sites. For instance, the similarity among different soil samples within PuHui1 was generally greater than that between PuHui1 and PuHui2. The significant differences in the values of the soil sample feature vectors between different sampling sites were likely due to variations in factors such as soil type, rock mineral composition, and groundwater depth between the sampling sites.

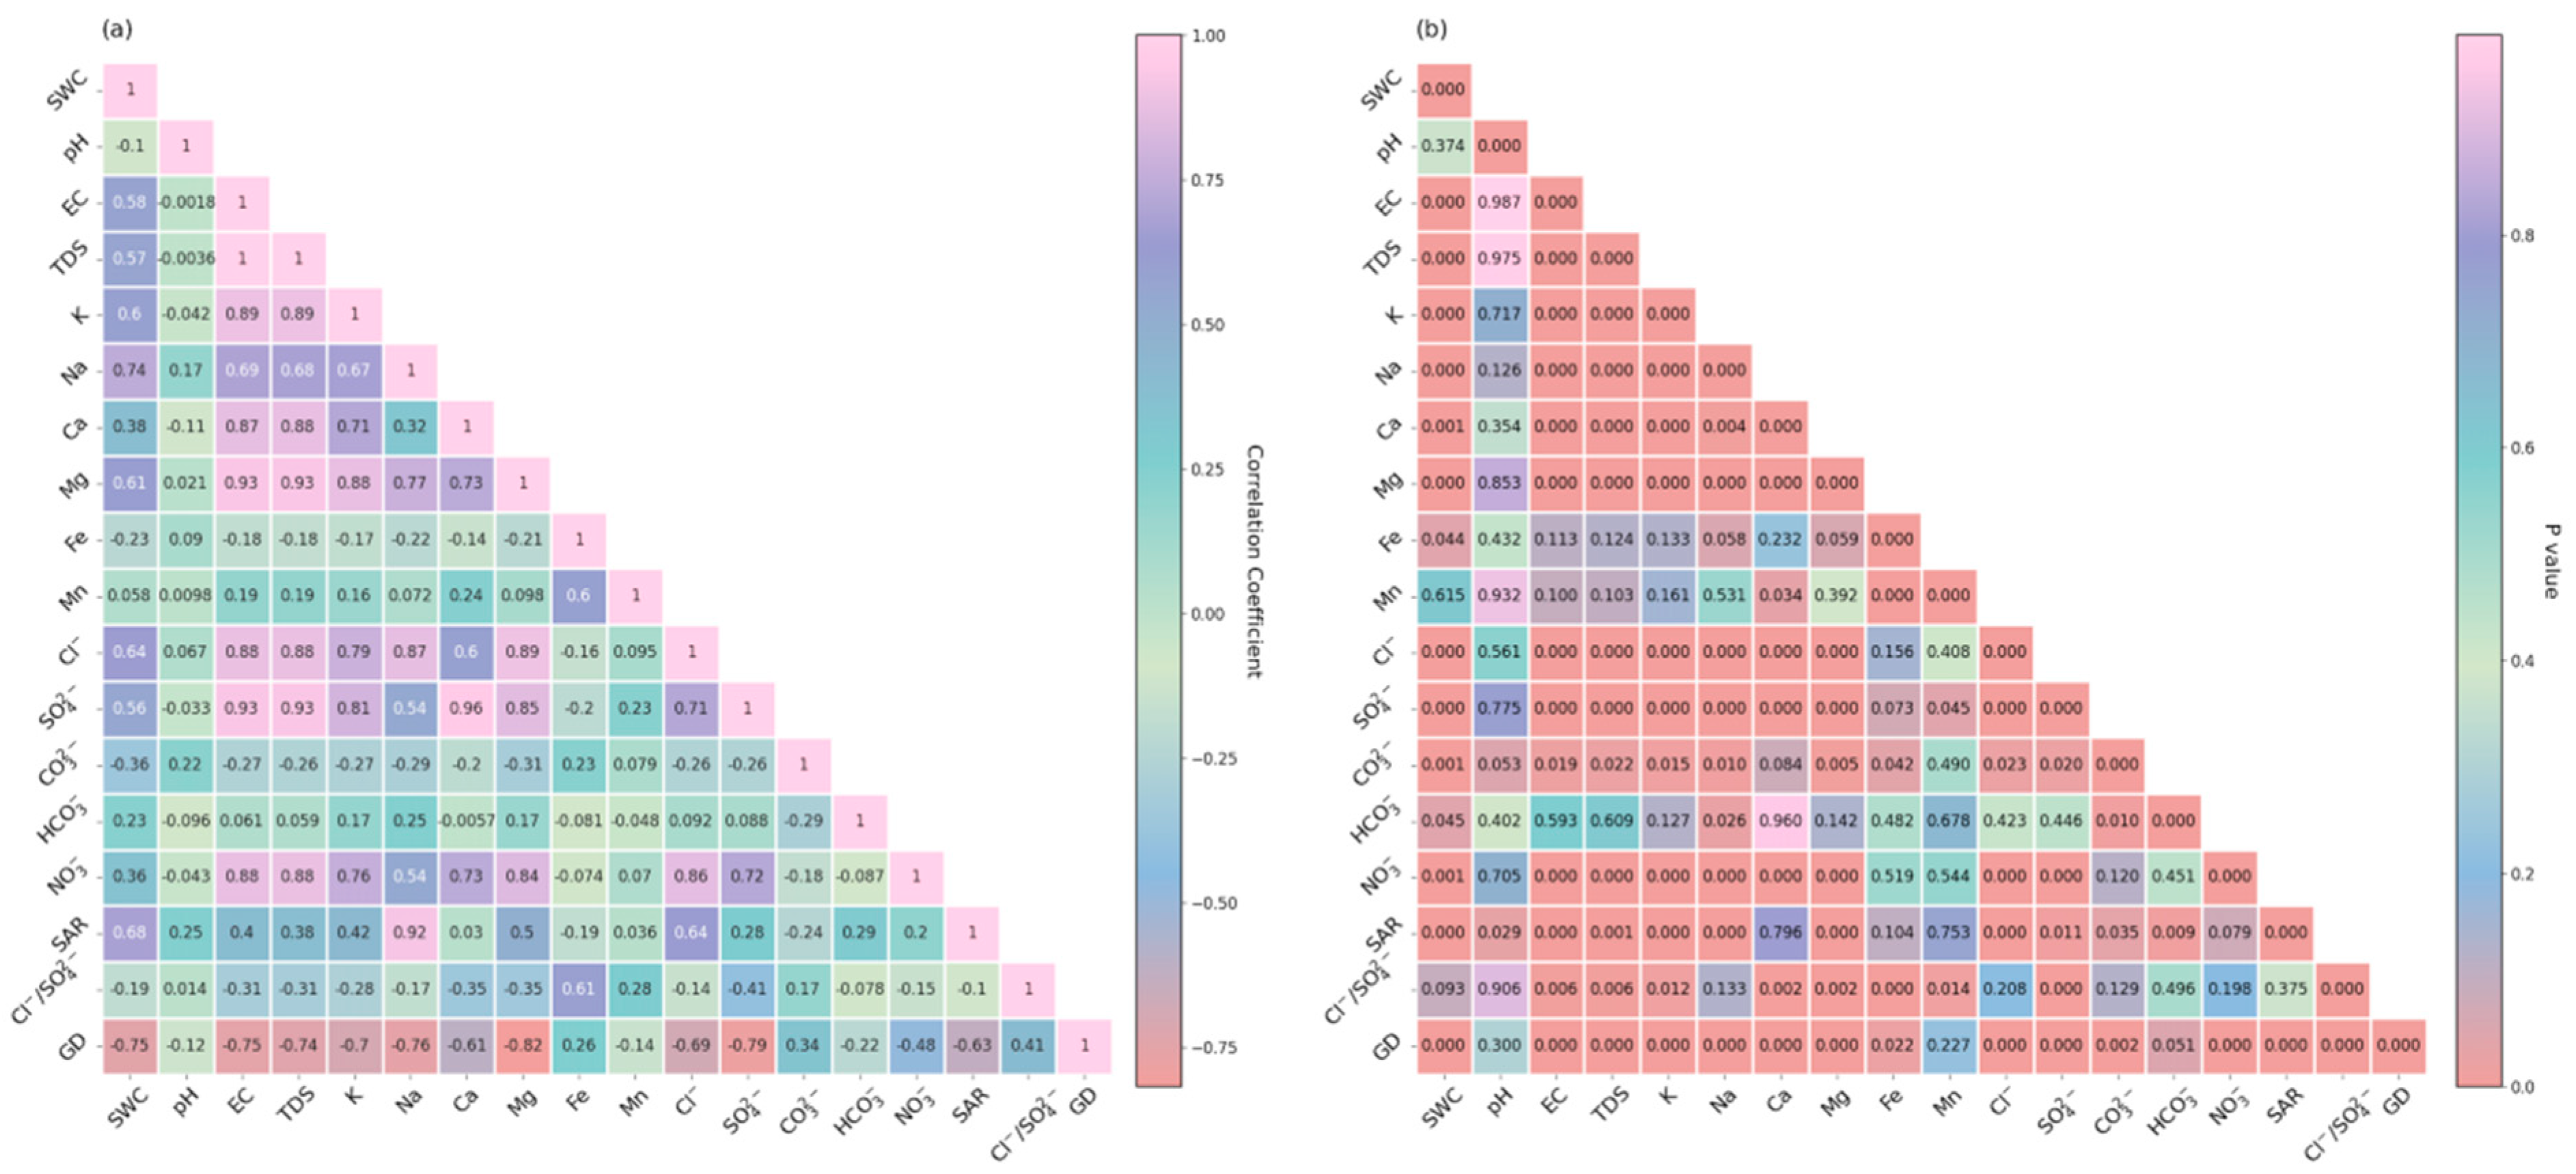
3.3.2. Correlation Analysis

To further analyze the correlations between various soil-soluble salt anions, cations, ion ratios, conductivity, and groundwater depth, a correlation heat map was used (Figure 11). The results indicated that groundwater depth in the study area was significantly negatively correlated (p < 0.05) with SWC, EC1:5, TDS, major cations (K+, Na+, Ca2+, and Mg2+), major anions (Cl, SO42−, and NO3), and SAR. Groundwater depth showed a significant positive correlation (p < 0.05) with CO32− and Cl/SO42− ratios. The correlation between groundwater depth and pH, Fe, Mn, and HCO3 is not significant (p > 0.05). The order of significant negative correlations with groundwater depth, from highest to lowest, was Mg2+ > SO42− > Na+ > SWC = EC > TDS > K+ > Cl > SAR > Ca2+ > NO3. The order of significant positive correlations with groundwater depth, from highest to lowest, was Cl/SO42− > CO32−. For non-significant correlations, the absolute value order from the highest to lowest was Fe > Mn > pH.
The major cations (K+, Na+, Ca2+, and Mg2+) and anions (Cl, SO42−, and NO3) in the study area exhibited a significant negative correlation with groundwater depth. This indicates that as groundwater depth increased, the concentrations of these ions decreased. The patterns of variation in the major soil cations and anions were similar to those observed for soil moisture and salinity. This suggests that the major soil ions and soil moisture share similar migration behaviors. Among the significantly negatively correlated variables, Mg2+ shows the strongest correlation with groundwater depth, followed by SO42−, Na+, K+, Cl, Ca2+, and, finally, NO3. This ranking suggests differences in the mechanisms of ion migration and distribution in the soil. These are potentially influenced by factors such as soil type, pH, and organic matter content [38]. Conversely, the concentration of CO32− in the soil tends to increase with greater groundwater depth, potentially because of prolonged interactions between deep groundwater and carbonate minerals, along with favorable chemical conditions that promote the dissolution of carbonate minerals and the release of CO32− [39]. The lack of a significant correlation between groundwater depth and Fe, Mn, and HCO3 may indicate that the behavior of these ions in the soil is more influenced by other environmental factors, such as redox conditions and microbial activity [26], rather than being directly controlled by groundwater.

4. Discussion

4.1. Research Framework on the Relationship Between Groundwater Depth and Soil Ion Distribution

To study the relationship between the groundwater depth and soil ion distribution, it is essential to first examine the relationship between the groundwater depth and soil moisture. Soil moisture is a critical link between surface water and groundwater, maintaining the balance between energy and the transport of substances within the soil. In this study, a significant negative correlation was observed between the SWC and groundwater depth. This is primarily because deep groundwater cannot effectively replenish the water lost through soil evaporation and vegetation transpiration. This makes the soil moisture more dependent on irrigation and leaves the soil more susceptible to drought. In contrast, when the groundwater is shallow, it can rapidly respond to irrigation events by replenishing soil moisture from below, thereby maintaining higher soil humidity [8].
The relationship between groundwater depth and soil salinity was examined. Soil salinity is a crucial indicator of soil quality because the content and types of soluble salts in the soil strongly influence its physical and chemical properties, and vegetation growth and development [17]. Our findings showed a significant negative correlation between soil salinity and groundwater depth. This is because shallow groundwater often contains higher concentrations of dissolved salts, which, when rising to the soil surface and evaporating, leave behind salts, leading to soil salinization. In contrast, when the groundwater is deeper, salt accumulation is limited because of a lack of sufficient salt sources in the soil [40]. The slower recharge rate of deep groundwater reduces salt migration to the soil surface.
Third, the relationship between groundwater depth and soil ion content, and representative ion ratios and compositions, were studied to better understand soil fertility, pH balance, salinization, soil structure, and ion sources [19]. By analyzing these ratios and compositions, we can gain insights into the soil fertility status, chemical properties, and their impact on vegetation growth and environmental quality. This information is crucial for guiding scientific fertilization, soil improvement, and environmental remediation efforts to achieve sustainable land use and environmental protection. Different ion compositions can affect soil aggregate structure. High concentrations of Ca2+, Mg2+, and Al3+ in the soil promote the formation of soil aggregates and increase soil hydraulic conductivity. Meanwhile, high Na+ concentrations typically impair aggregate formation [34]. In this study, a significant negative correlation exists between groundwater depth and SAR. Meanwhile, a significant positive correlation was observed between the Cl/SO42− ratio. When the groundwater is shallow, higher soil moisture content facilitates the migration and accumulation of sodium ions, leading to increased SAR values. Strong soil evaporation causes salts to accumulate on the surface, further increasing SAR values, and leading to soil structure degradation and increased salinization [41]. Conversely, as the groundwater depth increased, the SAR values decreased, helping to maintain soil structural stability and reducing the risk of salinization.

4.2. Influencing Factors of Soil Ion Distribution Dynamics

In addition to the primary focus on groundwater depth in this study, factors such as rock and mineral types, vegetation cover, and human activities play critical roles in influencing soil moisture–salinity dynamics and soil ion ratios and compositions [42,43]. The interactions among these factors can further alter soil ion distribution, which highlights the importance of more comprehensive studies. In this study, the correlation between the Cl/SO42− ratio and groundwater depth was not as significant as that of the SAR. This was potentially because of the influence of other factors or the combined effects of various factors, including rock and mineral types at the sampling sites and human activities.
Rock and mineral types are key factors influencing the subsequent dynamics of soil ions. Variations in soil type and historical background can lead to differences in rock and mineral compositions. Lin et al. [42] investigated the effects of different drip irrigation system lengths and amounts on the spatial distribution of soil moisture and salinity. They effectively identified the primary factors affecting soil moisture and salinity distribution using random forest techniques, highlighting the critical roles of the irrigation amount and rock and mineral types in shaping soil moisture and salinity patterns.
Vegetation cover considerably influences the soil ion distribution. Different plants have varying root depths and absorption capacities, which affect the distribution of ions in soil [44]. Deep-rooted plants can extract nutrients from deeper soil layers, whereas shallow-rooted plants primarily rely on the surface soil. In the arid regions of Northwest China, Populus euphratica at different growth stages exhibit varying optimal ecological water levels. Compared to young Populus euphratica, mature trees have a more developed root system, enabling them to access deeper water and nutrients [45]. Vegetation type influences surface runoff and evapotranspiration, thereby affecting the dynamic balance between soil moisture and salinity [46]. In this study, the sampling sites were primarily planted with newly sprouted cotton. Therefore, the impact of vegetation on ion distribution in the soil profile is limited.
Human activities such as agricultural irrigation, fertilization, drainage, and land use change directly impact soil ion distribution [47]. Salts in irrigation water can substantially alter soil salinity and ion composition, especially in arid and semiarid regions. Excessive irrigation can lead to soil salinization, whereas appropriate irrigation strategies can help control soil salt accumulation. Currently, in Northwest China, many previous extensive flood irrigation practices have been replaced by water-saving drip irrigation. On the one hand, this approach conserves agricultural water, while on the other, it effectively prevents salt accumulation. Fertilization and pesticide use introduce additional ions that alter the chemical properties of the soil. At the Korla1 sampling site, the TDS value decreased after spring irrigation, with varying degrees of change in ion composition and proportions. All the sampling sites exhibited salt-leaching characteristics.
Long-term monitoring data and model predictions can help assess the long-term impacts of different management practices on soil water and salt conditions [24], thereby providing a scientific basis for water resource management and agricultural policies.

5. Conclusions

In this study, soil samples from the 0–180 cm profiles were collected across five sections at three different groundwater depths. Using a space-for-time substitution approach within the research framework exploring the relationship between groundwater depth and soil ion distribution, this study revealed the dynamic characteristics, correlations, and underlying mechanisms of soil moisture, salinity, ion distribution, and the composition of representative ions under conditions of increasing groundwater depth in arid agricultural irrigation areas of Northwest China.
(1) Changes in Soil Chemical Type: As the groundwater depth increased, the soil chemical type transitioned from Ca-SO4 type (PuHui1) to Na-SO4 type (PuHui2) and to a mixed type of Ca-Mg-SO4-Cl and Na-K-CO3-HCO3 in the Korla area. Across the soil profiles in the study area, SO42− consistently had the highest proportion among soil ions, followed by Na+, Ca2+, Cl, K+, and Mg2+.
(2) Soil Moisture and Salinity Patterns: The soil moisture, salinity content, SAR, and TDS in areas with shallow groundwater were significantly higher than those in areas with deep groundwater. In all the soil samples from the study area, PC1 was mainly contributed by the feature vectors TDS, EC, K+, Mg2+, SO42−, and Cl. Meanwhile, PC2 was primarily contributed by Fe, Mn, and HCO3. Some soil samples from both the deep and shallow groundwater areas had similarities in the distribution of feature vectors across the two principal components. However, the hierarchical clustering results indicated significant overall differences in the feature vector values of the soil samples between deep and shallow groundwater areas.
(3) Correlations Between Groundwater Depth and Soil Properties: Groundwater depth was negatively correlated with soil moisture, salinity, and major cations and anions (K+, Na+, Ca2+, Mg2+, Cl, SO42−, and NO3). A positive correlation exists between the groundwater depth and CO32−. The correlation between groundwater depth and pH, Fe, Mn, and HCO3 is not significant.
(4) Influencing Factors Beyond Groundwater Depth: In addition to groundwater depth, factors such as rock and mineral types, vegetation cover, and human activities play important roles in influencing soil moisture dynamics, ion distribution, and composition. In areas with shallow groundwater, the ion distribution is affected more by evaporation and other mixed factors. Meanwhile, in areas with deep groundwater, the ion distribution is primarily influenced by the composition of rocks and minerals.
This study confirms that groundwater depth significantly influences soil moisture, salinity, and ion distribution, serving as a primary regulatory factor in soil chemical processes. The results highlight the complexity of soil ion migration mechanisms in arid agricultural irrigation areas. Future research should further explore the dynamics of ion migration within the soil–water system, the role of soil structure, and microbial interactions to provide deeper insights into soil management, water resource conservation, and sustainable ecosystem management.

Author Contributions

Conceptualization, Y.H.; Data curation, Y.H., B.P., R.D., Y.L. and Y.Z.; Funding acquisition, Y.H.; Investigation, Y.H., B.P., R.D., Y.L. and Y.Z.; Methodology, Y.H. and B.P.; Project administration, Y.H.; Resources, Y.H., B.P., R.D., Y.L. and Y.Z.; Validation, Y.H., B.P., R.D., Y.L. and Y.Z.; Visualization, Y.H. and B.P.; Writing original draft, Y.H. and B.P.; Writing—review & editing, Y.H. All authors have read and agreed to the published version of the manuscript.

Funding

This work was supported by the National Natural Science Foundation of China (42272306, 41877201).

Institutional Review Board Statement

Not applicable.

Data Availability Statement

The data presented in this study are available on request from the corresponding author.

Acknowledgments

We would like to thank the editor and the anonymous reviewers for their detailed and constructive comments.

Conflicts of Interest

The authors declare that they have no known competing financial interests or personal relationships that could have appeared to influence the work reported in this paper.

References

  1. Wang, Z.; Wang, W.; Zhang, Z.; Hou, X.; Duan, L.; Yao, D. Assessment of the Effect of Water-Table Depth on Riparian Vegetation along the Middle and Lower Reaches of the Manasi River, Northwest China. Hydrogeol. J. 2021, 29, 579–589. [Google Scholar] [CrossRef]
  2. Jie, F.; Fei, L.; Li, S.; Hao, K.; Liu, L.; Li, J.; Liu, N. Quantitative Effects of Vadose Zone Thickness on Delayed Recharge of Groundwater for an Irrigation District in an Arid Area of Northwest China. J. Hydrol. Reg. Stud. 2022, 40, 101022. [Google Scholar] [CrossRef]
  3. Chen, X.; Hu, Q. Groundwater Influences on Soil Moisture and Surface Evaporation. J. Hydrol. 2004, 297, 285–300. [Google Scholar] [CrossRef]
  4. Irfan, M.; Safrina, S.; Koriyanti, E.; Kurniawati, N.; Saleh, K.; Iskandar, I. Effects of Climate Anomaly on Rainfall, Groundwater Depth, and Soil Moisture on Peatlands in South Sumatra, Indonesia. J. Groundw. Sci. Eng. 2023, 11, 81–88. [Google Scholar] [CrossRef]
  5. Zhao, S.; Zhao, X.; Zuo, X.; Chen, X.; Li, C.; Fang, H.; Li, W.; Wei, D. Impact of Deeper Groundwater Depth on Vegetation and Soil in Semi-Arid Region of Eastern China. Front. Plant Sci. 2023, 14, 1186406. [Google Scholar] [CrossRef]
  6. Wu, J.; Yao, J.; Zhang, Y.; Wang, Z. Remote Sensing Application Study on the Soil Salinity and the Medium & Low Yield Croplands in Yinchuan Plain. J. Remote Sens. 2007, 3, 414–419. [Google Scholar]
  7. Martínez-de la Torre, A.; Miguez-Macho, G. Groundwater Influence on Soil Moisture Memory and Land–Atmosphere Fluxes in the Iberian Peninsula. Hydrol. Earth Syst. Sci. 2019, 23, 4909–4932. [Google Scholar] [CrossRef]
  8. Chen, S.; Mao, X.; Shang, S. Response and Contribution of Shallow Groundwater to Soil Water/Salt Budget and Crop Growth in Layered Soils. Agric. Water Manag. 2022, 266, 107574. [Google Scholar] [CrossRef]
  9. Han, M.; Zhao, C.; Šimůnek, J.; Feng, G. Evaluating the Impact of Groundwater on Cotton Growth and Root Zone Water Balance Using Hydrus-1D Coupled with a Crop Growth Model. Agric. Water Manag. 2015, 160, 64–75. [Google Scholar] [CrossRef]
  10. Zhang, X.; Shu, C.; Wu, Y.; Ye, P.; Du, D. Advances of Coupled Water-Heat-Salt Theory and Test Techniques for Soils in Cold and Arid Regions: A Review. Geoderma 2023, 432, 116378. [Google Scholar] [CrossRef]
  11. Borch, T.; Kretzschmar, R.; Kappler, A.; Cappellen, P.V.; Ginder-Vogel, M.; Voegelin, A.; Campbell, K. Biogeochemical Redox Processes and Their Impact on Contaminant Dynamics. Environ. Sci. Technol. 2010, 44, 15–23. [Google Scholar] [CrossRef] [PubMed]
  12. Zhang, Z.; Furman, A. Soil Redox Dynamics under Dynamic Hydrologic Regimes—A Review. Sci. Total Environ. 2021, 763, 143026. [Google Scholar] [CrossRef] [PubMed]
  13. Nick, S.M.; Copty, N.K.; Saygın, S.D.; Öztürk, H.S.; Demirel, B.; Mehdi Emadian, S.; Erpul, G.; Sedighi, M.; Babaei, M. Impact of Soil Compaction and Irrigation Practices on Salt Dynamics in the Presence of a Saline Shallow Groundwater: An Experimental and Modelling Study. Hydrol. Process. 2024, 38, e15135. [Google Scholar] [CrossRef]
  14. Rengasamy, P.; Chittleborough, D.; Helyar, K. Root-Zone Constraints and Plant-Based Solutions for Dryland Salinity. Plant Soil 2003, 257, 249–260. [Google Scholar] [CrossRef]
  15. Wang, D.; Yu, Z.; Peng, G.; Zhao, C.; Ding, J.; Zhang, X. Water Use Strategies of Populus Euphratica Seedlings under Groundwater Fluctuation in the Tarim River Basin of Central Asia. Catena 2018, 166, 89–97. [Google Scholar] [CrossRef]
  16. Paz, A.M.; Amezketa, E.; Canfora, L.; Castanheira, N.; Falsone, G.; Gonçalves, M.C.; Gould, I.; Hristov, B.; Mastrorilli, M.; Ramos, T.; et al. Salt-Affected Soils: Field-Scale Strategies for Prevention, Mitigation, and Adaptation to Salt Accumulation. Ital. J. Agron. 2023, 18, 2166. [Google Scholar] [CrossRef]
  17. Li, X.; Xia, J.; Zhao, X.; Chen, Y. Effects of Planting Tamarix Chinensis on Shallow Soil Water and Salt Content under Different Groundwater Depths in the Yellow River Delta. Geoderma 2019, 335, 104–111. [Google Scholar] [CrossRef]
  18. Zhang, M.; Zhou, S.; Liu, D.; Zhang, Y.; Zhang, Y.; Chen, X.; Wang, H.; Li, B.; Kang, W.; Yi, B.; et al. Characteristics and Genesis of Groundwater Salinization in Coastal Areas of the Lower Reaches of Oujiang Basin. J. Groundw. Sci. Eng. 2024, 12, 190–204. [Google Scholar] [CrossRef]
  19. Pessoa, L.; Freire, M.B.G.d.S.; Green, C.H.M.; Miranda, M.F.A.; Filho, J.C.d.A.; Pessoa, W.R.L.S. Assessment of Soil Salinity Status under Different Land-Use Conditions in the Semiarid Region of Northeastern Brazil. Ecol. Indic. 2022, 141, 109139. [Google Scholar] [CrossRef]
  20. Makonko, M.P. Hydrochemical Assessment of Groundwater Quality and Its Suitability for Irrigation and Domestic Purposes in Breede Water Management Area, Western Cape. Master’s Thesis, Cape Peninsula University of Technology, Cape Town, South Africa, 2023. [Google Scholar]
  21. Mora, J.L.; Herrero, J.; Weindorf, D.C. Multivariate Analysis of Soil Salination-Desalination in a Semi-Arid Irrigated District of Spain. Geoderma 2017, 291, 1–10. [Google Scholar] [CrossRef]
  22. Brogueira, M.; Cabecadas, G. Identification of Similar Environmental Areas in Tagus Estuary by Using Multivariate Analysis. Ecol. Indic. 2006, 6, 508–515. [Google Scholar] [CrossRef]
  23. Wang, Z.; Jin, M.; Šimůnek, J.; van Genuchten, M.T. Evaluation of Mulched Drip Irrigation for Cotton in Arid Northwest China. Irrig. Sci. 2013, 32, 15–27. [Google Scholar] [CrossRef]
  24. He, Y.; Wang, Y.; Liu, Y.; Peng, B.; Wang, G. Focus on the Nonlinear Infiltration Process in Deep Vadose Zone. Earth-Sci. Rev. 2024, 252, 104719. [Google Scholar] [CrossRef]
  25. Trivedi, P.; Delgado-Baquerizo, M.; Anderson, I.C.; Singh, B.K. Response of Soil Properties and Microbial Communities to Agriculture: Implications for Primary Productivity and Soil Health Indicators. Front. Plant Sci. 2016, 7, 990. [Google Scholar] [CrossRef]
  26. Colombo, C.; Palumbo, G.; He, J.-Z.; Pinton, R.; Cesco, S. Review on Iron Availability in Soil: Interaction of Fe Minerals, Plants, and Microbes. J. Soils Sediments 2013, 14, 538–548. [Google Scholar] [CrossRef]
  27. Han, D.; Song, X.; Currell, M.; Cao, G.; Zhang, Y.; Kang, Y. A Survey of Groundwater Levels and Hydrogeochemistry in Irrigated Fields in the Karamay Agricultural Development Area, Northwest China: Implications for Soil and Groundwater Salinity Resulting from Surface Water Transfer for Irrigation. J. Hydrol. 2011, 405, 217–234. [Google Scholar] [CrossRef]
  28. Jalali, M. Effect of Sodium and Magnesium on Kinetics of Potassium Release in Some Calcareous Soils of Western Iran. Geoderma 2008, 145, 207–215. [Google Scholar] [CrossRef]
  29. Lilliefors, H.W. On the Kolmogorov-Smirnov Test for Normality with Mean and Variance Unknown. J. Am. Stat. Assoc. 1967, 62, 399–402. [Google Scholar] [CrossRef]
  30. Li, C.; Lei, J.; Zhao, Y.; Xu, X.; Li, S. Effect of Saline Water Irrigation on Soil Development and Plant Growth in the Taklimakan Desert Highway Shelterbelt. Soil Tillage Res. 2015, 146, 99–107. [Google Scholar] [CrossRef]
  31. Zhang, X.; Li, Y.; Li, F. Spatial Distribution Characteristics of Soil Water-Salt Gradients in the Ecological Buffer Zone of Arid Zone Lakes and Their Influencing Factors. J. Clean. Prod. 2024, 444, 141299. [Google Scholar] [CrossRef]
  32. Wang, J.; Yuan, J.; Hou, Q.; Yang, Z.; You, Y.; Yu, T.; Ji, J.; Dou, L.; Ha, X.; Sheng, W.; et al. Distribution of Potentially Toxic Elements in Soils and Sediments in Pearl River Delta, China: Natural versus Anthropogenic Source Discrimination. Sci. Total Environ. 2023, 903, 166573. [Google Scholar] [CrossRef] [PubMed]
  33. Huang, F.; Zhang, D.; Chen, X. Vegetation Response to Groundwater Variation in Arid Environments: Visualization of Research Evolution, Synthesis of Response Types, and Estimation of Groundwater Threshold. Int. J. Environ. Res. Public Health 2019, 16, 1849. [Google Scholar] [CrossRef] [PubMed]
  34. Zhu, W.; Zhao, D.; Yang, F.; Wang, Z.; Dong, S.; An, F.; Ma, H.; Zhang, L.; Tibor, T. Effects of Groundwater with Various Salinities on Evaporation and Redistribution of Water and Salt in Saline-Sodic Soils in Songnen Plain, Northeast China. Chin. Geogr. Sci. 2023, 33, 1141–1152. [Google Scholar] [CrossRef]
  35. Wang, T.; Wu, Z.; Wang, P.; Wu, T.; Zhang, Y.; Yin, J.; Yu, J.; Wang, H.; Guan, X.; Xu, H.; et al. Plant-Groundwater Interactions in Drylands: A Review of Current Research and Future Perspectives. Agric. For. Meteorol. 2023, 341, 109636. [Google Scholar] [CrossRef]
  36. Kang, Y.; Wang, R.; Wan, S.; Hu, W.; Jiang, S.; Liu, S. Effects of Different Water Levels on Cotton Growth and Water Use through Drip Irrigation in an Arid Region with Saline Ground Water of Northwest China. Agric. Water Manag. 2012, 109, 117–126. [Google Scholar] [CrossRef]
  37. Yang, H.; Xiao, Y.; Hao, Q.; Wang, L.; Zhang, Y.; Liu, K.; Zhu, Y.; Liu, G.; Yin, S.; Xie, Z. Geochemical Characteristics, Mechanisms and Suitability for Sustainable Municipal and Agricultural Water Supply of Confined Groundwater in Central North China Plain. Urban Clim. 2023, 49, 101459. [Google Scholar] [CrossRef]
  38. Wu, B.; Wan, Q.; Li, X.; Lin, S.; Jiang, Y.; Yang, X.; Li, J.; Lin, Q.; Morel, J.L.; Qiu, R. Heavy Metal Migration Dynamics and Solid-Liquid Distribution Strategy in Abandoned Tailing Soils. J. Hazard. Mater. 2024, 468, 133794. [Google Scholar] [CrossRef]
  39. Dong, S.; Li, L.; Shi, X.; Ma, M.; Liu, F.; Lei, J. Inorganic Carbon Migration and Transformation in Groundwater Evaporation Discharge Area. Sci. Total Environ. 2024, 949, 174994. [Google Scholar] [CrossRef]
  40. Yin, X.; Feng, Q.; Li, Y.; Deo, R.C.; Liu, W.; Zhu, M.; Zheng, X.; Liu, R. An Interplay of Soil Salinization and Groundwater Degradation Threatening Coexistence of Oasis-Desert Ecosystems. Sci. Total Environ. 2022, 806, 150599. [Google Scholar] [CrossRef]
  41. Bouselsal, B.; Saibi, H. Evaluation of Groundwater Quality and Hydrochemical Characteristics in the Shallow Aquifer of El-Oued Region (Algerian Sahara). Groundw. Sustain. Dev. 2022, 17, 100747. [Google Scholar] [CrossRef]
  42. Lin, X.; Wang, Z.; Li, J. Identifying the Factors Dominating the Spatial Distribution of Water and Salt in Soil and Cotton Yield under Arid Environments of Drip Irrigation with Different Lateral Lengths. Agric. Water Manag. 2021, 250, 106834. [Google Scholar] [CrossRef]
  43. Wang, H.; Zheng, C.; Ning, S.; Cao, C.; Li, K.; Dang, H.; Wu, Y.; Zhang, J. Impacts of Long-Term Saline Water Irrigation on Soil Properties and Crop Yields under Maize-Wheat Crop Rotation. Agric. Water Manag. 2023, 286, 108383. [Google Scholar] [CrossRef]
  44. Li, Y.; Li, Z.; Gong, P.; He, X.; Liu, H.; Li, L.; Wang, C.; Li, P.; Wei, J.; Yu, X. Enhanced Irrigation Volume Reduces Salinity and Improves Deep Root Zone Soil Nutrients, Phosphatase Activity and Changes Root Traits of Fruit Trees. Agric. Water Manag. 2024, 302, 109001. [Google Scholar] [CrossRef]
  45. Ling, H.; Zhang, P.; Xu, H.; Zhao, X. How to Regenerate and Protect Desert Riparian Populus Euphratica Forest in Arid Areas. Sci. Rep. 2015, 5, 15418. [Google Scholar] [CrossRef]
  46. Pereira, L.S.; Paredes, P.; Espírito-Santo, D. Crop Coefficients of Natural Wetlands and Riparian Vegetation to Compute Ecosystem Evapotranspiration and the Water Balance. Irrig. Sci. 2024, 42, 1171–1197. [Google Scholar] [CrossRef]
  47. Eger, A.; Stevenson, B.A.; Theng, B.; Rhodes, P.; Fraser, S.; Penny, V.; Burge, O.R. Long-Term Effects of Fertilizer Application and Irrigation on Soils under Pasture Land Use. J. Soil Sci. Plant Nutr. 2022, 23, 801–818. [Google Scholar] [CrossRef]
Figure 1. Location map of the study area (satellite image from AutoNavi Map).
Agriculture 15 00747 g001
Figure 2. Histogram of soil texture at sampling sites in the study area.
Agriculture 15 00747 g002
Figure 3. Piper trilinear diagram of soil in the study area.
Agriculture 15 00747 g003
Figure 4. Box plots and jitter scatter plots of SWC, pH, EC, TDS, and various soluble ions in the study area (Note: Capital letters denote the results of Turkey’s HSD variance analysis, where the same letter represents no significant difference, and different letters indicate significant differences. Multiple datasets of Fe, Mn, and CO32− did not meet the normal distribution criteria, so variance analysis was not performed).
Agriculture 15 00747 g004
Figure 5. Line charts showing the distribution of SWC, pH, EC, TDS, and various soluble ions in the study area.
Agriculture 15 00747 g005
Figure 6. Line charts of soil SAR and Cl/SO42− ratio in the study area.
Agriculture 15 00747 g006
Figure 7. Gibbs diagram of soluble salt ions in the soil of the study area.
Agriculture 15 00747 g007
Figure 8. The proportion of major ions in soil profiles in the study area (Note: The major ions here only include Na+, Ca2+, K+, Mg2+, Cl, and SO42−, and the value for each ion represents the average across the entire profile at each sampling site.)
Agriculture 15 00747 g008
Figure 9. The PCA loadings plot for PC1-PC2. (a) Korla area (including Korla1-1, Korla1-2, Korla2, and Korla3). (b) PuHui1. (c) PuHui2. (d) All sampling sites. (e) Scatter plot of principal component scores for all soil samples mentioned above.
Agriculture 15 00747 g009
Figure 10. Hierarchical clustering diagram of all soil samples in the study area (Note: “Korla1-1 0–10” represents the soil sample from the Korla1-1 sampling site at a depth of 0–10 cm and so on for other samples).
Agriculture 15 00747 g010
Figure 11. Correlation heat map of all variables for soil samples in the study area. (a) Heat map of Pearson correlation coefficients. (b) Heat map of p-values, with values retained to three decimal places. (Note: GD = groundwater depth; each variable integrates data from six sampling sites).
Agriculture 15 00747 g011
Table 1. The specific locations and details of the sampling sites.
LocationSampling Site NumberLatitudeLongitudeElevation (m)Sampling Time
KorlaKorla1-141.596967° N86.180216° E9092024.4.7
Korla1-241.596967° N86.180216° E9092024.4.20
Korla241.586451° N86.174886° E9032024.5.2
Korla341.580605° N86.166460° E9012024.5.2
PuHuiPuHui141.412950° N85.84983° E8922024.5.3
PuHui241.36196° N85.94547° E8912024.5.3
Table 2. Statistics of soil water and salt characteristics in the study area. (Note: The unit of SWC is %, while the unit of EC, TDS, and each ion is mg L−1).
SiteIndicatorsSWCpHECTDSK+Na+Ca2+Mg2+FeMnClSO42−NO3−CO32−HCO3
Korla1-1Min3.26.610.1981.982.164.148.633.130.00309.7914.270011.75
Max7.958.650.52305.97.8930.8927.0815.610.079031.7895.1919.898.2568.37
Mean6.027.980.3160.63.2917.4314.077.390.019021.6645.829.440.8530.94
Median6.58.010.32170.32.8522.2613.737.280.012023.3355.238.82030.19
Std1.570.480.0960.781.419.614.473.070.02108.122.626.182.2612.81
CV26.095.9531.1137.8442.8255.1431.7841.54111.9/37.3849.3765.43266.941.4
K-S test0.250.230.210.150.270.230.250.190.27/0.160.20.160.490.19
p-value0.330.440.560.890.260.430.330.660.26/0.860.580.860.0020.7
Korla1-2Min5.867.740.1157.511.465.184.671.53006.325.34008.39
Max14.118.890.2199.473.7416.6210.585.390.7720.01113.4336.533.8513.7543.46
Mean9.048.470.1579.382.3510.176.963.260.2110.0039.4416.452.54.7829.28
Median7.868.520.1680.362.310.336.523.130.08709.1516.483.284.430.2
Std2.590.270.0313.520.73.461.821.160.240.0041.998.511.384.488.39
CV28.713.218.5517.0329.8634.0126.1835.63113.8148.821.0451.7455.1693.6928.66
K-S test0.210.250.130.140.240.130.170.130.280.360.170.170.320.240.14
p-value0.530.350.950.930.40.950.760.960.210.0470.80.810.110.370.94
Korla2Min5.57.050.0848.321.194.576.671.9008.018.890017.73
Max21.28.570.27150.439.4313.9913.176.620.460.01114.2428.7516.4515.9555.51
Mean14.047.890.1575.52.87.939.163.280.0710.00110.8716.754.985.2931.62
Median13.47.930.1372.62.147.368.733.250.025011.0116.434.934.9529.64
Std4.50.440.0524.892.042.491.761.20.120.0031.966.34.25.0310.35
CV32.085.6131.7432.9772.9631.3819.236.56169.272290.88718.0637.6184.395.1932.73
K-S test0.110.120.180.270.260.140.160.180.290.420.170.190.20.220.12
p-value0.990.990.730.260.280.940.830.730.180.0130.790.70.60.490.98
Korla3Min15.570.1152.142.314.075.932.24008.010.010021.04
Max29.38.060.21118.56.1115.4711.576.310.9160.00334.393020.49045.31
Mean24.317.520.1686.644.0410.298.953.950.089013.3717.53.99030.96
Median24.57.650.1791.353.9610.519.053.840.017011.7219.833.08030.2
Std3.840.370.0319.81.022.771.781.050.240.0016.527.775.4805.55
CV15.84.8819.8522.8525.1926.8719.8726.65270.741217.25648.7744.38137.35/17.91
K-S test0.170.190.220.170.170.210.130.150.450.450.340.160.3/0.17
p-value0.780.670.490.760.770.560.950.90.0060.0070.080.860.15/0.81
PuHui1Min20.37.630.43242.545.87.3223.439.810023.88121.496.66020.35
Max348.394.522810.348.2199.4351.455.240.0450.009455.93957.35152.74063.34
Mean29.38.031.831123.416.0778.38158.926.150.0080.002124.22543.6939.49032.8
Median30.57.991.19703.711.2850.799.5823.4900.00169.74459.2919.53032.3
Std4.420.251.32839.612.4256.97130.413.350.0150.002132.07321.3249.3010.97
CV15.13.117274.7477.2772.6882.0851.03185.856140.483106.3359.1124.85/33.45
K-S test0.220.20.230.230.370.230.280.180.40.310.260.220.35/0.18
p-value0.490.610.450.430.0390.440.230.730.0230.130.30.470.06/0.72
PuHui2Min22.47.430.81472.838.3386.1818.1212.570049.82144.476.75025.51
Max40.88.471.42843.9715.44184.455.2621.590.0260.007170.49293.7435.5051.35
Mean34.148.161.13665.7511.83140.235.318.020.0030.002141.37241.9717.34039.53
Median34.48.231.13649.6311.83138.031.0118.600.001153.37247.7712.04039.26
Std5.510.260.1797.092.0231.1310.62.810.0080.00232.8740.139.1107.4
CV16.143.2314.7714.5817.0922.2130.0315.58244.292119.89623.2516.5852.51/18.71
K-S test0.160.20.10.10.10.160.20.150.510.420.240.140.26/0.13
p-value0.840.631110.850.630.890.0010.0140.360.940.3/0.97
Table 3. PCA of PC1-PC2 loading matrix.
Soil
Attribute
KorlaPuHui1PuHui2All
PC1PC2PC1PC2PC1PC2PC1PC2
Ca2+0.337−0.1390.2430.317−0.0670.4410.2730.285
Mg2+0.351−0.0350.326−0.090−0.0860.3820.3330.007
Na+0.3370.0990.255−0.304−0.381−0.1790.281−0.271
K+0.110−0.3000.2750.054−0.185−0.0050.3140.048
Fe−0.0650.4610.280−0.095−0.076−0.003−0.0800.435
Mn−0.0980.3770.0670.374−0.1700.2270.0520.378
HCO30.017−0.274−0.0820.037−0.013−0.1440.055−0.302
CO32−−0.0760.303−0.0000.0000.000−0.000−0.1210.214
Cl0.3310.1240.324−0.127−0.3570.1400.322−0.041
SO42−0.348−0.0380.2560.302−0.341−0.0290.3110.154
NO30.2500.1870.333−0.0490.0250.4400.2900.203
pH−0.0300.363−0.128−0.3970.005−0.394−0.001−0.055
TDS0.3640.0150.3330.103−0.3860.0110.3370.127
EC0.3570.0240.3330.101−0.3900.0190.3380.119
SWC−0.097−0.2740.218−0.122−0.320−0.0950.244−0.228
SAR0.2300.1950.045−0.442−0.287−0.3340.193−0.396
Cl/SO42−0.0200.2450.187−0.384−0.2110.254−0.0220.254
Disclaimer/Publisher’s Note: The statements, opinions and data contained in all publications are solely those of the individual author(s) and contributor(s) and not of MDPI and/or the editor(s). MDPI and/or the editor(s) disclaim responsibility for any injury to people or property resulting from any ideas, methods, instructions or products referred to in the content.

