Article

Passion Fruit Disease Detection Using Sparse Parallel Attention Mechanism and Optical Sensing

China Agricultural University, Beijing 100083, China
*
Author to whom correspondence should be addressed.
These authors contributed equally to this work.
Agriculture 2025, 15(7), 733; https://doi.org/10.3390/agriculture15070733
Submission received: 28 February 2025 / Revised: 22 March 2025 / Accepted: 24 March 2025 / Published: 28 March 2025

Abstract

:
A disease detection network based on a sparse parallel attention mechanism is proposed and experimentally validated in the passion fruit (Passiflora edulis [Sims]) disease detection task. Passiflora edulis, as a tropical and subtropical fruit tree, is loved worldwide for its unique flavor and rich nutritional value. The experimental results demonstrate that the proposed model performs excellently across various metrics, achieving a precision of 0.93, a recall of 0.88, an accuracy of 0.91, an mAP@50 (average precision at the IoU threshold of 0.50) of 0.90, an mAP@50–95 (average precision at IoU thresholds from 0.50 to 0.95) of 0.60, and an F1-score of 0.90, significantly outperforming traditional object detection models such as Faster R-CNN, SSD, and YOLO. The experiments show that the sparse parallel attention mechanism offers significant advantages in disease detection with multi-scale and complex backgrounds. This study proposes a lightweight deep learning model incorporating a sparse parallel attention mechanism (SPAM) for passion fruit disease detection. Built upon a Convolutional Neural Network (CNN) backbone, the model integrates a dynamically selective attention mechanism to enhance detection performance in cases with complex backgrounds and multi-scale objects. Experimental results demonstrate that the model has superior precision, recall, and mean average precision (mAP) compared with state-of-the-art detection models while maintaining computational efficiency.

1. Introduction

Passion fruit (Passiflora edulis [Sims]), as a tropical and subtropical fruit tree, is loved worldwide for its unique flavor and rich nutritional value [1]. In recent years, with the popularization of agricultural greenhouse technology, the cultivation of passion fruit has gradually shifted towards efficient and large-scale production. However, with the expansion of cultivation scale and changes in environmental conditions, the problem of passion fruit diseases has become increasingly severe, posing a significant challenge to agricultural production [2,3,4]. Especially in the region where the Bayannur Wuyuan Meteorological Bureau is located, due to the area’s unique climate conditions and environmental factors, the disease problems of passion fruit exhibit distinct regional characteristics. Therefore, accurately and timely detecting passion fruit diseases has become an important issue to improve agricultural production efficiency and ensure food safety. Traditional methods for passion fruit disease detection primarily rely on manual observation, traditional pathological diagnosis, and simple visual inspection [5]. Although these methods can identify disease symptoms to some extent, they have many limitations. Manual detection is not only time-consuming and inefficient but also easily influenced by the experience and subjective factors of the inspector, leading to frequent misdiagnoses or missed diagnoses [6]. In addition, in agricultural greenhouse environments, diseases tend to spread rapidly, making it difficult for traditional methods to meet the need for timely detection and response. Therefore, the rapid development and application of disease detection technologies are crucial. Recent advancements in deep learning have significantly improved plant disease detection. Traditional object detection methods such as Faster R-CNN (Region-based Convolutional Neural Network), SSD (Single-Shot MultiBox Detector), and YOLO (You Only Look Once version) have been widely used in agricultural disease recognition [7], but their generalization ability remains limited under conditions of complex backgrounds and high visual similarity between diseased and healthy leaves. Additionally, existing models struggle with early-stage disease detection and often require high computational resources, limiting their applicability in resource-constrained environments. To address these challenges, this study introduces a lightweight detection framework incorporating a sparse parallel attention mechanism (SPAM) to improve detection accuracy and computational efficiency.
With the rapid development of deep learning and computer vision technologies, image recognition-based disease detection methods have gradually become mainstream [8]. In recent years, target detection methods based on Convolutional Neural Networks (CNNs) have achieved significant results in agricultural disease detection [9,10,11]. Huang et al. [12] proposed an improved YOLOv8-G algorithm to address the limitations of traditional methods. Experimental results show that the average precision (mAP) of the YOLOv8-G algorithm is 83.1%, a 3.3% improvement over the original model. Chen et al. [13] proposed a YOLOv8-MDN (Mixture Density Network)-Tiny model to improve the small-scale disease detection capability in passion fruit. Compared with YOLOv8s, their improved lightweight model achieved more accurate localization of small passion fruit targets. Specifically, the mAP50 improved by 2.2–94.8%, and accuracy and recall rates increased by 1.5% and 6.0%, respectively. However, these models still face limitations when dealing with complex backgrounds, occlusion, and multi-scale objects, especially when disease symptoms are highly similar to background objects, reducing the robustness of the models. In recent years, the application of Transformers in object detection has gradually emerged, especially with the DETR (Detection Transformer) model [14,15,16,17]. The method presented in [14] is valuable in the field of disease detection, but excessive discussion may obscure the original contributions of this paper. We have streamlined the description of this method and shifted the focus more explicitly to the innovative aspects of the sparse parallel attention mechanism proposed in our study. Chen et al. [18] proposed a Transformer model based on cyclic consistency for generating disease tomato leaf images for data augmentation. Experimental results showed that the proposed model achieved an accuracy of 99.45% on the PlantVillage dataset [19]. However, the model’s robustness needs further validation to adapt to the complex and variable field environment. Li et al. [20] proposed a new object detection method called “Plant Leaf Detection transformer with Improved deNoising anchOr boxes (PL-DINO)”. Experimental results demonstrated the superiority of PL-DINO compared with other advanced methods. Li et al. [21] proposed a high-precision and highly robust object detection model based on an improved real-time detector (RT-DETR) called Intelligent Multi-Scale Lychee Leaf Disease and Pest DETR (IMLL-DETR). Traditional disease detection methods rely on manual observation or pathological diagnosis, which are inefficient and prone to human error. Deep learning methods, while improving detection accuracy, still face technical challenges such as poor sensitivity to early-stage symptoms, high computational cost, and the need for substantial computational resources for field deployment. To address these issues, we propose a sparse parallel attention mechanism that reduces computational cost and improves focus on critical regions, overcoming these bottlenecks.
To overcome the limitations of traditional methods and existing deep learning approaches, this paper proposes a disease detection network based on a sparse parallel attention mechanism. The innovations of this method are as follows:
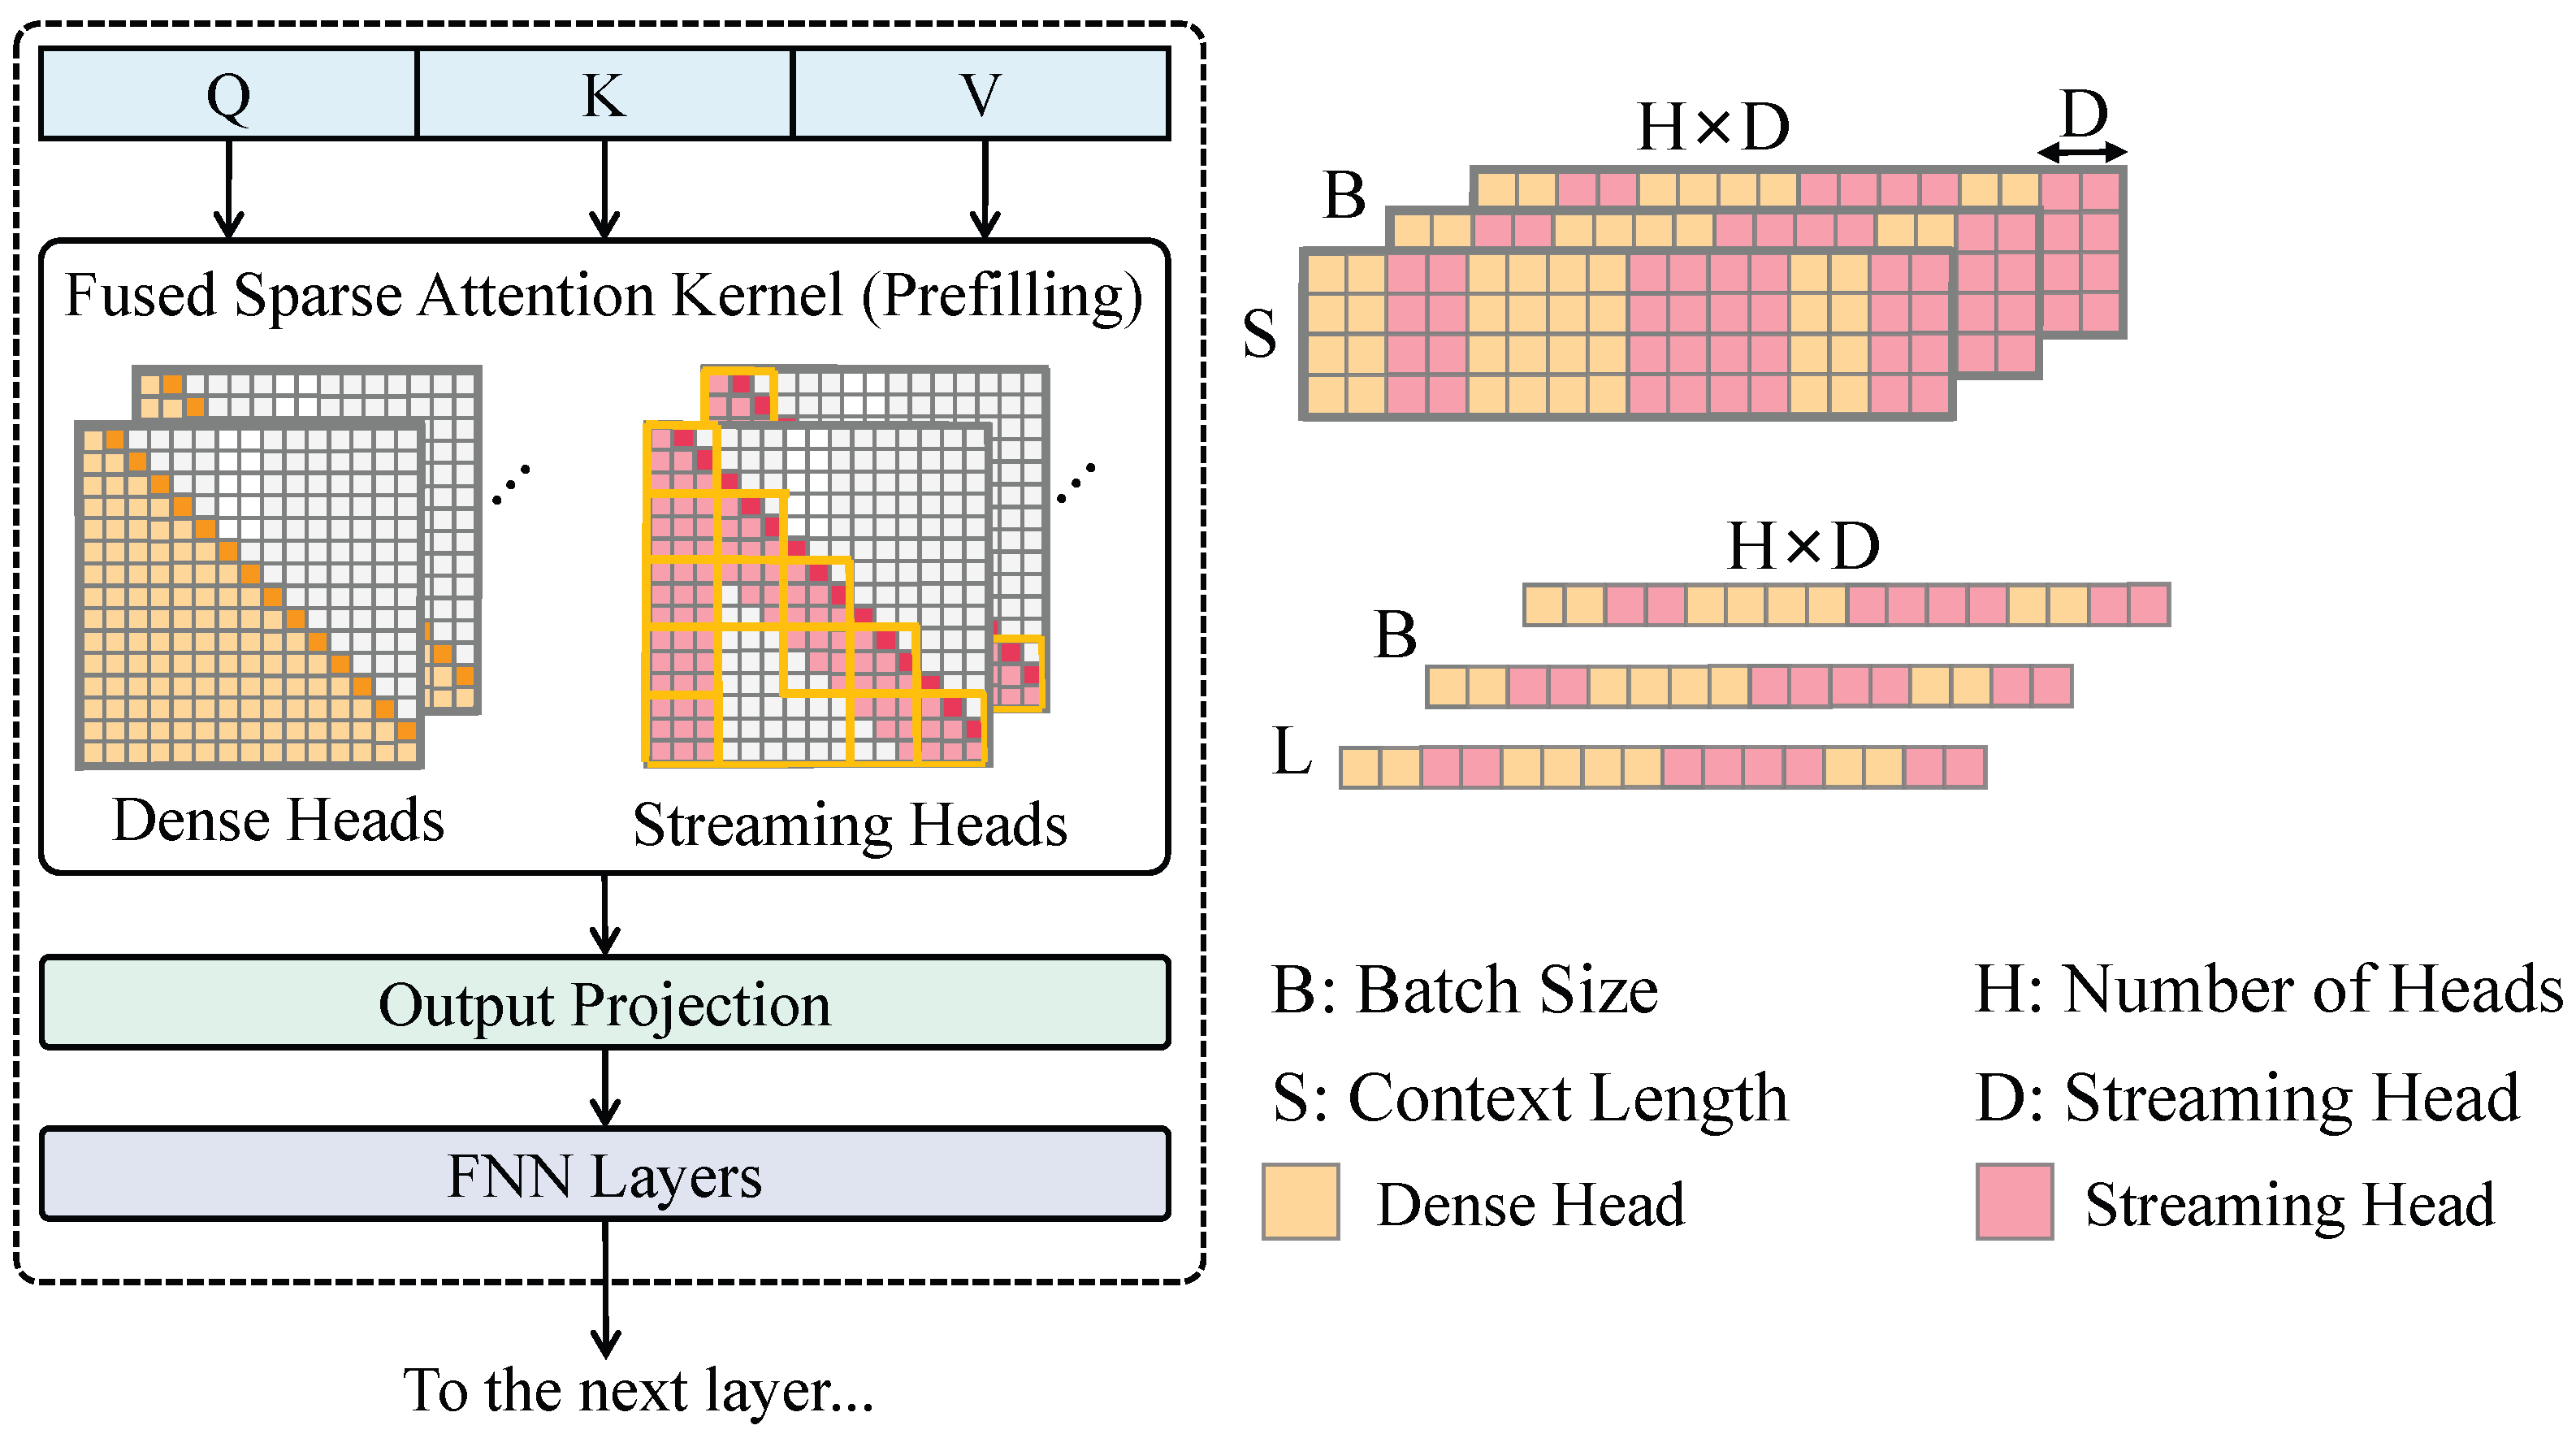
  • Introduction of sparse parallel attention mechanism: This paper innovatively introduces a sparse parallel attention mechanism, optimizing the efficiency of attention computation in the Transformer model. By sparsifying the attention matrix, the computational complexity is reduced, enabling the model to focus more on feature extraction from key areas.
  • Design of parallel differential loss: The proposed parallel differential loss guides the model to learn across multiple scales during training, enhancing its adaptability to diseases of varying sizes and forms. This innovative design helps the model learn features of diseases of different scales from multiple dimensions simultaneously, especially in handling multi-scale, complex-background disease data, which effectively improves detection accuracy and robustness.
  • Adaptation to the diversity and complexity of agricultural greenhouse environments: The proposed method is optimized for the practical conditions in agricultural greenhouse environments, capable of handling changes in the greenhouse environment, the diversity of diseases, and the growth states of plants.
In conclusion, this study not only has theoretical significance but also strong practical value. Through field applications in the agricultural greenhouse environment of the Bayannur Wuyuan Meteorological Bureau, the proposed method can detect passion fruit diseases in real time and efficiently, helping farmers take precise preventive and control measures, thereby improving the sustainability and economic efficiency of agricultural production.

2. Related Work

2.1. CNN-Based Object Detection

Object detection, a core task in computer vision, focuses on identifying and locating objects in images [22]. CNNs, as the foundation of deep learning, have been widely used in this area. Recent advances in CNN-based object detection have led to significant performance improvements through various network architectures, training strategies, and optimization methods [23,24]. The two main frameworks for object detection are single-stage and two-stage detection.

2.1.1. Single-Stage Object Detection

YOLO (You Only Look Once) and SSD (Single-Shot MultiBox Detector) are the most representative CNN-based single-stage detection algorithms [25,26]. YOLO frames object detection as a regression problem, where the network directly predicts the object’s location and class, eliminating the need for candidate boxes [27]. It predicts a fixed number of bounding boxes and their confidence scores for each grid cell. Each bounding box is represented by four parameters: ( x , y , w , h ) , where ( x , y ) are the center coordinates, and w and h are the width and height. YOLO’s loss function consists of localization loss and classification loss, representing the differences between predicted and actual bounding box positions and categories, respectively. The loss function in YOLO can be represented as
L = λ coord i obj ( x i x ^ i ) 2 + ( y i y ^ i ) 2 + ( w i w ^ i ) 2 + ( h i h ^ i ) 2 + λ conf i obj ( C i C ^ i ) 2 + λ class i obj c ( P i , c P ^ i , c ) 2 .
YOLO uses an indicator function obj that takes the value 1 when an object is present in the grid cell and 0 otherwise. The parameters ( x i , y i , w i , h i ) and ( x ^ i , y ^ i , w ^ i , h ^ i ) represent the predicted and ground-truth bounding box coordinates, respectively. C i and C ^ i are the predicted and ground-truth confidence scores, and P i , c and P ^ i , c represent the predicted and ground-truth probabilities for class c in the i-th bounding box. YOLO’s advantages include speed and efficiency, as it performs object detection in a single forward pass, making it highly real-time [28].
SSD is another single-stage detection algorithm that performs object detection on feature maps at different scales, predicting bounding boxes and classes by using default boxes of various sizes [29]. Its loss function consists of localization loss, which measures the difference between predicted and true bounding box positions, and classification loss, which calculates the difference between predicted and true classes for each box. The loss function is given by
L = 1 N obj i obj ( x i x ^ i ) 2 + ( y i y ^ i ) 2 + ( w i w ^ i ) 2 + ( h i h ^ i ) 2 + 1 N noobj i noobj ( C i C ^ i ) 2 + 1 N class i obj c ( P i , c P ^ i , c ) 2 ,
where N obj and N noobj represent the number of predicted boxes with and without objects, respectively; obj and noobj are the indicator functions for object presence; C i and C ^ i are the predicted and ground-truth confidence scores, respectively; and P i , c and P ^ i , c represent the predicted and ground-truth probabilities for class c in the i-th bounding box. SSD’s advantage lies in detecting objects of various sizes through multi-scale feature maps. Compared with YOLO, SSD strikes a better balance between accuracy and speed, making it more suitable for detecting dense and multi-scale objects, especially against complex backgrounds, where it excels at recognizing small objects [30].

2.1.2. Two-Stage Object Detection

Faster R-CNN is a two-stage object detection algorithm [31]. Unlike single-stage methods, it has two stages: region proposal and object classification with bounding box regression. In the region proposal stage, the RPN (Region Proposal Network) applies convolution to generate feature maps [32] and then slides a window over the feature maps to generate candidate regions, called anchor boxes. The RPN predicts the presence of objects and their positions for each anchor box. The RPN output includes the probability of an object being present and the regression offsets for adjusting the anchor boxes to better match the target’s position and scale. Specifically, the RPN output can be represented as
p ^ i = sigmoid ( f ( x i ) ) ,
t ^ i = f ( x i ) ,
where p ^ i represents the probability that the i-th anchor box contains a target, f ( x i ) is the output from a fully connected layer applied to feature vector x i generated by the CNN, and t ^ i is the regression offset for the anchor box relative to the real target. In Faster R-CNN, object classification and regression are the core tasks of the second stage. The candidate regions from the RPN are input into an RoI Pooling (Region of Interest Pooling) layer for spatial alignment, followed by feature extraction through fully connected layers [33]. These features are then passed into two parallel networks: one for object classification and one for bounding box regression, where the classification network outputs probabilities for each class and the regression network predicts the location offsets between the region and the real target. The object classification and regression loss functions can be expressed as
L c l s = i y i log ( p i ) ,
L l o c = i [ i pos ] t i t ^ i 2 ,
where y i is the real class label of the i-th candidate region, and p i is the predicted class probability for that region; t i and t ^ i are the real and predicted regression offsets for the i-th candidate region, respectively; [ i pos ] is an indicator function that is 1 if the region is a positive sample and 0 otherwise. By combining the RPN with the CNN, Faster R-CNN enables end-to-end object detection, generating candidate regions and then performing classification and bounding box regression. This two-stage approach improves both the precision and efficiency of detection. Despite its success, Faster R-CNN faces challenges like high computational cost and difficulties in anchor box setting [34].

2.2. Transformer-Based Object Detection

In recent years, the success of the Transformer model in natural language processing (NLP) has led to its increasing application in computer vision (CV) tasks [35]. DETR, a Transformer-based object detection model, eliminates the need for traditional Region Proposal Networks and anchor boxes by using a global attention mechanism to directly predict object locations and classes [36]. The core idea of DETR is to leverage the Transformer architecture and its self-attention mechanism to predict the position and class of objects from the global features of the image. After the input image passes through a feature extraction network, the resulting feature map is represented as a 2D tensor X R H × W × C , where H and W are the height and width and C is the number of channels. To include positional encoding, DETR introduces a positional vector P R H × W × D for each feature point, where D is the dimensionality of the positional encoding. The design of positional encoding can be implemented by using sine and cosine functions, which enables the model to effectively capture the spatial position information of feature points. The final combined representation of the image’s features X and the positional encoding P can be expressed as
Z 0 = X + P .
The feature vectors Z 0 are input into the Transformer’s encoder, and the output Z 1 represents a global feature map with information from the image. This feature is used in the decoder for object detection. DETR adopts a query-based mechanism in the decoder, where queries interact with the encoder’s output to generate predictions for each object. For each query q i , the decoder’s output y i consists of the class prediction and bounding box regression parameters. Specifically, each query generates an output y i R 1 × ( C + 4 ) , where C is the number of classes and 4 represents the bounding box parameters. By introducing the self-attention mechanism of the Transformer, DETR transforms object detection into a set prediction problem, bypassing the need for candidate region generation in traditional methods [37]. DETR’s strength lies in its end-to-end training and global information modeling, making it highly effective in complex scenarios. However, it still faces challenges, such as long training times and high computational costs, requiring optimization for real-time detection [38,39].

3. Materials and Methods

The objective of this section is to describe the materials and methodologies used for passion fruit disease detection in this study. It outlines the data collection process, including the dataset composition, annotation, and augmentation strategies, as well as the specific methods applied for disease detection. The section also explains the development and application of a novel disease detection network based on a sparse parallel attention mechanism, which aims to optimize computational efficiency and improve detection accuracy in complex, multi-scale agricultural environments. The methodology aims to provide a comprehensive framework for training, validating, and evaluating deep learning models in real-world agricultural settings.

3.1. Dataset Collection

In this study, passion fruit disease recognition is based on a dataset containing images of several common disease categories. To ensure the representativeness and comprehensiveness of the data, the disease dataset in this study mainly includes five common types of passion fruit diseases: ulcer disease (Phytophthora spp.), brown rot (Monilinia spp.), gray mold (Botrytis cinerea), anthracnose (Colletotrichum spp.), and late blight (Phytophthora infestans), as shown in Figure 1. The data collection took place in Wuyuan County, Bayannur City, Inner Mongolia, with collection occurring from July 2023 to October 2024. During the data collection process, the different types of diseases were first carefully defined and categorized to ensure that images for each disease category were accurately classified. Each disease type in the dataset contains at least 1000 images, as shown in Table 1.
The data were collected by using a high-resolution DSLR camera (Digital Single Lens Reflex (Canon Inc., Tokyo, Japan)), specifically the Canon EOS 5D Mark IV, equipped with a 24-megapixel CMOS sensor, capable of capturing high-quality, detailed images. To avoid interference from environmental lighting, all images were captured under standardized lighting conditions with the aid of stable artificial light sources. The light sources used were LED photographic lamps with a CRI (Color Rendering Index) of 95 to ensure high color fidelity and reduce shadow interference. During the collection, leaf diseases were typically captured from a vertical or slightly tilted angle to ensure clear visibility of the disease spots. For fruit diseases, more attention was paid to capturing surface details in order to observe the impact of the disease on the fruit. The shooting distance was controlled between 30 cm and 50 cm to ensure that each image clearly presented both local features and the overall morphology of the disease spots. After each collection, images were subjected to preliminary screening and sorting to remove blurry, duplicate, or substandard images, ensuring high-quality final data. In terms of disease features, ulcer disease is characterized by round or irregular brown ulcer spots on the leaf and fruit surfaces, typically with a sunken center and slight decay. Brown rot is characterized by moist brown spots on the fruit, which rapidly expand, leading to soft rot on the surface. Gray mold mainly affects the fruit and leaves of the passion fruit, with spots that are typically gray or brown, often accompanied by a gray-white mold layer. Anthracnose lesions are usually round, starting as reddish brown and later becoming dark brown or black, affecting both fruit and leaves. Late blight generally appears as water-soaked lesions on the leaves, with fuzzy edges, leading to gradual leaf decay at the affected spots. Due to the variety of diseases and their diverse manifestations, images were captured at various growth stages and with different disease severities to better simulate real-world disease recognition scenarios. With this diverse set of images, the model can more accurately identify diseases and enhance its generalization ability in practical applications.

3.2. Dataset Annotation and Augmentation

3.2.1. Dataset Annotation

The task of dataset annotation typically includes two main components: the assignment of class labels to each object and the precise localization of each object through bounding boxes or polygons. Annotation is not merely an image processing task, but it directly impacts the model’s ability to learn features and recognize objects during training. LabelMe is an open-source image annotation tool widely used in computer vision tasks, especially in object detection, image segmentation, and semantic segmentation, as shown in Figure 2. LabelMe supports a graphical interface that allows users to easily add labels and annotate bounding boxes for objects within images through simple interactive operations. The core functionalities of LabelMe include polygon and rectangular annotation, as well as the generation of corresponding annotation files based on user requirements. The tool stores annotation results in JSON format, containing information about the object’s location, category, shape, and other details, thus greatly facilitating data management and processing. During the annotation process, it is first necessary to determine the position of each object. Traditional object detection methods typically use rectangular bounding boxes to mark object locations. The position of a rectangular box is represented by four coordinate values:
B = x min , y min , x max , y max ,
where B denotes the bounding box of the object, x min and y min represent the coordinates of the top-left corner, and x max and y max represent the coordinates of the bottom-right corner. This representation is concise and efficient but only captures the boundary information of the rectangular box and cannot accurately describe irregularly shaped objects. For more complex object shapes, LabelMe supports polygon annotations. In polygon annotation, the boundaries of an object are represented by a series of consecutive points ( x 1 , y 1 ) , ( x 2 , y 2 ) , , ( x n , y n ) , forming a closed polygon. The formula is expressed as
P = ( x 1 , y 1 ) , ( x 2 , y 2 ) , , ( x n , y n ) ,
where P denotes the polygon boundary of the object and ( x i , y i ) denotes the coordinates of the i-th point. Compared with rectangular bounding box annotation, polygon annotation can more accurately fit the shape of the object, particularly for irregularly shaped objects such as plant leaves or animals, resulting in higher annotation precision. In practical applications, LabelMe not only provides annotation tools but also integrates several convenient functions, such as the automatic saving of annotation progress, importing existing annotation data, and the batch processing of annotated images. These features not only improve annotation efficiency but also reduce human errors during the annotation process. To facilitate the operators, LabelMe also supports image scaling, rotation, and dragging, making the annotation process more flexible and efficient. Despite the convenience that LabelMe offers for data annotation, several challenges remain. First, the accuracy of the annotation data directly influences the subsequent model training performance. If the annotations are erroneous or inconsistent, the model may be disturbed by incorrect information during training, leading to a decrease in performance. Therefore, annotators must possess a certain level of expertise to ensure that each object is correctly annotated according to the task requirements.
In agricultural domains, particularly in crop disease detection and pest identification tasks, data annotation plays a crucial role. By using LabelMe, researchers can precisely annotate crop images, providing high-quality training data for deep learning models. For example, in the disease detection task in this paper, the researchers used LabelMe to annotate disease spots on passion fruit leaves and accurately marked the location and category of each spot based on the type and shape of the lesions. These annotated data will serve as the foundation for training deep learning models, helping them learn the features of various types of diseases and improving their detection accuracy.

3.2.2. Data Augmentation

Data augmentation is a crucial technique for enhancing the robustness and generalization ability of deep learning models. It involves applying various transformations to the original data during training, expanding the diversity of the dataset and effectively preventing overfitting, especially in cases with limited sample sizes. In this study, two data augmentation methods, namely, Cutout and CutMix, are employed. These methods introduce controlled pixel alterations to input images, simulating a degree of image variation, thus forcing the model to learn more robust and meaningful features. Cutout is a data augmentation method that improves model robustness by masking part of the input image [40]. Specifically, this approach involves augmenting the training dataset by randomly removing one or more rectangular regions from the image. In the implementation of Cutout, the occlusion region is determined by a rectangle located at a random position within the image, where the size and location of the rectangle can vary. The dimensions of the occlusion region, w × h , are determined by a certain random distribution, typically generated by randomly selecting values for w and h within the width and height of the image. If the size of the input image is W × H , Cutout will randomly select a w × h region within the image and set the pixel values of that region to zero. The mathematical expression for this operation can be represented as
I o u t = I C ,
where I represents the original input image, I o u t denotes the image augmented by Cutout, and C is a rectangular occlusion area, where the pixel values are set to zero.
CutMix is another innovative image augmentation technique that creates new training samples by mixing portions of two images [41]. Specifically, CutMix cuts two images according to a certain proportion and exchanges their regions to generate a new image. Let I 1 and I 2 represent two images, with corresponding labels y 1 and y 2 . In CutMix, images I 1 and I 2 are cut and stitched together to form a new image I m i x . The cutting operation involves swapping a region R from image I 1 with a region of the same size from image I 2 , resulting in a new image I m i x . The label of the mixed image, y m i x , is computed as a weighted average of the labels y 1 and y 2 , where the weights correspond to the area proportions of the respective regions. Let λ denote the area ratio of the cut region R in image I 1 ; then, the label y m i x can be expressed as
y m i x = λ y 1 + ( 1 λ ) y 2 .
In practice, λ is typically determined randomly, with values selected from the range [ 0 , 1 ] .

3.3. Proposed Method

The overall structure of the proposed method begins with the processing of input data, which are passed through multiple modules for successive information extraction and processing, as shown in Figure 3. In the initial stage of the model, the data are processed through an embedding layer, followed by feature extraction via an attention mechanism and then passed to the multi-head attention layer. In this layer, the data are mapped into query (Q), key (K), and value (V) matrices and operated upon with corresponding weight matrices. Next, the data flow into the sparse parallel attention mechanism, where the attention matrix is sparsified to reduce computational complexity and enhance the model’s focus. The processed features then undergo further processing through a feed-forward neural network (FNN) layer, and the output is passed to the detection head. In the output phase, after processing by multiple streaming heads, the output consists of target category and bounding box regression values, forming the final prediction result. The output of each module serves as the input for the next, refining the data layer by layer to ultimately achieve efficient disease detection for passion fruit. In this study, the sparse parallel attention mechanism optimizes attention computations by focusing on key regions of the input data, significantly reducing computational complexity. Unlike traditional fully connected attention mechanisms, our approach concentrates on the critical information in the image, enhancing computational efficiency while maintaining high accuracy. The mechanism works by using multiple sparse selectors in parallel, allowing for the simultaneous processing of multiple key regions, thus improving the model’s robustness in complex environments. The dynamic selector is the core component of the sparse parallel attention mechanism. It dynamically selects the regions to be attended to based on the input data’s features. Specifically, in each layer, the selector determines which areas are most important for the task based on the content of the image and the output from the previous layer, thus avoiding redundant computations and improving processing efficiency. By dynamically selecting the regions, the model can focus on key areas while adjusting its computational strategy, resulting in higher accuracy in multi-scale disease detection and complex-background environments, as shown in Table 2.

3.3.1. Disease Detection Network Based on Sparse Parallel Attention Mechanism

As shown in Figure 4, the proposed disease detection network based on the sparse parallel attention mechanism combines the advanced Transformer model in deep learning with sparse attention mechanisms to address the challenges of computational complexity and robustness in disease detection tasks, particularly when faced with complex backgrounds, occlusions, and multi-scale objects. The overall design concept of this network is to leverage the powerful modeling capability of the Transformer, especially the self-attention mechanism, combined with the optimization approach of sparse parallel attention, to effectively improve the model’s efficiency and accuracy when processing large-scale image data. First, the input image data undergo preliminary convolutional layer processing to extract low-level features such as edges and textures. These features are then passed to the attention mechanism module. In traditional Transformer models, the attention mechanism generates attention weights by computing the relationships between the queries (Q), keys (K), and values (V), but this computation can be very costly, particularly when processing large images. To solve this problem, the sparse parallel attention mechanism is introduced, where instead of performing full connection computations for all input positions, a dynamic selection mechanism is used to compute only the important parts, thereby reducing the computational burden and increasing efficiency. Specifically, the sparse parallel attention mechanism involves multiple dynamic selectors, each responsible for selecting important regions from the input data for computation, rather than globally computing over the entire input. In each layer’s processing, the selector dynamically selects the areas to focus on based on the previous layer’s selection results and the current input features. This design allows the model to adaptively focus on key areas of the image while effectively avoiding the high computational complexity typically found in traditional methods. Through sparsification, the model not only improves computational efficiency but also focuses on the most information-rich parts of the image, thereby enhancing its performance.
The specific implementation of this model involves multiple sparse attention modules and an FNN. In each layer’s sparse parallel attention module, the input feature map is processed by multiple dynamic selectors, with each selector performing weighted computations based on the input features. Each module outputs a sparsified attention matrix, which is weighted and passed into the next module for further processing. After several rounds of such processing, the output feature map is passed to the final detection head for disease classification and bounding box regression. Mathematically, the core idea of the sparse parallel attention mechanism is to optimize the attention computation process. However, in the sparse parallel attention mechanism, attention is computed by focusing on important query–key pairs, reducing the computational load. Through this method, the sparse parallel attention mechanism can effectively reduce computational complexity, especially when handling large-scale image data. Furthermore, to enhance the model’s adaptability, a parallel differential loss design is also proposed in this work. During model training, the loss function includes not only traditional classification and regression losses but also introduces parallel differential losses targeting diseases at different scales. This design allows the model to simultaneously perform feature learning at different scales, thus improving its ability to detect multi-scale diseases. Through the parallel differential loss design, the model can perform feature extraction at multiple scales and gradually learn the key features of diseases at various scales during training.

3.3.2. Sparse Parallel Attention Mechanism

As shown in Figure 5, the sparse parallel attention mechanism is a novel method for optimizing self-attention computation, aimed at addressing the issue of excessive computational complexity in deep learning, particularly in object detection tasks. In traditional self-attention mechanisms, attention calculation is fully connected, meaning that each query (Q) is computed with every key (K), which significantly increases the computational burden as the number of input features grows. This results in the limitation of training and inference speed for the model. To overcome this issue, the sparse parallel attention mechanism introduces a sparsification operation, calculating only a subset of important attention values, thereby greatly reducing computational complexity. The core idea of the sparse parallel attention mechanism is that during attention computation, not all queries and keys are involved in the calculation. Instead, a selection mechanism is applied to choose the most relevant portions of the input features for computation. This method ensures computational efficiency while maintaining high performance. Compared with traditional self-attention mechanisms, the sparse parallel attention mechanism does not compute over the entire input but instead focuses on specific regions or features by “selectively” attending to them. This reduces the computational load and enhances the model’s computational efficiency.
In practice, the sparse parallel attention mechanism dynamically selects key regions for computation based on the output of each layer and the input features. Typically, the selection of sparsification is determined by weight values, feature importance, or a predefined selection strategy. For instance, when processing image data, the model can compute the importance of each region and perform attention calculations only on the most important areas, ignoring the influence of other regions. This enables the model to significantly improve computation speed while maintaining accuracy. Mathematically, the computation of the sparse parallel attention mechanism can be expressed as
A sparse = softmax Q K sparse T d k V ,
where Q represents the query matrix, K sparse is the key matrix after sparse selection, V represents the value matrix, d k is the dimension of the keys, and A sparse is the computed sparse attention matrix. In traditional attention mechanisms, the K matrix contains all the key information, but in the sparse parallel attention mechanism, K sparse contains only the most important parts after selection, thus reducing the computational load. The design of the sparse parallel attention mechanism offers several notable advantages. Firstly, by reducing the computation of irrelevant regions, the model can significantly improve training and inference efficiency, especially when handling large-scale data, leading to considerable speedup. Secondly, the sparsification operation helps the model focus on key feature regions, improving the model’s performance, especially in complex backgrounds, where it effectively suppresses the interference from irrelevant information. The sparse parallel attention mechanism is particularly suitable for multi-scale object detection tasks. In such tasks, the size of the objects varies greatly, and the background is complex. Traditional fully connected attention mechanisms may fail to capture the features of small objects and instead increase the computational overhead. The sparse parallel attention mechanism can perform selectively computation based on the features of different objects, thus reducing computational complexity while improving the detection capability for small objects. By dynamically selecting important regions for attention calculation, the sparse parallel attention mechanism can adaptively adjust the computation process, better accommodating targets of different scales.

3.3.3. Parallel Differential Loss

In object detection tasks, traditional loss function designs are typically divided into two components: classification loss and regression loss. Classification loss is used to measure the discrepancy between the predicted and true class labels, while regression loss evaluates the error between the predicted and true bounding boxes. However, this traditional approach often optimizes for targets of a single scale and fails to effectively handle multi-scale, complex-background, and multi-form object detection problems. To address this issue, we propose a “parallel differential loss” design, which computes the loss of targets at different scales in parallel, significantly enhancing the model’s adaptability to diseases of various scales. The core idea behind parallel differential loss is to guide the model to simultaneously handle classification and regression tasks at different scales during the training process, rather than relying on a single-scale loss calculation. Specifically, for each scale, classification loss and regression loss are computed for that scale; then, these losses are weighted and summed to obtain the total loss. The mathematical expression for this method can be written as
L parallel = i λ i · L class ( y ^ i , y i ) + L bbox ( b ^ i , b i ) ,
where L class ( y ^ i , y i ) represents the classification loss for the i-th target, y ^ i is the predicted class, and y i is the actual class; L bbox ( b ^ i , b i ) is the regression loss, where b ^ i is the predicted bounding box and b i is the true bounding box; λ i is the weight coefficient for the scale, responsible for balancing the contribution of losses from different scales. With parallel differential loss, the model can independently learn at each scale, integrating information from multiple scales for object detection. This method has the advantage of overcoming the limitations of traditional methods that focus on a single scale. By simultaneously optimizing multiple scales within the same training process, detection accuracy and robustness are improved. In agricultural disease detection tasks, where the shapes and sizes of diseases can vary significantly, the use of parallel differential loss allows the model to better adapt to diseases of different sizes and shapes, thereby enhancing its multi-scale disease detection capability. Traditional loss functions struggle with multi-scale targets, particularly when dealing with complex backgrounds and large variations in object sizes, which limits the model’s performance. By introducing multiple scales, parallel differential loss can simultaneously focus on both large and small targets, achieving better results in multi-scale object detection. For example, when detecting diseases on passion fruit, where lesions vary in shape and size, traditional loss functions may not achieve high accuracy under diverse disease presentations. Parallel differential loss, by computing losses across multiple scales, helps the model learn the features of different disease types, thus improving its generalization ability and accuracy. Furthermore, parallel differential loss avoids the performance bottlenecks of traditional loss functions when dealing with complex scenes. In traditional methods, model training typically relies on error calculations from a single scale, and for multi-scale targets, the model is prone to false positives or missed detection results. Through multi-scale parallel computation, the model can effectively synthesize information from all scales, reducing the likelihood of errors in complex environments and enhancing disease detection accuracy.

3.4. Experimental Setup

3.4.1. Hardware/Software Platforms and Hyperparameters

As shown in Table 2, in this experiment, the hardware platform utilized is a high-performance computing cluster equipped with NVIDIA A100 Tensor Core GPUs, each possessing up to 40 GB of memory, thus enabling large-scale image processing tasks and deep learning model training. The CPU used is the Intel Xeon Gold 6248R processor, with 24 cores to support high concurrency, effectively aiding data preprocessing and parallel computing tasks. A memory configuration of 256 GB DDR4 ensures sufficient storage space when handling large datasets. The storage is managed by SSDs, offering high-speed read/write performance that enhances the data loading process. The operating system chosen is Ubuntu 20.04, known for its stability and compatibility. The network environment relies on a 10 Gbps high-speed network connection, ensuring efficient and low-latency data transmission. Regarding the software platform, TensorFlow and PyTorch were employed for the experiment. TensorFlow is primarily used for model training and inference, offering a rich API and efficient distributed training capabilities suitable for large-scale dataset training. PyTorch, on the other hand, is used for implementing the novel algorithms involved in the experiment. For experiment management and dependency handling, Anaconda was used as the package manager to ensure compatibility among various libraries. Image processing and augmentation were carried out by using OpenCV and Pillow, while LabelMe was used for annotating the dataset.
In terms of hyperparameter settings, the Adam optimizer was chosen for model training, with a learning rate set to 10 4 , utilizing a learning rate decay strategy to gradually decrease the learning rate for improved convergence. The loss function combines both classification and regression losses, where the classification loss is computed by using the cross-entropy loss function, and the regression loss uses the L1 loss function. A batch size of 16 was selected to balance memory usage and training speed. The training process was initialized with 5 epochs of pre-training, each consisting of 5000 iterations. To prevent overfitting, a Dropout rate of 0.5 was set, and data augmentation techniques such as Cutout and CutMix were employed. The training process spans 50 epochs, with a maximum training time of 6 h per epoch, ensuring the model achieves optimal performance within a reasonable timeframe.

3.4.2. Dataset Split

In this experiment, the dataset was divided according to the common 7:2:1 ratio, with 70% of the data allocated to the training set, 20% to the validation set, and 10% to the test set. This approach ensures that most of the data are used for model training, while retaining a portion for model evaluation and performance validation. Additionally, to further enhance the model’s generalization ability and prevent overfitting, 10-fold cross-validation (k = 10) was employed. In this method, the dataset is divided into 10 subsets, with 9 subsets used for training and the remaining 1 used for validation. This process is repeated 10 times, each time with a different subset as the validation set, and the final model performance is evaluated by averaging the results from the 10 folds. This cross-validation technique effectively assesses the model’s performance across different data subsets, enhancing the reliability and robustness of the experimental results.
In this study, we adopted a standard data partitioning method, dividing the dataset into training, validation, and test sets in a 7:2:1 ratio. Specifically, 70% of the data are allocated for model training, 20% are used for hyperparameter tuning and early stopping, and the remaining 10% are reserved for final evaluation. The primary purpose of 10-fold cross-validation is to optimize the model during training rather than for final testing. During the training phase, the training set (70%) is further divided into 10 subsets. In each fold, 9 subsets are used for training, and 1 subset is used for validation. This process is repeated 10 times, ensuring that each subset serves as a validation set once. The final model performance is evaluated by averaging the results across these folds, ensuring the robustness and generalization capability of the model. Regarding the concern about 5-fold cross-validation, we clarify that cross-validation is not applied during final testing. It is strictly used within the training phase for model optimization. After training, we use the separate 20% validation set for hyperparameter tuning and model selection. The final model evaluation is conducted on the independent 10% test set, which serves as a one-time assessment of the best-performing model selected during validation. No cross-validation is applied to the final test results.

3.4.3. Evaluation Metrics

To comprehensively and objectively evaluate the performance of the model, we used several common evaluation metrics, including precision (p), recall (r), accuracy (acc), F1-score (F1), and mAP (mean average precision). These metrics not only help assess the model’s performance from different perspectives but also reveal the strengths and weaknesses of the model when dealing with different types of data. Precision (p) measures the proportion of true positive samples among those predicted as positive (detected as target objects). Recall (r) measures the proportion of actual target objects that the model successfully identifies. Accuracy (acc) is the proportion of correct predictions in classification tasks, applicable to classification models but also useful as a supplementary metric in object detection tasks. The F1-score (F1) is the harmonic mean of precision and recall, balancing both metrics. The F1-score is especially useful when the data are imbalanced, as it provides more guidance than precision and recall alone. The mAP is the core evaluation metric for object detection tasks, widely used to measure the overall performance of a model on detection tasks. mAP is calculated by averaging the precision (AP) of different target classes, where AP is calculated based on different Intersection over Union (IoU) thresholds. In this paper, both mAP@50 and mAP@50–95 are used. mAP@50 represents the average precision when the IoU threshold is 0.5, while mAP@50–95 computes the average precision over IoU thresholds from 0.5 to 0.95 (usually with a step size of 0.05) and then averages those values. Their mathematical formulas are
p = T P T P + F P .
r = T P T P + F N .
a c c = T P + T N T P + T N + F P + F N .
F 1 = 2 · p · r p + r .
A P = 0 1 p ( r ) , d r .
m A P = 1 N i = 1 N A P i .
where T P represents true positives, the number of target objects correctly identified by the model; F P represents false positives, the number of times the model incorrectly identifies background or non-target objects as target objects; FN represents false negatives, the number of target objects that the model fails to identify; TN represents true negatives, the number of background regions (non-target regions) correctly predicted by the model; p ( r ) represents the precision corresponding to recall r; N is the number of classes; and A P i is the average precision (AP) for the i-th class. For m A P @ 50 , the AP is calculated at an IoU threshold of 0.5, while for m A P @ 50–95, it is the average of AP values over multiple IoU thresholds. These metrics effectively reflect the precision, recall, and overall performance of the object detection model.

3.5. Baseline Methods

In this study, several mainstream object detection models were selected as baseline models for performance comparison. These models include SSD [42], RetinaNet [43], YOLOv3 [44] and YOLOv4 [45], Faster R-CNN [7], and DETR [46]. SSD is an efficient single-stage object detection model that performs predictions on feature maps at different scales, using CNNs for rapid target localization and classification. RetinaNet addresses the class imbalance problem by introducing focal loss, effectively mitigating background noise commonly encountered in small-sample object detection. It improves detection capabilities for difficult samples by separately weighting low-frequency and high-frequency predictions. The YOLO series represents a class of typical single-stage object detection models. YOLOv3 and YOLOv4 further enhance the feature extraction network based on the original YOLO model, improving detection for small and dense objects. These models are widely applicable in real-time scenarios due to their high efficiency. Faster R-CNN, a classical two-stage object detection model, first generates candidate regions by using a Region Proposal Network (RPN), followed by classification and regression for each candidate region. Lastly, DETR, a novel object detection model based on the Transformer architecture, eliminates the region proposal step present in traditional models. Instead, it directly performs target detection within the global image context, using self-attention mechanisms to model targets, overcoming many local computational limitations inherent in traditional methods. The advantage of DETR lies in its ability to enhance the model’s understanding of targets through global information modeling, demonstrating stronger robustness in complex scenarios. By comparing these baseline models, the advantages and shortcomings of models based on sparse parallel attention mechanisms in the context of passion fruit disease detection can be thoroughly analyzed, providing insights for further model optimization.

4. Results and Discussion

4.1. Experimental Results of Disease Detection Models

The purpose of this experiment was to evaluate the performance of various object detection models in the task of passion fruit disease detection. By comparing the detection capabilities of different models, the most optimal detection method could be selected. The experimental results for Faster R-CNN, SSD, RetinaNet, YOLOv10, DETR, YOLOv11, and the proposed model are shown in Table 3. The evaluation metrics included precision, recall, accuracy, mAP@50 (mean average precision at an IoU threshold of 0.5), mAP@50–95 (mean average precision at IoU thresholds ranging from 0.5 to 0.95), and F1-score. These metrics provide a comprehensive assessment of the models’ performance in disease detection, allowing for an analysis of their strengths and weaknesses and providing theoretical guidance for practical applications.
As shown in Table 3 and Figure 6, the proposed model performed excellently across all evaluation metrics, particularly in precision, recall, and F1-score, with values of 0.93, 0.88, and 0.90, respectively, significantly outperforming other models [47,48]. Specifically, YOLOv11 and DETR followed closely in terms of precision and recall but still lagged slightly in mAP@50–95 and F1-score, indicating that while these models perform well in certain metrics, they still face limitations in handling complex disease data, especially in terms of object detection accuracy [49]. Traditional models like Faster R-CNN and SSD performed relatively poorly, with lower precision and recall, and F1-scores not exceeding 0.83. These results suggest that although these models exhibit good performance on basic detection tasks, their detection capabilities are limited when faced with diverse and complex agricultural disease detection problems, due to their inherent model structures and learning capacities. In contrast, YOLOv10 and YOLOv11, with their optimized network structures and feature extraction methods, exhibited superior performance, particularly in achieving a good balance between precision and speed. DETR, as a Transformer-based model, was able to better understand the global information in the image through self-attention mechanisms, but its performance was slightly lower than that of YOLOv11. From a mathematical perspective, traditional CNN-based object detection models such as Faster R-CNN and SSD rely on RPNs and fixed default box strategies, which exhibit weak performance in detecting small objects and handling complex backgrounds. The region proposal process in Faster R-CNN leads to high computational complexity, and the model struggles to detect small and overlapping objects. SSD enhances detection capability through multi-scale feature maps, but still faces challenges when dealing with small and multi-scale objects, especially against complex backgrounds, where its reliance on default box strategies makes the model less robust. YOLOv10 and YOLOv11, through optimized feature extraction networks and end-to-end training, achieve a good balance between precision and speed, offering significant advantages in fast real-time detection. DETR’s strength lies in the introduction of Transformer architecture, which allows for the global modeling of image information and better adapts to complex scene detection tasks. However, its high computational cost and longer training times result in slightly inferior performance compared with the YOLO series models in terms of real-time processing and multi-scale detection. The proposed sparse parallel attention mechanism optimizes the attention computation process and performs parallel computation across multiple scales, significantly enhancing model accuracy and robustness, especially in detecting targets against complex backgrounds and multi-scale scenarios, thus outperforming all other models.

4.2. Experimental Results of Disease Detection Models for Each Disease Type

The aim of this experiment was to evaluate the proposed model’s ability to detect different types of diseases. By comparing the results across various disease types, the performance differences in detecting each disease type were analyzed, providing a foundation for further optimizing disease detection models. The experimental results for five types of diseases (ulcer disease, brown rot, gray mold, anthracnose, and late blight) are presented in the table. The evaluation metrics enable a comprehensive assessment of the model’s performance when handling different disease types and offer theoretical support for the detection characteristics of each disease.
As shown in Table 4, the model’s detection accuracy varied depending on the disease type. Late blight exhibited the best detection performance, with precision, recall, accuracy, mAP@50, and F1-score all showing the highest values of 0.97, 0.93, 0.95, 0.94, and 0.95, respectively. This indicates that the characteristics of this disease are relatively distinctive, allowing the model to effectively distinguish it. For anthracnose, gray mold, and brown rot, although detection accuracy remained high, performance was somewhat lower compared with late blight, particularly in terms of mAP@50–95 and F1-score, indicating a slight decrease in detection precision for these diseases. Ulcer disease performed relatively worse, with a precision of 0.89 and a recall of 0.85. Despite the high accuracy and F1-score, the model’s ability to detect ulcer disease still showed some limitations. Theoretically, these differences can be explained by the disease’s visual features and the model’s learning ability. Late blight typically presents more characteristic symptoms with easily recognizable lesions that are relatively consistent in shape and size, making it easier for the model to learn the features. On the other hand, diseases like ulcer disease may have lesions that are irregular in appearance and distribution, making it more difficult for the model to capture stable features during training, which results in lower detection precision. Mathematically, the proposed model utilizes a sparse parallel attention mechanism, which effectively addresses multi-scale issues and complex backgrounds in disease detection. For diseases that are easier to detect, such as late blight, the model can quickly capture key features through global information modeling and sparse attention mechanisms, thus enhancing detection accuracy. For more difficult-to-detect diseases, like ulcer disease, where lesions have irregular shapes and distributions, the model must learn features at multiple scales. The sparse parallel attention mechanism optimizes the computation process and reduces unnecessary calculations, improving the model’s ability to capture complex features. These mathematical optimizations enable the model to adapt to the diversity of different diseases, minimize background noise interference, and simultaneously improve robustness and detection accuracy.

4.3. Ablation Experiment of Different Attention Mechanisms

The purpose of this experiment was to assess the impact of different attention mechanisms on object detection performance, particularly focusing on comparing the standard self-attention mechanism, the Convolutional Block Attention Module (CBAM), and the sparse parallel attention mechanism proposed in this study in passion fruit disease detection. Through this ablation study, a deeper understanding was gained of how each attention mechanism affects the model’s detection accuracy, recall, and overall performance, providing a theoretical basis for further model optimization. The experimental results presented in the table indicate that the standard self-attention mechanism performed well, but there was still a noticeable gap compared with the proposed mechanism. The performance of the CBAM was relatively lower, suggesting that traditional convolutional attention mechanisms struggle with multi-scale and complex-background scenarios.
As shown in Table 5, it can be observed that the standard self-attention mechanism showed strong performance in precision, recall, and accuracy, particularly excelling in F1-score and mAP@50, outperforming the CBAM model. However, the mAP@50–95 of the standard self-attention mechanism was only 0.52, indicating poor robustness when dealing with multi-scale issues. While the CBAM, as a convolutional attention module, introduced spatial and channel-wise attention mechanisms, its overall performance was still inferior to the standard self-attention mechanism. This may be attributed to the limitations in the way the CBAM focuses attention when handling complex backgrounds and multi-scale objects, which hinders its ability to effectively capture detailed features. In contrast, the proposed sparse parallel attention mechanism performed the best across all evaluation metrics, especially excelling in mAP@50–95 and F1-score, indicating that this approach effectively improved detection accuracy and robustness in complex disease scenarios. From a mathematical perspective, the standard self-attention mechanism calculates the relationship between each query and all keys in a fully connected manner, which allows the model to capture global information but comes with high computational complexity, especially when processing large-scale images, causing a drastic increase in computational load. On the other hand, the sparse parallel attention mechanism reduces the computational complexity by sparsifying the attention matrix, minimizing the influence of irrelevant information, and focusing on more crucial areas of the image. This is particularly advantageous in multi-scale disease detection, where the model can efficiently capture features from lesions of varying sizes. Additionally, through parallel computing, the model can learn features from multiple dimensions simultaneously, enhancing detection accuracy. The CBAM attempts to extract more information by adding channel and spatial attention mechanisms, but due to the limitations of its mechanism, it was less efficient in improving model performance compared with the sparse parallel attention mechanism, especially when faced with complex disease features.

4.4. Ablation Experiment of Different Loss Functions

The purpose of this experiment was to evaluate the impact of different loss functions on the performance of the model, specifically comparing cross-entropy loss, focal loss, and the proposed loss function, in the passion fruit disease detection task. Through ablation experiments, the differences in how each loss function handles issues like sample imbalance, detection accuracy, recall, and overall performance were analyzed, providing theoretical support for selecting the most appropriate loss function. The experimental results in the table demonstrate that the cross-entropy loss showed relatively average performance, with low precision, recall, and mAP metrics, whereas focal loss exhibited significant improvements. The proposed loss function outperformed all other metrics, achieving the best overall performance.
As shown in Table 6, it can be observed that the cross-entropy loss yielded low precision (0.67), recall (0.63), accuracy (0.65), and F1-score (0.63), with mAP@50 and mAP@50–95 also at low levels. Although cross-entropy loss is well suited for some standard classification tasks, it struggles in object detection tasks, particularly in addressing class imbalance, leading to low recall and detection accuracy. Focal loss, which introduces higher weights for difficult samples, effectively improved the model’s ability to detect small targets and adapt to complex backgrounds. Precision, recall, and F1-score were significantly enhanced, particularly mAP@50–95 and F1-score, which reached 0.82 and 0.82, respectively. Focal loss, by weighting easy and hard samples, forces the model to focus more on difficult samples, reducing interference from background noise. However, compared with focal loss, the proposed loss function showed even more significant improvements across all metrics, achieving a precision of 0.93, and recall and F1-score of 0.88 and 0.90, respectively, with mAP@50 and mAP@50–95 reaching 0.90 and 0.60. This demonstrates the model’s powerful capability to handle complex disease data. From a mathematical perspective, cross-entropy loss typically faces challenges with class imbalance in object detection tasks. In real-world applications, background samples vastly outnumber target object samples, causing the model to focus too much on background learning, which hinders the detection of small objects. Focal loss addresses this by introducing a scaling factor that reduces the weight of easily classifiable samples and increases the attention on hard-to-classify samples, which helps improve small object detection, especially when the targets are small and difficult to detect. However, in extreme cases of sample imbalance, focal loss may still be insufficient because it only adjusts the weights of each sample, which may not capture all features effectively. In contrast, the proposed loss function not only tackles class imbalance in object detection but also introduces a parallel differential mechanism to handle multi-scale object detection. By calculating losses at multiple scales in parallel and applying weighted summation, the model optimizes detection accuracy across multiple dimensions, improving its ability to handle multi-scale targets. Additionally, by fully considering the differences between targets and backgrounds in the loss computation, the proposed loss function enhances the model’s ability to recognize disease targets, particularly maintaining high detection accuracy and recall in cases with complex backgrounds and small targets.

4.5. Limitation and Future Work

Despite the excellent performance of the disease detection network based on the sparse parallel attention mechanism in various metrics, some limitations remain. Firstly, although the model demonstrates high accuracy and robustness in most disease detection tasks, its performance may still be affected by highly complex or heavily occluded diseases. Especially when disease symptoms closely resemble background objects, the model’s discriminative ability may decrease, leading to false positives or false negatives. Additionally, due to the large variety of diseases, each with different symptoms and features, the model’s training relies on a substantial number of high-quality annotated data. The accuracy and comprehensiveness of data annotation remain critical factors influencing the model’s performance. In future research, the model’s robustness can be further improved by expanding the dataset, introducing more types of disease images, and employing data augmentation techniques. Furthermore, for detecting complex backgrounds and small objects, more advanced attention mechanisms, such as cross-modal attention and global adaptive attention, could be considered to enhance the model’s adaptability to multi-scale and multi-class diseases. Lastly, for real-time detection requirements, optimizing the model’s inference speed on hardware platforms is essential to ensuring its efficiency in practical applications, such as in agricultural greenhouses.

5. Conclusions

A disease detection network based on a sparse parallel attention mechanism is proposed, aiming to address the accuracy and robustness issues in passion fruit disease detection. With the advancement of agricultural greenhouse technology, disease detection has become increasingly important, particularly when faced with complex backgrounds and multi-scale diseases, where traditional detection methods often encounter performance bottlenecks. The innovation of this study lies in the introduction of the sparse parallel attention mechanism, which optimizes the traditional self-attention mechanism, enabling the model to process multi-scale and complex backgrounds more efficiently. By performing parallel computations at multiple scales, the model can better focus on key features, reducing computational complexity while enhancing its ability to extract detailed information. Furthermore, a parallel differential loss is designed, further improving the model’s adaptability to different diseases and enhancing both the accuracy and robustness of disease detection. In experiments, the proposed model achieved outstanding results in passion fruit disease detection. The model reached a precision of 0.93, a recall of 0.88, an accuracy of 0.91, an F1-score of 0.90, an mAP@50 of 0.90, and an mAP@50–95 of 0.60, outperforming other comparison models, including DETR, Faster R-CNN, YOLOv4, YOLOv3, RetinaNet, and SSD. Notably, in the presence of complex backgrounds and multi-scale lesions, the proposed sparse parallel attention mechanism performed excellently, maintaining low false detection and missed detection rates while achieving high precision and recall.

Author Contributions

Conceptualization, Y.H., N.Z., X.G. and C.L.; Data curation, S.L. and M.K.; Formal analysis, L.Y. and Y.G.; Funding acquisition, C.L.; Investigation, L.Y. and M.K.; Methodology, Y.H., N.Z. and X.G.; Project administration, C.L.; Resources, S.L. and M.K.; Software, Y.H., N.Z., X.G. and S.L.; Supervision, C.L.; Validation, L.Y. and Y.G.; Visualization, Y.G.; Writing—original draft, Y.H., N.Z., X.G., S.L., L.Y., M.K., Y.G. and C.L.; Y.H., N.Z. and X.G. contributed equally to this work. All authors have read and agreed to the published version of the manuscript.

Funding

The authors would like to express their sincere gratitude to the Computer Association of China Agricultural University (ECC) for their valuable technical support. Upon the acceptance of this paper, the project code and the dataset will be made publicly available to facilitate further research and development in this field.

Data Availability Statement

The data presented in this study are available upon request from the corresponding author.

Conflicts of Interest

The authors declare no conflicts of interest.

References

  1. Asande, L.K.; Ombori, O.; Oduor, R.O.; Nchore, S.B.; Nyaboga, E.N. Occurrence of passion fruit woodiness disease in the coastal lowlands of Kenya and screening of passion fruit genotypes for resistance to passion fruit woodiness disease. BMC Plant Biol. 2023, 23, 544. [Google Scholar] [CrossRef] [PubMed]
  2. Wang, Y.; Teng, Y.; Zhang, J.; Zhang, Z.; Wang, C.; Wu, X.; Long, X. Passion fruit plants alter the soil microbial community with continuous cropping and improve plant disease resistance by recruiting beneficial microorganisms. PLoS ONE 2023, 18, e0281854. [Google Scholar]
  3. Do, D.H.; Chong, Y.H.; Ha, V.C.; Cheng, H.W.; Chen, Y.K.; Bui, T.N.L.; Nguyen, T.B.N.; Yeh, S.D. Characterization and detection of Passiflora mottle virus and two other potyviruses causing passionfruit woodiness disease in Vietnam. Phytopathology® 2021, 111, 1675–1685. [Google Scholar] [CrossRef]
  4. Zhang, Y.; Lv, C. TinySegformer: A lightweight visual segmentation model for real-time agricultural pest detection. Comput. Electron. Agric. 2024, 218, 108740. [Google Scholar]
  5. Zhang, S.; Ma, Y.; Chen, J.; Yu, M.; Zhao, Q.; Jing, B.; Yang, N.; Ma, X.; Wang, Y. Chemical composition, pharmacological effects, and parasitic mechanisms of Cistanche deserticola: An update. Phytomedicine 2024, 132, 155808. [Google Scholar]
  6. Kibriya, H.; Abdullah, I.; Nasrullah, A. Plant disease identification and classification using convolutional neural network and SVM. In Proceedings of the 2021 International Conference on Frontiers of Information Technology (FIT), Islamabad, Pakistan, 13–14 December 2021; pp. 264–268. [Google Scholar]
  7. Ren, S.; He, K.; Girshick, R.; Sun, J. Faster R-CNN: Towards real-time object detection with region proposal networks. IEEE Trans. Pattern Anal. Mach. Intell. 2016, 39, 1137–1149. [Google Scholar]
  8. Zhang, Y.; Wa, S.; Liu, Y.; Zhou, X.; Sun, P.; Ma, Q. High-accuracy detection of maize leaf diseases CNN based on multi-pathway activation function module. Remote Sens. 2021, 13, 4218. [Google Scholar] [CrossRef]
  9. Sun, Q.; Li, P.; He, C.; Song, Q.; Chen, J.; Kong, X.; Luo, Z. A lightweight and high-precision passion fruit YOLO detection model for deployment in embedded devices. Sensors 2024, 24, 4942. [Google Scholar] [CrossRef]
  10. Preanto, S.A.; Ahad, M.T.; Emon, Y.R.; Mustofa, S.; Alamin, M. A Semantic Segmentation Approach on Sweet Orange Leaf Diseases Detection Utilizing YOLO. arXiv 2024, arXiv:2409.06671. [Google Scholar]
  11. Zhang, Y.; Wa, S.; Zhang, L.; Lv, C. Automatic plant disease detection based on tranvolution detection network with GAN modules using leaf images. Front. Plant Sci. 2022, 13, 875693. [Google Scholar] [CrossRef]
  12. Huang, L.; Chen, M.; Peng, Z. Yolov8-g: An improved yolov8 model for major disease detection in dragon fruit stems. Sensors 2024, 24, 5034. [Google Scholar] [CrossRef] [PubMed]
  13. Chen, D.; Lin, F.; Lu, C.; Zhuang, J.; Su, H.; Zhang, D.; He, J. YOLOv8-MDN-Tiny: A lightweight model for multi-scale disease detection of postharvest golden passion fruit. Postharvest Biol. Technol. 2025, 219, 113281. [Google Scholar]
  14. Huangfu, Y.; Huang, Z.; Yang, X.; Zhang, Y.; Li, W.; Shi, J.; Yang, L. HHS-RT-DETR: A Method for the Detection of Citrus Greening Disease. Agronomy 2024, 14, 2900. [Google Scholar] [CrossRef]
  15. Wang, H.; Nguyen, T.H.; Nguyen, T.N.; Dang, M. PD-TR: End-to-end plant diseases detection using a transformer. Comput. Electron. Agric. 2024, 224, 109123. [Google Scholar]
  16. Zhang, Y.; Yang, X.; Liu, Y.; Zhou, J.; Huang, Y.; Li, J.; Zhang, L.; Ma, Q. A time-series neural network for pig feeding behavior recognition and dangerous detection from videos. Comput. Electron. Agric. 2024, 218, 108710. [Google Scholar]
  17. Redmon, J.; Divvala, S.; Girshick, R.; Farhadi, A. You only look once: Unified, real-time object detection. In Proceedings of the IEEE Conference on Computer Vision and Pattern Recognition, Las Vegas, NV, USA, 27–30 June 2016; pp. 779–788. [Google Scholar]
  18. Chen, Z.; Wang, G.; Lv, T.; Zhang, X. Using a Hybrid Convolutional Neural Network with a Transformer Model for Tomato Leaf Disease Detection. Agronomy 2024, 14, 673. [Google Scholar] [CrossRef]
  19. Singh, D.; Jain, N.; Jain, P.; Kayal, P.; Kumawat, S.; Batra, N. PlantDoc: A dataset for visual plant disease detection. In Proceedings of the 7th ACM IKDD CoDS and 25th COMAD, New York, NY, USA, 15 January 2020; pp. 249–253. [Google Scholar]
  20. Li, W.; Zhu, L.; Liu, J. PL-DINO: An improved transformer-based method for plant leaf disease detection. Agriculture 2024, 14, 691. [Google Scholar] [CrossRef]
  21. Li, Z.; Shen, Y.; Tang, J.; Zhao, J.; Chen, Q.; Zou, H.; Kuang, Y. IMLL-DETR: An intelligent model for detecting multi-scale litchi leaf diseases and pests in complex agricultural environments. Expert Syst. Appl. 2025, 273, 126816. [Google Scholar]
  22. Kaur, R.; Singh, S. A comprehensive review of object detection with deep learning. Digit. Signal Process. 2023, 132, 103812. [Google Scholar]
  23. Liu, Y.; Sun, P.; Wergeles, N.; Shang, Y. A survey and performance evaluation of deep learning methods for small object detection. Expert Syst. Appl. 2021, 172, 114602. [Google Scholar]
  24. Wang, A.; Chen, H.; Liu, L.; Chen, K.; Lin, Z.; Han, J.; Ding, G. Yolov10: Real-time end-to-end object detection. Adv. Neural Inf. Process. Syst. 2025, 37, 107984–108011. [Google Scholar]
  25. Vijayakumar, A.; Vairavasundaram, S. Yolo-based object detection models: A review and its applications. Multimed. Tools Appl. 2024, 83, 83535–83574. [Google Scholar] [CrossRef]
  26. Lu, X.; Ji, J.; Xing, Z.; Miao, Q. Attention and feature fusion SSD for remote sensing object detection. IEEE Trans. Instrum. Meas. 2021, 70, 1–9. [Google Scholar] [CrossRef]
  27. Zhang, Z.; Lu, X.; Cao, G.; Yang, Y.; Jiao, L.; Liu, F. ViT-YOLO: Transformer-based YOLO for object detection. In Proceedings of the IEEE/CVF International Conference on Computer Vision, Montreal, QC, Canada, 10–17 October 2021; pp. 2799–2808. [Google Scholar]
  28. Li, S.; Li, Y.; Li, Y.; Li, M.; Xu, X. Yolo-firi: Improved yolov5 for infrared image object detection. IEEE Access 2021, 9, 141861–141875. [Google Scholar] [CrossRef]
  29. Zheng, W.; Tang, W.; Jiang, L.; Fu, C.W. SE-SSD: Self-ensembling single-stage object detector from point cloud. In Proceedings of the IEEE/CVF Conference on Computer Vision and Pattern Recognition, Nashville, TN, USA, 20–25 June 2021; pp. 14494–14503. [Google Scholar]
  30. Cheng, L.; Ji, Y.; Li, C.; Liu, X.; Fang, G. Improved SSD network for fast concealed object detection and recognition in passive terahertz security images. Sci. Rep. 2022, 12, 12082. [Google Scholar] [CrossRef]
  31. Li, W. Analysis of object detection performance based on Faster R-CNN. J. Phys. Conf. Ser. Iop Publ. 2021, 1827, 012085. [Google Scholar] [CrossRef]
  32. Qiao, L.; Zhao, Y.; Li, Z.; Qiu, X.; Wu, J.; Zhang, C. Defrcn: Decoupled faster r-cnn for few-shot object detection. In Proceedings of the IEEE/CVF International Conference on Computer Vision, Montreal, QC, Canada, 10–17 October 2021; pp. 8681–8690. [Google Scholar]
  33. Avola, D.; Cinque, L.; Diko, A.; Fagioli, A.; Foresti, G.L.; Mecca, A.; Pannone, D.; Piciarelli, C. MS-Faster R-CNN: Multi-stream backbone for improved Faster R-CNN object detection and aerial tracking from UAV images. Remote Sens. 2021, 13, 1670. [Google Scholar] [CrossRef]
  34. Han, G.; Huang, S.; Ma, J.; He, Y.; Chang, S.F. Meta faster r-cnn: Towards accurate few-shot object detection with attentive feature alignment. In Proceedings of the AAAI Conference on Artificial Intelligence, Online, 22 February–1 March 2022; Volume 36, pp. 780–789. [Google Scholar]
  35. Li, Y.; Miao, N.; Ma, L.; Shuang, F.; Huang, X. Transformer for object detection: Review and benchmark. Eng. Appl. Artif. Intell. 2023, 126, 107021. [Google Scholar] [CrossRef]
  36. Zhang, H.; Li, F.; Liu, S.; Zhang, L.; Su, H.; Zhu, J.; Ni, L.M.; Shum, H.Y. Dino: Detr with improved denoising anchor boxes for end-to-end object detection. arXiv 2022, arXiv:2203.03605. [Google Scholar]
  37. Pu, Y.; Liang, W.; Hao, Y.; Yuan, Y.; Yang, Y.; Zhang, C.; Hu, H.; Huang, G. Rank-DETR for high quality object detection. Adv. Neural Inf. Process. Syst. 2023, 36, 16100–16113. [Google Scholar]
  38. Yao, Z.; Ai, J.; Li, B.; Zhang, C. Efficient detr: Improving end-to-end object detector with dense prior. arXiv 2021, arXiv:2104.01318. [Google Scholar]
  39. Ouyang, H. Deyo: Detr with yolo for end-to-end object detection. arXiv 2024, arXiv:2402.16370. [Google Scholar]
  40. DeVries, T.; Taylor, G.W. Improved Regularization of Convolutional Neural Networks with Cutout. arXiv 2017, arXiv:1708.04552. [Google Scholar]
  41. Yun, S.; Han, D.; Oh, S.J.; Chun, S.; Choe, J.; Yoo, Y. CutMix: Regularization Strategy to Train Strong Classifiers With Localizable Features. In Proceedings of the IEEE/CVF International Conference on Computer Vision (ICCV), Seoul, Korea, 27 October–2 November 2019. [Google Scholar]
  42. Liu, W.; Anguelov, D.; Erhan, D.; Szegedy, C.; Reed, S.; Fu, C.Y.; Berg, A.C. Ssd: Single shot multibox detector. In Proceedings of the Computer Vision–ECCV 2016: 14th European Conference, Amsterdam, The Netherlands, 11–14 October 2016; Proceedings, Part I 14. Springer: Berlin/Heidelberg, Germany, 2016; pp. 21–37. [Google Scholar]
  43. Lin, T.Y.; Goyal, P.; Girshick, R.; He, K.; Dollár, P. Focal loss for dense object detection. In Proceedings of the IEEE International Conference on Computer Vision, Venice, Italy, 22–29 October 2017; pp. 2980–2988. [Google Scholar]
  44. Redmon, J.; Farhadi, A. Yolov3: An incremental improvement. arXiv 2018, arXiv:1804.02767. [Google Scholar]
  45. Aldakheel, E.A.; Zakariah, M.; Alabdalall, A.H. Detection and identification of plant leaf diseases using YOLOv4. Front. Plant Sci. 2024, 15, 1355941. [Google Scholar] [CrossRef]
  46. Carion, N.; Massa, F.; Synnaeve, G.; Usunier, N.; Kirillov, A.; Zagoruyko, S. End-to-end object detection with transformers. In Proceedings of the European Conference on Computer Vision, Glasgow, UK, 23–28 August 2020; Springer: Berlin/Heidelberg, Germany, 2020; pp. 213–229. [Google Scholar]
  47. Zhao, Z.Q.; Zheng, P.; Xu, S.T.; Wu, X. Object Detection With Deep Learning: A Review. IEEE Trans. Neural Netw. Learn. Syst. 2019, 30, 3212–3232. [Google Scholar] [CrossRef]
  48. Sayed, A.; Zaki, M. Comparison of Deep Learning Models for Agricultural Disease Detection. Int. J. Comput. Appl. 2020, 175, 30–38. [Google Scholar]
  49. Tay, Y.; Bahri, D.; Yang, L.; Metzler, D.; Juan, D.C. Sparse Sinkhorn Attention. In Proceedings of Machine Learning Research, Proceedings of the 37th International Conference on Machine Learning, Red Hook, NY, USA, 13–18 July 2020; Daume, H., III, Singh, A., Eds.; ACM Digital Library: New York, NY, USA, 2020; Volume 119, pp. 9438–9447. [Google Scholar]
Figure 1. Examples from dataset. (a) Ulcer disease, (b) brown rot, (c) gray mold, (d) anthracnose, and (e) late blight.
Agriculture 15 00733 g001
Figure 2. Example of dataset annotation for disease detection. The ground-truth labels are illustrated.
Agriculture 15 00733 g002
Figure 3. Overall architecture of the proposed disease detection network. The network incorporates a sparse parallel attention mechanism, which optimizes attention calculations through multiple heads and streaming heads for efficient disease feature extraction.
Agriculture 15 00733 g003
Figure 4. This diagram illustrates the architecture of the proposed disease detection network, which utilizes a sparse parallel attention mechanism. The network incorporates dynamic selectors that focus on key regions in the input data, followed by sparse attention operations.
Agriculture 15 00733 g004
Figure 5. This diagram illustrates the computational process based on the sparse parallel attention mechanism, highlighting the comparison between traditional dense computation and sparse matrix-based computation.
Agriculture 15 00733 g005
Figure 6. Experimental results of different disease detection models. The proposed method is compared against SSD, RetinaNet, DETR, YOLOv11, YOLOv10, and Faster R-CNN.
Agriculture 15 00733 g006
Table 1. Number of images for each disease type.
DiseaseData
Ulcer disease1092
Brown rot1781
Gray mold1267
Anthracnose1514
Late blight1339
Table 2. Experimental setup table.
ItemConfiguration
HardwareNVIDIA A100 Tensor Core GPU
Operating systemUbuntu 20.04
SoftwareTensorFlow 2.4, PyTorch 1.7
Development environmentPython 3.8
Training time50 h (using a single GPU for training)
Batch size16
Learning rate0.0001
OptimizerAdam optimizer
HyperparametersDropout rate: 0.3; weight decay: 1 × 10 1 × 10 4
DatasetCustom passion fruit disease dataset, 10,000 images
Image resolution512 × 512
Training epochs50
Table 3. Experimental results of disease detection models.
ModelPrecisionRecallAccuracymAP@50mAP@50–95F1-ScoreFPS
Faster R-CNN0.840.790.810.800.500.8229
SSD0.850.800.820.810.520.8325
RetinaNet0.870.830.850.840.560.8534
YOLOv100.880.840.860.860.560.8641
DETR0.890.840.860.850.540.8639
YOLOv110.910.860.880.870.570.8742
Proposed method0.930.880.910.900.600.9047
Table 4. Experimental results of disease detection models for each disease type.
Disease TypePrecisionRecallAccuracymAP@50mAP@50–95F1-ScoreFPS
Ulcer disease0.890.850.870.860.560.8746
Brown rot0.910.880.900.890.590.8944
Gray mold0.920.890.910.900.600.9049
Anthracnose0.940.910.930.920.630.9248
Late blight0.970.930.950.940.650.9548
Table 5. Ablation experiment of different attention mechanisms.
AttentionPrecisionRecallAccuracymAP@50mAP@50–95F1-ScoreFPS
CBAM0.850.810.830.820.440.8134
Standard self-attention0.890.830.860.850.520.7639
Proposed method0.930.880.910.900.600.9047
Table 6. Ablation experiment of different loss functions.
LossPrecisionRecallAccuracymAP@50mAP@50–95F1-ScoreFPS
Cross-entropy loss0.670.630.650.640.320.6331
Focal loss0.850.800.830.820.430.8235
Proposed method0.930.880.910.900.600.9047
Disclaimer/Publisher’s Note: The statements, opinions and data contained in all publications are solely those of the individual author(s) and contributor(s) and not of MDPI and/or the editor(s). MDPI and/or the editor(s) disclaim responsibility for any injury to people or property resulting from any ideas, methods, instructions or products referred to in the content.

