Abstract
The experiment aimed to evaluate the effectiveness of using high doses of nitrogen (N) and delaying the sowing of living mulch in the apple tree (Malus domestica Borkh.) orchard as factors stimulating tree growth and influencing fruit quality. Blue fescue (Festuca ovina L.), as a cover crop, was sown in the tree rows in the second and fourth year after tree planting. It was compared to herbicide fallow control treatment. In each floor management, four N doses (50, 80, 110, and 140 kg ha−1) were used every year. The study indicated the dominance of living mulch, especially sowing in the second year after tree planting as a factor influencing the reduction in growth and yield but improving the red blush surface on the fruit skin. The growth of trees was also strongly influenced by biotic and abiotic stress factors, which did not allow for a clear assessment of N fertilization. With objectively low cropping levels and poor growth of all trees tested in the experiment, their N needs were satisfied by a dose of 50 kg ha−1. The application of the highest dose of 140 kg N ha−1 had a significant and negative impact on the red color of the fruit skin.
1. Introduction
Fruit tree cultivation with cover crops is recommended for organic production [1,2,3] whose importance in European large-scale apple production is still small, with the exception of Italy [4]. This ecological weed management [5,6], depending on the selection of cover crop, limits the presence of weeds to a varying degree [7,8]. In the orchard, living mulch often replaces herbicide fallow [9,10,11]. At the same time, it has a positive effect on the biodiversity of flora [12], affects soil properties [13,14,15,16], and determines its microbial communities [17,18]. Living mulch primarily plays the role of a ‘catch crop’, preventing the leaching of nutrients, including N [19,20]. This may affect the N supply to trees because greater availability of this nutrient in orchard ensures floor management with free vegetation soil surface in the rows, e.g., herbicide fallow [21].
N has a clear stimulating effect on the shoot growth of apple trees and the surface of leaves [22]. Increasing the N dose did not have an effect on other tree growth parameters, such as trunk cross sectional area [23,24]. Stronger shoot growth is negatively correlated with the concentration of phenolic compounds in the apple leaves [22] and, in case of the apple skin, phenolics belonging to the group of anthocyanins. They are responsible for the red blushing of fruit [25]. On the one hand, agrotechnical methods ensuring a greater availability of N for trees affect the decrease in the red color of apple fruits [26]. On the other hand, the proper choice of production methods may have a positive impact on the phenolic synthesis by plants [27,28,29,30]. Such technologies include replacing chemical weed control with living mulch because competitive N uptake by living mulch restricts its availability to trees [31].
The presence of green mulch has a positive impact on the red skin color of apples [32,33] or other fruits [34,35]. Apples from a young orchard with living mulch had a red blush area of about 70–80% [36,37], compared to the herbicide fallow where it reached less than 30% of the skin surface [37]. The positive effect of living mulch on fruit coloration unfortunately does not apply to other fruit quality characteristics. The cover crop may contribute to a reduction in the size [37,38] or other parameters of fruit [39]. Even with low tree yields, in young orchard with living mulch, the share of apples with a diameter below 7.5 cm increased, while the 7.0–8.0 cm or above classes decreased [37,38].
Different floor managements, including living mulch, affect the availability of N to trees to varying degrees [19,20,40]. Compared to herbicide fallow, the overall N balance in grass living mulch can be positive. This may be due to greater N recycling of groundcover biomass and soil mineralization [20]. Application of legume living mulch can guarantee good N nutrition of trees [37,41]. Nevertheless, living mulch in the orchard is perceived as a competitive cover plant for fruit trees, which is associated with decrease in the tree growth or N leaf status, or both [37,42,43,44]. Its presence often significantly reduces yield compared to the crop in a herbicide or mechanical fallow [37,40,44].
A good supply of N to trees is ensured more by the use of annual fertilization than by proper orchard floor management [40]. The problem of N fertilization was revealed by older studies conducted on vigorous apple trees in a less intensive orchard with 550 trees ha−1 and living mulch. Compensation for competition between the trees and cover crop sod required higher N rates than 166 kg N ha−1 [45]. Increased foliar N concentration was possible at a very high rate of 180 kg N ha−1. This dose of N, compared to a three-times lower dose, ensured a high N concentration (over 24.0 g kg−1) in leaves when white clover or mixed grasses mulch replaced other floor managements [46]. Direct use of these recommendation is not possible in a modern apple orchard, with several times more dwarf trees ha−1. Methodology of integrated apple production currently recommends an N dose not exceeding 80 kg N ha−1 of fertilizing soil surface [47,48]. These recommendations apply to trees maintained in herbicide fallow or mechanical cultivation in the tree rows. To what extent the N dose can be increased remains an open question in an orchard where living mulch replaces chemical weed control.
The aim of the present study was the assessment of high doses of N as a factor mitigating the competition between living mulch and apple tree ‘Sampion’ cv. and the impact of evaluated factors on the increase red blush on the fruit area and counteracting the decrease in the size and weight of apple.
2. Materials and Methods
2.1. Experimental Site and Design
The research work was carried out in 2015–2020 at the Fruit Experimental Station in Samotwor (51°06′12″ N, 16°49′52″ E), which belongs to the Wrocław University of Environmental and Life Sciences, in Poland. Unbranched one-year-old apple trees with an average trunk diameter 1.15 cm were planted on haplic Luvisol, in spring 2015. ‘Sampion’—an important apple cultivar in middle Europe [4]—was used, grafted onto a semi-dwarf M.26 rootstock. The distance between rows in the orchard was 3.5 m and between trees in a single row of 1.2 m, which allowed 2380 trees ha−1 to be obtained.
An experiment was established following a two-way randomized block design, with four replications. In each replication, a single treatment was represented by a plot (6 m2) with 5 apple trees. The first experimental factor was a orchard floor management system: herbicide fallow and living mulch. Additionally, two terms of sowing seeds of living mulch were used, which were performed in the second (2016) and in the fourth (2018) year after trees planting. Herbicide fallow, as a control was treated with a mix of glyphosate (1.44–1.96 kg ha−1) and MCPA (2-methyl-4-chlorophenoxyacetic acid, 0.60–1.00 kg ha−1). Their application was in spring (April or May), summer (July), and at the end of vegetation period in some years. Herbicide fallow was also applied until both living mulches were sown. The perennial living mulch was the blue fescue. The cultivars ‘Noni’ and ‘Ridu’ were sown (ratio 1:1, 50 kg seeds ha−1). The grass sod was mowed with a string trimmer (two or three times per year). Treatment with later sowing of living mulch, in the year 2018, was introduced to assess the potential for delaying the development of competition between cover crop sod and the apple trees.
The second factor in the experiment was a dose of N fertilization: 50, 80, 110, and 140 kg N ha−1. The recommendations from the then applicable methodology of integrated production [47] for apple orchards with herbicide fallow were taken into account when determining the N dose. On this basis, two doses of 50 and 80 kg N ha−1 were recommended. Two over-doses of 110 and 140 kg N ha−1 also were chosen. Compared to existing studies on N management in the orchard, the dose of 140 kg N ha−1 exceeds the N doses used in the experiments in which herbicide fallow was applied in the tree rows [23,49]. It was introduced due to the presence of an additional plant in the orchard—cover plant. It is expected that N uptake by cover crop will prevent the negative impact of a very high dose on the agricultural environment. Similarly, the use of only living mulch will eliminate the negative effects of agrochemicals in weed control, such as groundwater pollution and others that were reviewed by Mia et al. [50].
2.2. Agrotechnical Methods in Experiment
Before planting the trees, a standard fertilization dose of 100 kg P2O5 ha−1 and 200 kg K2O ha−1 was applied. The soil was not limed. In the year of planting the trees (2015), in the spring all trees were fertilized with ammonium nitrate equally (15 g N tree−1). The apple tree canopies were trained into the slender spindle. The pruning and plants protection were in accordance with the current recommendations [48]. Hand thinning of fruit sets was performed manually in the years 2016 and 2019. Irrigation interventions were applied using a relocated overhead irrigation system. Irrigation was carried out twice in the summer of 2019 and once in 2020, using a rate of water approximately 5 L tree−1.
2.3. Evaluation of Tree Growth, Yield and Fruit Quality
Number of all annual shoots were counted, and their length were measured on two selected trees in each plot, in the autumn of 2015 and 2016. The measurements of two trunk diameters, north–south and east–west direction, were made 30 cm above the grafting point of each tree, every year. Based on these, the trunk cross-sectional area (TCSA) and its annual increment were calculated, from autumn 2015 until 2020.
Three interior trees, out of five trees in each plot, were assessed for the number of flower clusters and fruit sets (2016–2018) and the number of fruits during the harvest and yield quantity (2016–2020). The crop efficiency coefficient (CEC) was computed as a ratio of the total yield of five years (2016–2020) and TCSA in autumn 2020. All collected apples were sorted manually into three groups: >75%, 25–75%, and <25% of red blush on the skin surface. The same apples were classified according to fruit diameter: <6.5; 6.5–7.5; 7.5–8.5; and >8.5 cm.
2.4. Estimation of Nutritional Status of Trees
Samples of 25 leaves from the midparts of extension shoots of three apple trees, on each plot were collected in September in the 2018 and 2020 years. Due to the fact that the sowing date of the living mulch in the fourth year after the establishment of the orchard was mid-May 2018, treatments covered by the early developing sod were omitted in the assessment of macronutrients in the 2018 year. Leaf samples were weighed, dried, once more weighed, and then grounded. On this basis, the mean fresh and dry weight of one leaf was determined. The analyses were performed at the Environmental Quality Analysis Center of the Wrocław University of Environmental and Life Sciences in the 2020 year. Leaf N concentration was determined with the automated method using an elemental CHNS analyzer [51]. Dried apple leaves were thoroughly mixed with a spoon in a paper bag and then weighed in the range of 6.1–8.7 mg using a Mettler Toledo AT21 analytical balance (Mettler-Toledo GmbH, Greifensee, Switzerland) with an accuracy of 0.01 mg. The sample was placed in a tin capsule, and total N was directly determined using a CHNS analyzer (CHNS EA 1110, CE Instruments, Wigan, UK). The sample was heated in the presence of oxygen in a quartz tube at 1030 °C, followed by combustion in the presence of tungsten trioxide as a catalyst. The combustion products were separated on a chromatographic column and measured using a thermal conductivity detector. The peak area was converted to a concentration based on a calibration curve, using EAGER 200 software, version 1:00.
Concentrations of magnesium (Mg), potassium (K), and phosphorus (P) were determined by Inductively Coupled Plasma Optical Emission Spectrometry—ICP-OES [52]. Dried and grounded apple leaves were thoroughly mixed with a spoon in a paper bag, and then weighed in the range of 0.20–0.26 g using a Sartorius AG Göttingen AC 120 S analytical balance (Sartorius, Göttingen, Germany), with an accuracy of 0.1 mg. The samples were transferred to an XP1500 Teflon vessel for mineralization. To the vessel, 2 mL of water and a mixture of aqua regia (6 mL of concentrated hydrochloric acid, 37%, and 2 mL of concentrated nitric acid, 65%) were added, and the samples were left under a lid for 24 h. Subsequently, the vessels were placed in a MARS 5 microwave mineralizer (CEM Corporation, Matthews, NC, USA) on the DRY 1.0 program, which consisted of two steps: step 1—600 W, 60% power for 20 min, and step 2—600 W, 90% power for 10 min. After cooling, the mineralizate was filtered into a 25 mL Class A volumetric flask.
The prepared sample was then analyzed using an ICP-OES inductively coupled plasma spectrometer (ICAP 7400, Thermo Fisher Scientific, Waltham, MA, USA). The sample solution was drawn using a peristaltic pump and delivered to the nebulizer. The sample, in aerosol form, was transported by argon to the plasma core, where the atoms were excited. Upon returning to their ground state, the atoms emitted electromagnetic radiation, which was directed to the spectrometer, where it was dispersed in the optical system. The optical signal was then redirected to the detector, where it was converted into a digital signal. The concentrations of the selected elements were determined based on the following spectral lines: Mg—285.213 nm (in the axial position), P—185.942 nm (in the axial position), and K—766.490 nm (in the axial position).
The interpretation of the macronutrient concentration in apple leaves was made according to Sobiczewski [48].
2.5. Weather Conditions
The average annual temperature was 9.9 °C and the sum of rainfall was 534.7 mm during last two decades (2001–2020) at the Fruit Experimental Station near by Wrocław city. Heavy hail damaged the leaves and bark on the trunks and branches in 2015. This has caused the slower growth and development of young trees in the first years after the orchard establishment. In 2017, due to average hail damage to the fruit, apple quality assessment was omitted. Detailed information on average monthly air temperatures and precipitation totals is provided in Table S1.
2.6. Statistical Processing of Data
Statistical analysis was performed using the two-way ANOVA for randomized block design, in R Studio software (version 4.3.2). Significant differences were marked * at p ≤ 0.05, ** at p ≤ 0.01, *** at p ≤ 0.001. For the data describing the share of red blush color and fruit size classes (expressed as a percentage) that do not fulfill the requirement, a normal distribution was transformed angularly by the function of Bliss. The exponential transformations were also used in the case of non-normal distribution of remaining data. Due to the death of some trees, the measurement set was balanced using the missing plot technique procedure. Both in cases when a significant ANOVA result was obtained, as well as when it was not obtained, the variables were subjected to further post hoc testing: Tukey procedure. Significant differences between means were calculated with a Tukey test at p = 0.05.
3. Results and Discussion
3.1. Growth of Trees
Total number and length of annual shoots were not significantly different on the young trees in herbicide fallow and living mulch (Table 1). However, it is worth noting that the tested population of trees in herbicide fallow was smaller than in living mulches, due to dead trees. This was most probably caused by the presence of more grubs in the soil under herbicide. This could have influenced the final result of the experiment regarding the growth of trees. Shoot length (2015–2016) was about 70 cm shorter in the herbicide fallow compared to living mulch. This is in contradiction with other experiments in which the significant reduction in total shoot growth [38] or shoot extension [44] were noted in the apple tree orchard with grass living mulch. In the case of trunk cross sectional area assessment, our results were more transparent (Table 1, Figure S1). They are also consistent with predictions, based on previous reports [37,40,44], which showed a reduction in the trunk increase or of the cross-sectional area of the trunk due to the presence of cover crops in the orchard [32,40].
In our experiment, the number and total length of shoots tended to grow when the N dose also increased (Table 1). However, there were no significant differences between treatments, which is similar to the increase in trunk cross sectional area. The application of 140 kg N ha−1, compared to 50 kg significantly affected only the weight of fresh and dry leaf, in the last year (2020) of the study (Table S2). In the pot experiment, the leaf area of the apple tree increased with the increase of the N fertilization dose [22]. In field experiments in an apple orchard with herbicide fallow, varying the N dose usually did not result in a significant effect on the tree growth [23,24]. Additionally, it is worth noting that in our experiment mean leaf weight from trees in the herbicide fallow was always significantly heavier compared to two living mulch treatments.

Table 1.
Growth of the apple tree ‘Sampion’ cv. depending on the floor management and dose of N in the tree row, in the years 2015–2020 (n = 4).
Table 1.
Growth of the apple tree ‘Sampion’ cv. depending on the floor management and dose of N in the tree row, in the years 2015–2020 (n = 4).
| Floor Management and Dose of N (kg ha−1) | Total Number of Annual Shoots | Total Length of Annual Shoots 2015–2016 (cm·Tree−1) | Trunk Cross Sectional Area (cm2) | % of Dead Trees Up to the End of 2020 ° | |||||
|---|---|---|---|---|---|---|---|---|---|
| 2015 | 2016 | Total 2015–2016 | 2015 | 2020 | Incerase 2015–2020 | ||||
| Means for interaction: N dose (D) × floor management (FM) | |||||||||
| HF | 50 | 9 a | 18 a | 27 a | 242 a | 1.20 a | 7.91 a | 6.71 a | 58 |
| 80 | 9 a | 26 a | 35 a | 406 a | 1.37 a | 5.57 a | 4.20 a | 25 | |
| 110 | 10 a | 25 a | 35 a | 466 a | 1.39 a | 7.28 a | 5.90 a | 8 | |
| 140 | 10 a | 26 a | 36 a | 379 a | 1.27 a | 5.59 a | 4.32 a | 8 | |
| LM 2 | 50 | 11 a | 26 a | 37 a | 424 a | 1.31 a | 4.60 a | 3.29 a | 25 |
| 80 | 10 a | 25 a | 35 a | 388 a | 1.33 a | 4.95 a | 3.61 a | – | |
| 110 | 11 a | 29 a | 40 a | 433 a | 1.35 a | 5.17 a | 3.82 a | 8 | |
| 140 | 9 a | 29 a | 38 a | 513 a | 1.50 a | 5.99 a | 4.49 a | – | |
| LM 4 | 50 | – | – | – | – | 1.36 a | 5.02 a | 3.66 a | 25 |
| 80 | – | – | – | – | 1.18 a | 4.56 a | 3.38 a | 33 | |
| 110 | – | – | – | – | 1.35 a | 4.59 a | 3.24 a | – | |
| 140 | – | – | – | – | 1.34 a | 5.65 a | 4.31 a | – | |
| Statistical significance D × FM | NS | NS | NS | NS | NS | NS | NS | – | |
| Means for N doses (D) | |||||||||
| 50 | 10 a | 22 a | 32 a | 333 a | 1.29 a | 5.84 a | 4.55 a | 36 | |
| 80 | 10 a | 26 a | 36 a | 397 a | 1.29 a | 5.03 a | 3.73 a | 20 | |
| 110 | 11 a | 27 a | 38 a | 450 a | 1.36 a | 5.68 a | 4.32 a | 5 | |
| 140 | 10 a | 28 a | 38 a | 446 a | 1.37 a | 5.74 a | 4.37 a | 3 | |
| Statistical significance | NS | NS | NS | NS | NS | NS | NS | – | |
| Means for floor managements (FM) | |||||||||
| HF | 10 a | 24 a | 34 a | 373 a | 1.31 a | 6.59 b | 5.28 b | 25 | |
| LM 2 | 10 a | 27 a | 37 a | 440 a | 1.37 a | 5.18 a | 3.80 a | 8 | |
| LM 4 | – | – | – | – | 1.31 a | 4.96 a | 3.65 a | 15 | |
| Statistical significance | NS | NS | NS | NS | NS | * | ** | – | |
°—without statistical evaluation; HF—herbicide fallow; LM 2—living mulch sowing in the second year after trees planting (2016); LM 4—living mulch sowing in the fourth year after trees planting (2018); *, **, ***—significantly different (ANOVA) at p ≤ 0.05, p ≤ 0.01 and p ≤ 0.001, respectively; NS—not significantly different. Means marked with different letters in each separate columns represent statistical differences among eight treatments (D × FM) or four N doses (D), or three floor managements (FM) (Tukey test, p = 0.05).
3.2. N Status of Tree
Leaf N concentration in 2018 was high in all treatments (>24.0 g kg−1) [48] and was significantly affected only by floor management (Table 2). On the contrary, two years later, it showed a significant effect only on the N dose. In 2020, the N concentration remained at a high (>24.0 g kg−1) [48] or optimal (21.0–24.0 g kg−1) [48] level. It decreased to a low (18.0–20.9 g kg−1) [48] level only in the herbicide fallow treatment with fertilization of 50 kg N ha−1.
Table 2.
Concentration of macronutrients in leaves of the apple tree ‘Sampion’ cv. depending on the floor management and dose of N in the tree row in the years 2018 and 2020 (n = 4).
Compared to herbicide fallow, the N concentration in leaves (2018) was significantly lower in living mulch, sown already in the second year after the orchard establishment (Table 2). Despite this, it still remained at a high level as in the experiment with young apple trees of the ‘Elshof’ cv. with grass living mulch [38]. It did not decrease to a low or deficit level like in the young orchard of ‘Ligol’ cv. [37]. Two years later (2020), apple trees grown in living mulch, sown in the second year after their planting, still had a high N concentration in leaves. The optimal level was observed in the trees in herbicide fallow and in living mulch sown in the fourth year. However, the N concentration differences among these floor managements were not significant.
In 2020, the N concentration in leaves was primarily significantly influenced by the applied fertilizer dose (Table 2). It increased with the use of larger doses. A significantly higher concentration was shown only with the use 110 kg ha−1, compared to 50 kg. This trend was transparent on trees grown in herbicide fallow, which is consistent with other studies on fertilization in apple orchards [26,49,53]. Hogue et al. [40] suggested that N tree status is mostly determined by annual N fertigation instead of by floor management. Other experiments confirmed that, because of a high organic fertilization rate corresponding to about 110 kg N ha−1, foliar N concentration remained at the same level regardless of whether mechanical tillage or legume living mulch was used in the tree rows [19]. These results are consistent with our studies, which emphasize the importance of N dose selection rather than floor management as a factor regulating N supply to trees. It is worth emphasizing, however, that too small an N supply may be insufficient to overcome the competition of cover crops in the apple orchard [44]. The relatively weak growth of all trees in our experiment (Table 1) resulted in a low N demand of trees. This is probably why the interaction of the studied factors was often insignificant (Table 2).
3.3. Mg, K, and P Status of Tree
The two studied factors and their interaction had no effect on Mg concentration in the leaf in 2018, probably because it remained on low level (1.8–2.1 g kg−1) [48] in all studied treatments (Table 2). Two years later, the significance of statistical analysis was shown; however, its meaning was reduced by the fact that the Mg concentration was already deficient (<1.8 g kg−1) [48]. Such a low level of Mg was not recorded in apple leaves in other experiments that evaluated living mulch [37,40,54]. The leaves of the apple trees grown in herbicide fallow and fertilized with various doses of N, also in other studies, did not contain such little concentration of this macronutrient [49,53]. The deficiency of this element has serious consequences for the tree growth and yield [55].
In 2018, the concentration of K in the leaves was often low (7.0–9.9 g kg−1) [48] and in the case of some treatments in herbicide fallow deficit (<7.0 g kg−1) [48] (Table 2). Two years later (2020), apple trees in the herbicide fallow often had low K levels. Significantly higher levels, at an optimal level (10.0–15.0 g kg−1) [48], were recorded when living mulch was present.
Leaf K concentration was significantly affected by floor management and, only in 2020, the N dose and the interaction of both factors (Table 2). It was in contrary to the study of Hogue et al. [40], in which the use of different living mulches and varying N supply had no effect on the K concentration in apple leaves. Similarly, a double N dose for apple trees maintained in the herbicide fallow had no impact on K leaf status [49,53].
The concentration of P significantly varied depending on estimated factors (Table 2). Similar to K, it was significantly affected by floor management, N dose, and the interaction two factors, but only in 2020. The concentration of this macronutrient was optimal (1.5–2.6 g kg−1) [48] in herbicide fallow and high (>2.6 g kg−1) [48] in living mulches, in 2018 and 2020. It confirmed other study reports that the presence of cover plants in the orchard stabilizes P status of the tree [37]. In 2020, its concentration was significantly higher in all living mulch with different N dose treatments, compared to the herbicide fallow with 50 kg N ha−1.
3.4. Yield of Tree and Crop Efficiency Coefficient
Total yield was significantly influenced by floor management (Table 3). The expected effect of the living mulch presence was a significant reduction in yield in the living mulch sown in the second year after trees planting. Our studies confirmed earlier observations in young apple orchards with grass living mulches [37,38,40,56]. Delaying grass living mulch seeds sowing until the fourth year after tree planting also significantly reduced yield compared to herbicide fallow. The competition of grass sod with apple trees was particularly evident after two years of the cover crop presence (Figure S2). The year 2018 concerned trees cultivated in living mulch, which was sown in the second year after the orchard establishment. Analogously, in 2020, it was observed on trees that have been grown in living mulch since the fourth year after their planting.
The presence of grass sod in the orchard was probably the direct cause of the high yield variability between the study years. The especially drastic decrease in the number of fruit sets and fruit observed on trees in 2018 was due to the competition of sod already sown in the second year (Table S3). Abiotic factors, e. g. high mean temperature in May 2018 (Table S1), which increased evapotranspiration and reduced water availability for the tree, also influenced the formation of very few fruit sets. This affected the lowest yield of the tree (Table 3). A low Mg and K level in leaves (Table 2) also contributed to the significant decrease in total yield of the tree in both living mulches. However, the yield level in herbicide fallow was also relatively low for a highly valued ‘Sampion’ cv. in Central Europe [4].
The unexpectedly low yield of all experimental trees was the result of biotic and abiotic factors shaping the growth and cropping of apple trees. Unbranched one-year old trees were planted in the experiment. The use of such nursery plant material delays the entry of trees into the fruiting period [57]. In the year of planting (2015) as well as in 2018–2019, very low rainfall was recorded (Table S1). Unfavorable water conditions at high air temperatures caused spring or summer drought periods, noticeable in cultivation without irrigation. In addition, the trees suffered severe damage to the leaves and bark of the trees in the year of their planting (2015), as a result of strong hail in July. Grubs appeared in the experiment causing damage to the root system or even the death of trees (Table 1). Trees with damaged root systems were weaker. Additionally, once more it is important to mention that leaf analyses showed a proper N supply, but the trees already had low Mg concentrations in 2018, and at the end of the study (2020) they were most often deficient. This nutrient, present in chlorophyll, serves important biochemical functions in the plant, and its serious deficiency can cause a reduction in canopy photosynthesis and fruit size [55].
Table 3.
Yield, fruit number, and the crop efficiency coefficient of the apple tree ‘Sampion’ cv. depending on the floor management and the dose of N in the tree row, in the years 2016–2018 (n = 4).
Table 3.
Yield, fruit number, and the crop efficiency coefficient of the apple tree ‘Sampion’ cv. depending on the floor management and the dose of N in the tree row, in the years 2016–2018 (n = 4).
| Floor Management and Dose of N (kg ha−1) | Total Yield 2016–2020 (kg·Tree−1) | Total Number of Fruit 2016–2020 (no·Tree−1) | Crop Efficiency Coefficient 2020 (kg·cm−2) | |
|---|---|---|---|---|
| Means for interaction: N dose (D) × floor management (FM) | ||||
| HF | 50 | 11.64 ab | 131 ab | 1.48 abc |
| 80 | 13.92 ab | 161 ab | 2.56 de | |
| 110 | 20.77 b | 219 b | 2.77 e | |
| 140 | 14.92 ab | 174 ab | 2.54 cde | |
| LM 2 | 50 | 6.26 a | 75 a | 1.38 ab |
| 80 | 6.42 a | 66 a | 1.24 ab | |
| 110 | 8.49 a | 89 ab | 1.63 abcd | |
| 140 | 5.32 a | 76 a | 0.89 a | |
| LM 4 | 50 | 10.58 ab | 166 ab | 2.14 bcde |
| 80 | 6.27 a | 86 ab | 1.40 ab | |
| 110 | 9.54 ab | 136 ab | 2.00 bcde | |
| 140 | 12.83 ab | 163 ab | 2.24 bcde | |
| Statistical significance D × FM | NS | NS | ** | |
| Means for N doses (D) | ||||
| 50 | 9.49 a | 124 a | 1.66 a | |
| 80 | 8.87 a | 104 a | 1.73 a | |
| 110 | 12.93 a | 148 a | 2.13 a | |
| 140 | 11.02 a | 138 a | 1.89 a | |
| Statistical significance | NS | NS | NS | |
| Means for floor managements (FM) | ||||
| HF | 15.31 b | 171 b | 2.34 c | |
| LM 2 | 6.62 a | 77 a | 1.28 a | |
| LM 4 | 9.81 a | 138 b | 1.94 b | |
| Statistical significance | *** | *** | *** | |
HF—herbicide fallow, LM 2—living mulch sowing in the second year after trees planting (2016), LM 4—living mulch sowing in the fourth year after trees planting (2018). *, **, ***—significantly different (ANOVA) at p ≤ 0.05, p ≤ 0.01, and p ≤ 0.001, respectively; NS—not significantly different. Means marked with different letters in each separate columns represent statistical differences among eight treatments (D × FM) or four N doses (D), or three floor managements (FM) (Tukey test, p = 0.05).
On the one hand, it can be assumed that the low annual cropping level of all trees in the experiment depended on the complex of the above-mentioned biotic and abiotic factors. Multi-interaction impact could also contribute to the insignificant effect of different N doses on total yield and crop efficiency coefficient (Table 3). On the other hand, in reports focused on apple trees in herbicide fallow, increasing the N dose of fertilization [23,24] or fertigation [26] also did not have a significant effect on total yield.
The presence of grass sod under trees, irrespective of four tested N doses, significantly reduced the total yield compared to herbicide fallow with 110 kg N ha−1. Such difficulties in eliminating the competition of living mulch for fruit trees are confirmed by the study of Tahir et al. [44]. In our experiment, the potential of grass sod to uptake N was probably higher than its importance in N cycling. Unfortunately, our study did not include soil testing or water availability after several years of cultivation. In addition, equal N fertilization of the entire plot surface favored good N uptake by the grass population. Not only the fruit tree but the cover crop was privileged. This also could have determined the insignificant importance of N doses for apple trees and the failure of different N doses as a factor mitigating living mulch competition in the orchard.
3.5. Red Blush, Mean Weight, and the Size of Fruit
Good fruit coloration was noted every year (Figure 1). The share of yield with sporadic red blush that did not exceed 25% of the skin surface was marginal. It appeared only in the first and last year of the study. The largest share of yield with the best colored apples was recorded in 2018. In this year, in September the precipitation was low (Table S1). During the apple ripening period, more days with minimum air temperature below 5 °C were recorded compared to the following years of the study [56]. Such thermal and water conditions favor the red blushing of apples [58].
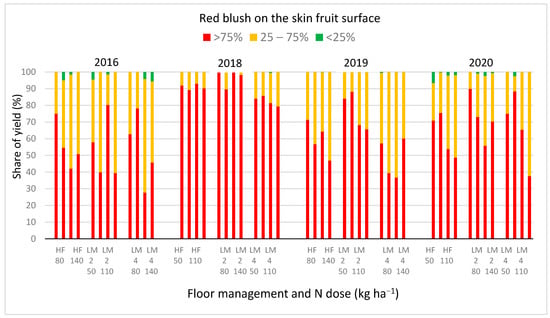
Figure 1.
Red blush on the apple skin surface of ‘Sampion’ cv. depending on dose of N, from trees grown in herbicide fallow (HL) or cultivated in living mulch sowing in the second (LM 2) or in the fourth (LM 4) year after trees planting, in the years 2016–2020.
Two studied agrotechnical factors—floor management and the dose of N fertilization significantly affected the red blushing of apples, but their interaction did not (Table 4). The average share of yield with fruit blush exceeding 75% of the skin surface was significantly higher on trees grown in live mulch sown in the second year after trees planting, compared to the fourth year. This phenomenon could result from a significantly lower total number of fruits on these trees, especially in 2018 (Table S3). In both living mulches, compared to herbicide fallow, the share of apples with red blush over 75% and 25–75% of the skin surface was not significantly different. Experiments in other young orchards showed the opposite results, and the presence of the cover crop was considered as a factor guaranteeing improvement in apple red coloration [37,38]. However, in the case of older trees, differences in red color on the fruit surface were not significant [37], nor was the difference in anthocyanin synthesis in the skin of apples [33].
Granatstein and Mullinix [41] suggested that floor management providing higher N in the soil tends to affect a smaller share of red color surface on the apple skin. Our studies confirmed such trends. A significantly higher share of apples with blush exceeding 75% of the skin surface was observed when the dose of 50 kg N ha−1 was used, compared to 140 kg. The limited red blush of apples is related to the good N supply of trees. High availability of this macronutrient affects excessive shoot growth, which is in conflict with the quantitatively satisfactory synthesis of anthocyanins, which conditions the red skin color [25]. The total length of annual shoots of ‘Sampion’ trees increased with the change in N dose from 50 to 140 kg N ha−1, but it was not significantly different (Table 1). However, it can be assumed that the trend of stronger growth of apple canopies continued in the subsequent years of the trees’ lives. The application of 110 and 140 kg N ha−1 probably impacted the synthesis of red pigment in the fruit. It determined the limitation of the share of yield with red skin surface over 75%, observed in 2019 and especially in 2020 (Figure 1).
In all tested treatments, apples of the ‘Sampion’ cv. were small, often with a diameter below 6.5 cm (Table 4). This was particularly visible in 2019, and to a lesser extent in 2018 (Figure 2). These two years, compared to the years 2016 and 2020 were characterized by very low total precipitation and high unevenness of its distribution in the summer (Table S1). Additionally, very high air temperatures were recorded from July to August. According to Musacchi and Serra [58], the final quality of the fruit is strongly determined by environmental and agronomic factors, which were observed in our experiment. Environmental conditions dominated over the tested factors: floor management and N doses. Probably for this reason, both the fruit size and weight were not significantly affected by both studied factors (Table 4). In studies by other authors [37,38,59], replacing herbicide fallow with living mulch affected the diminutive of fruit in the first years of fruiting trees. In the light of these studies, the expected loss of weight or increase share of yield with small size apples in living mulch was considered marginal and insignificant. However, it should be taken into account that the fruit number was significantly lower in the case of trees grown in living mulch sown in the second year after planting (Table 3). This limited mutual competition of fruit sets allowed them to grow to the level achieved by apples on significantly better yielding trees in herbicide fallow (Table 3, Figure S2). Due to the very small number of fruits, the negative effect of living mulch on the apple size was not revealed in the presented experiment.
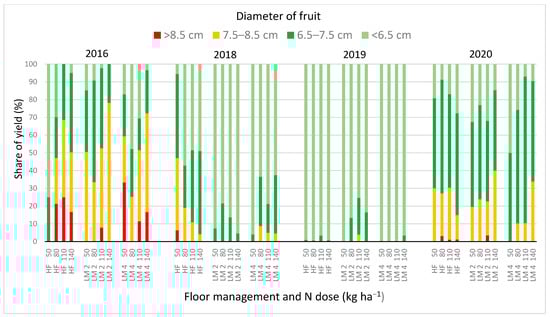
Figure 2.
Sizes of the apple fruit ‘Sampion’ cv. depending on dose of N, from trees grown in herbicide fallow (HL) or cultivated in living mulch sowing in the second (LM 2) or in the fourth (LM 4) year after tree planting, in the years 2016–2020.
The second experimental factor—N doses had no significant effect on size, weight, and the yield of apple trees (Table 3 and Table 4). Similarly to our experiment, the cultivar ‘Sampion’ [23] and also ‘Jonagored’ [24] did not respond with a significant change in the fruit weight, under the influence of different N treatments in the orchard with herbicide fallow. It is worth noting, however, that the tendency to increase the total fruit number, when doses above 100 kg N ha−1 were used (Table 3), was accompanied by a tendency to increase the share of large size apples, with a diameter exceeding 7.5 cm (Table 4).
Table 4.
Fruit quality of the apple ‘Sampion’ cv. depending on the floor management and dose of N in the tree row (mean for years 2016–2020 (n = 4)).
Table 4.
Fruit quality of the apple ‘Sampion’ cv. depending on the floor management and dose of N in the tree row (mean for years 2016–2020 (n = 4)).
| Floor Management and Dose of N (kg ha−1) | % of Fruit with Blush on the Skin Surface | % of Fruit with Diameter (cm) | Mean Fruit Weight (g) | ||||||
|---|---|---|---|---|---|---|---|---|---|
| >¾ | ¼–¾ | <¼ ° | >8.5 ° | 7.5–8.5 | 6.5–7.5 | <6.5 | |||
| Means for interaction: N dose (D) × floor management (FM) | |||||||||
| HF | 50 | 77 a | 21 a | 2 | 2 | 18 a | 31 a | 50 a | 108 a |
| 80 | 69 a | 30 a | 1 | 6 | 17 a | 28 a | 49 a | 110 a | |
| 110 | 63 a | 36 a | 1 | 7 | 21 a | 32 a | 41 a | 124 a | |
| 140 | 59 a | 40 a | – | 4 | 13 a | 37 a | 45 a | 107 a | |
| LM 2 | 50 | 83 a | 16 a | 1 | – | 18 a | 23 a | 60 a | 98 a |
| 80 | 73 a | 27 a | – | – | 14 a | 36 a | 49 a | 96 a | |
| 110 | 76 a | 23 a | 1 | 3 | 17 a | 31 a | 49 a | 105 a | |
| 140 | 68 a | 31 a | – | – | 30 a | 22 a | 48 a | 98 a | |
| LM 4 | 50 | 70 a | 30 a | – | 8 | 6 a | 19 a | 66 a | 99 a |
| 80 | 73 a | 26 a | 1 | – | 11 a | 30 a | 59 a | 94 a | |
| 110 | 53 a | 46 a | 1 | 3 | 14 a | 29 a | 54 a | 93 a | |
| 140 | 56 a | 43 a | 1 | 4 | 24 a | 29 a | 43 a | 111 a | |
| Statistical significance D × FM | NS | NS | – | – | NS | NS | NS | NS | |
| Means for N doses (D) | |||||||||
| 50 | 77 b | 22 a | 1 | 3 | 14 a | 24 a | 58 a | 102 a | |
| 80 | 72 ab | 28 ab | 1 | 2 | 14 a | 31 a | 52 a | 100 a | |
| 110 | 64 ab | 35 ab | 1 | 4 | 17 a | 31 a | 48 a | 107 a | |
| 140 | 61 a | 38 b | 1 | 3 | 22 a | 30 a | 46 a | 105 a | |
| Statistical significance | * | * | – | – | NS | NS | NS | NS | |
| Means for floor managements (FM) | |||||||||
| HF | 67 ab | 32 ab | 1 | 5 | 17 a | 32 a | 46 a | 112 a | |
| LM 2 | 75 b | 24 a | 1 | 1 | 20 a | 28 a | 52 a | 99 a | |
| LM 4 | 63 a | 36 b | 1 | 4 | 14 a | 27 a | 56 a | 99 a | |
| Statistical significance | * | * | – | – | NS | NS | NS | NS | |
°—without stastistical evaluation; HF—herbicide fallow; LM 2—living mulch sowing in the second year after trees planting (2016); LM 4—living mulch sowing in the fourth year after trees planting (2018); *, **, ***—significantly different (ANOVA) at p ≤ 0.05, p ≤ 0.01 and p ≤ 0.001, respectively; NS—not significantly different. Means marked with different letters in each separate columns represent statistical differences among eight treatments (D × FM) or four N doses (D), or three floor managements (FM) (Tukey test, p = 0.05).
4. Conclusions
The growth and development of ‘Sampion’ cv. under the condition at the Fruit Experimental Station near by Wrocław (southwest part of Poland) were strongly influenced by both biotic and abiotic stress factors as well as the two experimental factors. The result of their action was the impact on low yield and a reduction in growth of all the tested trees. Despite these challenges, the conducted studies have been shown to have an effect of living mulch as a factor significantly limiting the level of apple tree production, but they improve the red color on the fruit skin surface. In contrast to floor management, the assessment of the second factor—dose of N is not that clear. Different doses of fertilization from 50 to 110 kg N ha−1 had no significant effect on annual shoot growth, increase in trunk cross sectional area, total yield, fruit weight and size on trees in herbicide fallow and living mulches. Application of the highest dose of 140 kg N ha−1 had a significant negative effect on the red blushing of apples. Different N doses had a minor effect on the tree compared to the impact of biotic and abiotic stress factors, including Mg deficiency. As a final outcome, with objectively low yield and poor growth, of all trees tested in the experiment, their N needs were satisfied by a dose of 50 kg ha−1.
The cultivation of apple trees of the ‘Sampion’ cv. in the presence of cover crops should be more associated with the elimination of abiotic stress factors, which can promote the increase in importance of agrotechnical factors. It can be assumed, that the growth and yield of apple trees in living mulch would be better with the addition of more than 50 kg N ha−1. Considering the development of red blush on the fruit skin surface, this dose should not exceed about 110 kg N ha−1. It also seems important to pay attention to giving up the even distribution of N over the entire surface in the tree rows. Precise local fertilization under the tree would be more conducive to the uptake of fertilizer by apple trees than by the grass sod. Thus, it would enable more effective use of this macronutrient. The development of proper N fertilization technology for apple trees with living mulch requires further research on varied apple tree cultivars under different climate and soil conditions.
Supplementary Materials
The following supporting information can be downloaded at: https://www.mdpi.com/article/10.3390/agriculture15070724/s1, Table S1. Total precipitation and mean temperatures at the Wrocław-Strachowice Station (51°12′ N. 16°87′ E) in the years 2015–2020; Table S2. Mean weight of the fresh and dry leaf of the apple tree ‘Sampion’ cv. depending on the floor management and dose of nitrogen in the tree row, in the year 2018 and 2020 (n = 4); Table S3. Number of flower clusters, fruit sets and fruits on the apple tree ‘Sampion’ cv. depending on the floor management and dose of N in the tree row, in the years 2016–2018 (n = 4); Figure S1. Trunk cross sectional area of the apple tree ‘Sampion’ cv. depending on the floor management and dose of N in the tree row, in the years 2015–2020 (cm2); Figure S2. Yield per tree of the apple tree ‘Sampion’ cv. depending on the floor management and dose of N in the tree row, in the years 2015–2020 (kg tree−1).
Funding
This work was supported by the Wrocław University of Environmental and Life Sciences (Poland) as a part of the research program ‘MISTRZ’, no. N090/0012/22.
Institutional Review Board Statement
Not applicable.
Data Availability Statement
All data are present in the manuscript and Supplementary Materials.
Acknowledgments
I would like to thank each person who help me in setting up the experiment and valuable suggestions on how to evaluate the trees.
Conflicts of Interest
The author declares no conflicts of interest.
References
- Mia, M.J.; Furmanczyk, E.M.; Golian, J.; Kwiatkowska, J.; Malusá, E.; Neri, D. Living Mulch with Selected Herbs for Soil Management in Organic Apple Orchards. Horticulturae 2021, 7, 59. [Google Scholar] [CrossRef]
- Furmanczyk, E.M.; Malusà, E.; Kozacki, D.; Tartanus, M. Insights into the Belowground Biodiversity and Soil Nutrient Status of an Organic Apple Orchard as Affected by Living Mulches. Agriculture 2024, 14, 293. [Google Scholar] [CrossRef]
- Diyanat, M. Weed Management in Organic Horticulture by Cover Crop in Iran. Int. J. Adv. Biol. Biomed. Res. 2015, 3, 153–162. [Google Scholar]
- Muder, A.; Garming, H.; Dreisiebner-Lanz, S.; Kerngast, K.; Rosner, F.; Klickova, K.; Kurthy, G.; Cimer, K.; Bertazzoli, A.; Altamura, V.; et al. Apple Production and Apple Value Chains in Europe. Eur. J. Hortic. Sci. 2022, 87, 1–22. [Google Scholar]
- Lemessa, F.; Wakjira, M. Cover Crops as a Means of Ecological Weed Management in Agroecosystems. J. Crop Sci. Biotechnol. 2015, 18, 133–145. [Google Scholar] [CrossRef]
- Haring, S.; Gaudin, A.C.M.; Hanson, B.D. Functionally Diverse Cover Crops Support Ecological Weed Management in Orchard Cropping Systems. Renew. Agric. Food Syst. 2024, 38, e54. [Google Scholar] [CrossRef]
- Schappert, A.; Linn, A.I.; Sturm, D.J.; Gerhards, R. Weed Suppressive Ability of Cover Crops Under Water-Limited Conditions. Plant Soil Environ. 2019, 65, 541–548. [Google Scholar] [CrossRef]
- Smith, R.G.; Warren, N.D.; Cordeau, S. Are Cover Crop Mixtures Better at Suppressing Weeds than Cover Crop Monocultures? Weed Sci. 2020, 68, 186–194. [Google Scholar] [CrossRef]
- Żelazny, W.R.; Licznar-Małańczuk, M. Living Mulch Persistence in an Apple Orchard and Its Effect on the Weed Flora in Temperate Climatic Conditions. Weed Res. 2022, 62, 85–99. [Google Scholar] [CrossRef]
- Bałuszyńska, U.B.; Chaploutskyi, A.; Polunina, O.; Slobodianyk, L.; Licznar-Małańczuk, M. Grass Species as a Living Mulch—Impact of Sod and Its Weediness on Apple Trees. Acta Agrobot. 2023, 76, 172257. [Google Scholar] [CrossRef]
- Golian, J.; Anyszka, Z.; Kwiatkowska, J. Multifunctional Living Mulches for Weeds Control in Organic Apple Orchards. Acta Sci. Pol. Hortorum Cultus 2023, 22, 73–84. [Google Scholar] [CrossRef]
- Bałuszyńska, U.B.; Rowińska, M.; Licznar-Małańczuk, M. Grass Species as Living Mulches—Comparison of Weed Populations and Their Biodiversity in Apple Tree Rows and Tractor Alleys. Acta Agrobot. 2022, 75, 758. [Google Scholar] [CrossRef]
- Mulumba, L.N.; Lal, R. Mulching Effects on Selected Soil Physical Properties. Soil. Tillage Res. 2008, 98, 106–111. [Google Scholar] [CrossRef]
- Qian, X.; Gu, J.; Pan, H.J.; Zhang, K.Y.; Sun, W.; Wang, X.J.; Gao, H. Effects of Living Mulches on the Soil Nutrient Contents, Enzyme Activities, and Bacterial Community Diversities of Apple Orchard Soils. Eur. J. Soil. Biol. 2015, 70, 23–30. [Google Scholar] [CrossRef]
- Ramos, M.E.; Robles, A.B.; Sánchez-Navarro, A.; González-Rebollar, J.L. Soil Responses to Different Management Practices in Rainfed Orchards in Semiarid Environments. Soil Tillage Res. 2011, 112, 85–91. [Google Scholar] [CrossRef]
- Brewer, M.; Kanissery, R.G.; Strauss, S.L.; Kadyampakeni, D.M. Impact of Cover Cropping on Temporal Nutrient Distribution and Availability in the Soil. Horticulturae 2023, 9, 1160. [Google Scholar] [CrossRef]
- St. Laurent, A.; Merwin, I.A.; Thies, J.E. Long-Term Orchard Groundcover Management Systems Affect Soil Microbial Communities and Apple Replant Disease Severity. Plant Soil 2008, 304, 209–225. [Google Scholar] [CrossRef]
- Yang, J.; Duan, Y.; Zhang, R.; Liu, C.; Wang, Y.; Li, M.; Ding, Y.; Awasthi, M.K.; Li, H. Connecting Soil Dissolved Organic Matter to Soil Bacterial Community Structure in a Long-Term Grass-Mulching Apple Orchard. Ind. Crops Prod. 2020, 149, 112344. [Google Scholar] [CrossRef]
- Hoagland, L.; Carpenter-Boggs, L.; Granatstein, D.; Mazzola, M.; Smith, J.; Peryea, F.; Reganold, J.P. Orchard Floor Management Effects on Nitrogen Fertility and Soil Biological Activity in a Newly Established Organic Apple Orchard. Biol. Fertil Soils 2008, 45, 11–18. [Google Scholar] [CrossRef]
- Atucha, A.; Merwin, I.A.; Purohit, C.K.; Brown, M.G. Nitrogen Dynamics and Nutrient Budgets in Four Orchard Groundcover Management Systems. HortScience 2011, 46, 1184–1193. [Google Scholar] [CrossRef]
- Brunetto, G.; Oliveira, B.S.; Ambrosini, V.G.; Couto, R.d.R.; Sete, P.B.; dos Santos Junior, E.; Loss, A.; Stefanello da Silva, L.O.; Gatiboni, L.C. Nitrogen Availability in an Apple Orchard with Weed Management. Cienc. Rural 2018, 48, e20160895. [Google Scholar] [CrossRef]
- Rühmann, S.; Leser, C.; Bannert, M.; Treutter, D. Relationship Between Growth, Secondary Metabolism, and Resistance of Apple. Plant Biol. 2002, 4, 137–143. [Google Scholar] [CrossRef]
- Wrona, D. Effect of Nitrogen Fertilization on Growth, Cropping and Fruit Quality of “Šampion” Apple Trees During 9 Years After Planting. Folia Hortic. 2004, 16, 55–60. [Google Scholar]
- Wrona, D. The Influence of Nitrogen Fertilization on Growth, Yield and Fruit Size of “Jonagored” Apple Trees. Acta Sci. Pol. Hortorum Cultus 2011, 10, 3–10. [Google Scholar]
- Treutter, D. Biosynthesis of Phenolic Compounds and Its Regulation in Apple. Plant Growth Regul. 2001, 34, 71–89. [Google Scholar]
- Neilsen, G.H.; Neilsen, D.; Herbert, L. Nitrogen Fertigation Concentration and Timing of Application Affect Nitrogen Nutrition, Yield, Firmness, and Color of Apples Grown at High Density. HortScience 2009, 44, 1425–1431. [Google Scholar]
- Veberic, R. The Impact of Production Technology on Plant Phenolics. Horticulturae 2016, 2, 8. [Google Scholar] [CrossRef]
- Mikulic-Petkovsek, M.; Slatnar, A.; Stampar, F.; Veberic, R. The Influence of Organic/Integrated Production on the Content of Phenolic Compounds in Apple Leaves and Fruits in Four Different Varieties over a 2-Year Period. J. Sci. Food Agric. 2010, 90, 2366–2378. [Google Scholar] [CrossRef]
- Roussos, P.A.; Gasparatos, D. Apple Tree Growth and Overall Fruit Quality under Organic and Conventional Orchard Management. Sci. Hortic. 2009, 123, 247–252. [Google Scholar] [CrossRef]
- Le Bourvellec, C.; Bureau, S.; Renard, C.M.G.C.; Plenet, D.; Gautier, H.; Touloumet, L.; Girard, T.; Simon, S. Cultivar and Year Rather than Agricultural Practices Affect Primary and Secondary Metabolites in Apple Fruit. PLoS ONE 2015, 10, e0141916. [Google Scholar] [CrossRef]
- TerAvest, D.; Smith, J.L.; Carpenter-Boggs, L.; Hoagland, L.; Granatstein, D.; Reganold, J.P. Influence of Orchard Floor Management and Compost Application Timing on Nitrogen Partitioning in Apple Trees. HortScience 2010, 45, 637–642. [Google Scholar] [CrossRef]
- Slatnar, A.; Licznar-Malanczuk, M.; Mikulic-Petkovsek, M.; Stampar, F.; Veberic, R. Long-Term Experiment with Orchard Floor Management Systems: Influence on Apple Yield and Chemical Composition. J. Agric. Food Chem. 2014, 62, 4095–4103. [Google Scholar] [CrossRef] [PubMed]
- Slatnar, A.; Kwiecinska, I.; Licznar-Malanczuk, M.; Veberic, R. The Effect of Green Cover within Rows on the Qualitative and Quantitative Fruit Parameters of Full-Cropping Apple Trees. Hortic. Environ. Biotechnol. 2020, 61, 41–49. [Google Scholar] [CrossRef]
- Lee, J.; Steenwerth, K.L. “Cabernet Sauvignon” Grape Anthocyanin Increased by Soil Conservation Practices. Sci. Hortic. 2013, 159, 128–133. [Google Scholar] [CrossRef]
- Sosna, I.; Fudali, E. Usefulness of Living Mulch in Rows in a Dwarf Pear, Pyrus communis L., Orchard. Agriculture 2023, 13, 2145. [Google Scholar] [CrossRef]
- Kühn, B.F.; Lindhard Pedersen, H. Cover Crop and Mulching Effects on Yield and Fruit Quality in Unsprayed Organic Apple. Eur. J. Hortic. Sci. 2009, 74, 247–253. [Google Scholar] [CrossRef]
- Licznar-Małańczuk, M.; Kwiecińska, I. Application of Living Mulch in Rows of the Apple Trees on Several Rootstock—Long-Term Evaluation. Acta Sci. Pol. Hortorum Cultus 2023, 22, 79–90. [Google Scholar] [CrossRef]
- Andersen, L.; Kühn, B.F.; Bertelsen, M.; Bruus, M.; Larsen, S.E.; Strandberg, M. Alternatives to Herbicides in an Apple Orchard, Effects on Yield, Earthworms and Plant Diversity. Agric. Ecosyst. Environ. 2013, 172, 1–5. [Google Scholar] [CrossRef]
- Kopta, T.; Ragasová, L.N.; Sotolář, R.; Sedláček, J.; Ferby, V.; Hurajová, E.; Winkler, J. The Influence of Different Methods of Under-Vine Management on the Structure of Vegetation and the Qualitative Parameters of the Grapes in the Moravian Wine Region. Folia Hortic. 2024, 36, 235–257. [Google Scholar] [CrossRef]
- Hogue, E.J.; Cline, J.A.; Neilsen, G.; Neilsen, D. Growth and Yield Responses to Mulches and Cover Crops under Low Potassium Conditions in Drip-Irrigated Apple Orchards on Coarse Soils. HortScience 2010, 45, 1866–1871. [Google Scholar] [CrossRef]
- Granatstein, D.; Mullinix, K. Mulching Options for Northwest Organic and Conventional Orchards. HortScience 2008, 43, 45–50. [Google Scholar] [CrossRef]
- Tworkoski, T. Response of Potted Peach Trees to Pruning and Grass Competition. HortScience 2000, 35, 1209–1212. [Google Scholar] [CrossRef]
- Hoagland, L.; Carpenter-Boggs, L.; Granatstein, D.; Mazzola, M.; Peryea, F.; Smith, J.; Reganold, J. Nitrogen Cycling and Partitioning under Alternative Organic Orchard Floor Management Strategies. In Proceedings of the Western Nutrient Management Conference, Salt Lake City, UT, USA, 4–5 March 2007; pp. 117–123. [Google Scholar]
- Tahir, I.I.; Svensson, S.-E.; Hansson, D. Floor Management Systems in an Organic Apple Orchard Affect Fruit Quality and Storage Life. HortScience 2015, 50, 434–441. [Google Scholar] [CrossRef]
- Merwin, I.A.; Stiles, W.C. Orchard Groundcover Management Impacts on Apple Tree Growth and Yield, and Nutrient Availability and Uptake. J. Am. Soc. Hort. Sci. 1994, 119, 209–215. [Google Scholar] [CrossRef]
- Neilson, G.H.; Hogue, E.J. Comparison of White Clover and Mixed Sodgrass as Orchard Floor Vegetation. Can. J. Plant Sci. 2000, 80, 617–622. [Google Scholar] [CrossRef]
- Metodyka Integrowanej Produkcji Jabłek (Methodology of Integrated Apple Production); Sobiczewski, P., Ed.; Institute of Horticulture: Skierniewice, Poland, 2013. [Google Scholar]
- Metodyka Integrowanej Produkcji Jabłek (Methodology of Integrated Apple Production); Sobiczewski, P., Ed.; Institute of Horticulture: Skierniewice, Poland, 2020. [Google Scholar]
- Kowalczyk, W.; Wrona, D.; Przybyłko, S. Effect of Nitrogen Fertilization of Apple Orchard on Soil Mineral Nitrogen Content, Yielding of the Apple Trees and Nutritional Status of Leaves and Fruits. Agriculture 2022, 12, 169. [Google Scholar] [CrossRef]
- Mia, M.J.; Massetani, F.; Murri, G.; Neri, D. Sustainable Alternatives to Chemicals for Weed Control in the Orchard—A Review. Hortic. Sci. 2020, 47, 1–12. [Google Scholar] [CrossRef]
- Gautam, V.P.; Mishra, S.; Ahmed, H. Comparison of Total Nitrogen Estimation by Kjeldahl Method and CHNS Analyzer in Dry Tropical Grassland. Int. J. Plant Environ. 2023, 9, 180–182. [Google Scholar] [CrossRef]
- Sharma, I. ICP-OES: An Advance Tool in Biological Research. Open J. Environ. Biol. 2020, 5, 027–033. [Google Scholar] [CrossRef]
- Kowalczyk, W.; Wrona, D.; Przybyłko, S. Content of Minerals in Soil, Apple Tree Leaves and Fruits Depending on Nitrogen Fertilization. J. Elem. 2017, 22, 67–77. [Google Scholar] [CrossRef]
- Sánchez, E.E.; Giayetto, A.; Cichón, L.; Fernández, D.; Aruani, M.C.; Curetti, M. Cover Crops Influence Soil Properties and Tree Performance in an Organic Apple (Malus domestica Borkh) Orchard in Northern Patagonia. Plant Soil 2007, 292, 193–203. [Google Scholar] [CrossRef]
- Neilsen, G.H.; Neilsen, D. Nutritional Requirements of Apple. In Apples: Botany, Production, and Uses; Ferree, D.C., Warrington, I.J., Eds.; CABI Publishing: Wallingford, UK, 2015; pp. 267–302. [Google Scholar]
- Licznar-Malanczuk, M.; Baluszynska, U.B. Do Living Mulches or Environmental Conditions Have a Greater Impact on the External Quality of the Apple Fruit ‘Chopin’ Cultivar? Agriculture 2024, 14, 610. [Google Scholar] [CrossRef]
- Gudarowska, E.; Szewczuk, A. The Influence of Agro-Technical Methods Used in the Nursery on Quality of Planting Material and Precocity of Bearing in Young Apple Trees in the Orchard. J. Fruit Ornam. Plant Res. 2004, 12, 91–96. [Google Scholar]
- Musacchi, S.; Serra, S. Apple Fruit Quality: Overview on Pre-Harvest Factors. Sci. Hortic. 2017, 234, 409–430. [Google Scholar] [CrossRef]
- Atucha, A.; Merwin, I.A.; Brown, M.G. Long-Term Effects of Four Groundcover Management Systems in an Apple Orchard. HortScience 2011, 46, 1176–1183. [Google Scholar] [CrossRef]
Disclaimer/Publisher’s Note: The statements, opinions and data contained in all publications are solely those of the individual author(s) and contributor(s) and not of MDPI and/or the editor(s). MDPI and/or the editor(s) disclaim responsibility for any injury to people or property resulting from any ideas, methods, instructions or products referred to in the content. |
© 2025 by the author. Licensee MDPI, Basel, Switzerland. This article is an open access article distributed under the terms and conditions of the Creative Commons Attribution (CC BY) license (https://creativecommons.org/licenses/by/4.0/).