Article

Assessing the Impact of Climate Change on Hippophae neurocarpa in China Using Biomod2 Modeling

1
Engineering Research Centre of Chuanxibei Rural Human Settlement (RHS) Construction, Mianyang Teachers’ College, Mianyang 621016, China
2
College of Life Science, China West Normal University, Nanchong 637002, China
*
Author to whom correspondence should be addressed.
These authors contributed equally to this work.
Agriculture 2025, 15(7), 722; https://doi.org/10.3390/agriculture15070722
Submission received: 31 January 2025 / Revised: 11 March 2025 / Accepted: 26 March 2025 / Published: 27 March 2025

Abstract

:
Hippophae neurocarpa is a relatively new member of the Rhamnus genus that has various potential edible and medicinal values, but still needs to be further developed. To better develop H. neurocarpa, it is crucial to determine its current and future population distribution. This study utilized the “Biomod2” package in R to integrate five individual models and investigate the effects of climate change on the potential distribution of H. neurocarpa, as well as the key climatic factors influencing its distribution. The results indicated that, under the current scenario, the potential distribution of H. neurocarpa is mainly concentrated in the eastern parts of the Loess Plateau and the Qinghai–Tibet Plateau. In the future, its potential suitable habitats will undergo varying degrees of change: the area of medium/low suitability will decrease, while the area of high suitability will shift westward and increase. In the analysis of area changes, it was found that some potential suitable habitats in Sichuan and Shaanxi will directly transition from highly suitable to unsuitable areas. Key environmental variable analysis showed that temperature, particularly low temperature, is a crucial factor affecting the distribution of H. neurocarpa. Additionally, altitude also has a significant impact on its distribution. This study predicted the potential suitable habitats of H. neurocarpa, which will aid in its future development and provide reference for selecting regions suitable for its cultivation.

1. Introduction

The growth and development of plants are influenced by various environmental factors, including topography and soil [1]. Climate change will play an important role in altering plant distribution in the coming decades [2,3]. Although studies have shown that the migration of forest plants is related to nitrogen deposition, the influence of climate remains significant and cannot be ignored [4]. The Hippophae genus in China includes six species and seven subspecies [5]. Due to their high content of flavonoids, polyphenols, and other bioactive compounds, these plants have received widespread attention [6]. They are used in food, medicine, and other fields [7,8]. This makes them economically valuable. Furthermore, they are pioneer species for windbreaks and sand fixation [9]. The Qinghai–Tibet Plateau in China has arid and semi-arid regions; these areas experience low precipitation and high evaporation [10]. As a result, most plants struggle to survive, leading to sparse vegetation. Hippophae species have strong drought and cold resistance. They are highly adaptable to different soil conditions [11]. This allows them to survive and reproduce even in barren gravel areas. They also thrive in high-altitude regions. Hippophae neurocarpa is one of the species in the Hippophae genus and is a relatively recently differentiated group, with limited research undertaken thus far [12]. Unlike the widely distributed Hippophae rhamnoides, H. neurocarpa has a lower distribution range, mainly in the eastern part of the Qinghai–Tibet Plateau, making it a unique shrub species of the western plateau regions of China [13,14]. Studying the distribution of H. neurocarpa is beneficial for the development of its developing areas.
With the advancement of technology, species distribution models (SDMs) are increasingly being used in disciplines such as ecology, biogeography, and conservation biology [15,16,17]. These models are widely used in exploring invasive species management, conservation area planning, and the impact of past and future climate change on species populations [18]. However, the results obtained from different modeling methods often vary, which poses a significant challenge to the reliability of the models [15]. This challenge led to the development of integrated modeling approaches. The integrated modeling method was first proposed by Thuiller, with an initial platform that included four models: a Generalized Linear Model (GLM), a Generalized Additive Model (GAM), Classification and Regression Trees (CARTs), and an Artificial Neural Network (ANN) [19]. In 2009, Thuiller released the Biomod2 platform, which included new models and continues to be updated [20]. To date, the Biomod2 integrated model has included ten distinct species distribution models: in addition to the original GAM, GLM, and ANN, it also includes a Generalized Boosted Model (GBM), Classification Tree Analysis (CTA), Multivariate Adaptive Regression Splines (MARS), a Surface Range Envelope Model (SRE), a Flexible Discriminant Analysis Model (FDA), Random Forests (RFs), and MaxEnt [21,22]. The modeling accuracy of integrated models is relatively high, and they have demonstrated superior performance compared to single-species distribution models in multiple studies [23,24]. The use of the Biomod2 integrated model for predicting species’ potential distribution is receiving widespread attention. For example, Zhang Huayong used the Biomod2 model to predict the suitable habitat of Cupressus gigantea in the Qinghai–Tibet Plateau. His findings provided recommendations for species protection and planning [25]; Yu Cong applied the Biomod2 model to analyze key environmental factors for Betula ermanii in the subalpine forest line of Changbai Mountain. His study identified the dominant environmental factors influencing high-altitude plants [26]; Santosh used the Biomod2 model to analyze Rheum species, indicating that global warming is pushing plants to higher altitudes [27].
Currently, the development of H. neurocarpa lags behind that of H. rhamnoides, despite its potential for development. To optimize the use and development of H. neurocarpa, it is necessary to predict the species’ future potential suitable habitats and analyze the environmental factors influencing its distribution. This study employs the Biomod2 integrated model in R software, combined with distribution records of H. neurocarpa, to predict its potential distribution under current and future climate conditions. Various environmental factors influencing the potential distribution of H. neurocarpa were evaluated, and the relationship between future environmental changes and the species was explored. The findings aim to provide valuable insights for the future development of H. neurocarpa, contributing to local economic growth and applications such as windbreaks and sand fixation.

2. Materials and Methods

2.1. Species Occurrence Records

Establishing species distribution models typically requires extensive species occurrence data, and the Biomod2 model is no exception. Therefore, comprehensive efforts are needed to gather H. neurocarpa spatial distribution data, which is crucial for constructing an accurate model. In this study, data were sourced from the Global Biodiversity Information Facility (GBIF, https://www.gbif.org/, https://doi.org/10.15468/dl.ts29sd, accessed on 30 December 2024), the Chinese Virtual Herbarium (https://www.cvh.ac.cn/, accessed on 30 December 2024), and literature searches of various academic databases, using H. neurocarpa as a keyword. After obtaining occurrence records, coordinates were retrieved using Google Maps (http://ditu.google.cn/, accessed on 30 December 2024). A total of 114 records were collected. To reduce redundancy, these data points were filtered using a 2.5 min grid size (4.5 Km × 4.5 Km), resulting in 85 valid occurrence records.

2.2. Environment Variables

This study selected 19 bioclimatic factors from the Global Climate Database (https://worldclim.org/, accessed on 30 December 2024) [28], as well as additional environmental factors, including soil and topographic data from the Institute of Geographic Sciences and Natural Resources Research, Chinese Academy of Sciences (https://www.resdc.cn/, accessed on 30 December 2024), the World Soil Database (https://gaez.fao.org/pages/hwsd, accessed on 30 December 2024), and the Center for International Earth Science Information Network (CIESIN) (http://www.ciesin.org/, accessed on 30 December 2024). All variables were selected based on the version released in 2023. To prevent overfitting among environmental factors, the 19 bioclimatic variables were imported into ArcGIS, and corresponding environmental data at the occurrence points of H. neurocarpa were extracted. Pearson correlation analysis was then performed (Figure S1A), retaining only those bioclimatic variables with a correlation lower than 0.8. Principal component analysis (PCA) was conducted to further verify the selection (Figure S1B) [29,30]. Finally, soil and topographic factors were incorporated, and the resulting 18 environmental variables were used for subsequent modeling (Table 1).
The study was conducted based on the Shared Socioeconomic Pathway (SSP) 2-4.5 scenario in the Coupled Model Intercomparison Project (CMIP6). The SSP2-4.5 scenario is an updated version of the Representative Concentration Pathway 4.5 (RCP4.5) from CMIP5 [31]. In addition to assuming a moderate level of greenhouse gas emissions, SSP2-4.5 specifies that land use and aerosol pathways are combined with a moderate level of social vulnerability [32]. SSP2-4.5 represents a moderate emission scenario, in which socioeconomic trends do not significantly differ from historical patterns [33]. Therefore, the model was applied exclusively under the SSP2-4.5 scenario.

2.3. Model Construction

The “Biomod2” R package incorporates ten different models, including GLM, GBM, GAM, CTA, ANN, SRE, FDA, MARS, RF, and MAXENT. This comprehensive package integrates multiple individual models through an ensemble modeling approach, which helps address the limitations of single models and improves the accuracy of predictions. During the modeling process, 75% of the occurrence records were randomly selected as the training set, while the remaining 25% served as the test set for validation. Additionally, 1000 pseudo-absence points were randomly chosen, and the process was repeated 10 times. Models were constructed individually for each of the single models, and the one with the highest accuracy was selected for integration, ultimately forming the optimal ensemble model (EM).

2.4. Model Evaluation and Habitat Suitability Classification

The evaluation of the ensemble model was conducted using two accuracy metrics: the Kappa coefficient (KAPPA) and True Skill Statistic (TSS). Both KAPPA and TSS values range from 0 to 1, with the following interpretation: values between 0 and 0.4 indicate poor model performance; 0.4 to 0.55 suggest moderate performance; 0.5 to 0.7 indicate good performance; 0.7 to 0.85 suggest very good performance; and values between 0.85 and 1 indicate excellent model performance. The suitability probability values obtained from the “Biomod2” ensemble model range from 0 to 1000, representing the likelihood of species occurrence. We used the TSS threshold to classify suitable habitats: areas below the TSS threshold were considered unsuitable, while areas between the TSS threshold and 1000 were divided into low-, medium-, and high-suitability zones. After modeling, the results from the Biomod2 model were imported into ArcGIS v 10.8 for further organization and overlay analysis. The changes in the area of each suitability zone were calculated, and the centroid of the high suitability zone was analyzed for centroid movement.

3. Results

3.1. Evaluation of Individual Models and Selection of the Ensemble Model

Using the “Biomod2” R package, eight individual models were successfully constructed, while the GAM and MAXENT failed to be built. Among the successful models, the RF model performed the best, with the highest KAPPA and TSS values of 0.994 and 0.999, respectively (Figure 1). The GBM model followed, with KAPPA and TSS values of 0.706 and 0.900, respectively (Figure 1). In contrast, the SRE model had the lowest predictive performance, with KAPPA and TSS values of 0.398 and 0.438 (Figure 1), indicating near-failure in modeling. It is noteworthy that the TSS values of most individual models were higher than their corresponding KAPPA values, indicating a relatively high level of performance across models. To incorporate more models into the final prediction, we selected those with TSS values greater than 0.8 for ensemble modeling. These models included RF, the GBM, MARS, FDA, and the GLM. The EM achieved excellent performance, with both TSS and KAPPA values exceeding 0.9 (Figure 1).

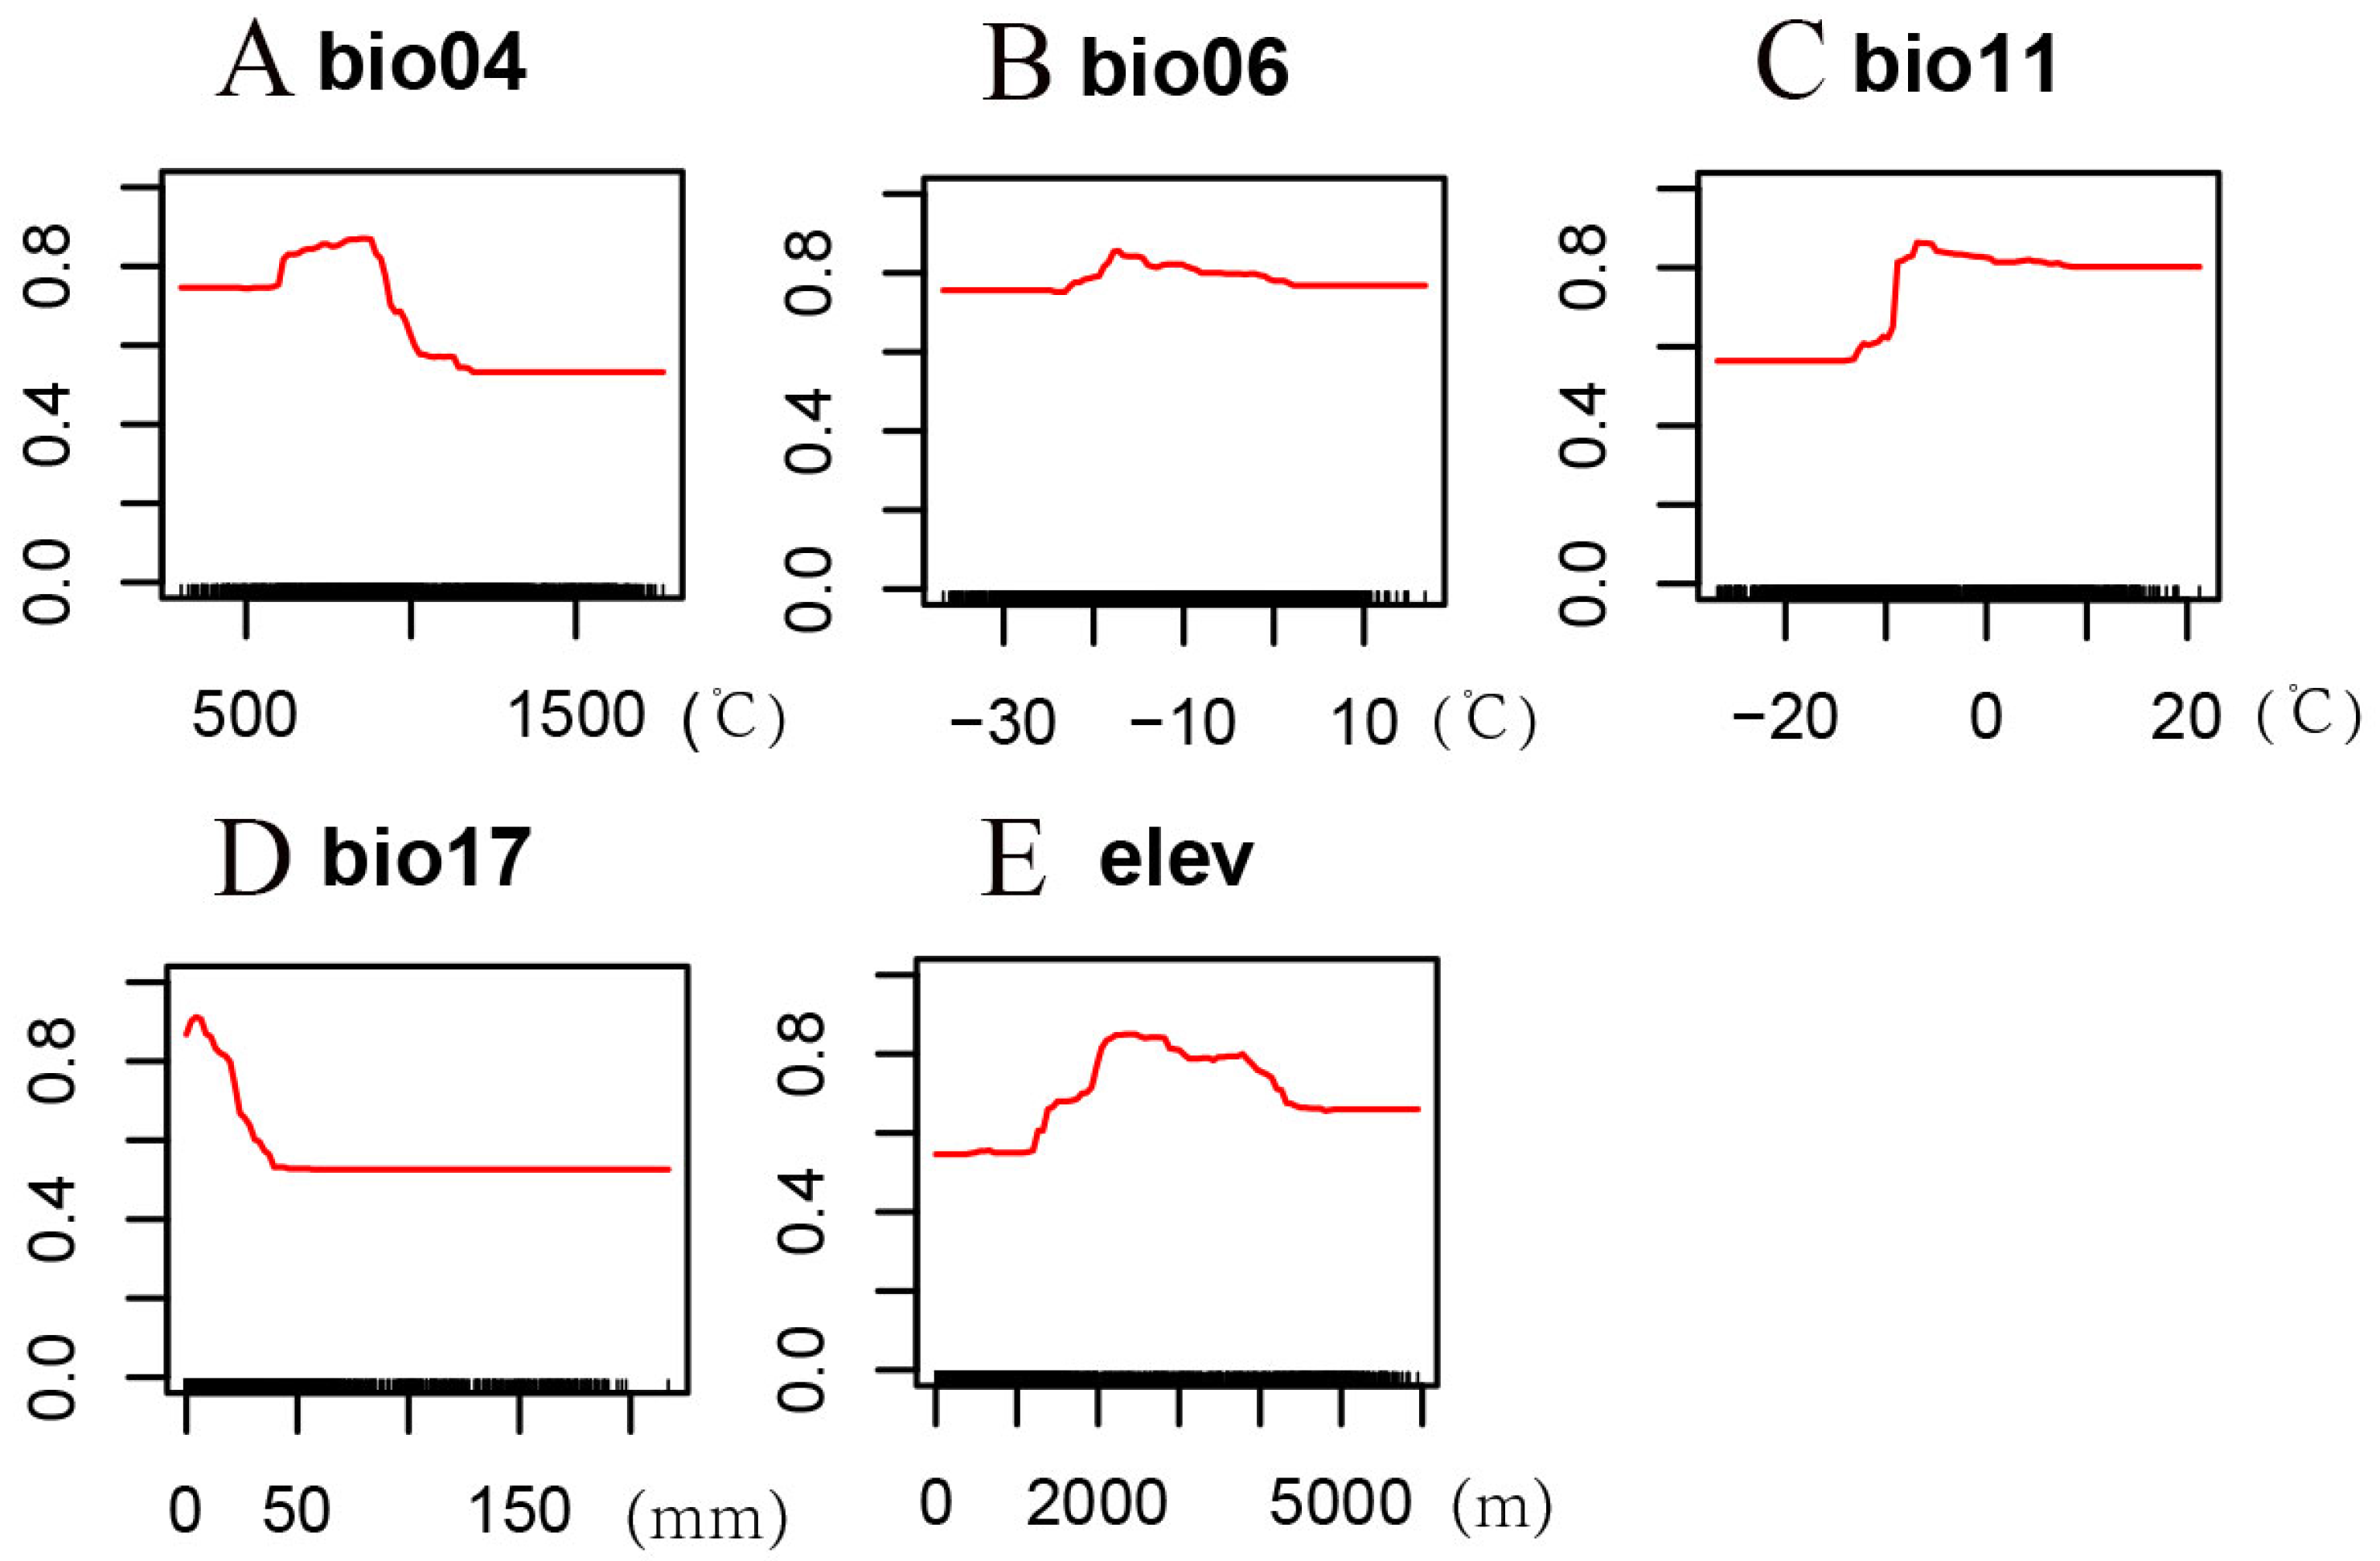
3.2. Environmental Factor Analysis

The average contribution of all environmental variables across the eight successfully constructed models was calculated (Table 2). Among these, temperature seasonality (bio04) had the highest average contribution, reaching 19.34%. This was followed by the precipitation of the driest month (bio17) at 11.65%, the mean temperature of the coldest quarter (bio11) at 11.59%, the min temperature of the coldest month (bio06) at 11.20%, and elevation (elev) at 10.61%. These five environmental contribution rates all exceed 10% and account for a total contribution rate of 64.39%, indicating that these are the primary determinants of H. neurocarpa distribution.
In the environmental response curves (Figure 2 and Table 3), the occurrence probability of H. neurocarpa is generally high, with probabilities greater than 0.4. When the occurrence probability exceeds 0.8 (suitability probability values > 800), this indicates an optimal environmental range for the species, favoring its distribution. The optimal ranges (best values) for the key environmental factors within the displayed range are as follows: temperature seasonality (bio04) ranges from 618.25 to 915.56 °C (821.18 °C); min temperature of the coldest month (bio06) ranges from −19.07 to −7.86 °C (−17.15 °C); mean temperature of the coldest quarter (bio11) ranges from −8.70 to 8.62 °C (−6.21 °C); precipitation of the driest month (bio17) ranges from 0.55 to 19.64 mm (5.62 mm); and elevation ranges from 2045.63 to 3033.28 m (2381.00 m). Among these, bio04 and bio17 show a significant decrease in occurrence probability beyond their optimal ranges, while bio06, bio11, and elevation maintain relatively stable high probabilities, approaching 0.8 within a certain range. This indicates that H. neurocarpa has a high tolerance to variations in these factors.

3.3. Current Climate Suitability Analysis

The potential suitable habitat of H. neurocarpa under current climatic conditions was analyzed using the integrated model, as shown in Figure 3. The model predicted that H. neurocarpa is mainly distributed in the cold, high-altitude regions of western China, which is largely consistent with its actual distribution. The area of high suitability is 238.94 × 10³ km2, mainly distributed in the eastern Tibetan Plateau and the western Loess Plateau, with larger areas in the provinces of Sichuan, Gansu, Qinghai, and Tibet. The area of moderate suitability is 363.72 × 10³ km2, concentrated in the provinces of Gansu, Ningxia, Qinghai, and Shaanxi. The area of low suitability is 115.09 × 10³ km2, with sporadic distribution in the provinces of Shanxi, Shaanxi, Sichuan, Gansu, Qinghai, Xinjiang, and Tibet.

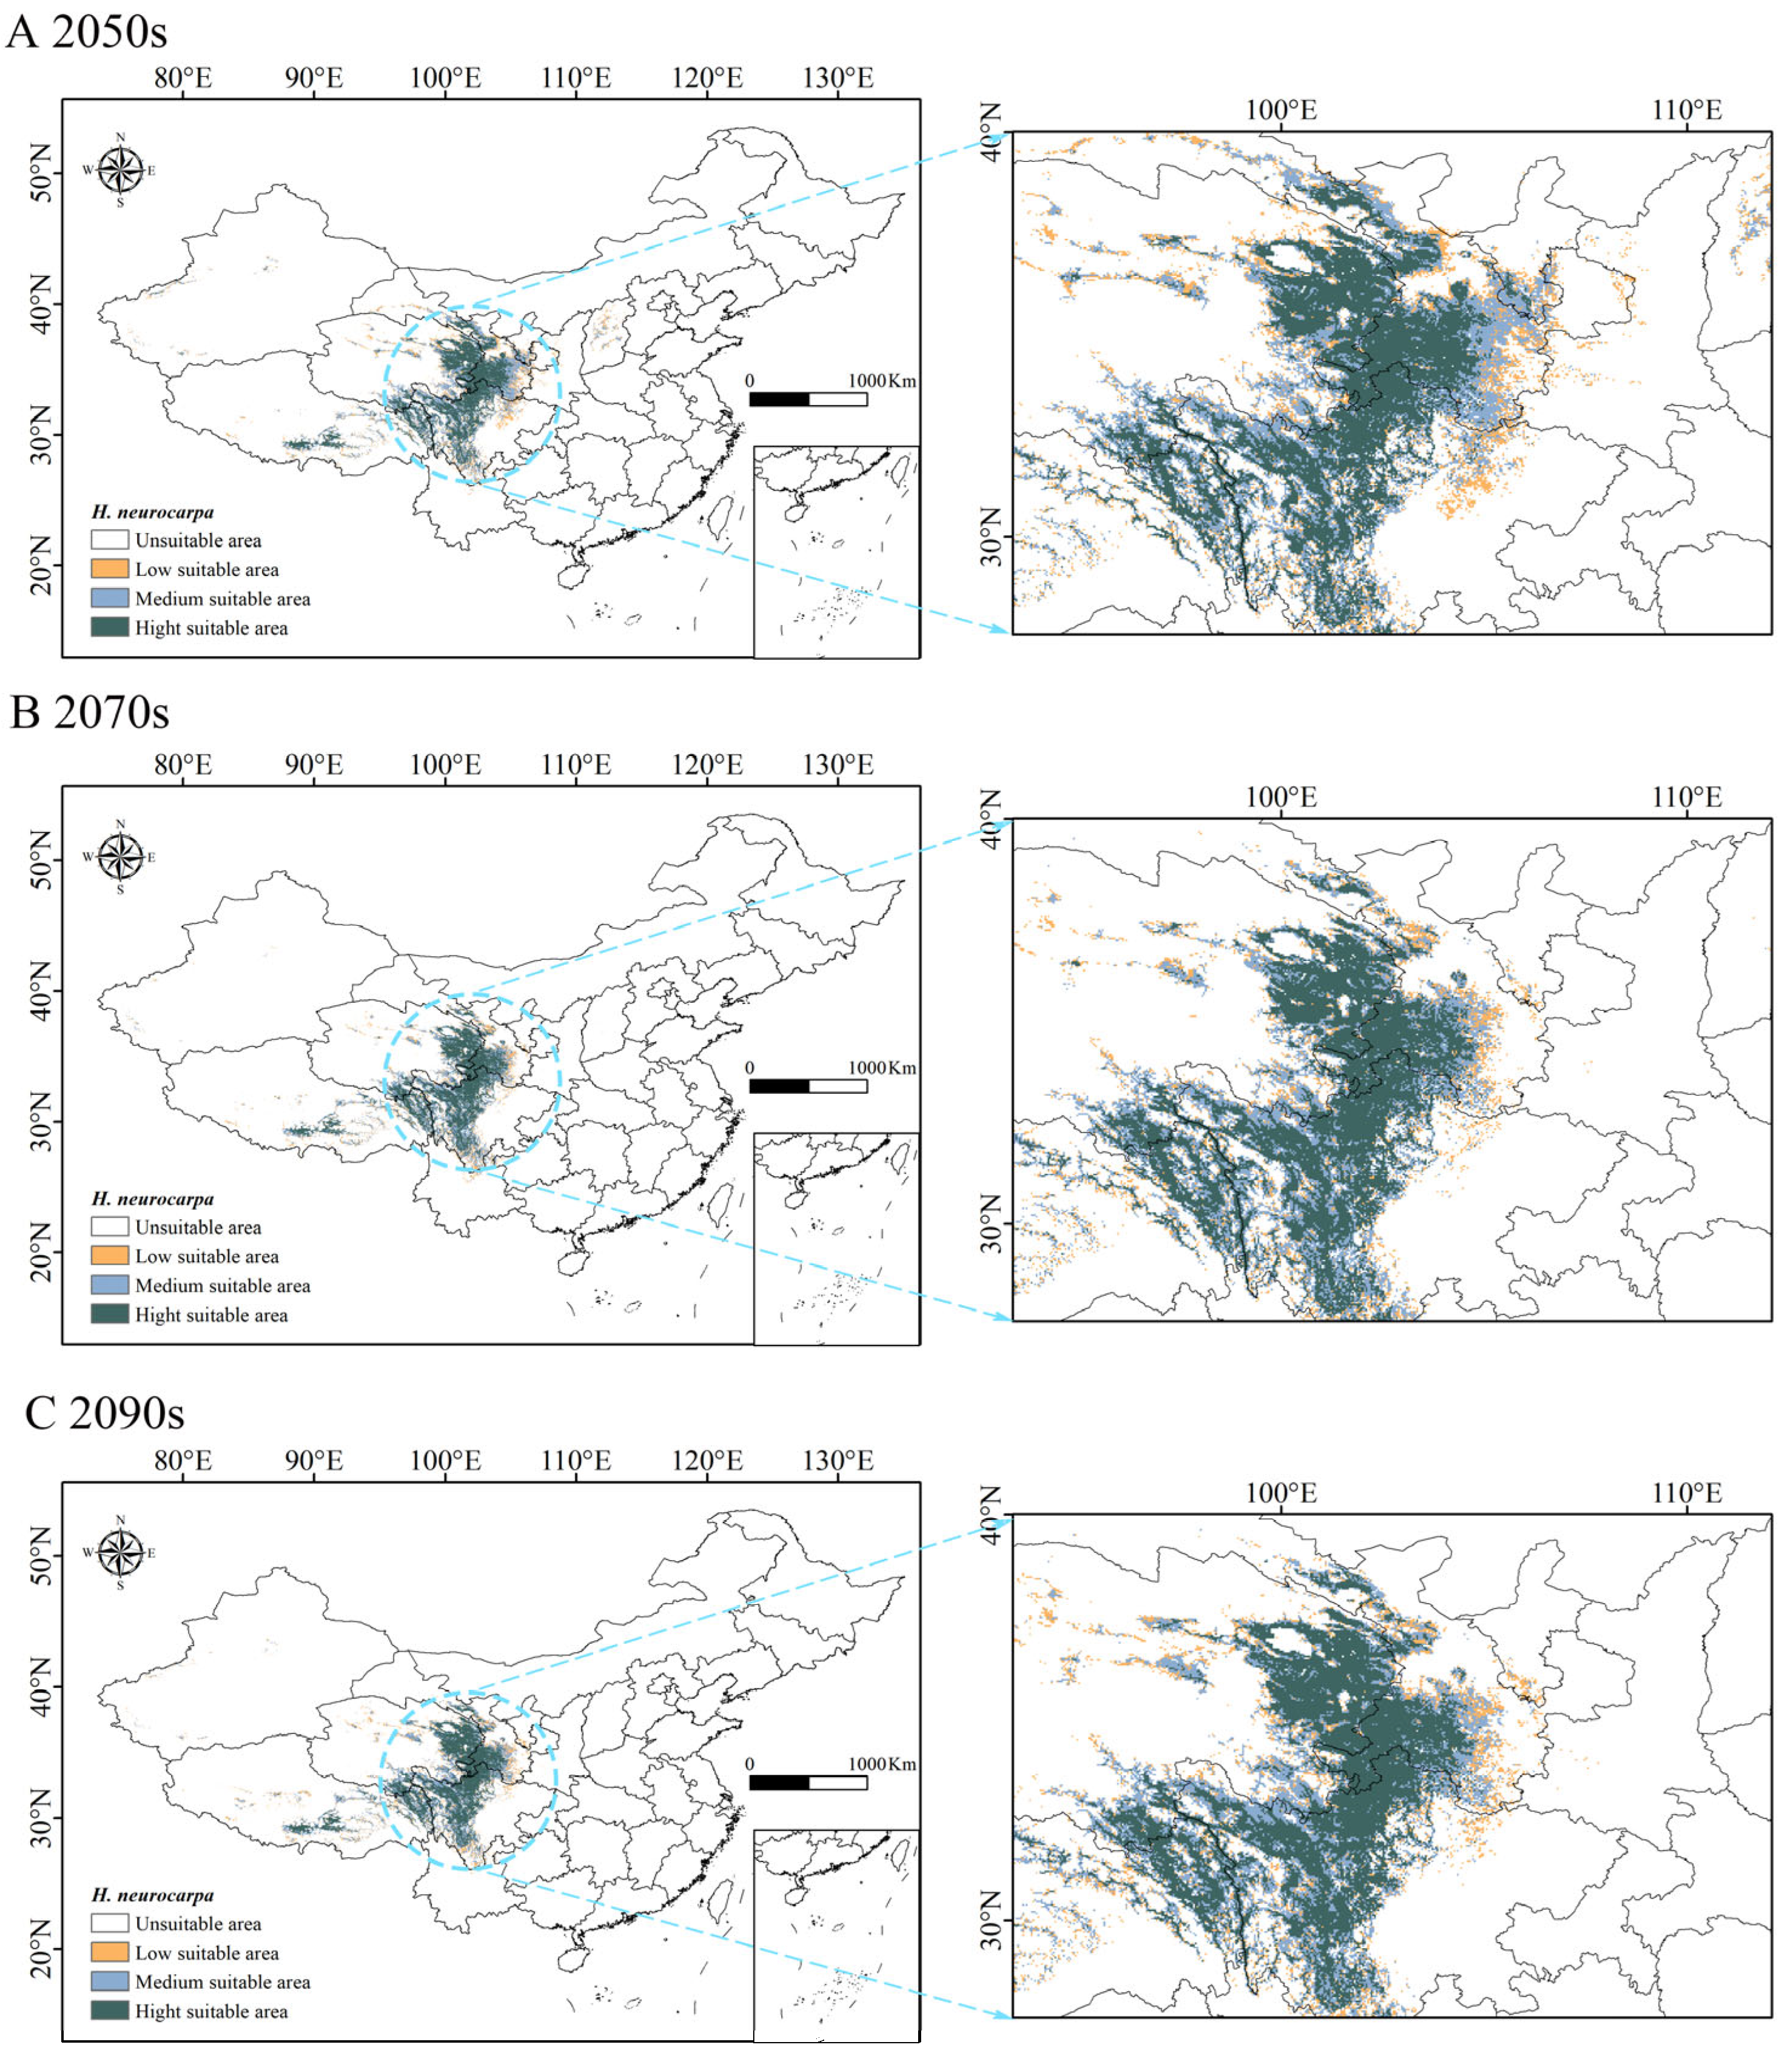
3.4. Prediction of Potential Suitable Habitat Under Future Climate Scenarios

The predicted changes in the potential suitable habitat of H. neurocarpa under the SSP2-4.5 scenario for the coming decades are shown in Figure 4, with area changes detailed in Table 4. The total area of low, moderate, and high suitability shows a decrease, but the reduction is primarily in the moderate-suitability area, while the high-suitability area shows an increase. The area of low suitability first increases and then decreases. In the 2050s, the distribution of high suitability areas remains similar to the current scenario, with an area of 290.12 × 10³ km2, showing a 21.42% increase. In the longer-term future, the distribution area shrinks and then increases further compared to the 2050s. By the 2070s, the area shrinks to 277.45 × 10³ km2, but by the 2090s, it grows to 292.20 × 10³ km2, resulting in a 22.29% increase compared to the current scenario. The area of moderate suitability continues to decrease, reaching its lowest point of 205.16 × 10³ km2 in the 2070s, a 43.59% decrease compared to the current scenario, but it begins to recover by the 2090s. In the 2070s, the area of low suitability reaches its lowest point of 91.91 × 10³ km2, showing a 20.14% decrease compared to the current scenario, but it starts to increase again by the 2090s. Notably, the potential distribution area of H. neurocarpa in the future scenario in the 2090s shows an overall increase compared to the 2070s.

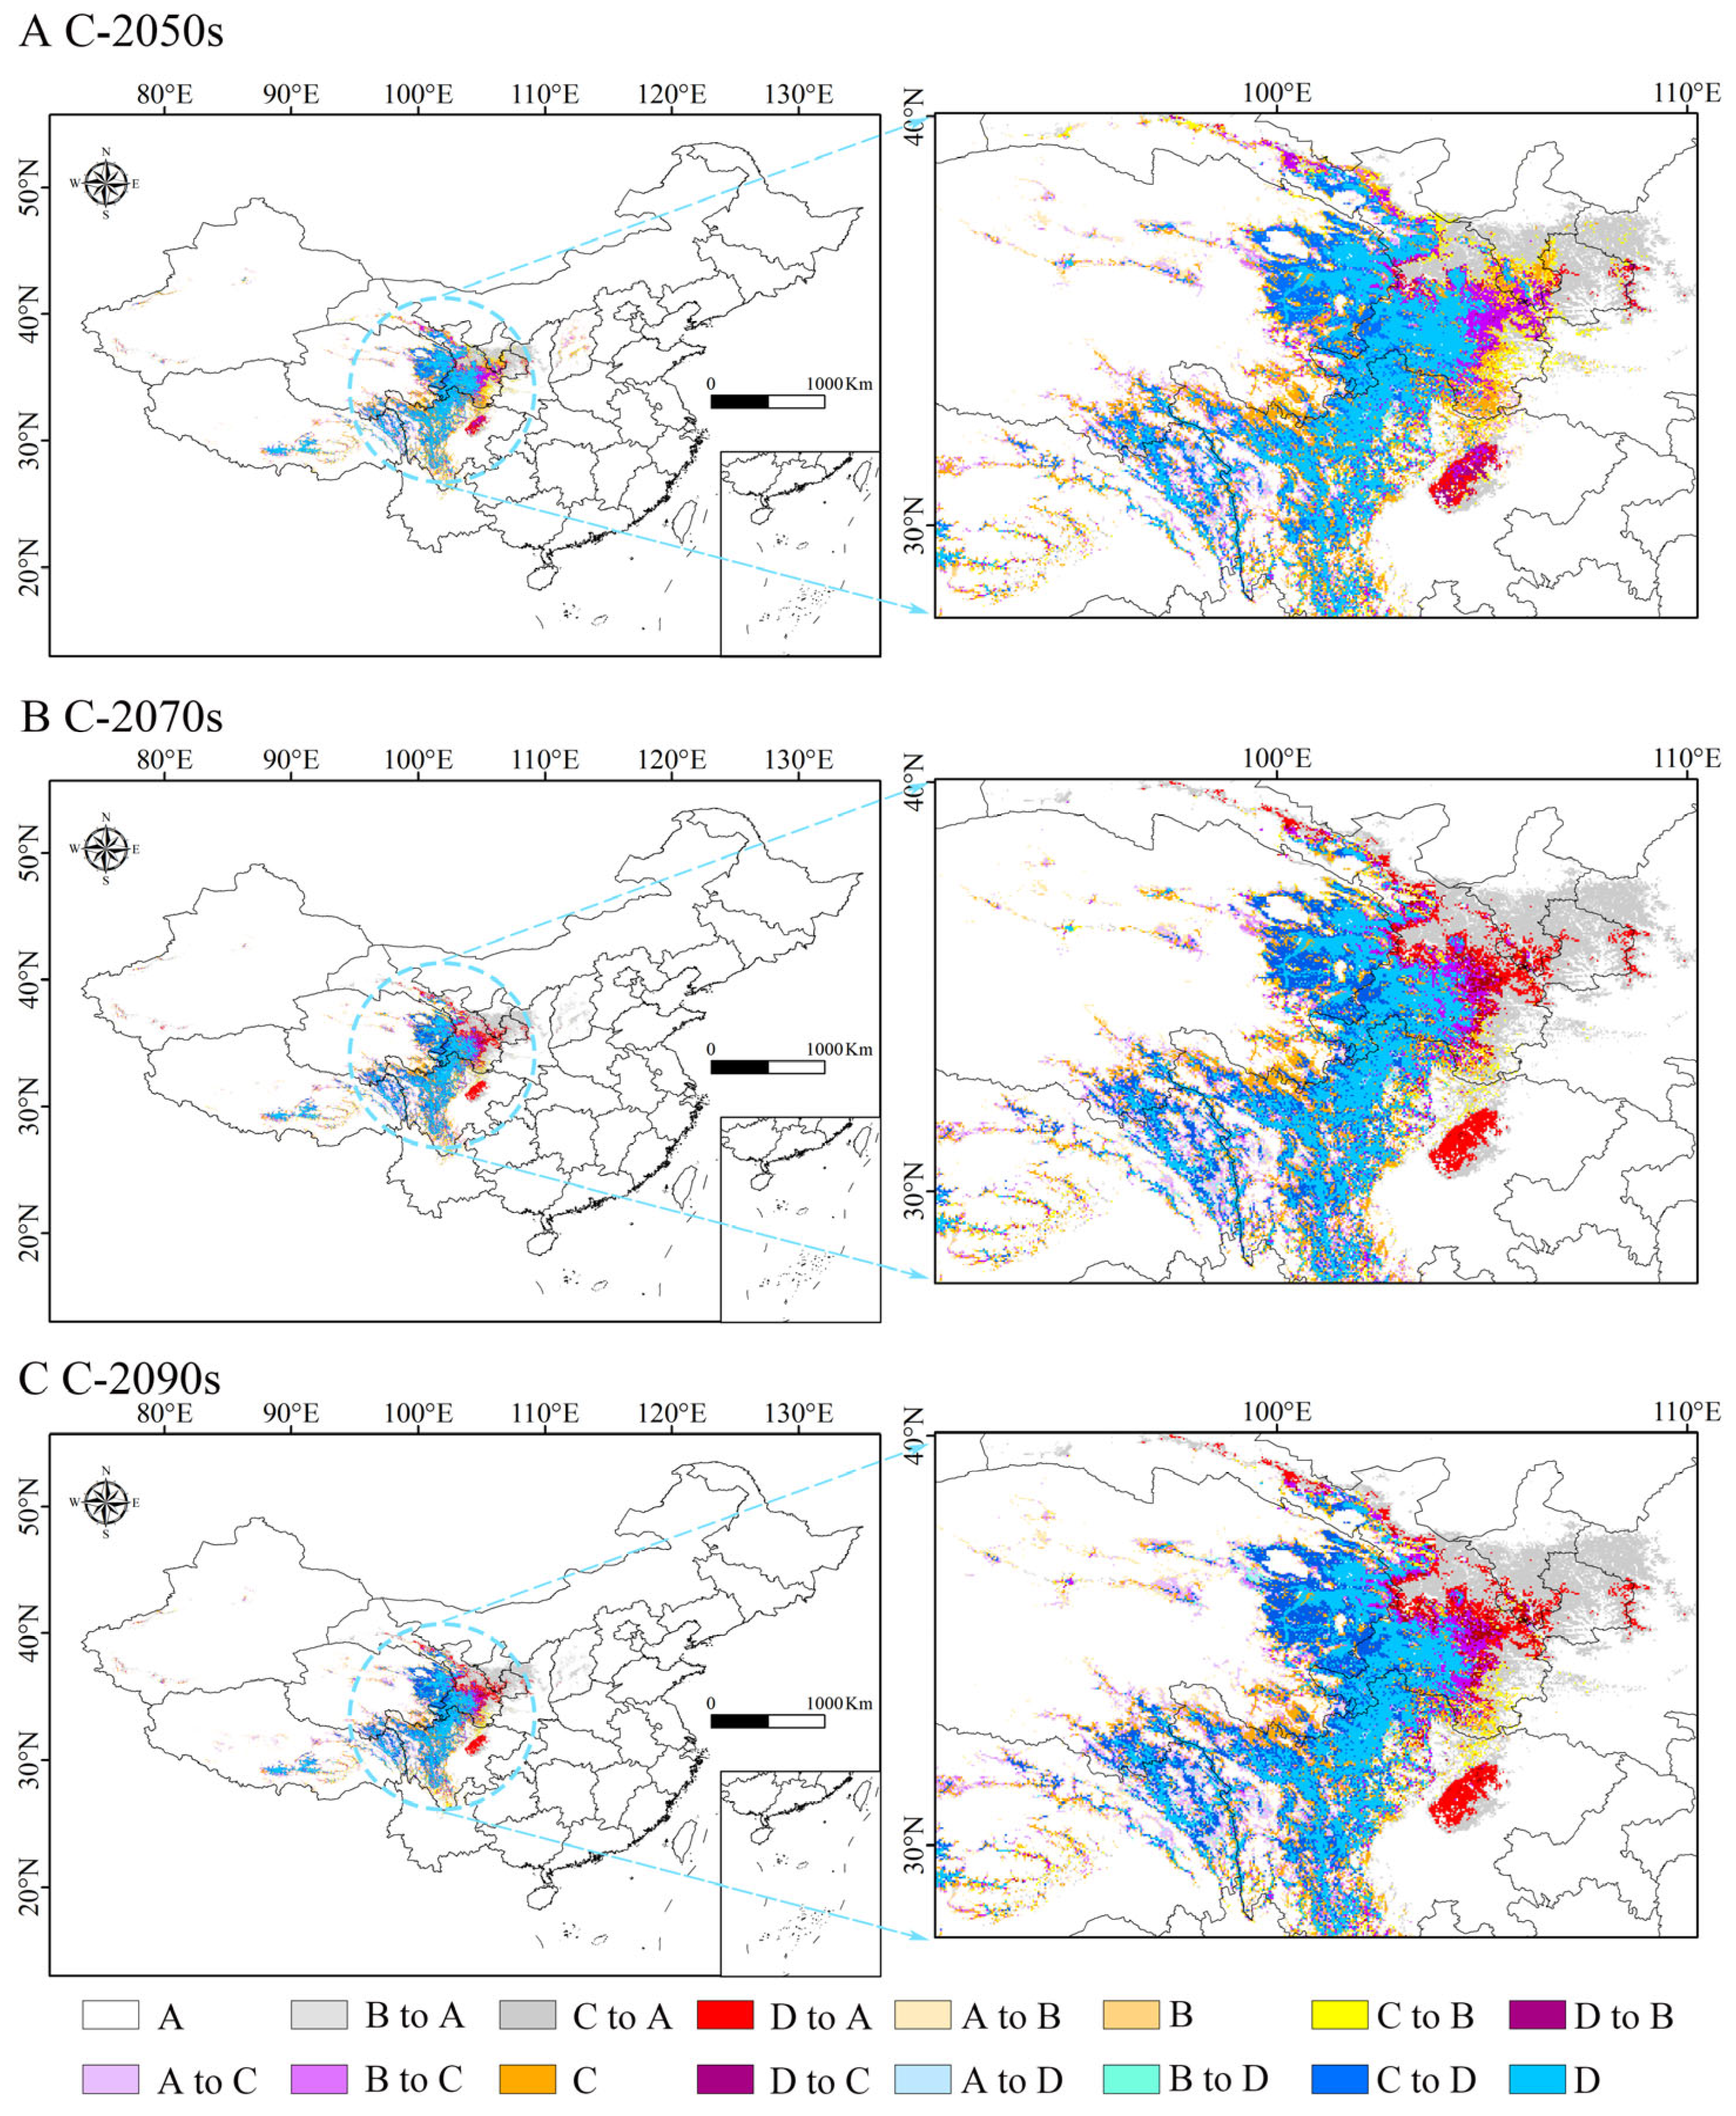
3.5. Shrinkage and Expansion of Potential Suitable Habitat for H. neurocarpa in the Future

A comparison of the potential suitable habitats under future scenarios with the current scenario (Figure 5, Table 5) reveals that the potential suitable habitat for H. neurocarpa continually changes over time. In the 2050s, the high-suitability areas show a trend of expansion towards the west, with significant increases observed in the western regions of Shaanxi and Qinghai, as well as in Sichuan and Tibet. The increase in high-suitability areas primarily results from the transition of moderate-suitability areas to high-suitability areas, with a total area change of 102.05 × 10³ km2. However, only small areas of low- and moderate-suitability zones transition to high-suitability zones, with an area change of 2.19 × 10³ km2 and 6.70 × 10³ km2, respectively. In contrast, the eastern regions of suitable habitat show a contraction, particularly in Sichuan, Gansu, and Ningxia. In some areas, high-suitability zones directly transform into low-suitability or unsuitable areas, with area changes of 10.57 × 10³ km2 and 10.02 × 10³ km2, respectively. These changes predominantly occur in Sichuan and Ningxia. Furthermore, high-suitability areas converting into moderate-suitability zones cover 39.17 × 10³ km2, primarily concentrated in Gansu. In the 2070s and 2090s, the increase in high-suitability areas is relatively smaller, with a notable increase of 115.97 × 10³ km2 in the 2090s. However, existing high-suitability areas continue to decline. It is important to note that the area of suitable habitat transitioning to unsuitable areas also increases. By the 2090s, the area of high-suitability zones transforming into unsuitable zones in the current scenario reaches 36.94 × 10³ km2. The area of moderate-suitability zones converting to unsuitable zones is the largest, reaching 144.44 × 10³ km2, and the area of low-suitability zones transitioning to unsuitable zones is 63.09 × 10³ km2.

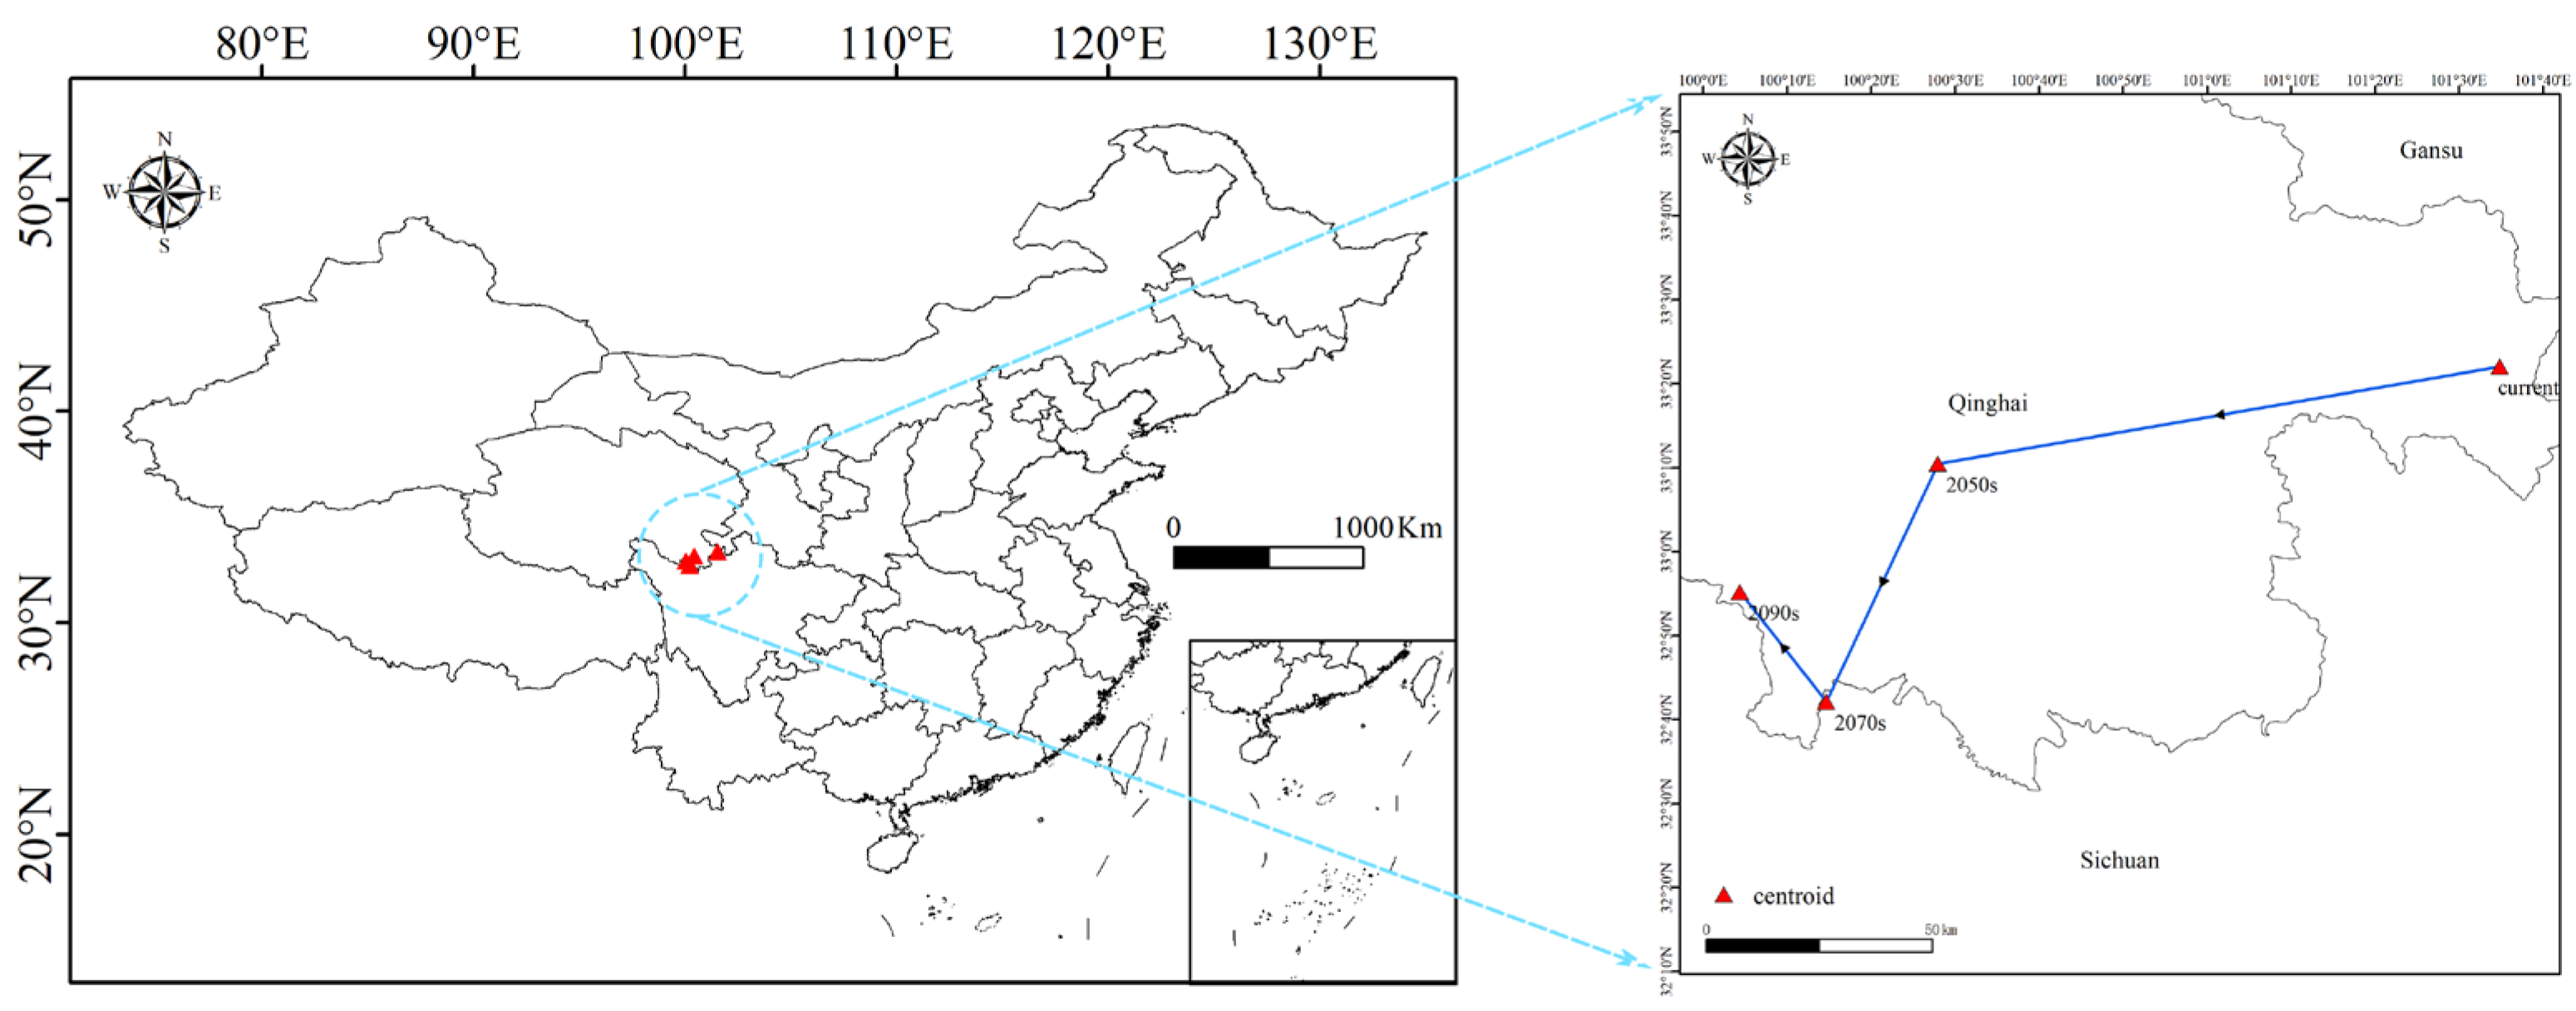
3.6. Centroid Shifts of H. neurocarpa Under Current and Future Scenarios

The centroid of the high-suitability areas for H. neurocarpa is primarily located in the eastern part of Qinghai Province, showing an overall westward shift (Figure 6), which aligns with the trends observed for high-suitability area changes. Under the current scenario, the centroid is located in Maqin County, Golog Tibetan Autonomous Prefecture, Qinghai Province (33.36° N, 101.58° E). In the future SSP2-4.5 scenario, during the 2050s, the centroid shifts westward to Gande County, Golog Tibetan Autonomous Prefecture, Qinghai Province (33.17° N, 100.46° E). By the 2070s, the centroid further moves southwest to Seda County, Garze Tibetan Autonomous Prefecture, Sichuan Province (32.70° N, 100.24° E), which is near the boundary with Banma County, Golog Tibetan Autonomous Prefecture. In the 2090s, the centroid shifts northwest to Dari County, Golog Tibetan Autonomous Prefecture, Qinghai Province (32.91° N, 100.07° E). Overall, the movement of the centroid is not pronounced, remaining within Golog Tibetan Autonomous Prefecture, Qinghai Province. This suggests that the center of high-suitability areas for H. neurocarpa remains relatively stable, indicating that the region is suitable for the potential cultivation of the species.

4. Discussion

4.1. Evaluation of the Integrated Model

Species distribution models still have certain limitations, particularly when species distribution data are sparse [34]. Moreover, relying solely on bioclimatic variables is insufficient, as multiple factors influence species growth and development. For example, topographical and soil factors, such as slope, aspect, soil texture, and elevation, significantly affect the growth of woody plants [35,36]. Additionally, anthropogenic factors, in conjunction with environmental variables, determine species richness [37]. To improve model accuracy in future studies, we incorporated various environmental factors alongside bioclimatic variables for modeling. In this study, five individual models integrated within the Biomod2 package were employed. By combining a wide range of biophysical environmental factors, an ensemble model was developed. This approach enhanced prediction reliability while reducing biases associated with individual models [30]. The ensemble model demonstrated high reliability, with superior AUC and TSS values, indicating robust performance. Hippophae neurocarpa, a species of the genus Hippophae, exhibits excellent developmental potential. The results revealed that the potential suitable habitats for H. neurocarpa are primarily located at the junction of the western Qinghai–Tibet Plateau and the eastern Loess Plateau. In future scenarios, suitable areas are projected to expand and shift to higher elevations, while potential habitats in the Loess Plateau region are expected to contract.

4.2. Environmental Variables Affecting the Potential Distribution of H. neurocarpa

It is well known that the environment can influence the distribution range of plants. Environmental factors are diverse, and their significance in affecting plant distribution varies. In this study, our results indicated that H. neurocarpa is primarily influenced by five environmental factors. Among them, three are temperature-related factors, namely temperature seasonality, min temperature of the coldest month, and mean temperature of the coldest quarter, with a total contribution rate of 42.13%. The next significant factor is a precipitation variable, precipitation of driest month, contributing 11.65%. Additionally, H. neurocarpa is also sensitive to elevation.
Previous studies have demonstrated that temperature is a major factor influencing plant physiological processes [38], and similar findings were obtained in this study. In this study, the values for H. neurocarpa in temperature seasonality ranged from 618.25 to 915.56 °C (821.18 °C), min temperature of the coldest month from −19.07 to −7.86 °C (−17.15 °C), and mean temperature of the coldest quarter from −8.70 to 8.62 °C (−6.21 °C). These results suggest that low temperature is a key factor affecting H. neurocarpa. During plant growth and development, low temperatures are required to break dormancy, and low temperatures also promote early leaf emergence [39,40]. Some studies have shown that species distribution is largely determined by their cold tolerance [41]. Hippophae neurocarpa is a species found in the eastern Qinghai–Tibet Plateau, where winters are extremely cold, with high-altitude areas reaching temperatures as low as −40 °C [42], and the annual average temperature remains low [43]. To survive in such harsh conditions, H. neurocarpa must possess strong cold resistance. Although research on the cold tolerance of H. neurocarpa is limited, various cold resistance mechanisms have been identified in other Hippophae species [44,45]. As a member of the Hippophae genus, H. neurocarpa may share similar cold tolerance mechanisms, though further experimental research is needed. Furthermore, studies have shown that plant growth and reproduction are often constrained by water availability and environmental energy. When a plant is highly tolerant of environmental stress, it is more likely to thrive [46]. In addition to low temperatures, the Qinghai–Tibet Plateau is characterized by arid conditions [43]. The moisture-related factor affecting the distribution of H. neurocarpa is the precipitation of the driest month, with a suitable range of 0.55–19.64 mm. This suggests that H. neurocarpa may have a strong tolerance to drought [47]. The region is primarily semi-arid, with poor water retention [48], and rapid increases in precipitation can lead to waterlogging [49]. Waterlogging mainly affects plant growth by reducing the oxygen content in the soil, creating hypoxic conditions [50]. When precipitation exceeds this range, the probability of occurrence of H. neurocarpa decreases, indicating that H. neurocarpa has low tolerance to waterlogging. This is consistent with the precipitation response observed in other Hippophae species [51]. The modeling results also indicate that H. neurocarpa has a higher distribution range at elevations between 2045.63 and 3033.28 m, with a higher probability of occurrence up to 4000 m, which is the main elevation range for the species. This suggests that higher elevations favor the survival of H. neurocarpa, a result that is consistent with previous studies [52]. In most scenarios, elevation mainly affects temperature and light, thereby indirectly influencing plant distribution [53,54]. However, H. neurocarpa is distributed only in high-altitude regions such as the Qinghai–Tibet Plateau, and not in colder regions of northern China. Therefore, the influence of elevation on H. neurocarpa may also be affected by other factors, such as nitrogen deposition [4,55] or changes in microbial communities along the elevation gradient [56].

4.3. Distribution Changes of H. neurocarpa

The impact of climate change on high-altitude species has been well documented. Under the SSP2-4.5 scenario, the total area of potential suitable habitats for H. neurocarpa is projected to decrease, while the area of highly suitable habitats is expected to increase in the future. Notably, the species exhibits a trend toward migrating to higher altitudes, which is consistent with the distribution patterns observed in many other species [57,58]. This shift is likely driven by global warming, with species needing to migrate to higher elevations to access cooler temperatures [59]. However, unlike most plants, the migration of H. neurocarpa to higher altitudes may also be driven by the need to avoid the stress of heavy precipitation. In the eastern regions of Sichuan and the Qinghai–Tibet Plateau, summer rainfall is intensified due to the influence of the Qinghai–Tibet Plateau vortex [60], and in recent decades, heavy rainfall in these areas has been increasing [61,62]. This increase in precipitation is detrimental to the survival of H. neurocarpa, prompting the species to migrate to more suitable habitats. As a pioneer species for windbreaks and sand fixation, Hippophae has successfully been used in desertification control during development [63]. Therefore, in addition to exploring its edible and medicinal value, H. neurocarpa could be further explored for its role in land desertification control. Additionally, field studies and practical applications of the species could be carried out in the eastern regions of Qinghai Province.
There were still some limitations in the modeling process. First, the study only conducted modeling analysis under the SSP2-4.5 scenario, while ignoring the future projections under SSP1-2.6 and SSP5-8.5. However, due to the influence of the Paris Agreement, carbon emissions may be lower in the future [64], which could lead to differences between the predicted and actual species distribution changes. Therefore, practical applications should incorporate local conditions for further development. Second, to ensure comprehensive modeling, multiple environmental factors were included in the analysis. However, some models may have failed due to factors such as the limited spatial distribution of the species or the unsuitability of certain environmental variables [65]. This could explain the failure of the GAM and MaxEnt model construction in this study.

5. Conclusions

This study successfully utilized the Biomod2 ensemble model to analyze the potential distribution of Hippophae neurocarpa and identify the primary environmental factors influencing its distribution. The results indicate that the species’ potential distribution is primarily concentrated in the eastern Tibetan Plateau to the western Loess Plateau. In the future, the total area of suitable habitat is expected to decrease, but the changes vary across different suitability zones. Furthermore, high-suitability areas will generally shift westward to higher altitudes, with a significant reduction in some areas of high suitability in Sichuan and Shaanxi. However, the total area of high-suitability habitat will increase. Notably, the potential distribution area of H. neurocarpa in the 2090s is expected to be larger than in the 2070s. The main environmental factors influencing the species’ distribution are low temperature, seasonal precipitation, and elevation. Among these, low temperature is the dominant factor, playing a crucial role in the species’ distribution. This study provides valuable insights for the future regional planting and development of H. neurocarpa.

Supplementary Materials

The following supporting information can be downloaded at: https://www.mdpi.com/article/10.3390/agriculture15070722/s1, Figure S1. Pearson correlation analysis (A) and principal component analysis (PCA) of 19 bioclimatic factors (B).

Author Contributions

Conceptualization, Z.Z.; Data curation, T.G., D.X., and Z.Z.; Formal analysis, T.G. and Q.L.; Funding acquisition, D.X. and Z.Z.; Investigation, T.G. and Q.L.; Methodology, Q.L. and Z.H.; Resources, D.X. and Z.Z.; Software, D.X. and Z.H.; Visualization, Q.L.; Writing—original draft, T.G. and Q.L.; Writing—review and editing T.G. and Z.Z.; Supervision, D.X. and Z.Z. All authors have read and agreed to the published version of the manuscript.

Funding

This work was funded by the Fundamental Research Funds of China West Normal University (20A007, 20E051, 21E040, and 22kA011).

Data Availability Statement

The data supporting the results are available in a public repository at: https://figshare.com/s/f034dc8b97f9d5830b94, accessed on 1 February 2025; GBIF.org GBIF Occurrence Download: https://doi.org/10.15468/dl.ts29sd, accessed on 30 December 2024.

Conflicts of Interest

The authors declare no conflicts of interest.

References

  1. He, P.; Li, J.; Li, Y.; Xu, N.; Gao, Y.; Guo, L.; Huo, T.; Peng, C.; Meng, F. Habitat Protection and Planning for Three Ephedra Using the MaxEnt and Marxan Models. Ecol. Indic. 2021, 133, 108399. [Google Scholar] [CrossRef]
  2. Wang, M.; Hu, Z.; Wang, Y.; Zhao, W. Spatial Distribution Characteristics of Suitable Planting Areas for Pyrus Species under Climate Change in China. Plants 2023, 12, 1559. [Google Scholar] [CrossRef] [PubMed]
  3. Vanalli, C.; Casagrandi, R.; Gatto, M.; Bevacqua, D. Shifts in the Thermal Niche of Fruit Trees under Climate Change: The Case of Peach Cultivation in France. Agric. For. Meteorol. 2021, 300, 108327. [Google Scholar] [CrossRef]
  4. Sanczuk, P.; Verheyen, K.; Lenoir, J.; Zellweger, F.; Lembrechts, J.J.; Rodríguez-Sánchez, F.; Baeten, L.; Bernhardt-Römermann, M.; De Pauw, K.; Vangansbeke, P.; et al. Unexpected Westward Range Shifts in European Forest Plants Link to Nitrogen Deposition. Science 2024, 386, 193–198. [Google Scholar] [CrossRef]
  5. Mei, D.; Ma, X.; Fu, F.; Cao, F. Research Status and Development Prospects of Sea Buckthorn (Hippophae rhamnoides L.) Resources in China. Forests 2023, 14, 2461. [Google Scholar] [CrossRef]
  6. Ma, Q.-G.; He, N.-X.; Huang, H.-L.; Fu, X.-M.; Zhang, Z.-L.; Shu, J.-C.; Wang, Q.-Y.; Chen, J.; Wu, G.; Zhu, M.-N.; et al. Hippophae Rhamnoides L.: A Comprehensive Review on the Botany, Traditional Uses, Phytonutrients, Health Benefits, Quality Markers, and Applications. J. Agric. Food Chem. 2023, 71, 4769–4788. [Google Scholar] [CrossRef]
  7. He, N.; Wang, Q.; Huang, H.; Chen, J.; Wu, G.; Zhu, M.; Shao, F.; Yan, Z.; Sang, Z.; Cao, L.; et al. A Comprehensive Review on Extraction, Structure, Detection, Bioactivity, and Metabolism of Flavonoids from Sea Buckthorn (Hippophae rhamnoides L.). J. Food Biochem. 2023, 2023, 4839124. [Google Scholar] [CrossRef]
  8. Wang, Z.; Zhao, F.; Wei, P.; Chai, X.; Hou, G.; Meng, Q. Phytochemistry, Health Benefits, and Food Applications of Sea Buckthorn (Hippophae rhamnoides L.): A Comprehensive Review. Front. Nutr. 2022, 9, 1036295. [Google Scholar] [CrossRef]
  9. Chen, J.; Lin, Y.; Fang, L.; Li, J.; Han, S.; Li, Y.; Li, Y. Sex-Related Ecophysiological Responses of Hippophae rhamnoide Saplings to Simulate Sand Burial Treatment in Desertification Areas. Forests 2023, 14, 101. [Google Scholar] [CrossRef]
  10. Guo, Q.; Li, H.; Luo, D.; Quan, H.; Bianba, D.; Zhang, W. Comparative Drought Tolerance of Six Native Deciduous and Broad-Leaved Woody Plant Species Seedlings in the Qinghai–Tibet Plateau. Acta Physiol. Plant 2016, 38, 14. [Google Scholar] [CrossRef]
  11. Liu, Q.; Ye, G.; Ma, Y. Development and Application of Microsatellite Markers in Hippophae rhamnoides Subsp. Sinensis Rousi (Hippophae rhamnoides L.) Based on Transcriptome Sequencing. Front. Genet. 2024, 15, 1373028. [Google Scholar] [CrossRef] [PubMed]
  12. Zhao, J.; Zhang, Z.; Zhou, H.; Bai, Z.; Sun, K. The Study on Sea Buckthorn (Genus hippophae L.) Fruit Reveals Cell Division and Cell Expansion to Promote Morphogenesis. Plants 2023, 12, 1005. [Google Scholar] [CrossRef] [PubMed]
  13. Zhou, W.; Hu, N.; Dong, Q.; Wang, H.; Wang, Y. Complete Chloroplast Genome Sequences of Hippophae Neurocarpa. Mitochondrial DNA Part B 2019, 4, 2048–2049. [Google Scholar] [CrossRef]
  14. Kou, Y.; Wu, Y.; Jia, D.; Li, Z.; Wang, Y. Range expansion, genetic differentiation, and phenotypic adaption of Hippophaë neurocarpa (Elaeagnaceae) on the Qinghai–Tibet Plateau. J. Syst. Evol. 2014, 52, 303–312. [Google Scholar] [CrossRef]
  15. Hao, T.; Elith, J.; Guillera-Arroita, G.; Lahoz-Monfort, J.J. A Review of Evidence about Use and Performance of Species Distribution Modelling Ensembles like BIOMOD. Divers. Distrib. 2019, 25, 839–852. [Google Scholar] [CrossRef]
  16. Franklin, J. Species Distribution Modelling Supports the Study of Past, Present and Future Biogeographies. J. Biogeogr. 2023, 50, 1533–1545. [Google Scholar] [CrossRef]
  17. Qazi, A.W.; Saqib, Z.; Zaman-ul-Haq, M. Trends in Species Distribution Modelling in Context of Rare and Endemic Plants: A Systematic Review. Ecol. Process 2022, 11, 40. [Google Scholar] [CrossRef]
  18. Guillera-Arroita, G.; Lahoz-Monfort, J.J.; Elith, J.; Gordon, A.; Kujala, H.; Lentini, P.E.; McCarthy, M.A.; Tingley, R.; Wintle, B.A. Is My Species Distribution Model Fit for Purpose? Matching Data and Models to Applications. Glob. Ecol. Biogeogr. 2015, 24, 276–292. [Google Scholar] [CrossRef]
  19. Thuiller, W. BIOMOD—Optimizing Predictions of Species Distributions and Projecting Potential Future Shifts under Global Change. Glob. Chang. Biol. 2003, 9, 1353–1362. [Google Scholar] [CrossRef]
  20. Thuiller, W.; Lafourcade, B.; Engler, R.; Araújo, M.B. BIOMOD—A Platform for Ensemble Forecasting of Species Distributions. Ecography 2009, 32, 369–373. [Google Scholar] [CrossRef]
  21. Li, M.; Zhao, H.; Xian, X.; Zhu, J.; Chen, B.; Jia, T.; Wang, R.; Liu, W. Geographical Distribution Pattern and Ecological Niche of Solenopsis Invicta Buren in China under Climate Change. Diversity 2023, 15, 607. [Google Scholar] [CrossRef]
  22. Lantschner, M.V.; de la Vega, G.; Corley, J.C. Predicting the Distribution of Harmful Species and Their Natural Enemies in Agricultural, Livestock and Forestry Systems: An Overview. Int. J. Pest. Manag. 2019, 65, 190–206. [Google Scholar] [CrossRef]
  23. Hao, T.; Elith, J.; Lahoz-Monfort, J.J.; Guillera-Arroita, G. Testing Whether Ensemble Modelling Is Advantageous for Maximising Predictive Performance of Species Distribution Models. Ecography 2020, 43, 549–558. [Google Scholar] [CrossRef]
  24. Zhang, X.; Wu, W.; Liang, Y. Analysis of the Potential Distribution of Shoot Blight of Larch in China Based on the Optimized MaxEnt and Biomod2 Ensemble Models. Forests 2024, 15, 1313. [Google Scholar] [CrossRef]
  25. Zhang, H.; Wei, Y.; Yue, J.; Wang, Z.; Zou, H.; Ji, X.; Zhang, S.; Liu, Z. Prediction of Potential Suitable Areas and Priority Protection for Cupressus Gigantea on the Tibetan Plateau. Plants 2024, 13, 896. [Google Scholar] [CrossRef]
  26. Cong, Y.; Gu, Y.; Wang, W.J.; Wang, L.; Xue, Z.; Chen, Y.; Jin, Y.; Xu, J.; Li, M.-H.; He, H.S.; et al. The Interaction between Temperature and Precipitation on the Potential Distribution Range of Betula ermanii in the Alpine Treeline Ecotone on the Changbai Mountain. For. Ecosyst. 2024, 11, 100166. [Google Scholar] [CrossRef]
  27. Rana, S.K.; Rana, H.K.; Stöcklin, J.; Ranjitkar, S.; Sun, H.; Song, B. Global Warming Pushes the Distribution Range of the Two Alpine ‘Glasshouse’ Rheum Species North- and Upwards in the Eastern Himalayas and the Hengduan Mountains. Front. Plant Sci. 2022, 13, 925296. [Google Scholar] [CrossRef]
  28. Booth, T.H. Checking Bioclimatic Variables That Combine Temperature and Precipitation Data before Their Use in Species Distribution Models. Austral Ecol. 2022, 47, 1506–1514. [Google Scholar] [CrossRef]
  29. Li, R.; Hu, X.; Li, Q.; Liu, L.; He, Y.; Chen, C. Gap Analysis of Firmiana danxiaensis, a Rare Tree Species Endemic to Southern China. Ecol. Indic. 2024, 158, 111606. [Google Scholar] [CrossRef]
  30. Zhang, W.; Wang, X.; Shen, S.; Zhao, Y.; Hao, S.; Jiang, J.; Zhang, D. Analyzing the Distribution Patterns and Dynamic Niche of Magnolia grandiflora L. in the United States and China in Response to Climate Change. Front. Plant Sci. 2024, 15, 1440610. [Google Scholar] [CrossRef]
  31. Ullah, I.; Saleem, F.; Iyakaremye, V.; Yin, J.; Ma, X.; Syed, S.; Hina, S.; Asfaw, T.G.; Omer, A. Projected Changes in Socioeconomic Exposure to Heatwaves in South Asia Under Changing Climate. Earths Future 2022, 10, e2021EF002240. [Google Scholar] [CrossRef]
  32. Wang, B.; Jin, C.; Liu, J. Understanding Future Change of Global Monsoons Projected by CMIP6 Models. J. Clim. 2020, 33, 6471–6489. [Google Scholar] [CrossRef]
  33. Murali, G.; Iwamura, T.; Meiri, S.; Roll, U. Future Temperature Extremes Threaten Land Vertebrates. Nature 2023, 615, 461–467. [Google Scholar] [CrossRef] [PubMed]
  34. Wang, L.; Jackson, D.A. Effects of Sample Size, Data Quality, and Species Response in Environmental Space on Modeling Species Distributions. Landsc. Ecol. 2023, 38, 4009–4031. [Google Scholar] [CrossRef]
  35. Gxasheka, M.; Gajana, C.S.; Dlamini, P. The Role of Topographic and Soil Factors on Woody Plant Encroachment in Mountainous Rangelands: A Mini Literature Review. Heliyon 2023, 9, e20615. [Google Scholar] [CrossRef]
  36. Zhang, H.; Zha, T.; Yu, Y.; Zhang, Z.; Zhang, X.; Zhang, H.; Ji, X. Functional Vegetation Community Responses to Soil and Topographic Factors in the Loess Plateau of China. Land. Degrad. Dev. 2023, 34, 5355–5372. [Google Scholar] [CrossRef]
  37. Liu, G.; Liu, Y.; Zhang, Y.; Huang, J.; Li, G.; Du, S. The Influence of Climatic and Human-Induced Factors on the Spatial Distribution of Invasive Plant Species Richness across the Loess Plateau. Glob. Ecol. Conserv. 2024, 54, e03083. [Google Scholar] [CrossRef]
  38. Gao, Z.; Zhou, Y.; He, Y. Molecular Epigenetic Mechanisms for the Memory of Temperature Stresses in Plants. J. Genet. Genom. 2022, 49, 991–1001. [Google Scholar] [CrossRef]
  39. Song, Z.; Song, X.; Pan, Y.; Dai, K.; Shou, J.; Chen, Q.; Huang, J.; Tang, X.; Huang, Z.; Du, Y. Effects of Winter Chilling and Photoperiod on Leaf-out and Flowering in a Subtropical Evergreen Broadleaved Forest in China. For. Ecol. Manag. 2020, 458, 117766. [Google Scholar] [CrossRef]
  40. Fu, Y.; Li, X.; Zhou, X.; Geng, X.; Guo, Y.; Zhang, Y. Progress in Plant Phenology Modeling under Global Climate Change. Sci. China Earth Sci. 2020, 63, 1237–1247. [Google Scholar] [CrossRef]
  41. Araújo, M.B.; Ferri-Yáñez, F.; Bozinovic, F.; Marquet, P.A.; Valladares, F.; Chown, S.L. Heat Freezes Niche Evolution. Ecol. Lett. 2013, 16, 1206–1219. [Google Scholar] [CrossRef] [PubMed]
  42. Zhao, L.; Xue, D.; Zhang, X.; Fu, Y. Estimation of Daily Mean Land Surface Temperature over the Qinghai–Tibet Plateau Based on an RTM-DTC Model. Atmosphere 2023, 14, 1559. [Google Scholar] [CrossRef]
  43. Hou, D.; Li, N.; Qu, X.; Dong, S.; Guo, K.; Liu, C. Divergent Responses of Nutrient Biogeographical Patterns in Different Shrub Types across the Arid Region of Qinghai-Tibet Plateau. BMC Plant Biol. 2024, 24, 1150. [Google Scholar] [CrossRef] [PubMed]
  44. Chaudhary, S.; Sharma, P.C. DeepSAGE Based Differential Gene Expression Analysis under Cold and Freeze Stress in Seabuckthorn (Hippophae rhamnoides L.). PLoS ONE 2015, 10, e0121982. [Google Scholar] [CrossRef]
  45. Kashyap, P.; Deswal, R. A Novel Class I Chitinase from Hippophae rhamnoides: Indications for Participating in ICE-CBF Cold Stress Signaling Pathway. Plant Science 2017, 259, 62–70. [Google Scholar] [CrossRef]
  46. Yao, S.; Akram, M.A.; Hu, W.; Sun, Y.; Sun, Y.; Deng, Y.; Ran, J.; Deng, J. Effects of Water and Energy on Plant Diversity along the Aridity Gradient across Dryland in China. Plants 2021, 10, 636. [Google Scholar] [CrossRef]
  47. Zhang, T.; Gao, G.; Liu, J.; Yang, G.; Lv, Z.; Zhang, J.; He, C. Transcripts and ABA-Dependent Signaling in Response to Drought Stress in Hippophae rhamnoides L. Trees 2020, 34, 1033–1045. [Google Scholar] [CrossRef]
  48. Sun, Z.; Han, J. Effect of Soft Rock Amendment on Soil Hydraulic Parameters and Crop Performance in Mu Us Sandy Land, China. Field Crops Res. 2018, 222, 85–93. [Google Scholar] [CrossRef]
  49. Deng, Y.; Li, X.; Shi, F.; Chai, L.; Zhao, S.; Ding, M.; Liao, Q. Nonlinear Effects of Thermokarst Lakes on Peripheral Vegetation Greenness across the Qinghai-Tibet Plateau Using Stable Isotopes and Satellite Detection. Remote Sens. Environ. 2022, 280, 113215. [Google Scholar] [CrossRef]
  50. Shang, P.; Shen, B.; Zeng, B.; Bi, L.; Qu, M.; Zheng, Y.; Ye, Y.; Li, W.; Zhou, X.; Yang, X.; et al. Integrated Transcriptomic and Metabolomics Analysis of the Root Responses of Orchardgrass to Submergence Stress. Int. J. Mol. Sci. 2023, 24, 2089. [Google Scholar] [CrossRef]
  51. Jian, S.; Wu, Z.; Hu, C.; Zhang, X. Sap Flow in Response to Rainfall Pulses for Two Shrub Species in the Semiarid Chinese Loess Plateau. J. Hydrol. Hydromech. 2016, 64, 121–132. [Google Scholar] [CrossRef]
  52. Wu, J.; Shi, Z.; Liu, S.; Centritto, M.; Cao, X.; Zhang, M.; Zhao, G. Photosynthetic Capacity of Male and Female Hippophae Rhamnoides Plants along an Elevation Gradient in Eastern Qinghai-Tibetan Plateau, China. Tree Physiol. 2021, 41, 76–88. [Google Scholar] [CrossRef] [PubMed]
  53. Wu, B.; Zhou, L.; Qi, S.; Jin, M.; Hu, J.; Lu, J. Effect of Habitat Factors on the Understory Plant Diversity of Platycladus Orientalis Plantations in Beijing Mountainous Areas Based on MaxEnt Model. Ecol. Indic. 2021, 129, 107917. [Google Scholar] [CrossRef]
  54. Horne, C.R.; Hirst, A.G.; Atkinson, D. Insect Temperature–Body Size Trends Common to Laboratory, Latitudinal and Seasonal Gradients Are Not Found across Altitudes. Funct. Ecol. 2018, 32, 948–957. [Google Scholar] [CrossRef]
  55. Li, Y.; Zhao, H.; Duan, B.; Korpelainen, H.; Li, C. Adaptability to Elevated Temperature and Nitrogen Addition Is Greater in a High-Elevation Population than in a Low-Elevation Population of Hippophae rhamnoides. Trees 2011, 25, 1073–1082. [Google Scholar] [CrossRef]
  56. Ivashchenko, K.; Sushko, S.; Selezneva, A.; Ananyeva, N.; Zhuravleva, A.; Kudeyarov, V.; Makarov, M.; Blagodatsky, S. Soil Microbial Activity along an Altitudinal Gradient: Vegetation as a Main Driver beyond Topographic and Edaphic Factors. Appl. Soil Ecol. 2021, 168, 104197. [Google Scholar] [CrossRef]
  57. Ma, Q.; Li, X.; Wu, S.; Zeng, F. Potential Geographical Distribution of Stipa Purpurea across the Tibetan Plateau in China under Climate Change in the 21st Century. Glob. Ecol. Conserv. 2022, 35, e02064. [Google Scholar] [CrossRef]
  58. Chen, K.; Wang, B.; Chen, C.; Zhou, G. MaxEnt Modeling to Predict the Current and Future Distribution of Pomatosace filicula under Climate Change Scenarios on the Qinghai–Tibet Plateau. Plants 2022, 11, 670. [Google Scholar] [CrossRef]
  59. Huang, R.; Du, H.; Wen, Y.; Zhang, C.; Zhang, M.; Lu, H.; Wu, C.; Zhao, B. Predicting the Distribution of Suitable Habitat of the Poisonous Weed Astragalus Variabilis in China under Current and Future Climate Conditions. Front. Plant Sci. 2022, 13, 921310. [Google Scholar] [CrossRef]
  60. Li, L.; Zhang, R.; Jia, L. Climatic Characteristics of Tibetan Plateau Vortex Precipitation Based on Observations. Int. J. Climatol. 2022, 42, 9237–9252. [Google Scholar] [CrossRef]
  61. Chen, Y.; Zhu, Y.; Luo, W.; Duan, T.; Chen, Q. Characteristics of Hourly Extreme Precipitation over the Eastern Extension of the Tibetan Plateau. Atmosphere 2024, 15, 170. [Google Scholar] [CrossRef]
  62. Nie, Y.; Sun, J. Increase in Summer Precipitation over the Sichuan Basin in Recent Decades and Possible Causes. Int. J. Climatol. 2023, 43, 4269–4285. [Google Scholar] [CrossRef]
  63. Wu, W.; Zhang, D.; Tian, L.; Zhang, H. Aeolian Activities and Protective Effects of Artificial Plants in Re-Vegetated Sandy Land of Qinghai Lake, China. Chin. Geogr. Sci. 2020, 30, 1129–1142. [Google Scholar] [CrossRef]
  64. Meinshausen, M.; Lewis, J.; McGlade, C.; Gütschow, J.; Nicholls, Z.; Burdon, R.; Cozzi, L.; Hackmann, B. Realization of Paris Agreement Pledges May Limit Warming Just below 2 °C. Nature 2022, 604, 304–309. [Google Scholar] [CrossRef]
  65. Soley-Guardia, M.; Alvarado-Serrano, D.F.; Anderson, R.P. Top Ten Hazards to Avoid When Modeling Species Distributions: A Didactic Guide of Assumptions, Problems, and Recommendations. Ecography 2024, 2024, e06852. [Google Scholar] [CrossRef]
Figure 1. Evaluation of single models and integrated models: RF represents Random Forest, GBM represents Generalized Boosted Model, MARS represents Multivariate Adaptive Regression Splines, FDA represents Flexible Discriminant Analysis Model, ANN represents Artificial Neural Network, GLM represents Generalized Linear Model, CTA represents Classification Tree Analysis, SRE represents Surface Range Envelope Model, and EM represents ensemble model.
Agriculture 15 00722 g001
Figure 2. Environmental response curve.
Agriculture 15 00722 g002
Figure 3. Status of the suitable climatic distribution of H. neurocarpa in China. The red dots represent the spatial distribution data of H. neurocarpa.
Agriculture 15 00722 g003
Figure 4. The potential distribution of H. neurocarpa in suitable regions in China under SSP2-4.5 climatic conditions.
Agriculture 15 00722 g004
Figure 5. The distribution changes of H. neurocarpa from the present to the future. The unsuitable, low-suitability, medium-suitability, and high-suitability areas are labeled as A, B, C, and D, respectively. A represents unsuitable habitat both currently and in the future; A to B indicates a shift from unsuitable to low-suitability habitat; A to C represents a shift from unsuitable to medium-suitability habitat, and so on.
Agriculture 15 00722 g005
Figure 6. Centroids of highly suitable habitats.
Agriculture 15 00722 g006
Table 1. Environmental variables affecting H. neurocarpa.
CodeVariableUnit
bio01Annual Mean Temperature°C
bio03Isothermality%
bio04Temperature Seasonality°C
bio05Max Temperature of Warmest Month°C
bio06Min Temperature of Coldest Month°C
bio09Mean Temperature of Driest Quarter°C
bio11Mean Temperature of Coldest Quarter°C
bio17Precipitation of Driest Quartermm
hfHuman Footprint Index/
elevElevationm
aspectAspect°
slopeSlope°
usdaUSDA Soil Texture Classification/
gm_lcLand Cover Type/
gm_veVegetation Cover Percentage%
ph_waterPotential of Water/
d1_swrAnnual Average Soil Moisture Status Category/
annual_mean_uv-bAnnual Average UV RadiationkJ/m2
Note: All environmental variables in the table are sourced from the websites mentioned in the article, and the three-month time span corresponds to one quarter.
Table 2. Contribution rate of environmental variables.
CodeContribution ValueContribution Rate (%)
bio040.5619.34%
bio170.3411.65%
bio110.3311.59%
bio060.3211.20%
elev0.3110.61%
bio010.289.61%
annual_mean_uv_b0.196.64%
bio050.155.09%
bio030.103.61%
hf0.093.05%
bio090.082.62%
d1_usda0.031.15%
d1_ph_water0.030.97%
aspect0.030.91%
gm_lc0.020.77%
slope0.020.75%
gm_ve0.010.44%
d1_swr00
Table 3. Potential ranges of suitable environmental variables for H. neurocarpa.
Environmental VariablesSuitable RangeOptimum Value
bio04618.25–915.56 °C821.18 °C
bio06−19.07–−7.86 °C−17.15 °C
bio11−8.70–8.62 °C−6.21 °C
bio170.55–19.64 mm5.62 mm
elev2045.63–3033.28 m2381.00 m
Table 4. Suitable areas under current and future climate conditions.
DecadePredicted Area (×103 km2)Comparison with Current Distribution (%)
Poorly Suitable AreaModerately Suitable AreaHighly Suitable AreaPoorly Suitable AreaModerately Suitable AreaHighly Suitable Area
Current115.09363.72238.94
2050s127.33248.8290.1210.64%−31.59%21.42%
2070s91.91205.16277.45−20.14%−43.59%16.12%
2090s100.97210.35292.2−12.26%−42.17%22.29%
Table 5. Changing areas of current and future suitable areas.
DecadePredicted Area (×103 km2)
AB to AC to AD to AA to BBC to BD to B
2050s8488.1952.2995.9910.0259.0619.7737.9210.57
2070s8491.8662.67146.3037.4048.7212.1719.5311.49
2090s8464.7463.09144.4436.9457.9910.3620.2612.36
DecadePredicted Area (×103 km2)
A to CB to CCD to CA to DB to DC to DD
2050s45.5636.32127.7639.172.196.70102.05179.18
2070s50.6932.1592.4829.833.738.09105.40160.23
2090s65.4530.8083.0431.066.8210.83115.97158.58
Disclaimer/Publisher’s Note: The statements, opinions and data contained in all publications are solely those of the individual author(s) and contributor(s) and not of MDPI and/or the editor(s). MDPI and/or the editor(s) disclaim responsibility for any injury to people or property resulting from any ideas, methods, instructions or products referred to in the content.

