1. Introduction
Global food security has emerged as a critical concern in the 21st century, exacerbated by accelerating population growth and the escalating impacts of climate change due to continued population growth and intensifying climate change [
1,
2,
3]. As a staple crop food for over half of the global population [
4], rice cultivation plays a pivotal role in ensuring regional food security and socioeconomic stability [
5,
6,
7,
8]. Traditional crop monitoring techniques, predominantly dependent on manual field surveys, are increasingly inadequate due to their labor-intensive nature, temporal latency, and inability to provide spatially continuous observations [
9,
10]. In response, satellite remote sensing has revolutionized agricultural monitoring by enabling precise, large-scale, and dynamic crop mapping, thereby enhancing decision-making efficiency in cultivation management [
11,
12,
13,
14].
Optical remote sensing, with its rich spectral information, has been widely adopted for rice identification through various vegetation indices, such as NDVI [
5,
15,
16,
17]. However, its effectiveness is severely affected by cloud coverage, particularly during critical rice growing seasons that often coincide with cloudy and rainy weather. Synthetic Aperture Radar (SAR), with its all-weather imaging capability, offers complementary structural insights into rice canopy characteristics, including plant height, density, and moisture content [
14,
18,
19]. Despite these advantages, SAR data present inherent limitations, including speckle noise and interpretational complexity due to distinct scattering mechanisms. Consequently, the integration of optical and SAR data has gained traction as a means to enhance classification accuracy by leveraging their complementary strengths [
20,
21,
22,
23].
According to the level of information integration, optical–SAR data fusion approaches can be broadly categorized into three strategies: input-level fusion, feature-level fusion, and decision-level fusion [
22,
24,
25,
26]. Input-level fusion preserves complete information by directly combining raw or preprocessed data from both modalities [
23,
27,
28,
29]. Feature-level fusion integrates features extracted from different modalities before classification, offering flexibility in feature representation [
30,
31,
32,
33]. Decision-level fusion processes each modality independently and combines their classification results, providing a modular approach to multi-source data integration [
34,
35].
The emergence of deep learning has fundamentally transformed the landscape of optical-SAR data fusion, offering unprecedented capabilities to model complex non-linear relationships between these heterogeneous data sources. Recent studies have predominantly focused on feature-level fusion [
30,
33,
36]. For instance, refs. [
32,
37,
38,
39] employ dual-branch designs based on Convolutional Neural Networks (CNNs) to extract spatial features from optical and SAR data separately before fusion. However, their fixed receptive fields and geometric constraints limit their ability to model complex cross-modal interactions. CNN-RNN hybrid architectures incorporate temporal modeling capabilities, attempting to capture both spatial and temporal dependencies in multi-temporal remote sensing data [
24,
40]. Nevertheless, they face challenges in processing long-range dependencies while maintaining spatial context. Attention-based methods, though promising, often treat attention mechanisms as auxiliary components rather than core architectural elements, thereby restricting their capacity to capture global relationships [
25,
32,
41]. Ofori-Ampofo et al. [
25] adopted an attention-based pixel-level classification model to compare the crop identification performance of three image fusion strategies. The study demonstrated that input-level and feature-level data fusion methods achieved a 2% higher F1-score compared to decision-level fusion. However, the three fusion strategies explored in their study were relatively simplistic (e.g., simple stacking or averaging), which failed to effectively leverage the complementary characteristics of optical and SAR data.
The Transformer architecture, initially developed for natural language processing, has revolutionized sequential data modeling through self-attention mechanisms that dynamically capture global dependencies [
42]. Adapted to computer vision, Vision Transformers have demonstrated exceptional performance in tasks requiring both local detail preservation and global contextual understanding [
43,
44,
45]. While hybrid CNN–Transformer architectures have been explored in remote sensing [
46,
47,
48,
49,
50], their reliance on CNNs for local feature extraction may constrain the Transformer’s capacity to fully exploit global relationships. Recent studies suggest that pure Transformer architectures can effectively integrate local and global features without convolutional operations [
45,
51,
52], yet their application to optical–SAR fusion remains unexplored.
The extensive exploration of feature-level fusion in deep learning implicitly assumes its superiority over input-level and decision-level strategies. However, this assumption lacks systematic validation, especially in the context of rice identification, where environmental factors and data characteristics may significantly influence the effectiveness of different fusion approaches. Furthermore, the comparative performance of these three strategies within the Transformer framework remains unexplored, limiting insights into their adaptability across diverse agricultural landscapes.
In this context, our study presents a systematic investigation of different fusion strategies within a Transformer-based framework for rice identification. The main contributions of this work are as follows:
- (1)
We propose three novel Transformer-based networks—Early Fusion Transformer (EFT), Feature Fusion Transformer (FFT), and Decision Fusion Transformer (DFT)—each implementing distinct fusion strategies (input-level, feature-level, and decision-level) tailored for optical-SAR synergy;
- (2)
We conduct a systematic comparison of these three fusion strategies within the Transformer framework for rice identification, providing comprehensive insights into their performance and practical applicability;
- (3)
We demonstrate the superior adaptability and robustness of our proposed fusion networks, particularly in challenging scenarios such as cloud-covered areas.
3. Methodology
3.1. Overview of the Multi-Modal Transformer Framework
To effectively address the challenges in rice identification using multi-modal remote sensing data, we propose a Transformer-based framework that leverages the strengths of both optical and SAR data through different levels of fusion.
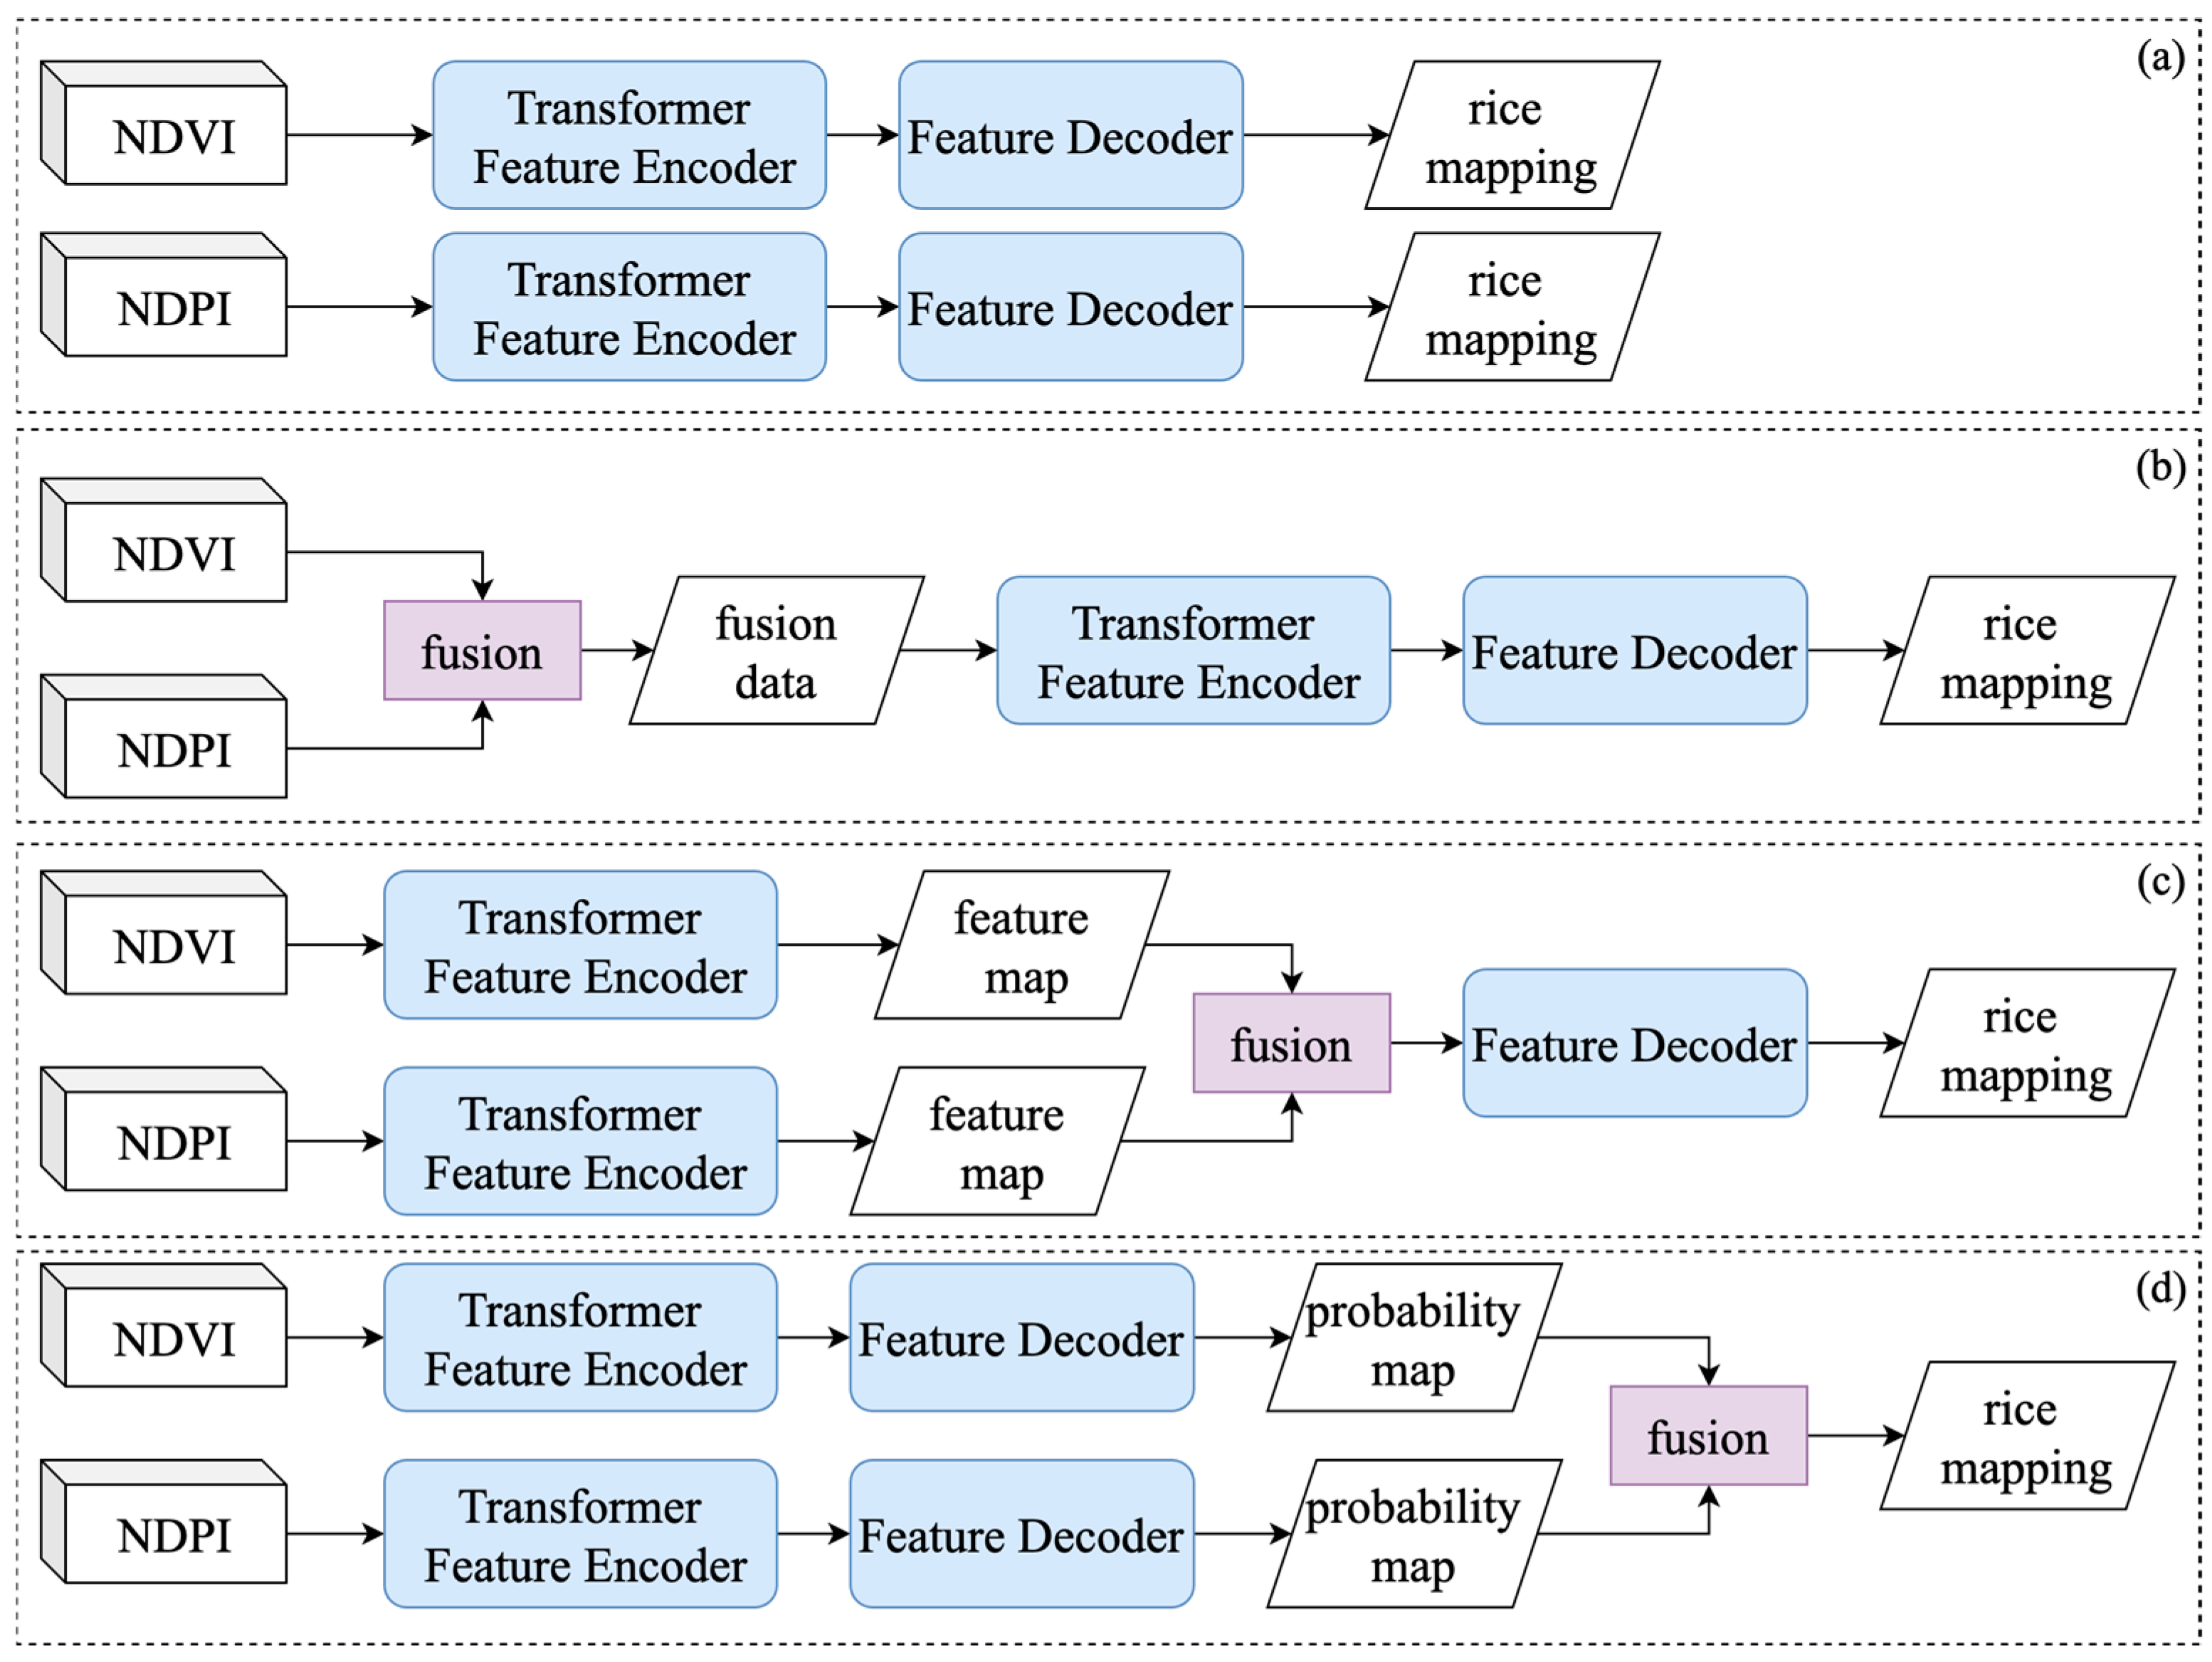
Figure 3 provides an overview of our framework, illustrating how the three fusion strategies relate to the core Transformer architecture.
The proposed framework consists of two main components: a Transformer-based feature extraction module and a multi-modal fusion strategy. The backbone of the model is a Swin Transformer encoder [
45], which serves as the core feature extractor, capturing both local spatial structures and global contextual relationships across different modalities. Our framework builds upon established fusion concepts from the literature [
25,
41] but innovatively integrates them with Transformer architectures specifically optimized for rice identification.
As shown in
Figure 3, we implement three distinct fusion strategies operating at different processing stages:
- (1)
Early Fusion Transformer (EFT): integrates optical and SAR data at the input-level before Transformer processing through an adaptive channel attention mechanism;
- (2)
Feature Fusion Transformer (FFT): Employs a dual-stream architecture with parallel Transformer feature encoders. The model dynamically integrates intermediate features during the encoding process, adaptively balancing the contribution of each modality based on feature reliability and relevance;
- (3)
Decision Fusion Transformer (DFT): Employs a late fusion strategy through independent processing streams. Processes each modality through separate Transformer pipelines until the final classification stage, where predictions are combined through a learnable weighting parameter.
All three strategies share the same underlying Transformer-based feature extraction architecture but differ in where and how the fusion occurs. This design allows us to systematically evaluate the effectiveness of fusion at different processing stages for rice identification.
3.2. Transformer-Based Feature Extraction Architecture
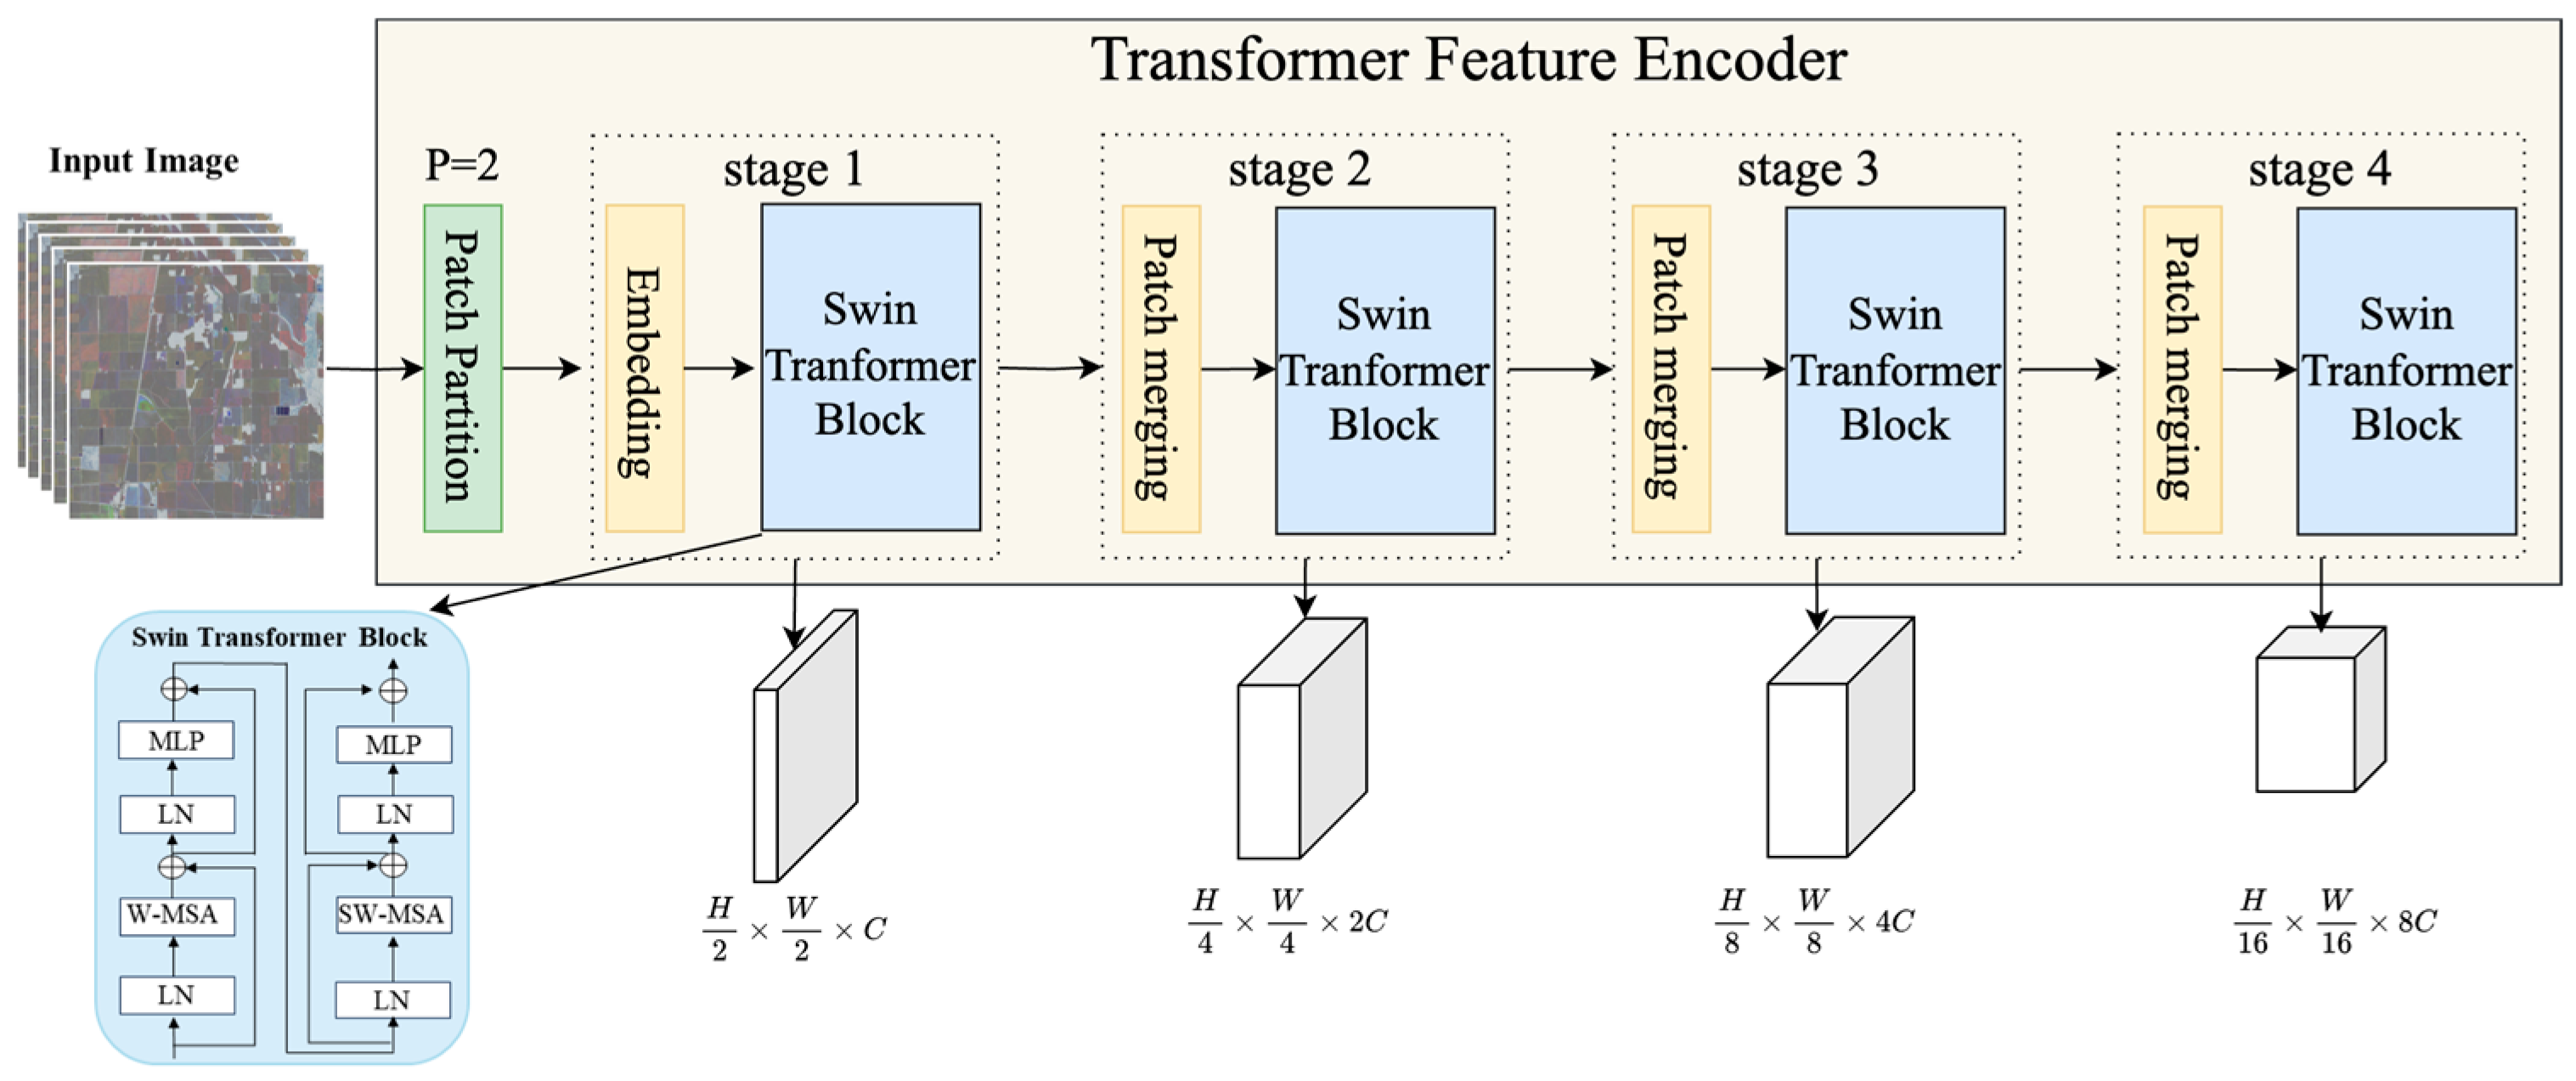
The foundation of our framework is a hierarchical vision Transformer [
45], which we have adapted for multi-temporal remote sensing data processing (
Figure 4). Unlike conventional CNNs, which rely on fixed convolutional kernels, the hierarchical vision Transformer utilizes self-attention mechanisms to dynamically capture spatial dependencies at different scales, making it particularly suitable for capturing the complex spatial patterns of rice fields.
The feature extraction process begins with patch embedding, where the input features are partitioned into non-overlapping patches of size 2 × 2 and linearly projected into a high-dimensional feature space. The embedded patches then undergo hierarchical transformation through the four stages, with the feature resolution progressively reduced by a factor of 2 and the channel dimension doubled at each stage. This multi-scale feature representation is particularly beneficial for rice identification as it not only captures fine-grained field characteristics through local-level feature learning, essential for detecting field boundaries and within-field texture patterns that distinguish rice from other crops, but also captures broad contextual relationships through global-level feature aggregation, crucial for understanding the temporal dynamics of rice growth patterns and regional farming practices.
Within each Swin Transformer block, we implement two complementary attention mechanisms: Window-based Self-Attention (W-MSA) and Shifted Window-based Self-Attention (SW-MSA). The W-MSA mechanism processes features within fixed local windows, capturing fine-grained spatial relationships, while SW-MSA enables cross-window information exchange through shifted partition patterns. This dual-attention design efficiently handles multi-scale features while maintaining computational efficiency. The computation process is as follows:
where
represents the output features of (S)W-MSA at layer i, LN denotes layer normalization, and MLP is a multi-layer perceptron.
The decoder included a Pyramid Pooling Module (PPM) [
59] and a Feature Pyramid Network (FPN) [
60] to parse and integrate the self-attention based feature maps. The function of PPM was to produce scene-level features. The four scales of object-level feature maps that came from the encoder were combined with scene-level features by the FPN, which then formed the multi-level integrated features.
3.3. Multi-Modal Fusion Strategies
Based on the Transformer architecture described above, we propose three innovative Transformer-based fusion models, each implementing a different fusion strategy for optical-SAR data integration.
3.3.1. Early Fusion Transformer
The Early Fusion Transformer (EFT) integrates optical and SAR data at the input stage before feature extraction, specifically designed to address the heterogeneous nature of multi-temporal optical and SAR data in rice identification. Rice exhibits distinct spectral and structural characteristics across its growth cycle, ranging from flooded fields during early growth stages, which SAR captures effectively due to its sensitivity to water surfaces, to chlorophyll-rich canopies in later stages, best detected by optical sensors. By integrating these complementary signals at an early stage, EFT enables the model to jointly learn spectral–structural representations, improving classification robustness in diverse environmental conditions.
Unlike traditional feature stacking approaches, EFT employs a channel attention mechanism [
61] that dynamically adjusts the importance of optical and SAR information based on their relevance to the classification task. As shown in
Figure 5, the fusion process begins by stacking the optical and SAR images along the channel dimension. The optical input, denoted as
consists of
temporal observations with
spectral channels, while the SAR input,
contains
temporal observations with
polarimetric channels. These multi-channel inputs are concatenated along the channel dimension to form a representation
, represents the combined feature space encompassing the full temporal evolution of rice fields.
To ensure that the model effectively leverages the most informative features from each modality, a three-step channel attention mechanism—squeeze, excitation, and scaling—is applied to the stacked features. First, the squeeze operation compresses the global spatial information of each channel using global average pooling, producing a descriptor that captures the overall temporal–modal context:
where y represents the stacked input features with spatial dimensions
, and i and j correspond to pixel locations. This step effectively summarizes the dominant spectral and backscatter responses associated with rice cultivation, identifying the most relevant features at each growth stage.
The excitation operation then learns interdependencies among all temporal observations and spectral–polarimetric channels through a two-layer fully connected network:
where
represents the sigmoid activation that normalizes outputs to [0, 1],
is the ReLU function, and
and
are learnable parameters.
Finally, the scaling operation applies these learned weights to the original input features, producing enhanced multi-modal representations:
This adaptive weighting mechanism ensures that EFT can dynamically adjust the importance of different temporal observations based on their contribution to rice phenology. Additionally, it allows the model to suppress noise in either modality, mitigating issues such as cloud-covered optical data and speckle noise in SAR imagery.
The enhanced multi-modal features
are then processed through the Transformer architecture described in
Section 3.2, which further leverages the self-attention mechanism to capture spatial context essential for accurate rice field delineation. The hierarchical feature processing of the Transformer is especially effective at aggregating the multi-temporal information now optimally weighted by the channel attention mechanism.
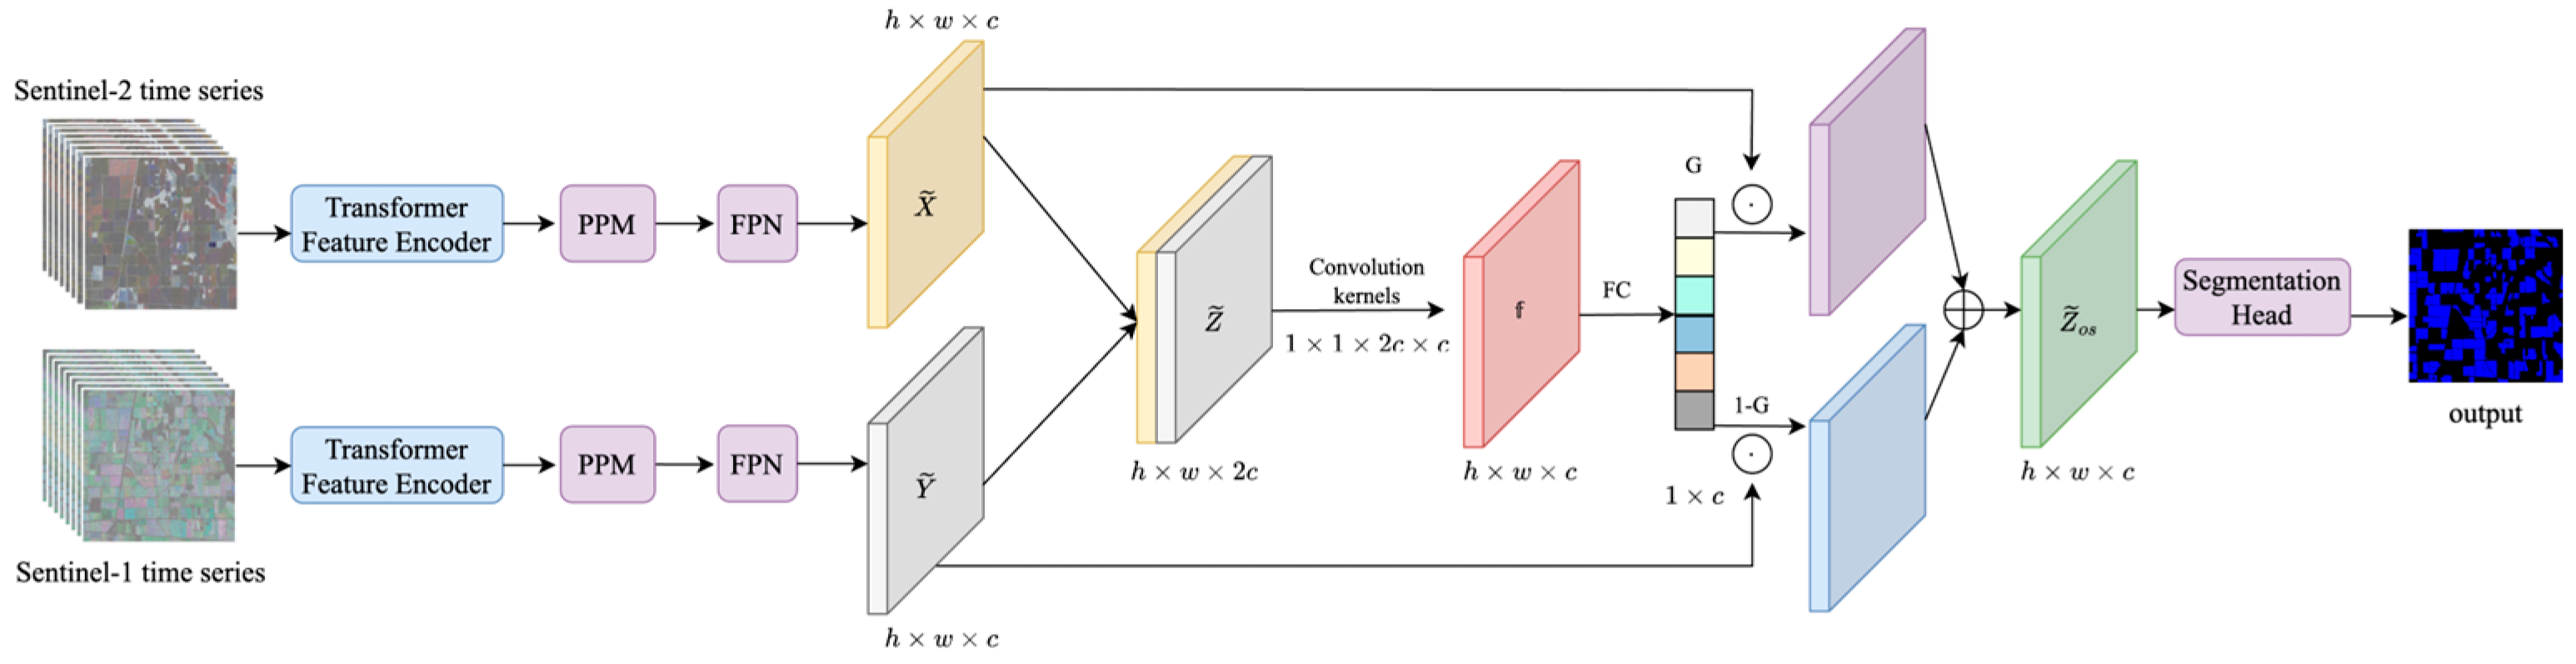
3.3.2. Feature Fusion Transformer
The Feature Fusion Transformer (FFT) implements a dual-stream in which optical and SAR images are first processed separately before fusing their features at an intermediate stage. This strategy preserves the flexibility of independent feature extraction while enabling deep cross-modal interactions that are particularly beneficial for rice field identification.
As illustrated in
Figure 6, the dual-stream architecture is designed to leverage the fundamentally different information contained in optical and SAR observations. Rather than forcing an early integration of these heterogeneous data types, FFT allows each modality to first develop its specialized feature representations. In the optical stream, multi-temporal Sentinel-2 data are processed through a hierarchical Transformer encoder based on the Swin Transformer backbone. This encoder produces optical-specific features, denoted as
, that encapsulate the spectral–temporal evolution characteristic of rice fields—for example, the marked increase in vegetation indices during early vegetative stages and more gradual changes during grain filling and maturation.
Simultaneously, the SAR stream processes multi-temporal Sentinel-1 data independently to generate SAR-specific features, denoted as , which capture the unique backscatter dynamics associated with rice cultivation practices. Crucially, both streams employ the Swin Transformer architecture but maintain independent parameters to ensure modality-specific optimization. This design ensures that each encoder can specialize in extracting the most relevant features for rice identification from its respective data type without compromise.
The core innovation of FFT lies in its adaptive feature fusion mechanism, which consists of several key steps. First, the refined features from the two streams are concatenated along the channel dimension to form a unified representation:
Here, represents channel-wise concatenation, which preserves all spatial and contextual information from both modalities.
Then, a convolutional layer processes the concatenated features to learn cross-modal interactions:
This convolution is critical for rice identification, as it enables the network to combine evidence from both modalities—for instance, using SAR backscatter patterns to confirm rice paddies when the optical spectral signatures are ambiguous due to interference from similar crops.
The output of the convolution is then passed through a fully connected layer to generate adaptive fusion weights:
where
is the sigmoid activation function that constrains weights to [0, 1], while
and
are learnable parameters. This adaptive mechanism is particularly valuable for handling regional variations in rice cultivation practices and seasonal differences that affect the relative informativeness of each data source.
The final fused features are obtained through a weighted combination:
where
denotes element-wise multiplication and
denotes element-wise addition.
This adaptive fusion mechanism allows the model to dynamically adjust the contribution of each modality based on their reliability and relevance to rice identification. For instance, when optical features provide clear spectral signatures of rice fields, they may be weighted more heavily. Conversely, when cloud cover compromises optical data quality, the model can rely more on SAR features that capture structural information. The fused features are finally processed through a segmentation head to generate the rice field classification map.
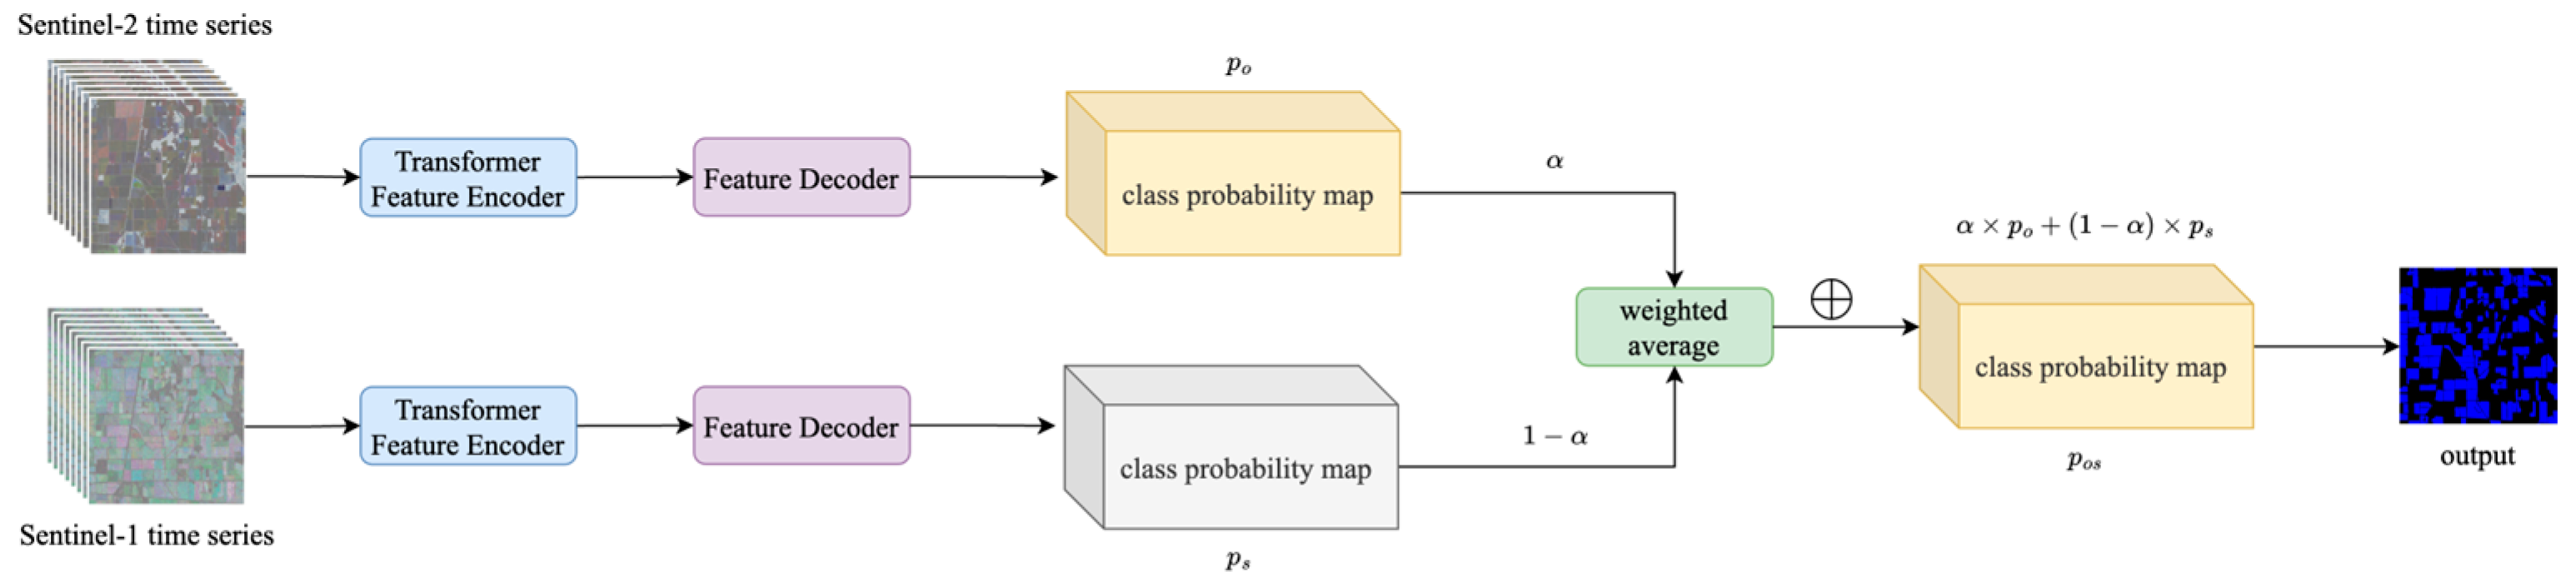
3.3.3. Decision Fusion Transformer
The Decision Fusion Transformer (DFT) is a novel implementation that combines traditional decision-level fusion principles with the Transformer architecture. Our DFT specifically introduces a Transformer-based approach with an adaptive weighting mechanism for integrating optical and SAR predictions.
The DFT approach, illustrated in
Figure 7, maintains complete independence between optical and SAR processing streams until the final decision stage, where their complementary predictions are optimally combined through a learnable weighting mechanism.
Each modality undergoes a complete end-to-end analysis through dedicated Transformer pipelines. The optical stream processes the Sentinel-2 time series through a full Transformer encoder–decoder sequence. This stream specializes in identifying rice fields based on their distinctive spectral signatures—capturing the unique reflectance patterns in NDVI that characterize different rice phenological stages. The optical stream generates a complete classification output , representing per-pixel probabilities for each class. These probabilities encapsulate the optical-based evidence for rice presence at each location, drawing on the full temporal evolution of spectral signatures throughout the growing season.
In parallel, the SAR stream separately processes the SAR time series to produce its own classification output, . This stream exploits the distinctive backscatter properties inherent in SAR data—capturing the temporal evolution of VV and VH responses that are characteristic of the flooding and structural properties of rice paddies. Notably, the SAR stream is less affected by cloud cover, ensuring consistent monitoring during adverse weather conditions.
The fusion mechanism employs an adaptive weighting strategy to combine these complementary predictions:
where
and
are the softmax probability outputs from the optical and SAR streams, respectively.
is a learnable parameter that dynamically adjusts the relative contribution of each modality. Unlike fixed-weight fusion approaches, this adaptive mechanism allows the model to determine the optimal balance between modalities based on their observed reliability for rice identification across the diverse landscapes and conditions in the study area.
The entire DFT model, including both processing streams and the fusion parameter
, is trained end-to-end using cross-entropy loss:
where
represents the ground truth labels. This unified training strategy allows gradients to flow through both streams simultaneously, ensuring that each modality develops complementary capabilities while the adaptive fusion mechanism converges to an optimal balance.
The DFT approach offers several distinct advantages for rice identification. By processing each modality independently, each stream can fully exploit its unique strengths—the optical stream for its detailed spectral information and the SAR stream for its robust structural insights during cloudy conditions. The learnable fusion parameter further provides the flexibility to dynamically adjust the importance of each modality based on the specific data quality and environmental conditions encountered. This design not only enhances robustness but also offers improved interpretability, as the value of can be analyzed to understand the relative contributions of optical and SAR data across different regions or time periods.
3.4. Experimental Setting
The proposed framework was implemented using PyTorch 2.0.1 and trained on two NVIDIA RTX 3090 GPUs with 24 GB memory each. All the experiments were conducted under consistent settings to ensure fair comparison. The network was trained using the AdamW optimizer with an initial learning rate of 0.0001, which was adjusted using a cosine annealing schedule. We employed a weight decay of 0.01 to prevent overfitting and set the momentum parameters and to 0.9 and 0.999, respectively.
The training process utilized a batch size of 8 and ran for 300 epochs. To enhance model generalization and robustness, we implemented a comprehensive data augmentation strategy including random horizontal and vertical flips, random rotation and random scaling. The input images were standardized to 1098 × 1098 pixels to maintain computational efficiency while preserving sufficient spatial information for rice field identification.
3.5. Evaluation Metrics
The model’s performance was evaluated using seven metrics, including Overall Accuracy (OA), mean Intersection over Union (MIoU), rice-specific Intersection over Union (IoU_rice), Precision, Recall, F1-score, and Kappa coefficient. These metrics were derived from the confusion matrix, where TP (true positive) represents correctly predicted rice pixels, TN (true negative) represents correctly predicted non-rice pixels, FN (false negative) represents actual rice pixels misclassified as non-rice, and FP (false positive) represents actual non-rice pixels misclassified as rice.
OA quantifies the global classification accuracy. The formula is as follows:
IoU is one of the most critical metrics in semantic segmentation, measuring the ratio of the intersection area between predicted and actual classes to their union area [
62]. MIoU averages the IoU across all classes (rice and non-rice); a higher MIoU indicates stronger discriminative ability across all classes. The class-specific IoU (IoU_rice) reflects the overlap between predicted and ground truth categories. The formulas are as follows:
Precision measures the proportion of correctly identified rice pixels among all predicted rice pixels. The formula is as follows:
Recall quantifies the proportion of actual cropland pixels correctly identified by the model. The formula is as follows:
F1-score is the harmonic mean of precision and recall, serving as a balanced metric to evaluate classification performance under class imbalance. It comprehensively reflects model performance:
Kappa coefficient measures the agreement between classification results and random chance, ranging from [−1, 1]. A higher value indicates more reliable results:
where
is equivalent to OA, and
is calculated as follows:
To ensure robust evaluation, all the experiments were repeated five times with different random seeds, and the average results are reported. Additionally, we conducted a qualitative analysis by visually comparing the predicted rice distribution maps with ground truth labels across various test regions, particularly focusing on areas with complex farming patterns and cloud-cover environmental conditions.
4. Results
4.1. Performance Comparison of Fusion Strategies for Rice Identification
4.1.1. Overall Accuracy and Quantitative Comparison of Different Fusion Strategies
A quantitative comparison of the fusion strategies is provided in
Table 1. The Early Fusion Transformer (EFT) demonstrated superior performance across all metrics, achieving an Overall Accuracy (OA) of 98.33% and a Mean Intersection over Union (MIoU) of 96.74%. This represents a significant improvement over single-modality approaches, surpassing both optical-only (OA = 97.23%, MioU = 94.69%) and SAR-only (OA = 96.45%, MIoU = 93.21%) baselines. The substantial enhancement in IoU_rice (83.47%) particularly underscores EFT’s effectiveness in precise rice field delineation.
The Feature Fusion Transformer (FFT) exhibits competitive but slightly lower performance with an OA of 97.85% and IoU_rice of 79.71%. While FFT’s precision (90.37%) approached that of EFT, its lower recall rate (87.75% compared to EFT’s 90.35%) indicated certain limitations in comprehensive rice field detection. This suggests that feature-level fusion, while effective, may not fully preserve critical information during independent modality processing.
In contrast, the Decision Fusion Transformer (DFT) performs significantly worse, (OA = 96.15%, MIoU = 92.71%, IoU_rice = 46.02%), with a poor recall rate of 49.51%. This performance gap suggests challenges in reconciling conflicting predictions from different modalities at the decision level, particularly in areas where optical and SAR data provide divergent information.
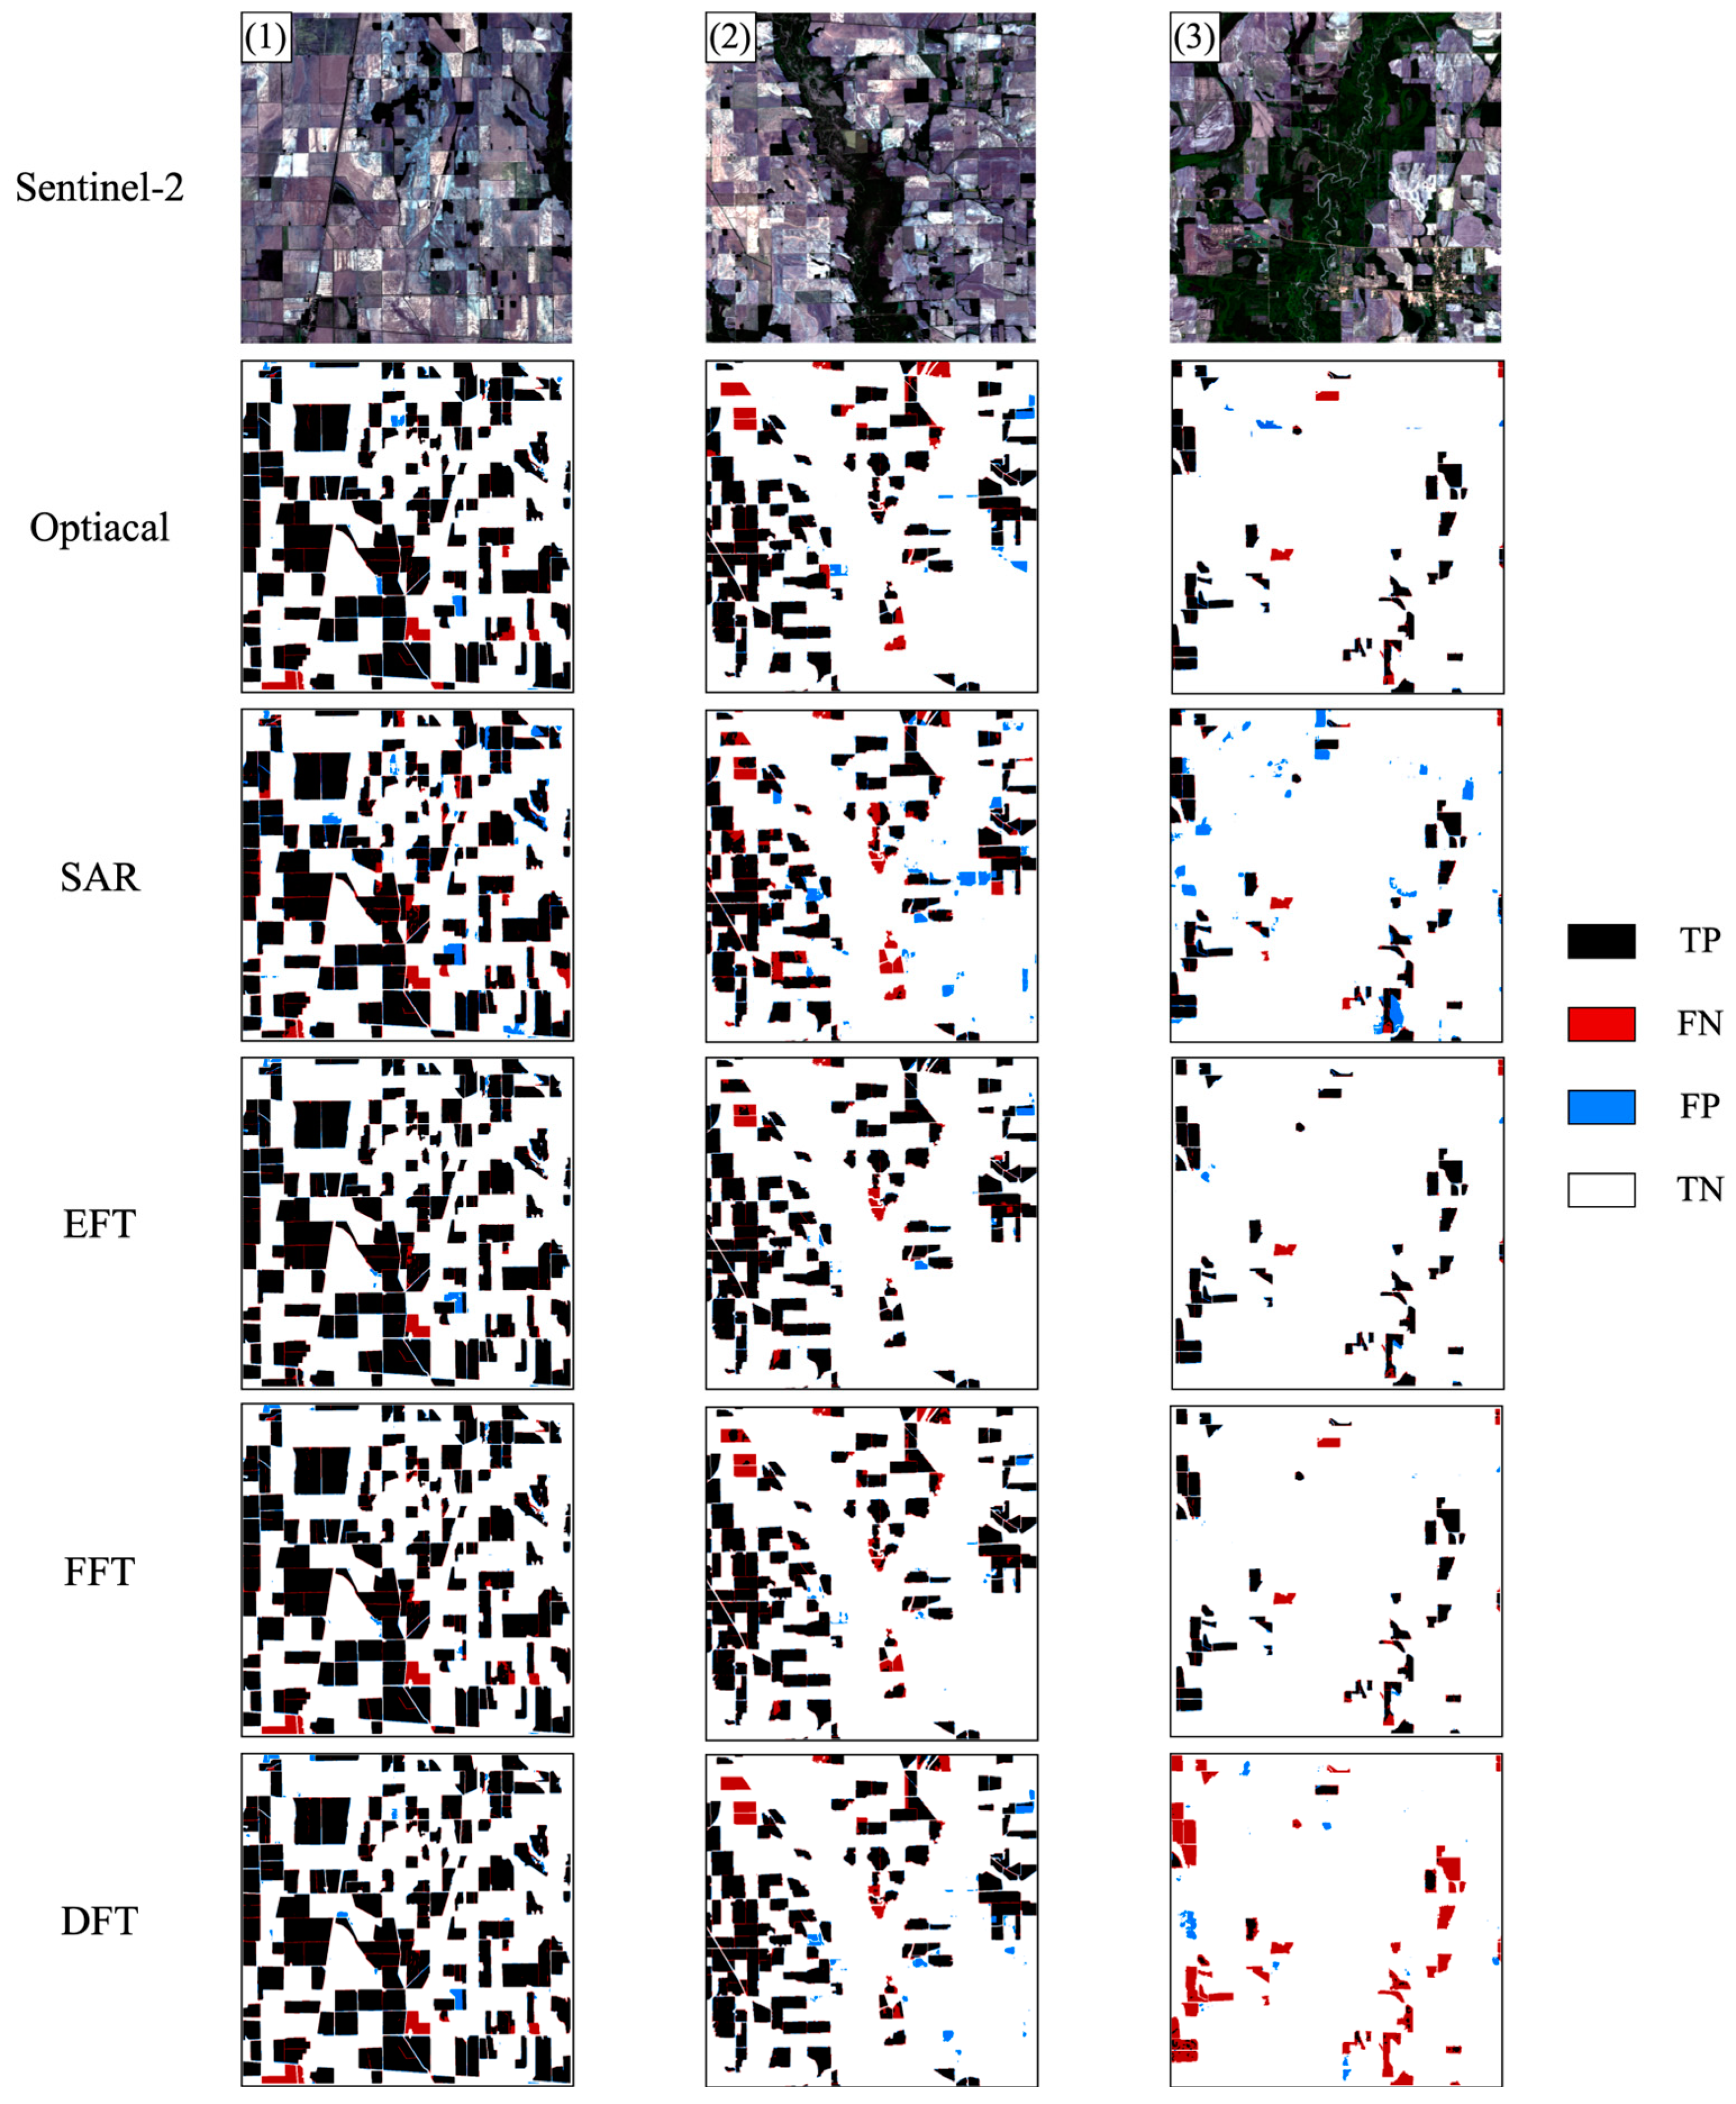
4.1.2. Spatial Distribution Performance of Rice Field Identification
The spatial analysis of identification results (
Figure 8) revealed distinct characteristics of each fusion strategy across varying landscape contexts. In high-density rice regions (
Figure 8 (1), rice pixel proportion: 33.45%), all the approaches achieved satisfactory results, with EFT exhibiting minimal FN (false negative) pixels, indicating a superior rice pixels detection capability. FFT demonstrated the lowest FP (false positive) rate, suggesting that feature-level fusion is less likely to misclassify non-rice pixels as rice pixels.
In the second group of
Figure 8, where the proportion of rice pixels decreases to 24.3%, the advantages of EFT become more evident, achieving the best results in rice identification. The analysis of FP distributions revealed that SAR-only approaches lead to a large number of non-rice pixels being misidentified as rice. The use of the DFT network also causes the same problem. However, EFT and FFT perform relatively well in terms of the misclassification of rice. It can be observed that the proportion of FN in the EFT network is the smallest, indicating that the problem of rice pixels being misclassified as non-rice pixels is minimal.
In the area where rice is extremely sparsely distributed (
Figure 8 (3)), the proportion of rice pixels is merely 7.07%. Both EFT and FFT maintained robust performance, while DFT showed a significant degradation in detection capability. Nevertheless, when only SAR data is input, it will lead to a large number of misclassifications of rice. From the FN pixels in the results of
Figure 8 (3), it can be observed that by using the EFT network, only one paddy field is misclassified and missed. In contrast, in the results of using the DFT network, most of the paddy fields are not correctly identified.
Based on a comprehensive analysis of the rice identification results in
Figure 8, it can be observed that the EFT network achieves the best performance in rice identification. The FFT network demonstrates a similar effect to the EFT network in terms of preventing the misclassification of rice as non-rice, which is consistent with the accuracy evaluation results in
Table 1. When the proportion of rice in the image is extremely low, the DFT network leads to a large number of rice pixels being misclassified and missed, resulting in a low identification accuracy for the rice class. Meanwhile, using only optical data yields better rice identification results than using only SAR data, with fewer misclassified and omitted pixels. Under all types of field conditions, the EFT network can maintain a relatively high and stable performance. It can accurately identify rice pixels while reducing false positives in non-rice areas. This highlights the advantages of early-stage fusion in accurately identifying crop types.
4.2. Performance of Rice Identification in Complex Scenarios
4.2.1. Field-Level Assessment
Figure 9 illustrates the performance of different approaches in complex field configurations. In Scenario (1), EFT demonstrated superior boundary delineation and classification accuracy. While optical-only approaches showed misclassification in the upper-right non-rice areas, FFT and DFT partially mitigated this issue. SAR-only results, though avoiding commission errors, exhibited significant boundary fragmentation. EFT successfully maintained field integrity while achieving precise boundary delineation.
Scenario (2) featured a regular-shaped rice paddy, where SAR-only and DFT results showed characteristic boundary degradation despite clear field geometry. While optical-only maintained boundary integrity, only EFT successfully avoided crop type misclassification in adjacent areas, demonstrating effective complementary information utilization.
In the more complex Scenario (3), the primary challenge was field omission. Both optical-only and DFT approaches failed to detect the southeastern rice paddy, while EFT and FFT showed varying degrees of detection success, with EFT achieving the highest detection rate. SAR-only results exhibited systematic boundary distortions, with both over- segmentation and under-segmentation observed in different field regions.
Based on a comprehensive analysis of the field-level identification results in the three regions above, it can be seen that when only optical data is used, there is a high likelihood of misidentifying non-rice fields as rice. When only SAR data is utilized, the identified rice fields often suffer from inaccurate boundary segmentation. The combined use of optical and SAR data can effectively address these issues. Among them, the rice identification results based on EFT can achieve the best-detailed results, yielding accurate and clear field boundaries. Meanwhile, it performs the best in terms of minimizing both the misclassification and omission of rice. The FFT network ranks second. In the results of Scenario 2, only the EFT and FFT fusion networks are capable of correctly distinguishing between rice and non-rice. Compared with the first two fusion networks, the DFT network shows relatively poor performance in terms of the omission of rice fields and boundary-related issues.
4.2.2. Cloud Impact Assessment
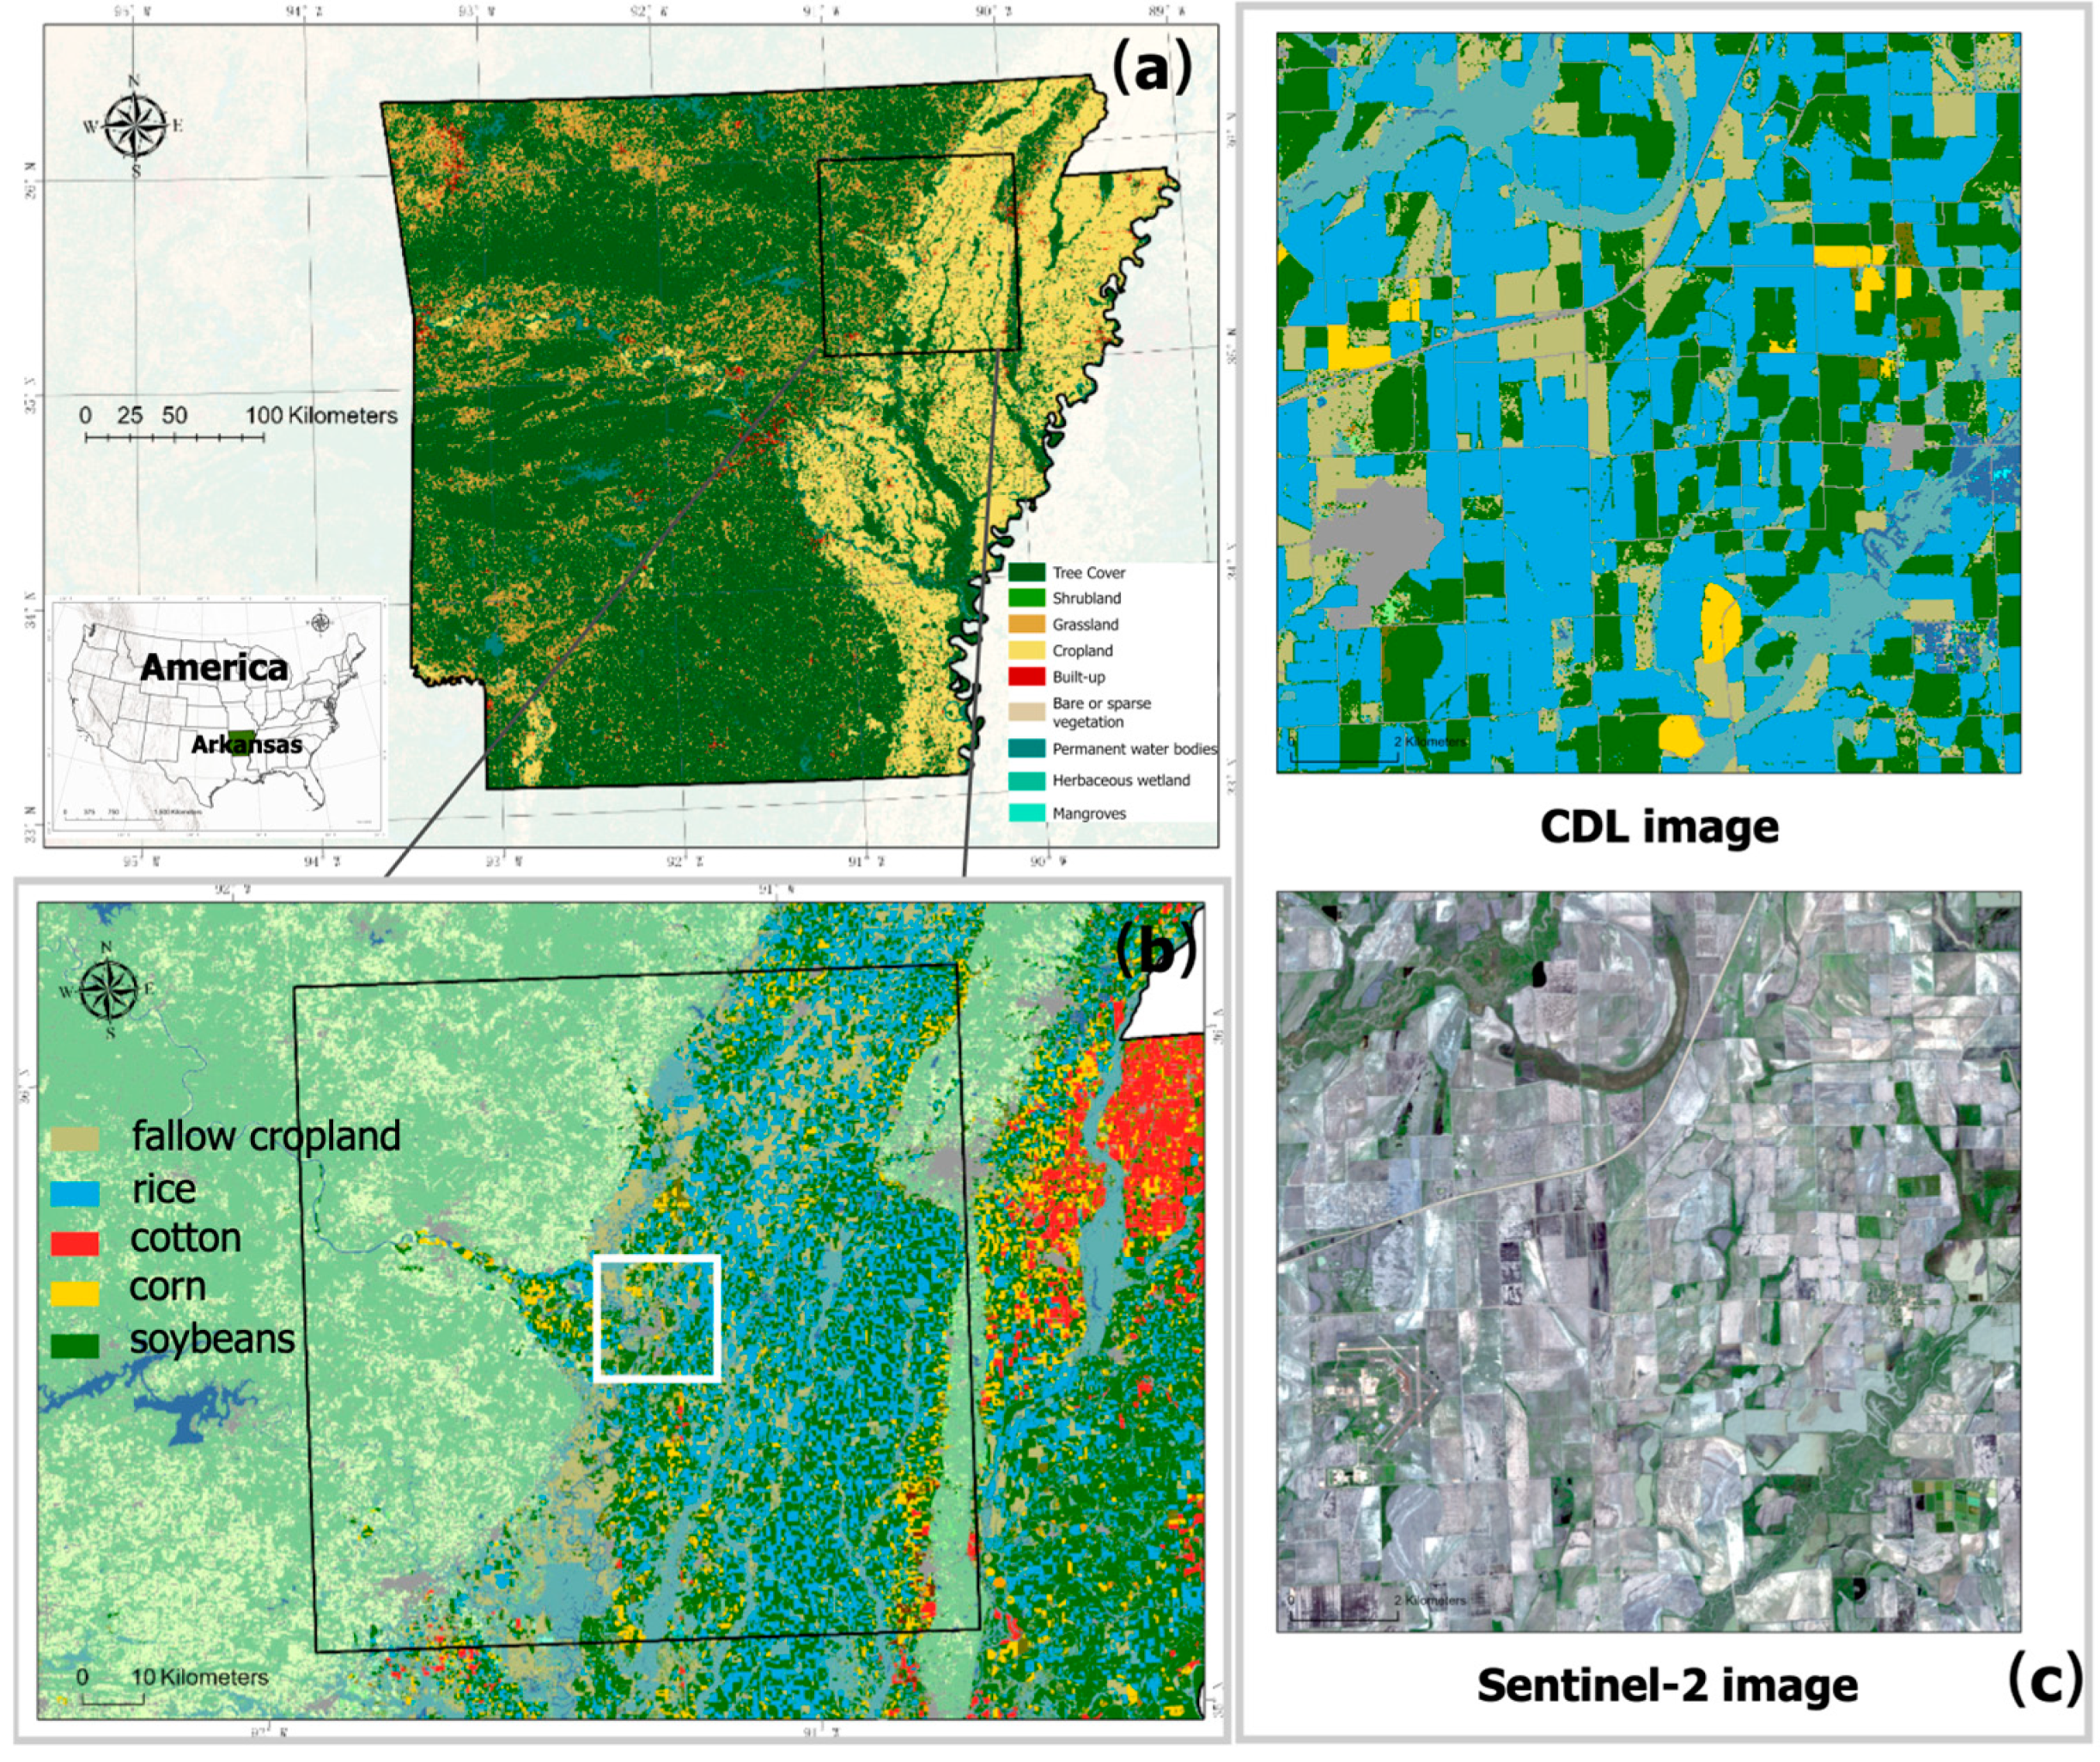
To evaluate the effectiveness of optical-SAR data fusion in cloud-affected regions, we analyzed rice identification results across three areas subject to varying degrees of cloud interference, as shown in
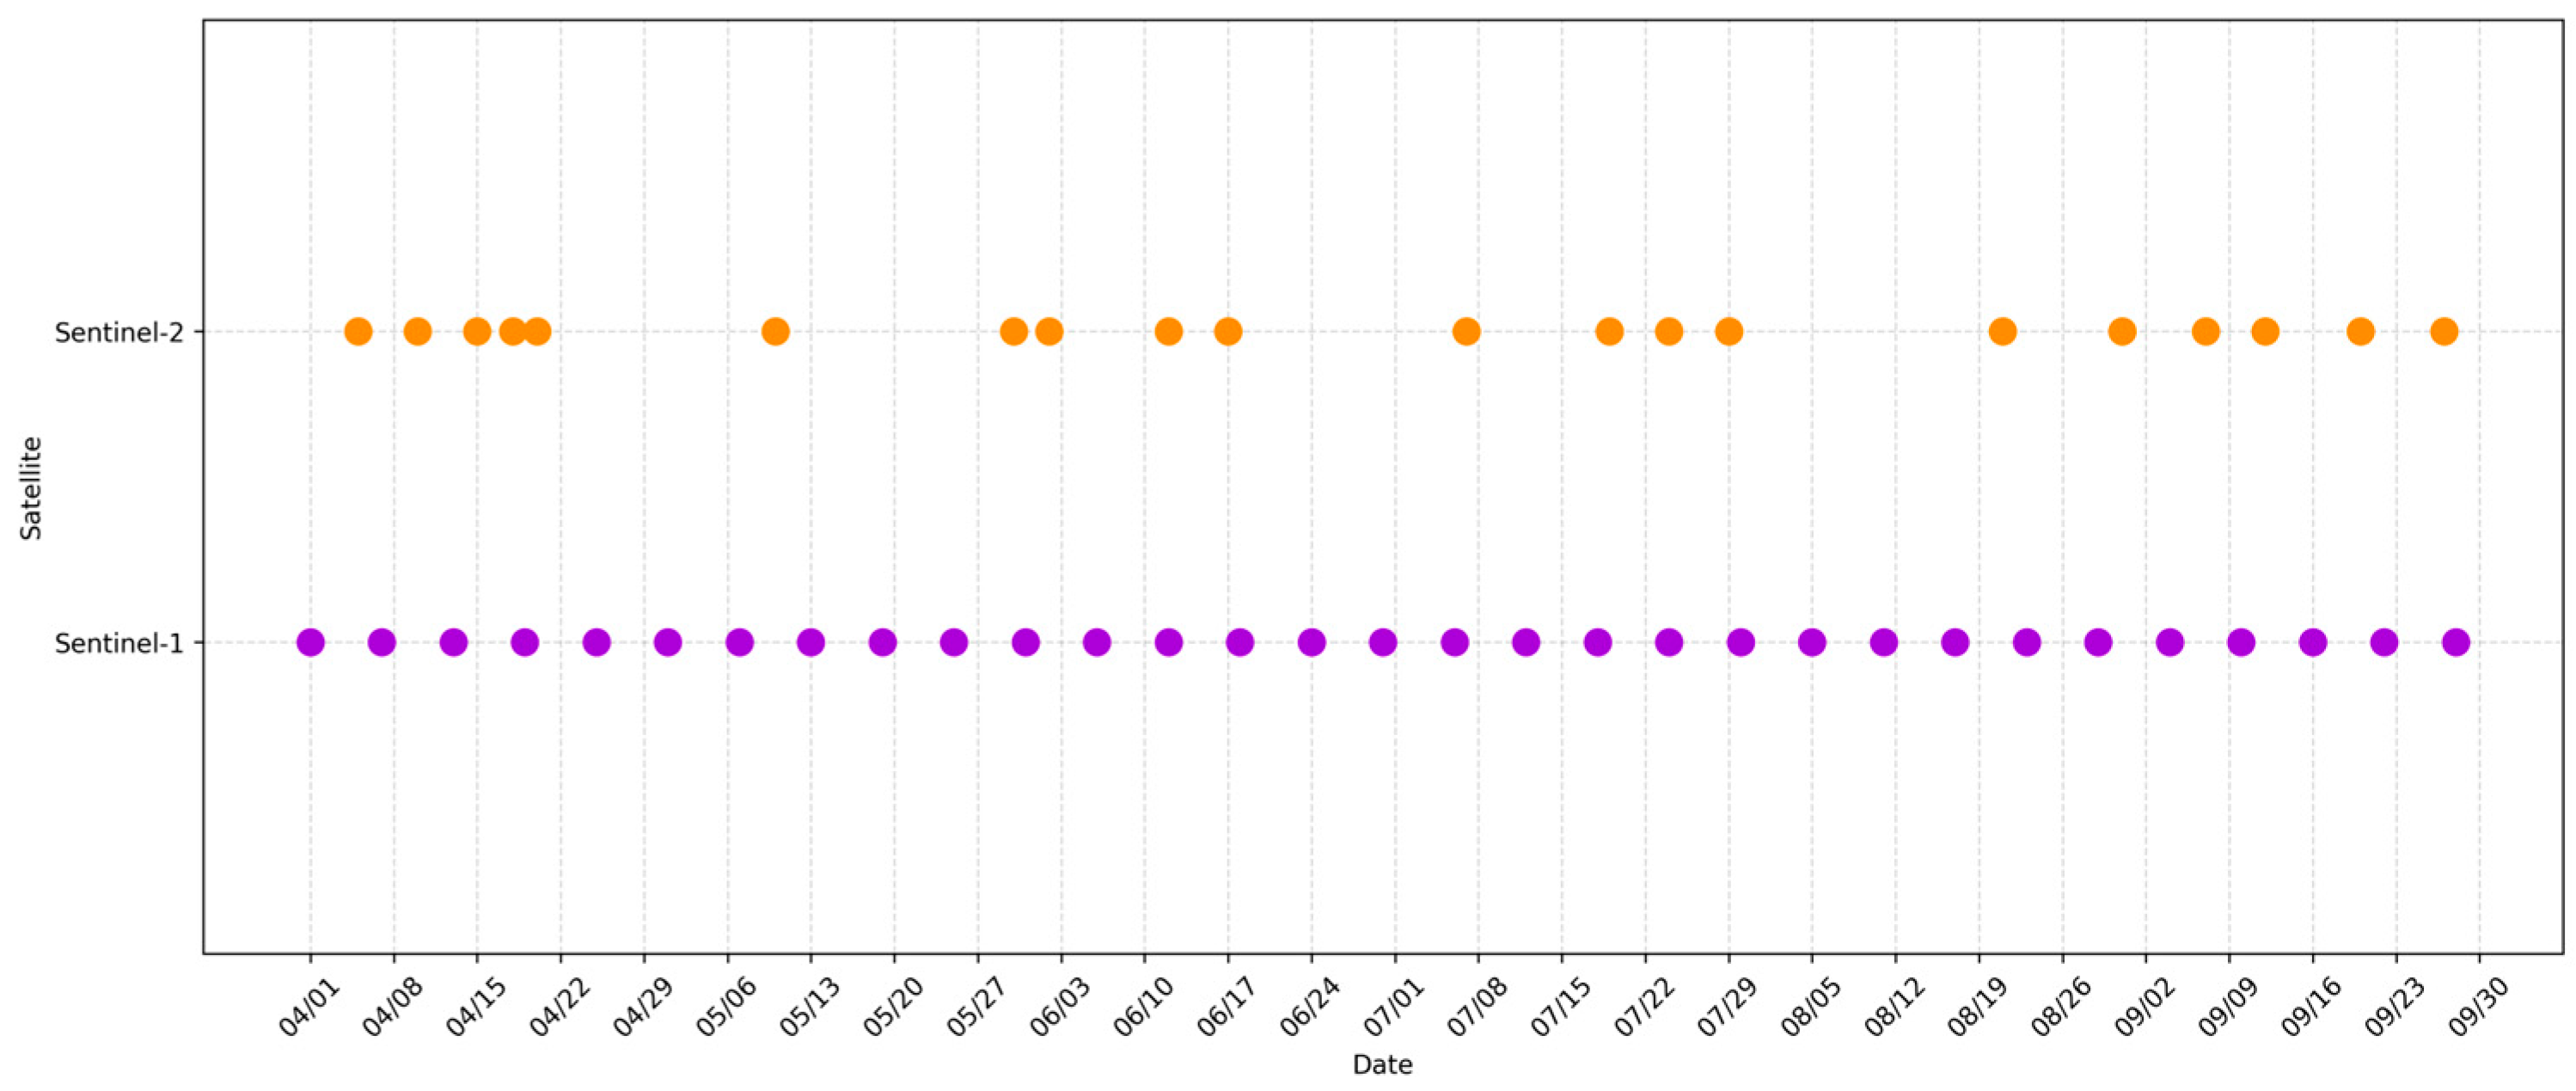
Figure 10. In our study, Sentinel-2 images with cloud cover below 20% were selected, and a long-term NDVI time series was generated using a maximum value composite approach, which aggregated NDVI values over 20-day intervals in order to reduce the impact of cloud cover on the identification results. However, during the period from 24 June to 13 July 2020, only a single Sentinel-2 image (acquired on 7 July 2020) met this cloud cover criterion (see
Figure 2). As a result, cloud contamination introduced distortions in NDVI values for this time period, impacting rice classification based solely on optical data.
The first column of
Figure 10 presents the composite NDVI images for the 24 June–13 July period, where the presence of clouds is clearly visible. The second column displays the corresponding NDPI images, which remain unaffected by cloud cover but exhibits significant speckle noise. The right panels show the rice classification results obtained using NDVI only, NDPI only, and the EFT-based fusion model. When relying solely on optical data, cloud interference significantly degraded rice identification across all three regions, with severe omission errors, particularly in heavily cloud-covered areas (
Figure 10 (1)). In contrast, classification based exclusively on SAR data (NDPI) was unaffected by cloud cover but suffered from incomplete field detection and imprecise boundary delineation due to speckle noise. The EFT demonstrated exceptional robustness against cloud interference, achieving complete field segmentation with precise boundary delineation, significantly reducing misclassification errors compared to optical-only approaches while improving boundary accuracy over SAR-only results.
These results demonstrate that EFT exhibits exceptional robustness against cloud interference by effectively leveraging the complementary strengths of optical and SAR data. Notably, EFT maintained consistent performance across varying cloud conditions and was able to accurately identify most rice fields even in fully cloud-covered areas (
Figure 10 (1)), while preserving fine spatial details.
4.3. Ablation Experiment
To evaluate the effectiveness of the three proposed fusion models and the contribution of their key components, we conducted an ablation study. Specifically, for the EFT, we assessed the importance of the channel attention mechanism by comparing the full model against a version where optical and SAR data were simply stacked along the channel dimension without adaptive weighting. For the FFT, we examined the role of the adaptive feature fusion module by replacing it with straightforward feature concatenation. For the DFT, we investigated the impact of the learnable weighting parameter (α) by fixing it at 0.5, assigning equal importance to both modalities without dynamic adjustment.
The ablation study results presented in
Table 2 clearly demonstrate the significance of adaptive fusion mechanisms in enhancing model performance. Removing the channel attention mechanism in EFT led to a 4.82% decrease in IoU_rice, confirming its critical role in dynamically adjusting feature contributions from different modalities. Similarly, replacing adaptive feature fusion with simple concatenation in FFT resulted in a 3.27% drop in IoU_rice, highlighting the importance of learning modality interactions instead of performing static feature merging. In the case of DFT, fixing the weighting parameter α only led to a 0.17% decrease in IoU_rice, suggesting that its limitations stem more from the constraints of late fusion rather than the weighting mechanism itself.
These findings validate the effectiveness of incorporating adaptive feature integration at different fusion stages, demonstrating that early-level and feature-level fusion approaches benefit significantly from dynamic weighting mechanisms, while decision-level fusion remains inherently constrained in capturing multi-modal interactions.
4.4. Comparison with Other Backbone Architectures
To further evaluate the performance of the proposed fusion framework, we compared EFT against widely used CNN-based architectures (UNet [
63], DeepLabV3+ [
64]) and another Transformer-based model (SegFormer [
65]) under an identical early fusion setting. Each architecture was tested with and without channel attention mechanisms to assess the impact of feature weighting.
As shown in
Table 3, EFT achieved the highest performance across all evaluation metrics, particularly in IoU_rice, indicating strong capability in distinguishing rice fields from other land cover or crop types. The second-best performer was SegFormer, another Transformer-based model, while the CNN-based architectures UNet and DeepLabV3+ showed a slightly lower performance than EFT and SegFormer, indicating that Transformer-based fusion strategies outperform CNN-based approaches in multi-modal rice classification.
The impact of channel attention varies significantly across architectures. For CNN-based models, like UNet and DeepLabV3+, adding channel attention provides substantial benefits, increasing IoU_rice by 4.13% and 2.71%, respectively. In contrast, for SegFormer, the effect was relatively minor, with IoU_rice improving by only 0.24%. This suggests that CNNs benefit more from explicit attention mechanisms when handling multi-temporal and multi-modal data, as their standard convolution operations have limited capacity to adaptively weight features across temporal, spectral, and polarimetric dimensions.
These findings provide a comparative assessment of different backbone architectures for multi-modal rice classification, demonstrating the effectiveness of Transformer-based early fusion strategies in leveraging both optical and SAR data.
5. Discussion
5.1. In-Depth Analysis of Different Fusion Strategies and Their Impact on Rice Identification
The superior performance of the Early Fusion Transformer (EFT) highlights the significance of early-stage integration in multi-modal remote sensing data fusion. By integrating optical and SAR data at the input level through channel attention mechanism, EFT effectively preserves the original spectral–temporal patterns from both modalities, enabling the model to learn joint representations that fully exploit their complementary characteristics. This early integration strategy demonstrates particular advantages in capturing the synergistic relationship between optical and SAR data, where spectral information from optical sensors effectively complements the structural information derived from SAR data.
Previous studies have demonstrated that simply combining [
23] or stacking optical and SAR data [
29] can yield improved results compared to using a single data source. Building on this foundation, EFT introduces a dynamic channel attention mechanism that automatically adjusts the contribution of each input channel based on its relevance to rice identification. This process further enhances the weighting of key spectral and temporal features. This approach proves especially valuable when dealing with the temporal dynamics of rice growth, where the relative importance of optical and SAR features varies throughout the growing season. For instance, SAR data provide crucial information during the early flooding and transplanting stages, while optical indices become more informative during later vegetative and reproductive phases. The channel attention mechanism effectively captures these changing relationships, leading to more robust rice identification across the entire growing cycle.
The performance gap between the EFT and Feature Fusion Transformer (FFT) reveals that the independent initial processing of different modalities may result in information loss, despite the implementation of sophisticated fusion mechanisms at later stages. While FFT exhibits competitive performance under ideal conditions (e.g., cloud-free scenarios), its slightly lower recall rate suggests the potential loss of subtle yet significant features during independent feature extraction processes. This observation aligns with recent findings in multi-modal learning research [
25], which emphasizes that early interactions between modalities facilitate more effective feature learning and representation. This may also be attributed to the fact that effectively integrating and extracting meaningful information from different modal features often requires more complex network architectures. This challenge has become a key research focus, with numerous studies exploring ways to improve feature-level fusion in deep learning models [
24,
30,
33,
66], to enhance their understanding of multi-modal features and ultimately improve fusion performance. Our study offers a different perspective—feature-level fusion networks may not always be the optimal choice for crop identification tasks.
The poor performance of the Decision Fusion Transformer (DFT) underscores the limitations of late fusion strategies in handling complex spatio-temporal patterns. The significant decrease in recall (49.51%) indicates that decision-level fusion struggles to reconcile potentially contradictory predictions from different modalities, particularly in challenging scenarios. These limitations become especially pronounced in areas with complex field patterns or adverse weather conditions, where the complementary nature of the two modalities is crucial for accurate identification. This is consistent with the results of previous studies [
30,
41,
67]. Whether in fusion methods based on shallow machine learning or deep learning architectures, the performance of decision-level fusion is not satisfactory and is not as good as feature-level fusion.
Several factors contribute to DFT’s poor performance. First, in the DFT architecture, errors from individual modality streams are propagated to the final decision fusion stage. This issue has also been highlighted in previous studies [
67], and although we introduced a learnable parameter
to mitigate errors through adaptive weighting, the weighted combination of predictions using
may not effectively compensate for significant misclassifications in the optical or SAR stream, especially when these errors occur in different spatial regions. Second, the learnable parameter
in DFT represents a global weighting factor between modalities. Our analysis reveals that this single parameter struggles to capture the complex, region-specific relationships between optical and SAR data, a limitation that has been similarly observed in other decision-level fusion approaches [
41]. Third, by reducing rich feature representations to class probabilities before fusion, DFT eliminates direct interaction between individual modality features [
24], creating an information bottleneck that discards potentially valuable complementary features. This loss of information is particularly problematic for rice identification, where subtle cross-modal patterns are crucial for distinguishing rice from similar crops or natural vegetation.
5.2. Model Adaptability and Robustness Under Complex Environmental Conditions
The EFT demonstrates exceptional performance in areas with significant cloud coverage, highlighting the effectiveness of early fusion and the channel attention mechanism in dynamically adjusting contribution weights for each modality. When optical data quality is compromised by cloud cover, EFT automatically increases the influence of SAR data while emphasizing unaffected optical observations from other temporal points. The ability to maintain consistent performance under variable atmospheric conditions addresses one of the most significant challenges in operational agricultural monitoring, particularly in regions with persistent cloud coverage such as Chongqing and Sichuan province in China, where continuous cloud obstruction has historically limited the effectiveness of purely optical approaches.
The model’s robust performance across diverse fields further demonstrates its practical utility. In regions with large, continuous rice fields, all fusion approaches achieved satisfactory results. However, in areas characterized by small, fragmented fields—a common feature in many Chinese agricultural regions—EFT maintained high accuracy while FFT and particularly DFT showed notable performance degradation. This consistent performance across varying field patterns can be attributed to two key architectural advantages: First, the Transformer backbone effectively leverages its self-attention mechanism to model complex spatial dependencies at multiple scales without the receptive field limitations inherent in CNN-based architectures. Second, the early fusion approach preserves important contextual information that might otherwise be lost during independent modality processing, allowing more accurate delineation of field boundaries and identification of isolated rice patches.
5.3. Advantages and Limitations
The primary advantages of our proposed framework lie in its robust performance and adaptive capabilities. The early fusion strategy, combined with the Transformer architecture, effectively captures complex spatio-temporal patterns while maintaining high accuracy across diverse fields. The model’s strong performance under cloud coverage and its ability to handle varying field patterns demonstrate its practical utility for operational agricultural monitoring.
However, several limitations should be noted. Firstly, the current implementation relies on pre-calculated indices (NDVI and NDPI). This approach, while computationally efficient, inherently involves a loss of some of the original spectral and polarimetric information. Given the powerful feature extraction capabilities of Transformer models, it is worth investigating whether using raw spectral/polarimetric bands as input could lead to better performance. Additionally, rice often exhibits strong water-related features, and indices such as Land Surface Water Index (LSWI), which are more sensitive to water content, should be considered [
14]. Furthermore, the VH polarization band, which is more sensitive to rice growth, could also be strengthened to enhance the model’s discriminative power. Secondly, the model’s effectiveness for other crop types and in different geographical regions requires further validation. While the current study focuses on rice, extending the model to other crops and diverse environmental conditions would provide a more comprehensive assessment of its generalizability and robustness. Future research should aim to evaluate and improve the model’s performance across a broader range of agricultural applications.
6. Conclusions
This study provides a comprehensive analysis of multi-modal fusion strategies for rice field identification, integrating optical and SAR remote sensing data. The comparative analysis of different fusion strategies—input-level (EFT), feature-level (FFT), and decision-level (DFT)—reveals that early fusion minimizes information loss by enabling direct interaction between modalities from the initial processing stages. In contrast, decision-level fusion suffers from information bottlenecks, leading to significantly lower accuracy. The proposed EFT achieves superior performance, with an overall accuracy of 98.33% and a rice-specific IoU of 83.47%, significantly outperforming both single-modality baselines and alternative fusion strategies. The model also exhibits strong robustness under complex environmental conditions, maintaining high accuracy even in cloud-affected regions and across diverse agricultural landscapes. The results demonstrate that early-stage fusion, implemented through a Transformer-based framework, is the most effective approach for synthesizing complementary information from heterogeneous data sources.
The ablation study further highlights the critical role of adaptive fusion mechanisms in improving model performance. The channel attention mechanism in EFT is shown to be essential for dynamically adjusting the contribution of each modality, leading to improved feature extraction and classification accuracy. Removing this mechanism results in a 4.82% drop in IoU_rice, underscoring its importance in leveraging the complementary nature of optical and SAR data. The study also compares EFT against widely used CNN-based (UNet, DeepLabV3+) and Transformer-based (SegFormer) architectures under an identical early fusion setting. The results indicate that Transformer-based architectures outperform CNN-based models in capturing long-range dependencies and modeling spatio-temporal relationships. However, the effectiveness of channel attention varies across architectures, benefiting CNN-based models more significantly than Transformer-based ones.
Our study establishes a Transformer-based multi-modal fusion framework, providing a systematic evaluation of fusion strategies for rice identification. The results demonstrate that early-level fusion outperforms feature-level and decision-level fusion, with the EFT model exhibiting high stability in cloud-affected regions. This makes it a reliable solution for agricultural monitoring, particularly in areas where cloud cover limits the availability of optical data. These findings deepen our understanding of multi-modal feature integration and offer valuable insights for optimizing data fusion strategies in large-scale agricultural monitoring. Future research should focus on extending this approach to other crop types and diverse agricultural regions, further enhancing its generalizability and practical applicability.


