1. Introduction
The oldest policy of the European Union (EU) is the Common Agricultural Policy (CAP), launched in 1962 by the six founding countries of the EU. Since 1962, the CAP has adapted to new challenges by introducing new reforms. Among their objectives was the sustainable development of rural areas through the sustainable management of natural resources and actions to combat climate change. Agriculture is intricately linked to water, as it ensures the health of agricultural ecosystems. Unfortunately, climate change brings new challenges to water use in agriculture, with recent drought and/or flood events being observed. In order to introduce new water resource management techniques or adapt agricultural crops to new challenges, it is first necessary to have a very good knowledge of the phenomenon and quantify it. In this paper, we will identify certain aspects related to drought.
The agricultural, environmental, and social systems of a region are greatly impacted by drought, one of the most intricate hydroclimatic threats. Therefore, it is essential to comprehend the temporal and spatial dynamics of drought in order to create more effective mitigation plans and manage resources efficiently. Precipitation, temperature, soil moisture, and vegetation growth are the principal elements used in the identification of drought events. Droughts can be classified into various types [
1]. Agricultural drought (AD) happens due to a soil moisture shortage, which affects crop production [
2]; meteorological drought (MD) is induced by a decrease in precipitation and soil moisture [
3]; hydrological drought refers to a reduction in the water surface level and aquifers [
4]; and socioeconomic drought is related to a limited water supply to satisfy the needs of some economic goods [
4]. This study focuses on agrometeorological droughts, which include aspects of both agricultural and meteorological drought, considering the evaluation of how drought occurrences brought on by elevated temperatures and a lack of precipitation affect agriculture in conjunction with climate change.
This simple classification of drought stated above does not help to determine the necessary elements such as the beginning of the phenomenon, duration, frequency, and intensity. For this reason, various drought indicators were created, the best known of which is the Standardized Precipitation Index (SPI) [
5] because the World Meteorological Organization (WMO) recommends it for evaluating drought [
6]. Although widely used, the SPI does not take into account other climatic parameters such as temperature or vegetation conditions. Due to this inconvenience, a new index, the Standardized Precipitation Evapotranspiration Index (SPEI) [
7], has been proposed, which was similar to the SPI but includes temperature in the computation. The SPEI is a meteorological drought index that focuses on both the precipitation deficit and potential evapotranspiration, thus incorporating moisture stress into the atmosphere. The SPEI can portray the water availability relevant to agricultural systems, reflecting, indirectly, agricultural drought conditions as well [
8].
Remote sensing (RS) technology plays a critical role in drought monitoring and assessment [
9,
10]. Monitoring tools that incorporate satellite data, such as drought indices, have facilitated the assessment of crop development and soil moisture over wide regions, especially over those with few ground weather stations. Numerous studies have proposed several drought indices that provide quantitative information about drought in different regions and climates [
11]. Since it significantly affects the precision of drought monitoring, choosing the right drought indices for each region is essential [
12]. The WMO proposed 10 drought indices based on the RS technique but at the same time recommends that they should be used in conjunction with each other to obtain better results [
13]. As different indices may react differently to various drought situations, using several indices highlights the value of a mixed approach in seizing the intricacy of drought dynamics.
Given the strong relationship between precipitation and soil moisture, the Normalized Difference Vegetation Index (NDVI) represents one of the indices widely used to assess drought and vegetation health [
14]. The land surface temperature (LST) is a proper measure of water stress, being sensitive to moisture. The Vegetation Condition Index (VCI) can efficiently assess the greenery of vegetation, but it might not be as responsive to droughts that impact the ecosystem without having a major impact on vegetation cover [
15]. The Vegetation Health Index (VHI) [
16], a combination of temperature (Temperature Condition Index—TCI) and vegetation moisture (VCI) data, illustrates the vegetation’s thermal state and moisture availability and therefore can be a more accurate drought monitoring tool, particularly in geographically nonhomogeneous areas and agriculture-dependent regions like Dobrogea [
17]. Reduced plant growth and, consequently, decreased VHI values are caused by any vegetation stress factor, such as a lack of nutrients, disease, high temperatures, and low precipitation. The VHI shows, in general, a high correlation with the SPEI [
18,
19], making them suitable to examine the connection between meteorological drought and vegetation responses to water deficit.
Romania is situated in Southeastern Europe and has a temperate continental climate, being impacted by extreme weather incidents such as heat waves, long-lasting drought periods, and floods [
20,
21,
22], with an increase in drought frequency being noticeable after 1981 [
23]. With arid, semi-arid, and subhumid–dry climatic conditions, approximately 30% of the region is considered desertified [
24], which is a cause for concern, considering that one of the traditional occupations is agriculture, which represents around 5% of the gross domestic product. The southern, southeastern, and eastern regions are the most affected [
23], with a multiannual precipitation rate of 600 mm or less, and the temperature has increased over the years (by up to 1.7 °C after 1997 [
23,
25]). Drought in Romania is the subject of research in several studies [
20,
21,
22,
26,
27,
28,
29,
30,
31,
32,
33]. Meteorological drought was examined in [
28] over the period 1965–2015, with different timescales of the SPI. Then, Angearu et al. [
32] assessed drought with the composite Drought Severity Index (DSI) in the Baragan Plain. Further on, the study in [
33] explored the way in which drought occurrences in Romania and the Republic of Moldova, from 1998 to 2014, correlated with vegetative stress, using the SPEI and the NDVI and conducting a broad investigation of the severe drought from 2000 to 2001 [
28].
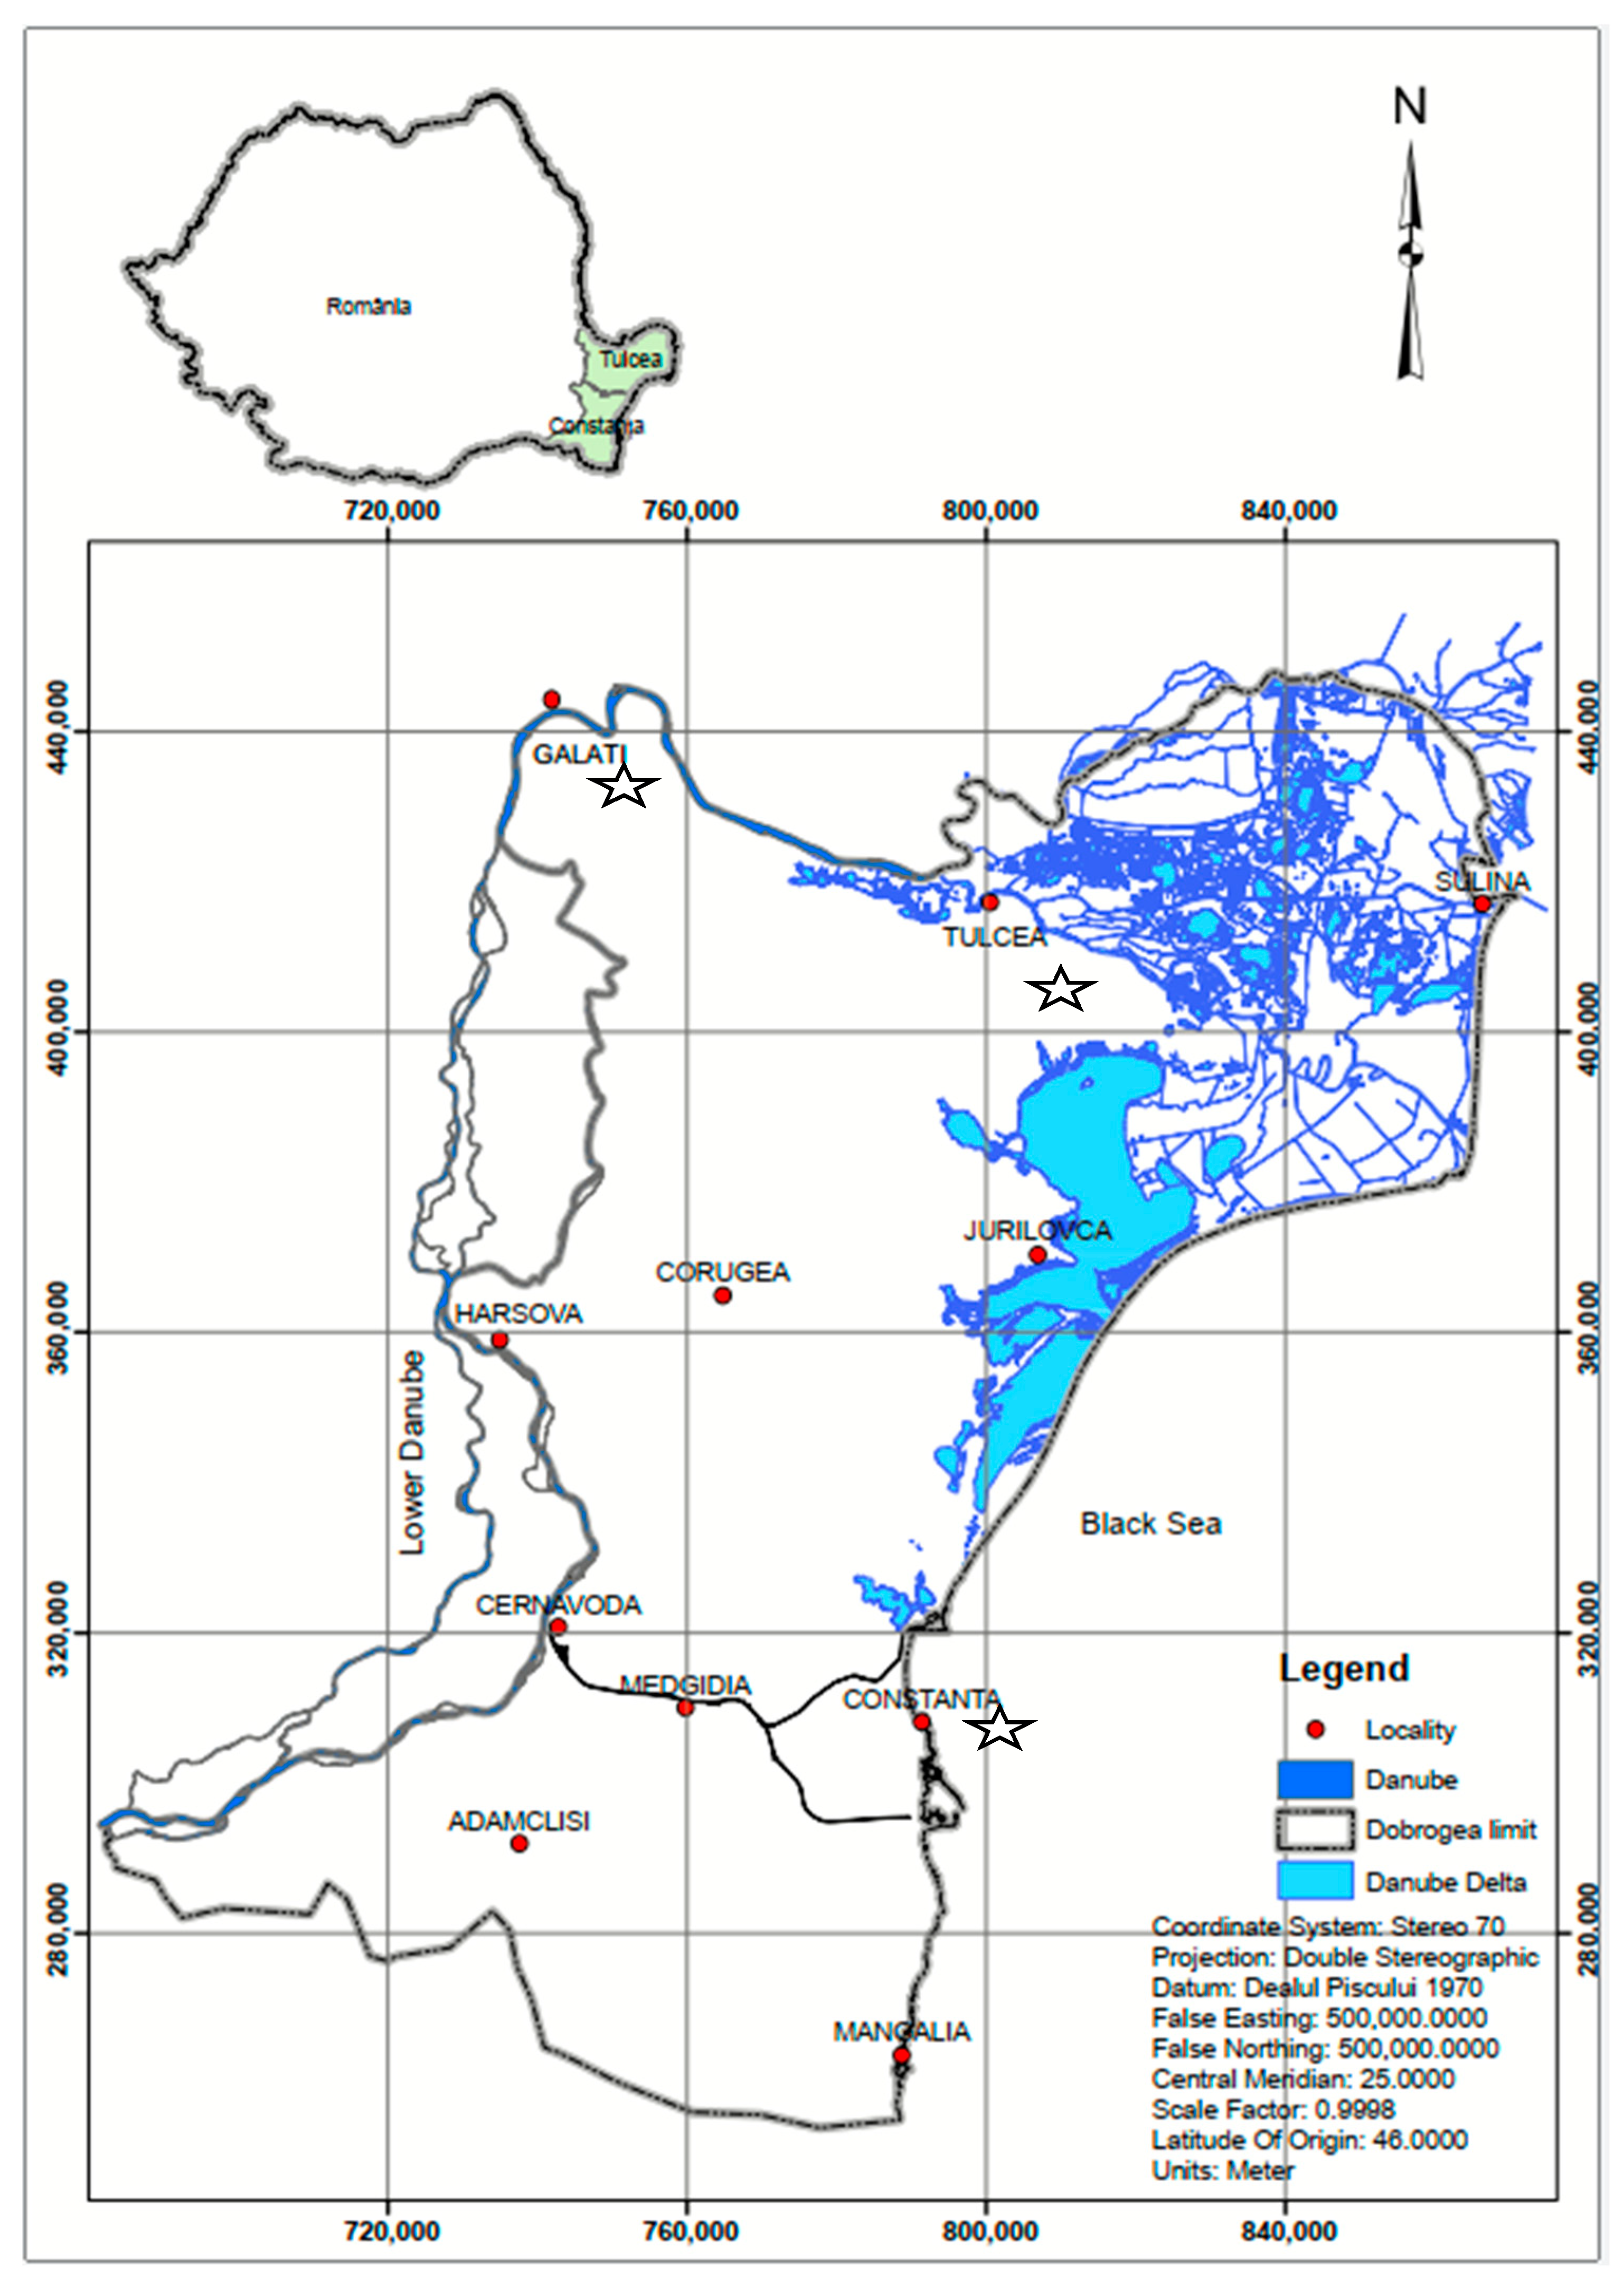
One of the most affected parts of Romania is Dobrogea, an agriculture-dependent region considering that agricultural areas cover about 70% of the region [
34], with an extremely high level of drought risk [
20,
21,
22,
23,
35]. Here, droughts are more severe and last longer, and throughout the past few decades, aridity and desertification have been accelerated [
36,
37,
38,
39]. These changes have intensified the need for effective research on drought and its negative effects on agricultural production. Using the de Martonne aridity index, Drought Hazard Index (DHI), and Drought Risk Index (DRI), computed based on the SPI, the authors of [
26] evaluated drought at several sites in Dobrogea, from 1965 to 2018, and found humid conditions in 2005 and arid ones in 2007 and 2011–2013. An analysis of Dobrogea shoreline variations in climate and vegetation cover during the last 22 years was conducted in [
40] with the NDVI, and the results showed a growing trend of inter-annual variations in the NDVI, temperature, and precipitation on the Black Sea coasts. Dobrogea was also part of the study in [
41] which analyzed the period 1901–2021 using the SPEI, and the results indicated an increase in the occurrence of moderate, severe, and extreme droughts. The severity and degree of drought in Dobrogea over the 2000–2015 period was explored in [
34] with the NDDI (Normalized Difference Drought Index) and fAPAR (Fraction of Absorbed Photosynthetically Active Radiation), and the authors concluded that various types of droughts affected the region during this period, with agricultural areas having the worst repercussions. The studies [
42,
43,
44] had similar findings, showing that drought led to a decline in agricultural production, especially in cereal yield.
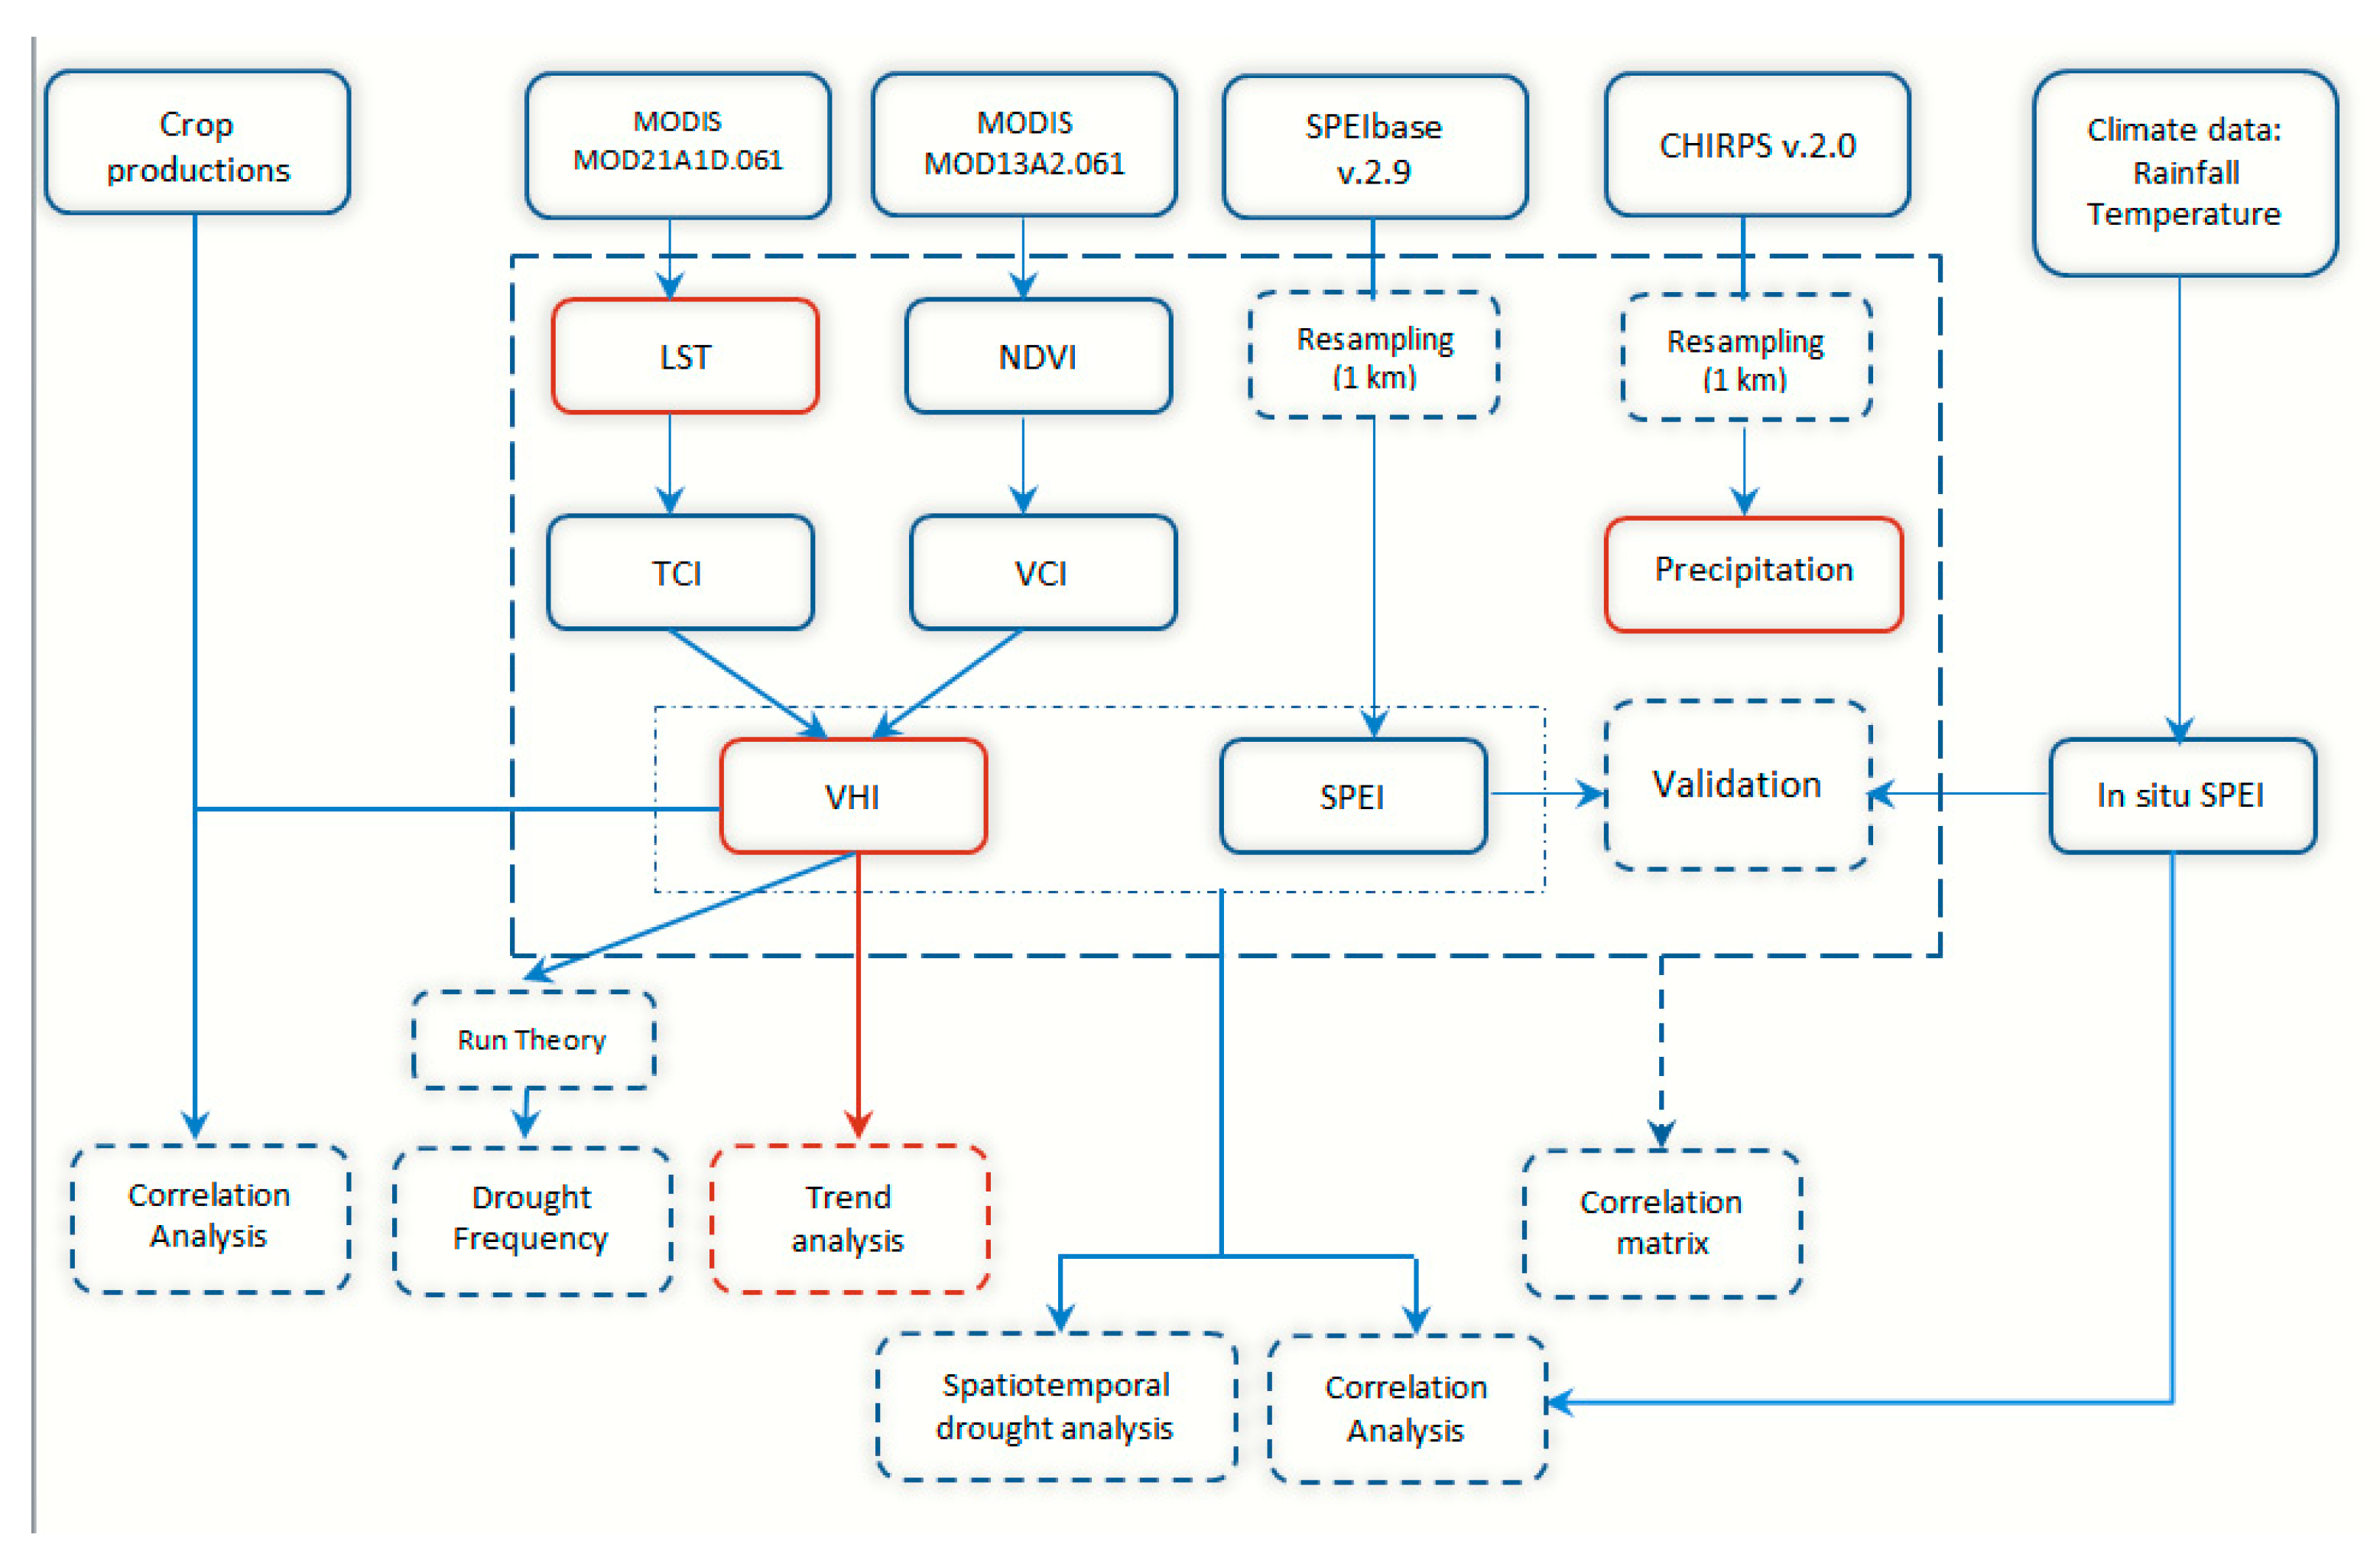
In this context, this research’s main goal is to elevate the understanding of Dobrogea drought dynamics by exploring the complex relationship between meteorological conditions and vegetation reactions to water stress through the examination of various drought indices, which are the NDVI, LST, SPEI, VCI, and TCI VHI indexes. Research suggests that on a monthly scale, vegetation shows a more robust response to hydrothermal conditions, whilst a 3-month timescale reveals seasonal trends between drought and the vegetation response [
45]. In our study, spatial and temporal drought analysis was carried out on 1-month and seasonal (3-month) timescales, and the latter focused on the three months (July–September) which outline the dry season of Dobrogea area [
22] due to low precipitation and hot temperatures. The primary goals of this research were as follows: (1) to use the selected drought indices on seasonal and monthly timescales to map and analyze spatial and temporal drought patterns from 2001 to 2021, (2) to examine the frequency of drought and its distribution, (3) to assess the correlation between the drought indices, (4) to follow the constant interaction between agricultural and meteorological drought indices, (5) to evaluate the performance of the VHI with annual yield data for different crops, and (6) to identify the trends characteristics of precipitation, the LST, and the VHI. It should be mentioned that the VHI indicator has never been used in Dobrogea; therefore, we consider that this research makes a significant contribution to the advancement of knowledge and/or to addressing important questions regarding its ability to estimate the influence of drought on crop production in this area, given that the region is used mainly for agriculture.
3. Results and Discussion
3.1. Calculation of Optimal Contribution Value
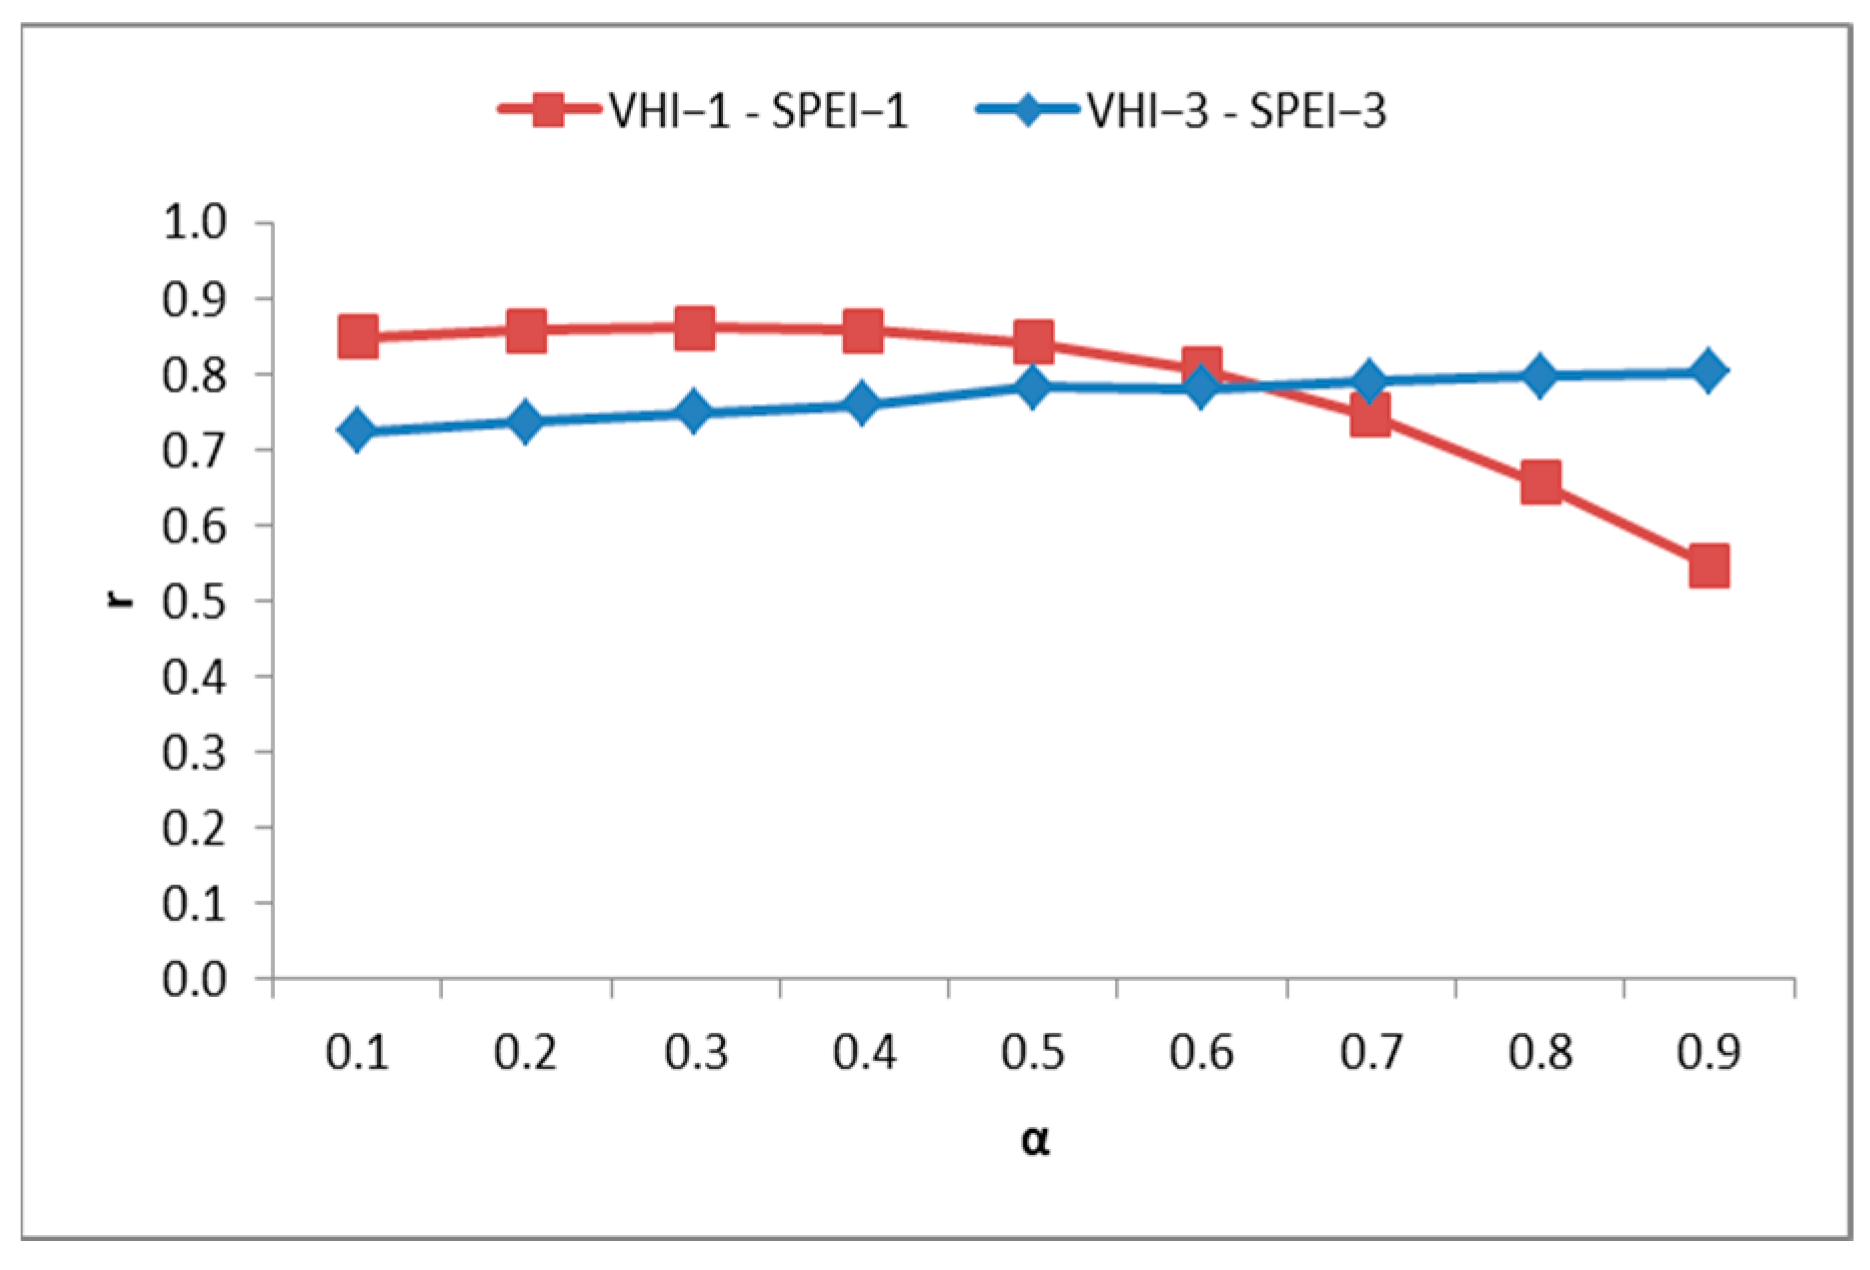
Since the SPEI index can detect different types of droughts, including agricultural ones, we selected the yearly mean of SPEI-1 and seasonal SPEI-3 to evaluate the optimal weighting values of the TCI and VCI within the VHI.
Figure 3 shows that when the TCI weight is small (
> 0.5), the correlation between VHI-1 and SPEI-1 decreases, while that between VHI-3 and SPEI-3 increases slightly. As the TCI weight increases (
< 0.5), the correlation between VHI-1 and SPEI-1 ranges from 0.85 to 0.86, and that between VHI-3 and SPEI-3 continues to grow. These findings suggest that the unbalanced contribution of the VCI and TCI may have a negative impact on the VHI’s ability to monitor drought. Based on the above results and the ones in [
54,
55], we decided to assign equal weights to the VCI and TCI in calculating the VHI (
= 0.5).
3.2. Comparison of Agricultural Drought Indices
The Pearson correlation coefficient indicates an optimal positive correlation between the NDVI-3 and VCI-3 (
r = 0.995), showing that both indices estimate vegetation health similarly. The time series of the mean NDVI-3 and VCI-3 from 2001 to 2021 are presented in
Figure 4a and reveal that both indices decreased during this period (
p-value < 0.0001). The mean NDVI-3 ranged between 0.44 and 0.60, while the mean VCI-3 varied between 24.0 and 84.80. According to these indices, the vegetation health was best in 2005 (as also indicated in [
23,
26]) and worse in 2020, compared to the other years. Apart from 2020, the estimations showed agricultural droughts in 2001, 2007–2009, 2012, 2015, 2016, and 2019, when the VCI-3 < 40% and the NDVI-3 < 0.47.
The Pearson correlation coefficient indicated a strong negative correlation between the LST-3 and TCI-3 (
r = −0.99), which reinforces the fact that when the temperature increases (drought conditions), the TCI decreases and vice versa. The timeseries of the mean LST-3 and TCI-3 from 2001 to 2021 are shown in
Figure 4b. The LST-3 showed an increasing trend, while the TCI-3 revealed a decreasing one (
p-value = 0.0001). In 2005 and 2020, the study area recorded the lowest and highest LST-3 (29.10 °C and 37.05 °C) and TCI-3 (8.10 and 96.63) values, respectively. High values (LST > 35 °C) were also observed in 2007, 2012, 2015, and 2019. In general, the entire area experienced high mean LST-3 values (>30 °C, with an average of 33.5 °C) during the dry season of the study period. Similar conditions were revealed by the mean TCI-3 time series.
3.3. Spatiotemporal Distribution of Drought
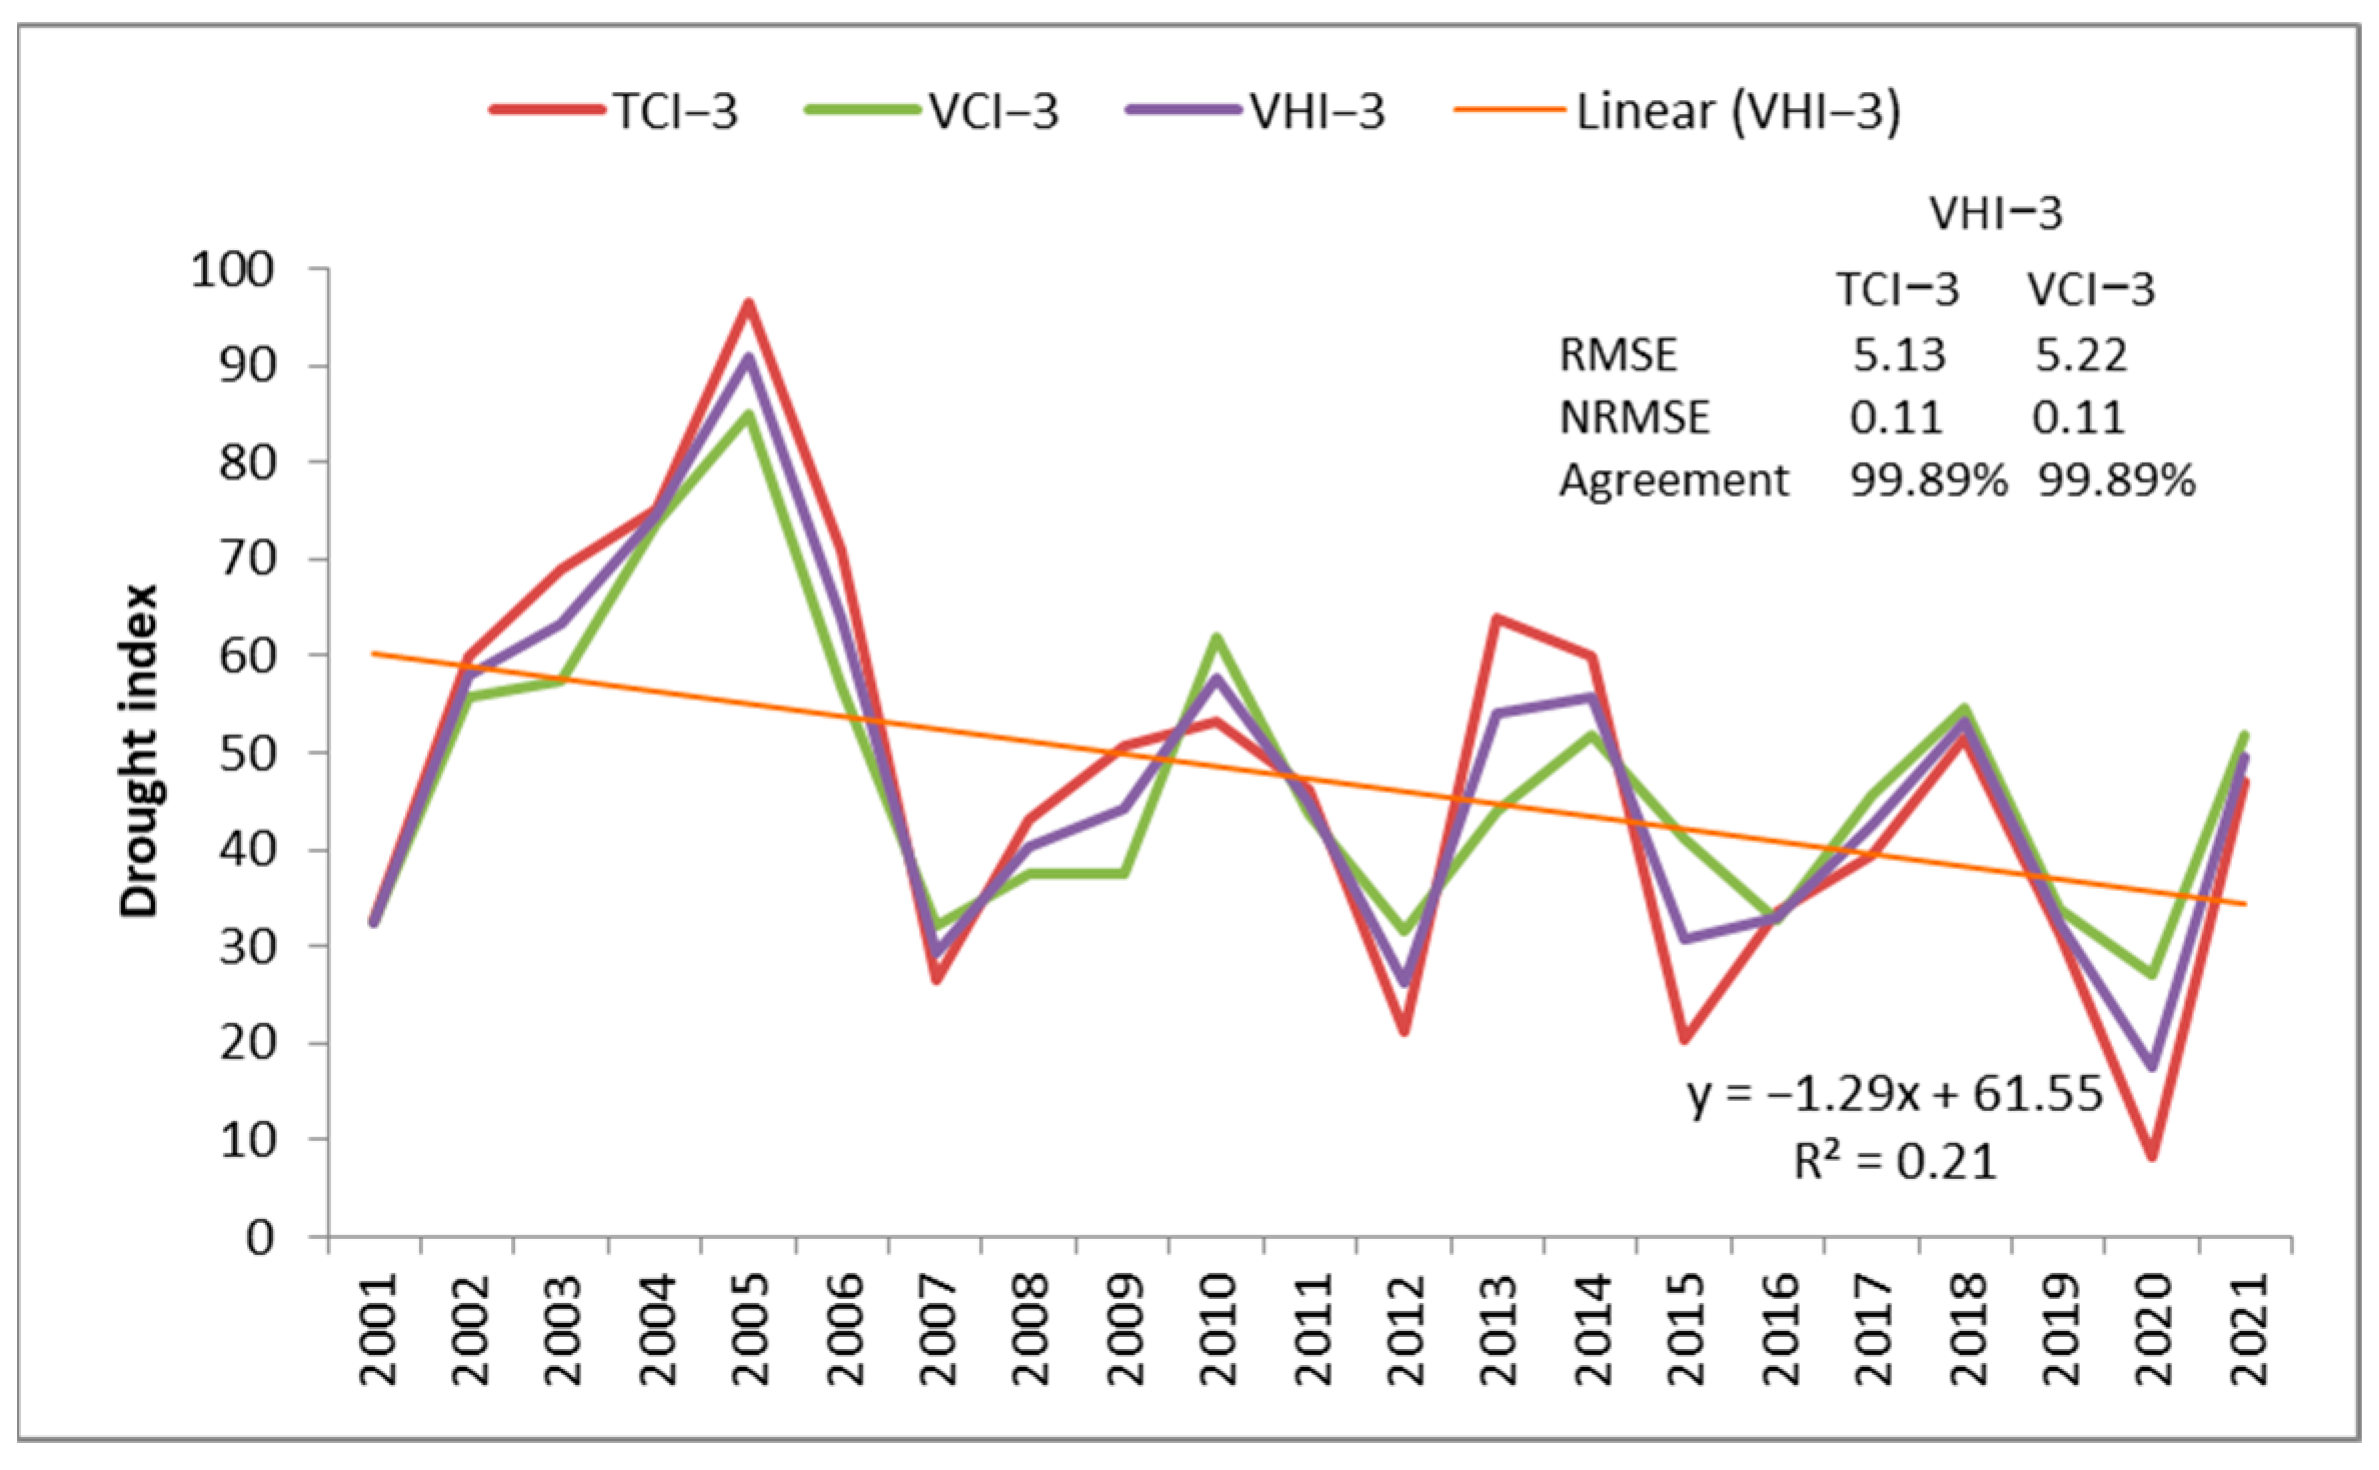
The time series of the VCI-3, TCI-3, and VHI-3 (
Figure 5) for the dry season had a significant downward trend (
p-value < 0.0001) and a high degree of agreement regarding the overall distribution of drought in the region from 2001 to 2021. This remark suggests that during the study period, large parts of the region were affected by a certain type of drought, with the years 2004–2006 being an exception, and so, the agricultural area experienced great stress because of hot temperatures and below-normal precipitation. These findings are similar to those of other studies on Dobrogea’s significant drought events. The authors of the study in [
41] showed that the duration of moderate-to-extreme droughts detected at the country level, including Dobrogea, increased during the period 1991–2021 [
39], this period being the driest since 1901. Normal wet conditions were present in most of the period 1997–2009 [
33,
34,
39], except for the years 2001 and 2007, when major drought events occurred [
23,
26,
28,
33]. From 2010 to 2021, there was a dry period [
28,
41], with droughts having the highest degree of severity according to [
41].
Table 4 and
Figure 6 and
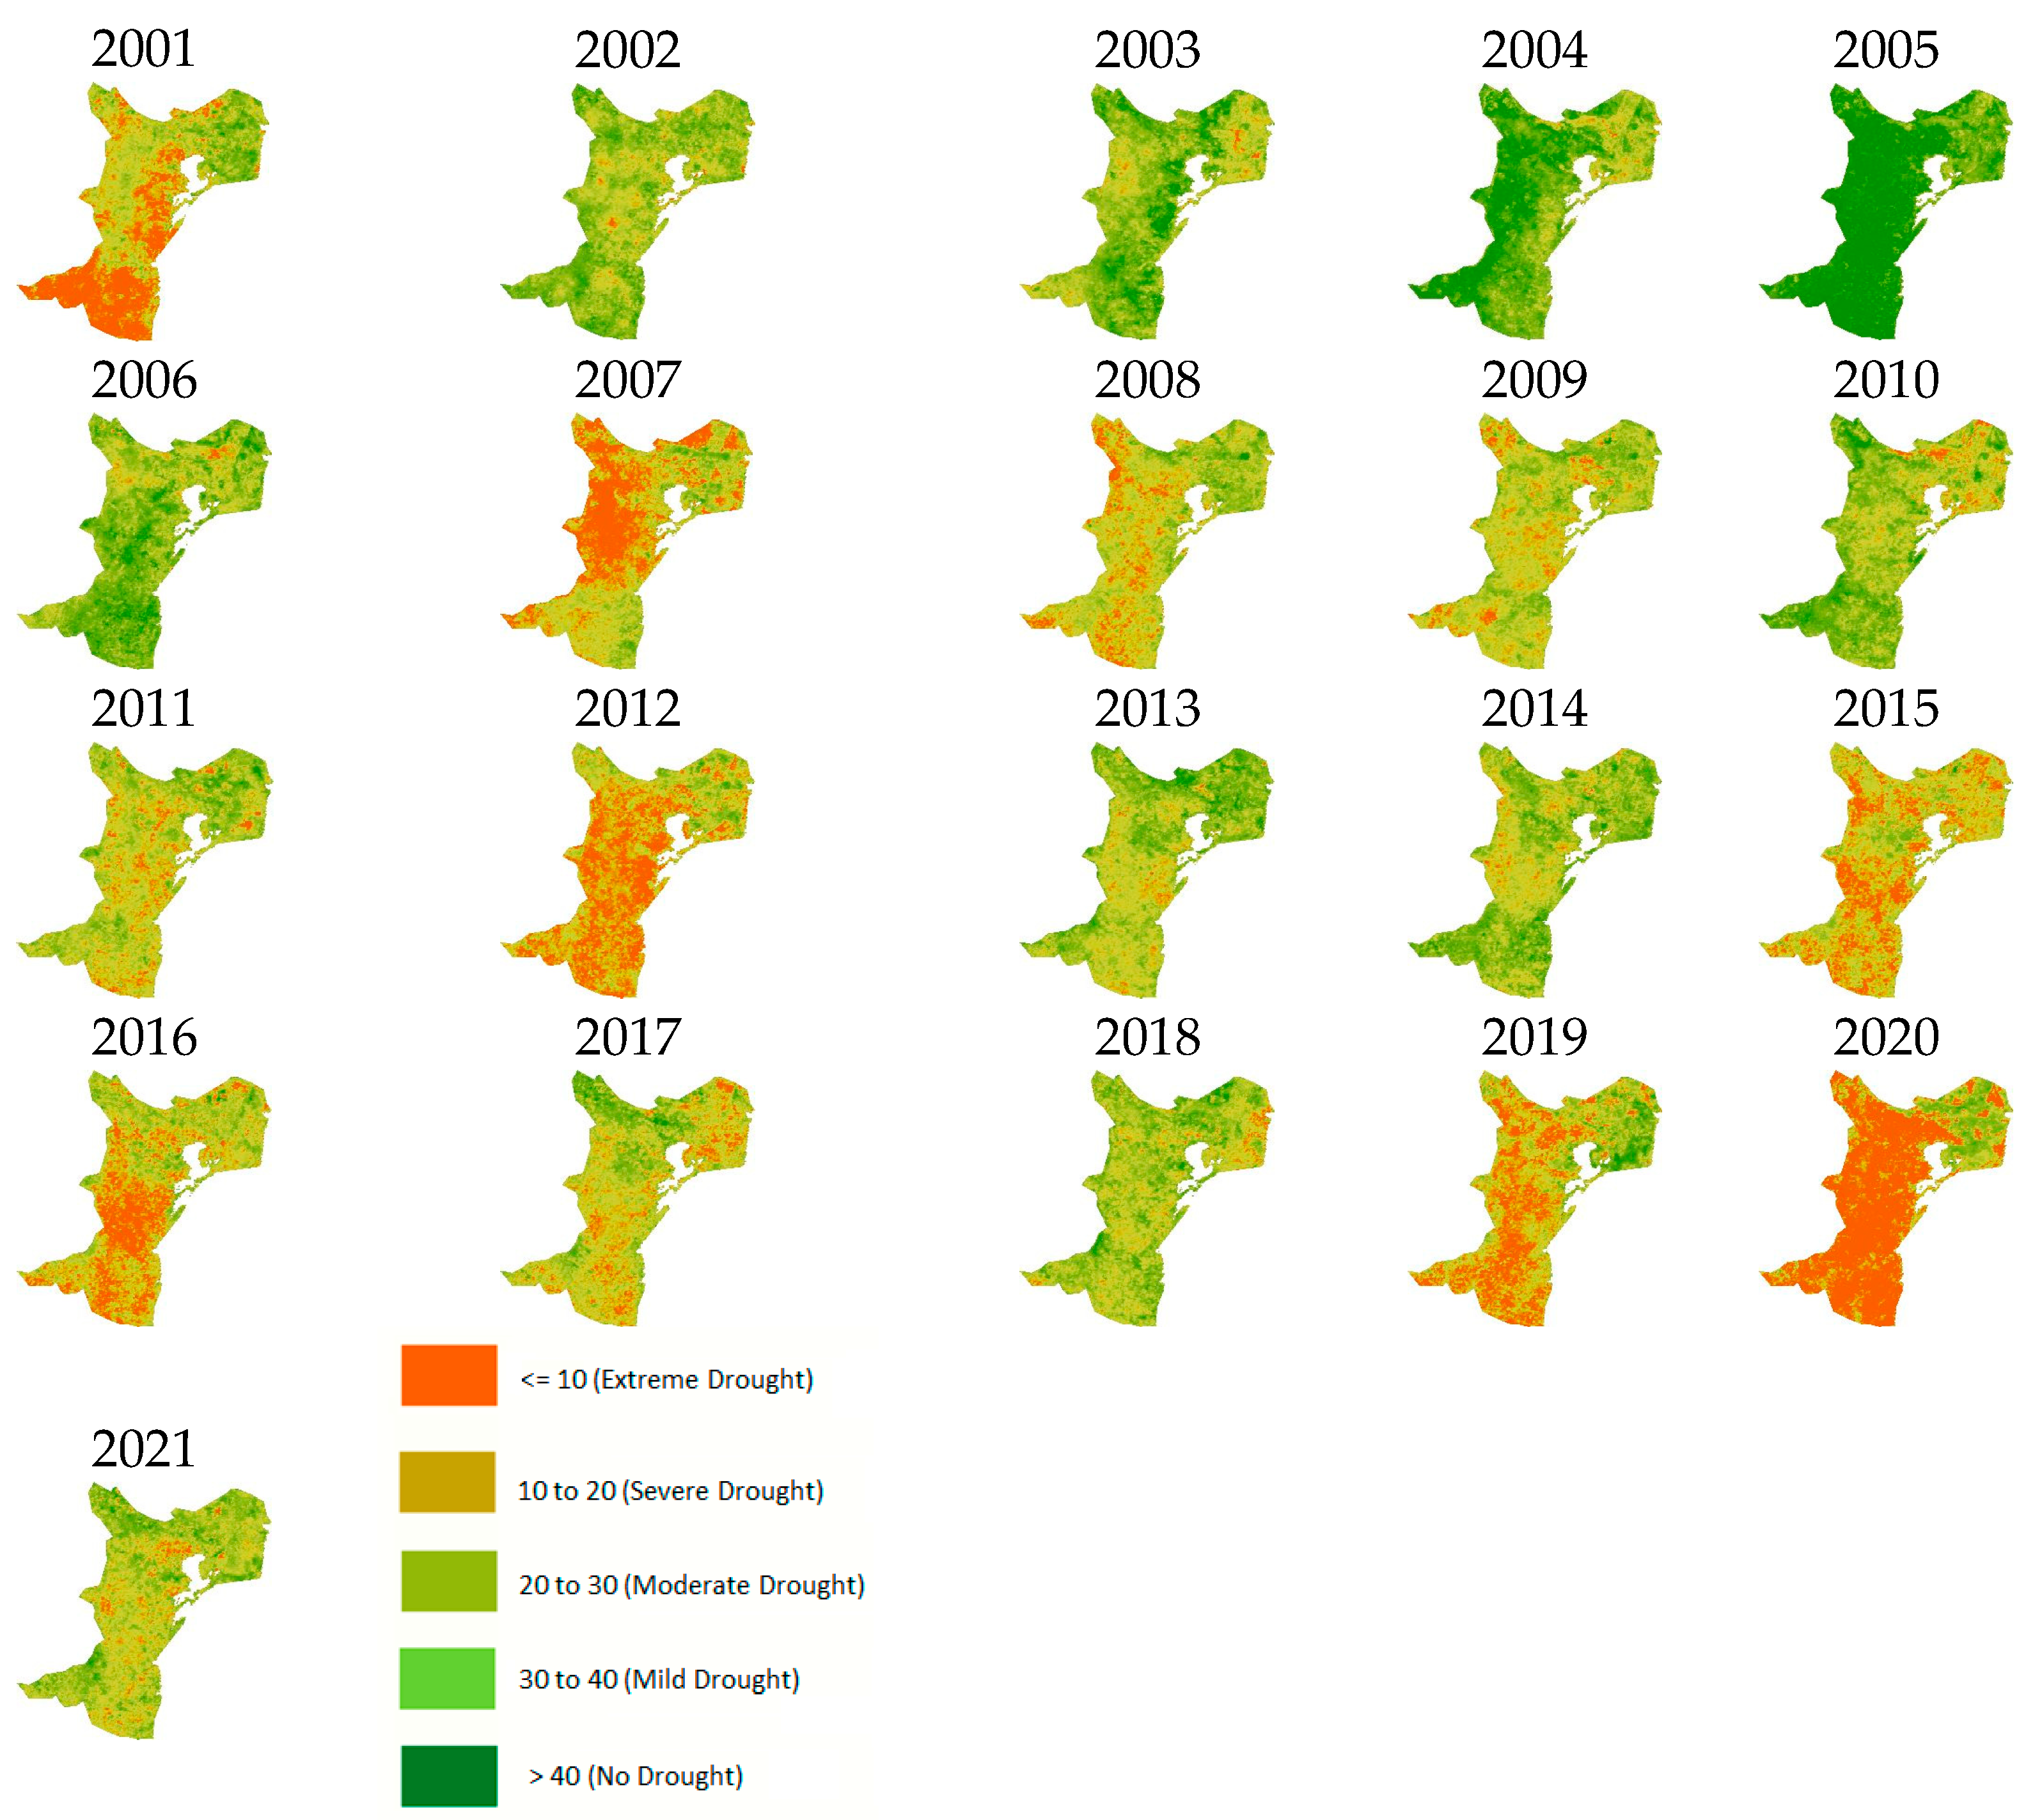
Figure 7 show the spatial distribution of drought for the dry season throughout Dobrogea from 2001 to 2021, as estimated by the VHI-3. To evaluate the drought area coverage from satellite-derived maps, the frequency histogram function provided by the GEE platform was used for each VHI-3 image within the study period, with bins with a width of 0.1 that covered the range of VHI admissible values ([0, 1]). The results revealed that the severity and occurrence of drought vary across years.
The worst drought plagued most of the study region in 2020 (
Table 4 and
Figure 7), exhibiting the highest coverage of extreme drought (55%) and severe-to-extreme drought (71%), with just a few locations (around the Danube Delta) remaining unscathed. Extreme droughts occurred also in 2001, 2007, 2012, and 2019. Severe-to-extreme drought conditions were met in a large part of the study area: about 35% in 2001 and 2019, 37% in 2007, and 43% in 2012. Also, for 2015 and 2016, the VHI-3 showed a large distribution of extreme and severe drought conditions (about 27% of the area), primarily in the southern and central parts of the region. A significant upward trend in the drought area coverage is also revealed (
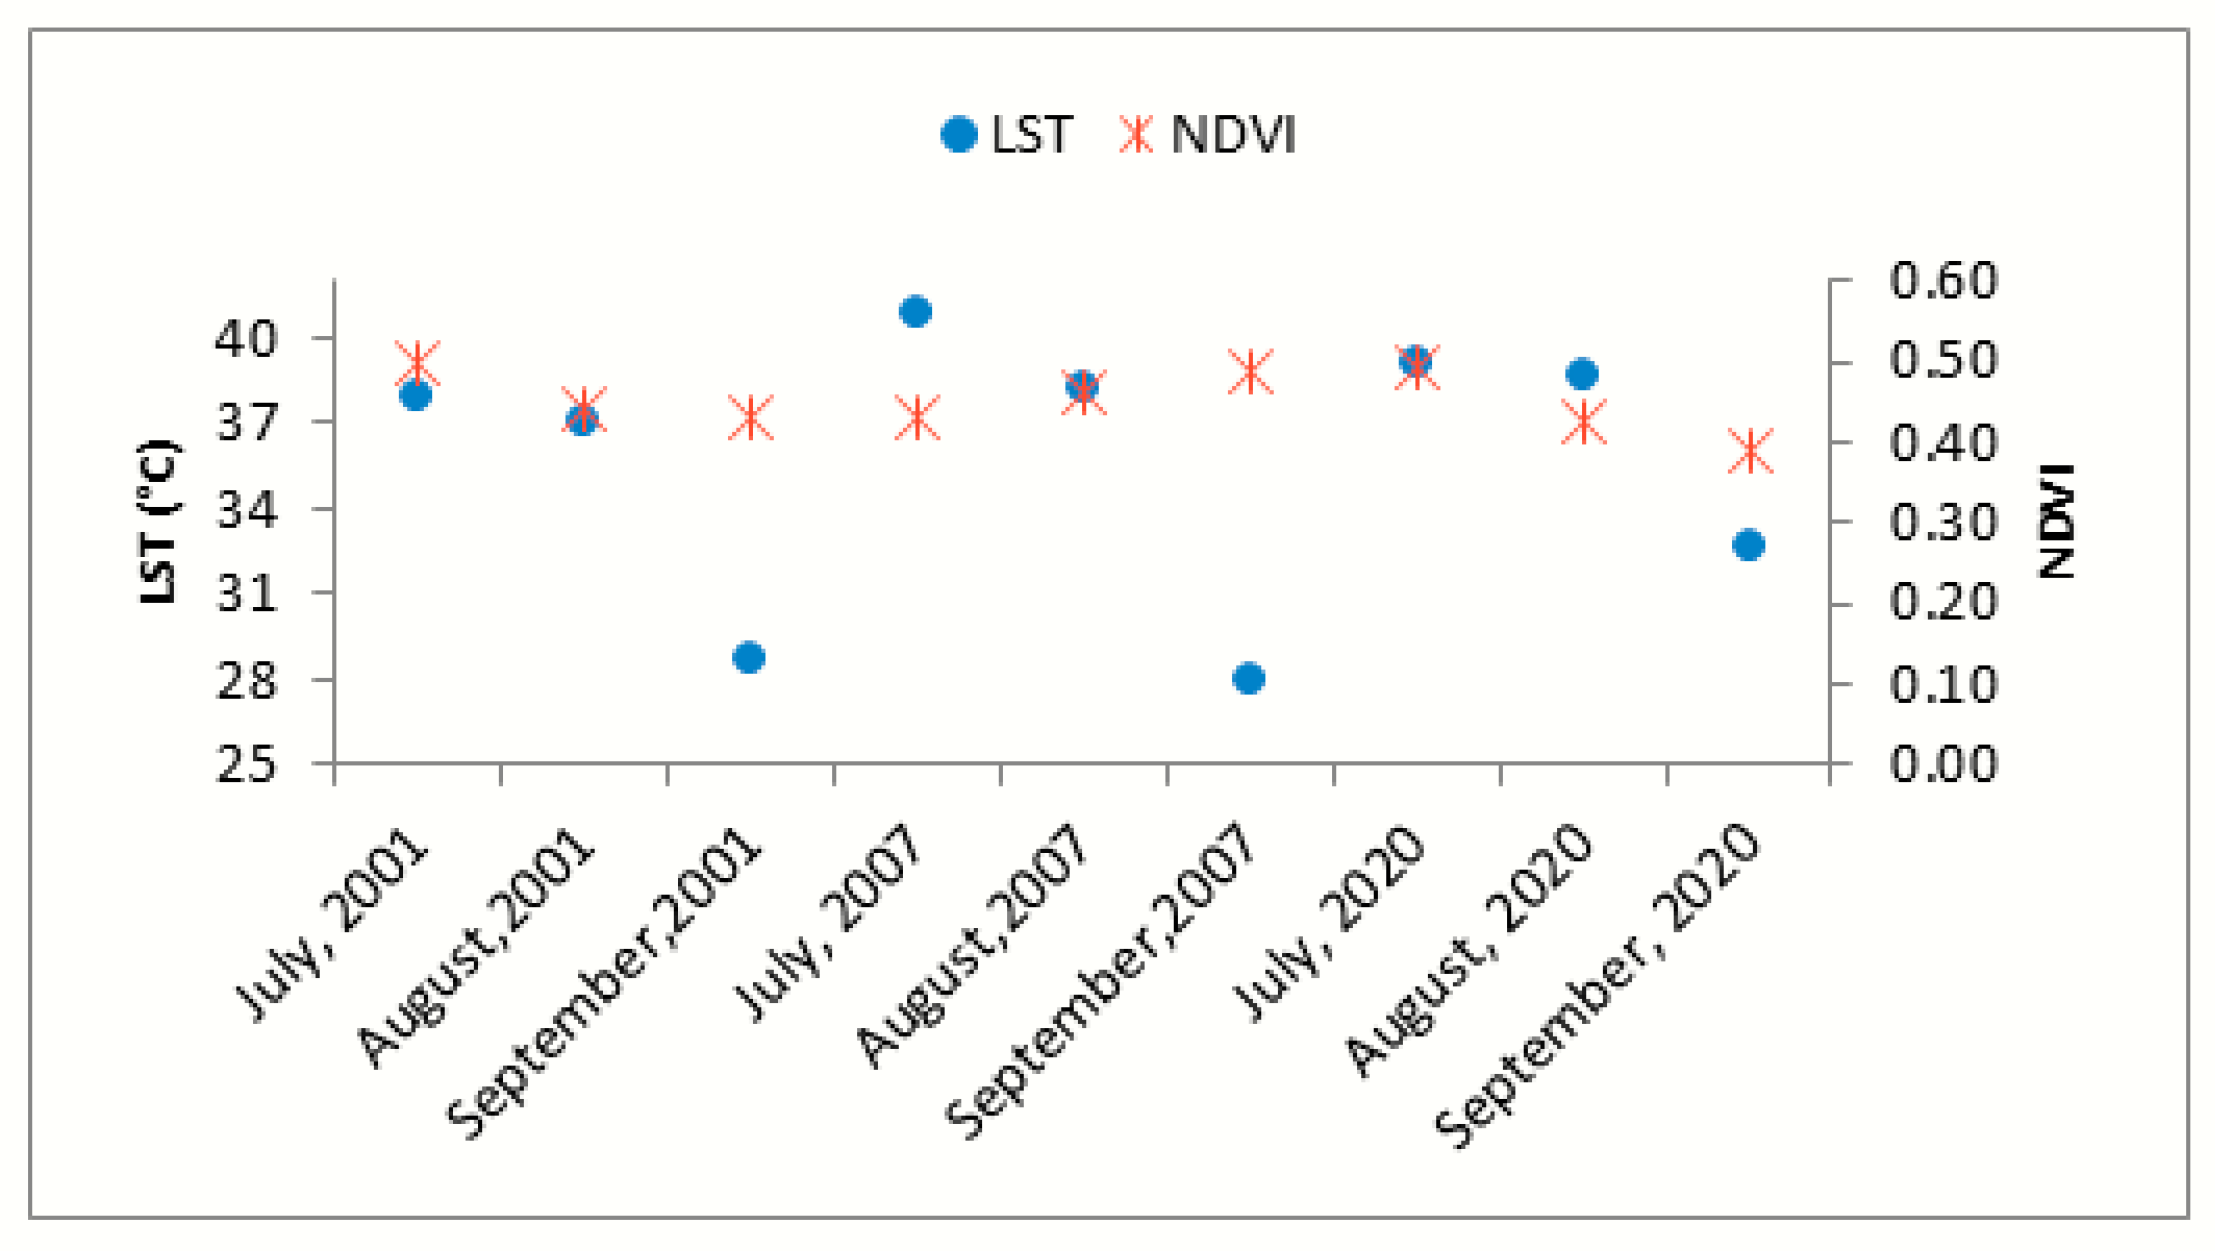
Figure 7). During these years, the region recorded high thermal (LST-1 up to 40.91 °C) and moisture (NDVI-1 < 0.50) stress, which exacerbated the extreme drought condition (
Figure 8). These observations are sustained by several studies. Similar periods of severe-to-extreme dry conditions were identified in [
28,
41,
64], at country level, while in [
26,
34], it is shown that extreme drought affected Dobrogea in 2007, 2012, and 2015. According to [
65], the summer of 2015 was among the warmest and driest ones of the last seven decades, caused by a massive lack of precipitation. That year, large areas in the center and east of Europe, including Dobrogea, experienced drought [
34]. The authors of [
44] reveal that one of the warmest years of all the measurements conducted in Romania since 1900 was 2019, a major drought event beginning that year and reaching its peak, with respect to intensity and spatial spread, in 2020. Consequently, Nuntasi–Tuzla Lake completely dried up in August 2020 (and partially in 2012) [
25,
66].
In 2008, 2011, and 2017, moderate-to-mild drought conditions were observed in most of the region, whilst certain locations were recorded with severe-to-extremely dry conditions (about 10% of the area). In 2009 and 2021, moderate-to-mild drought conditions were found in about a third of the area. Mild drought affected between 8 and 16% of the area in 2002, 2003, 2010, 2013, and 2014. Normal to extreme (in 2005) wet conditions were indicated in 2004, 2006, and 2018. Comparable results regarding the rainy years were found in [
23,
26,
34].
The findings of the spatiotemporal drought analysis during the dry season with the VHI-3 showed that Dobrogea was mostly affected by extreme and severe droughts in the central, southern, and northwestern parts. A similar observation was given in [
34]. When compared to other years, 2020 (78%) and 2012 (66%) had the highest area coverage of extreme, severe, and moderate droughts. These years were followed by 2019 and 2007 (55%), 2015 (51%), and 2016 and 2001 (49%). These results are consistent with Dobrogea’s major historical drought events [
28,
33,
34,
35].
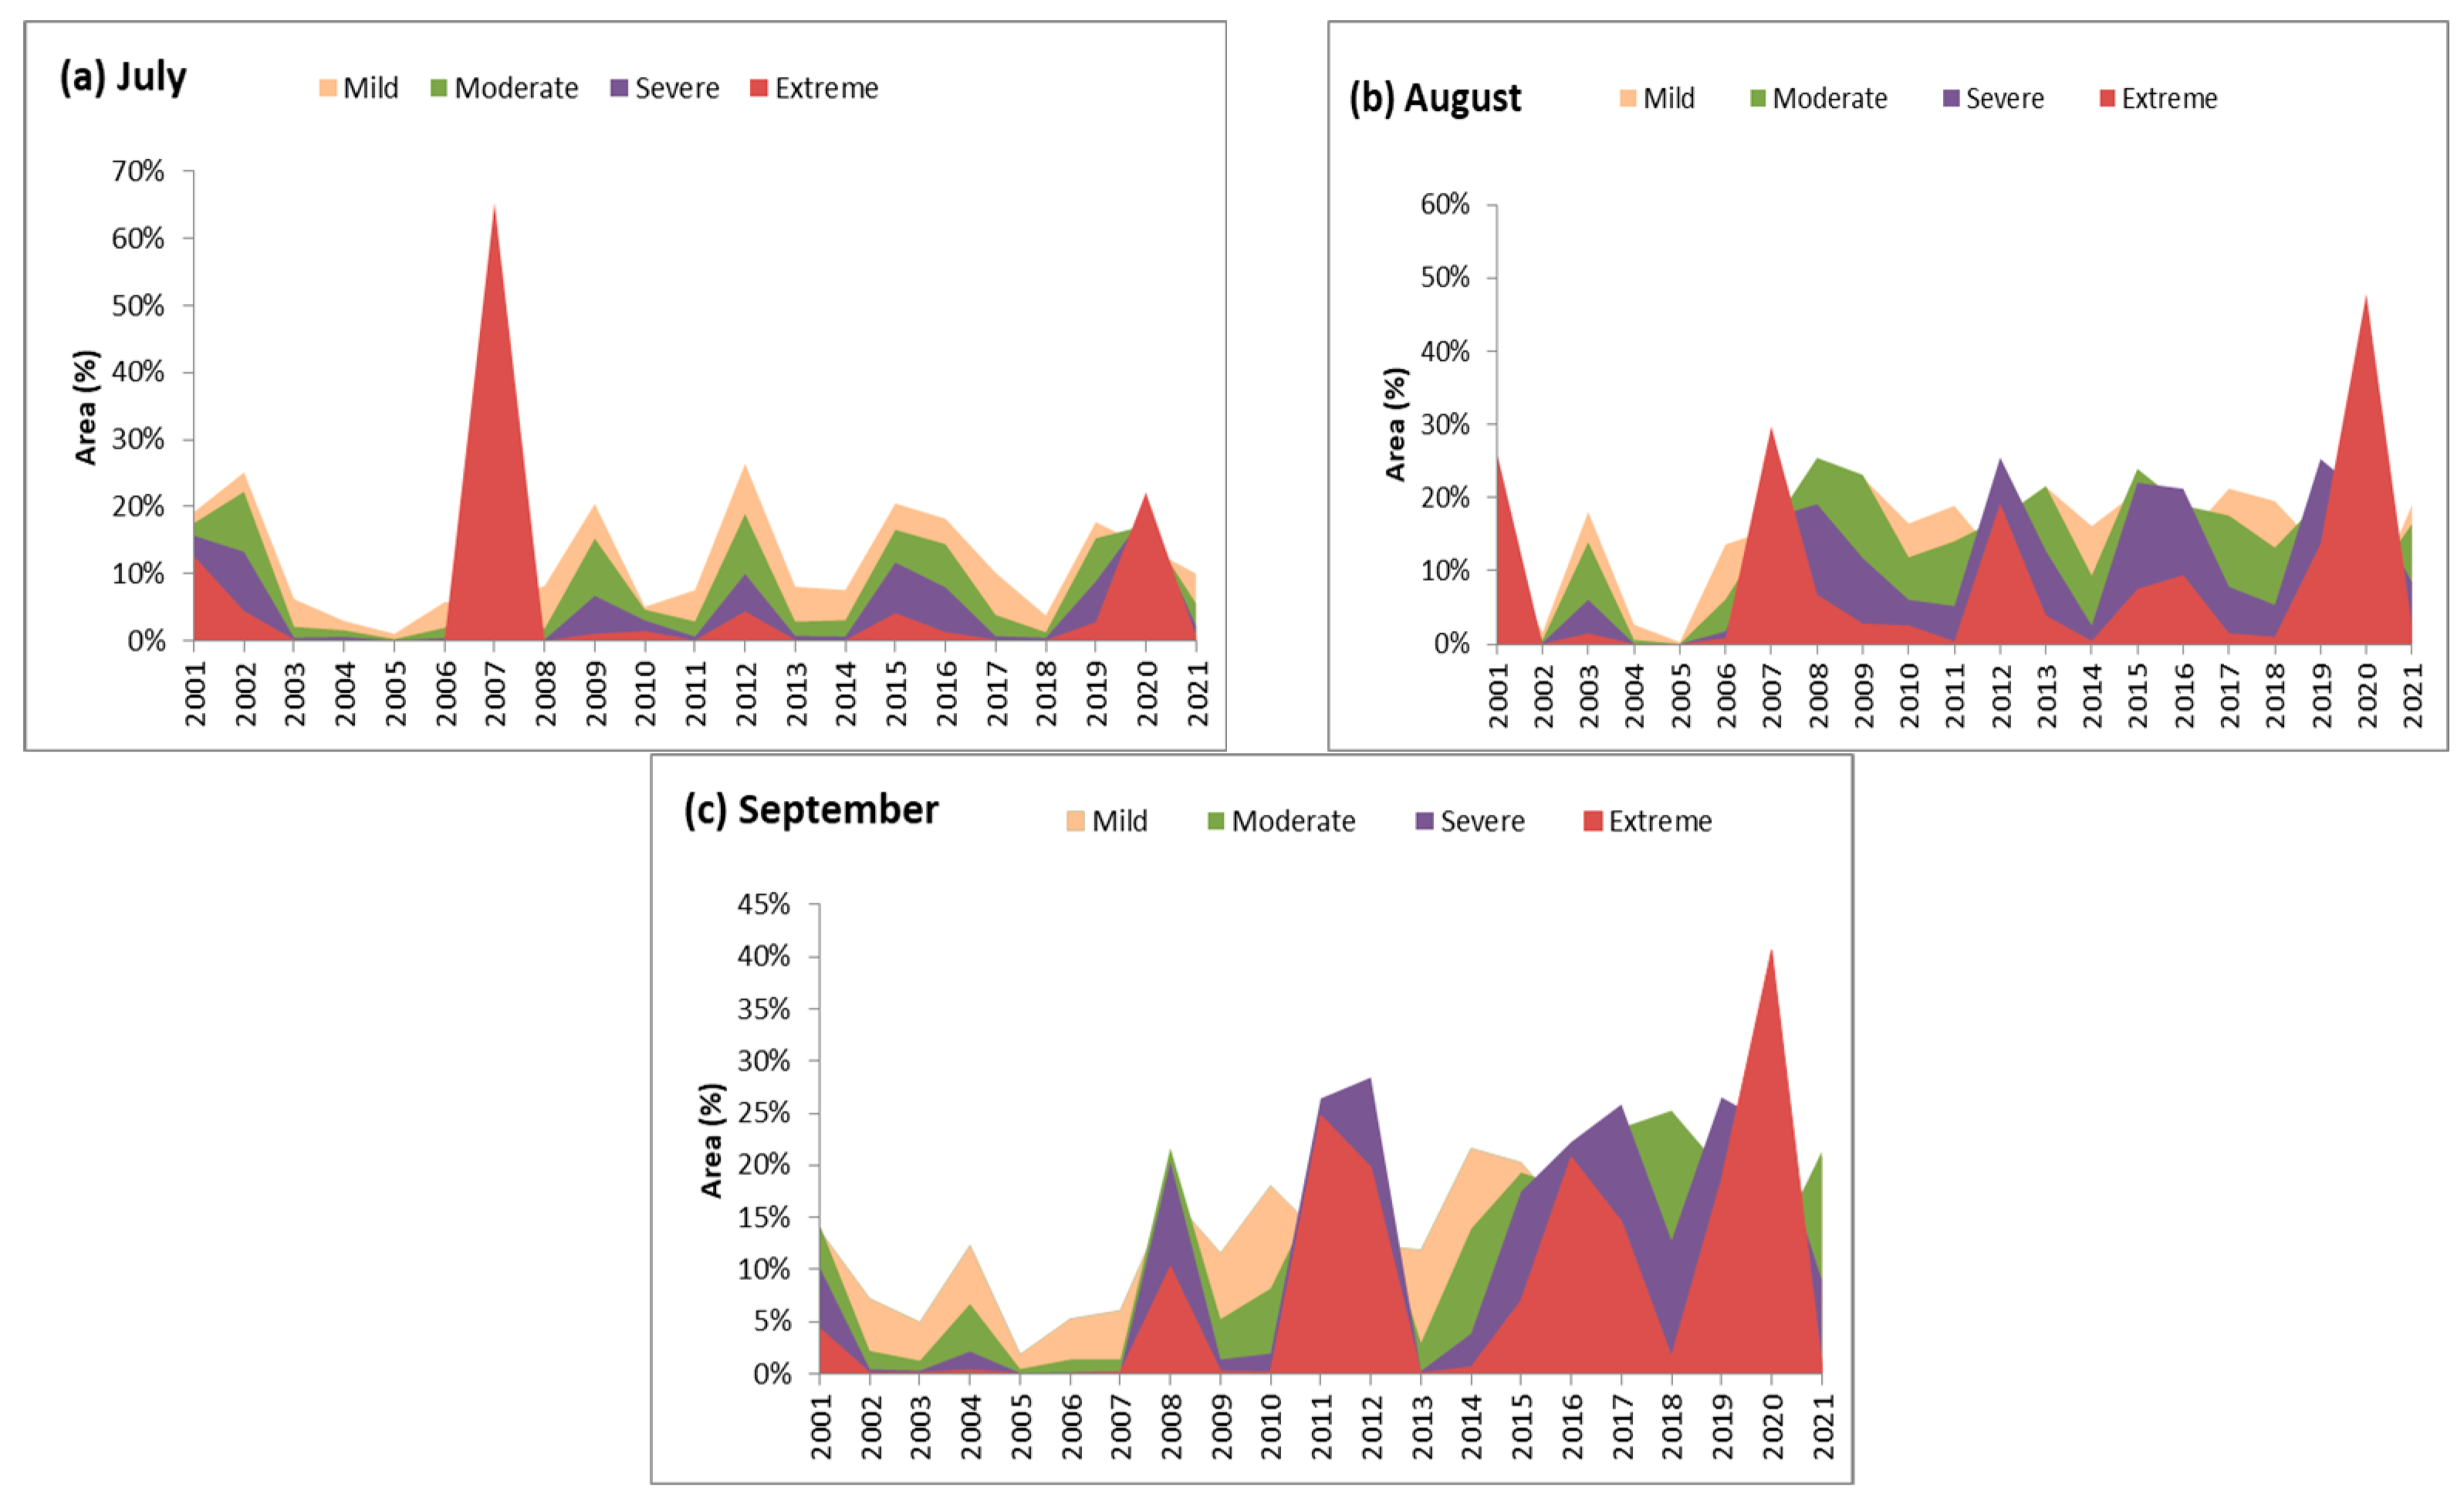
In each month of the dry season (July, August, and September) from 2001 to 2021, the VHI-3 detected drought, despite differences in the severity and spatial distribution extent (
Figure 9a–c). For instance, in July 2007 (
Figure 9a), the percentage of the extreme drought class was 65.33%, and the sum of extreme, severe, and moderate drought had the highest percentage (84.47%), which was also the highest for all the months in the study period (
Figure 9a–c). Similarly, in August 2020, the percentage of extreme drought was 47.81%, and the total area coverage of the extreme, severe, and moderate drought levels was 75.46%, which was the highest of all years for August. In September 2020, the percentage of extreme drought was 40.65%, and the total area coverage of the extreme, severe, and moderate drought classes was 75.91%, which was the highest of all years for September and higher than the one in August 2020. The months of August and September had the highest area coverage of extreme drought and showed an increasing trend from 2007 onwards. Additionally, in the month of September, there is an alarming increasing trend in the area affected by all types of droughts, in particular, the severe and extreme ones. The least affected months of the dry season in the entire period were in 2005.
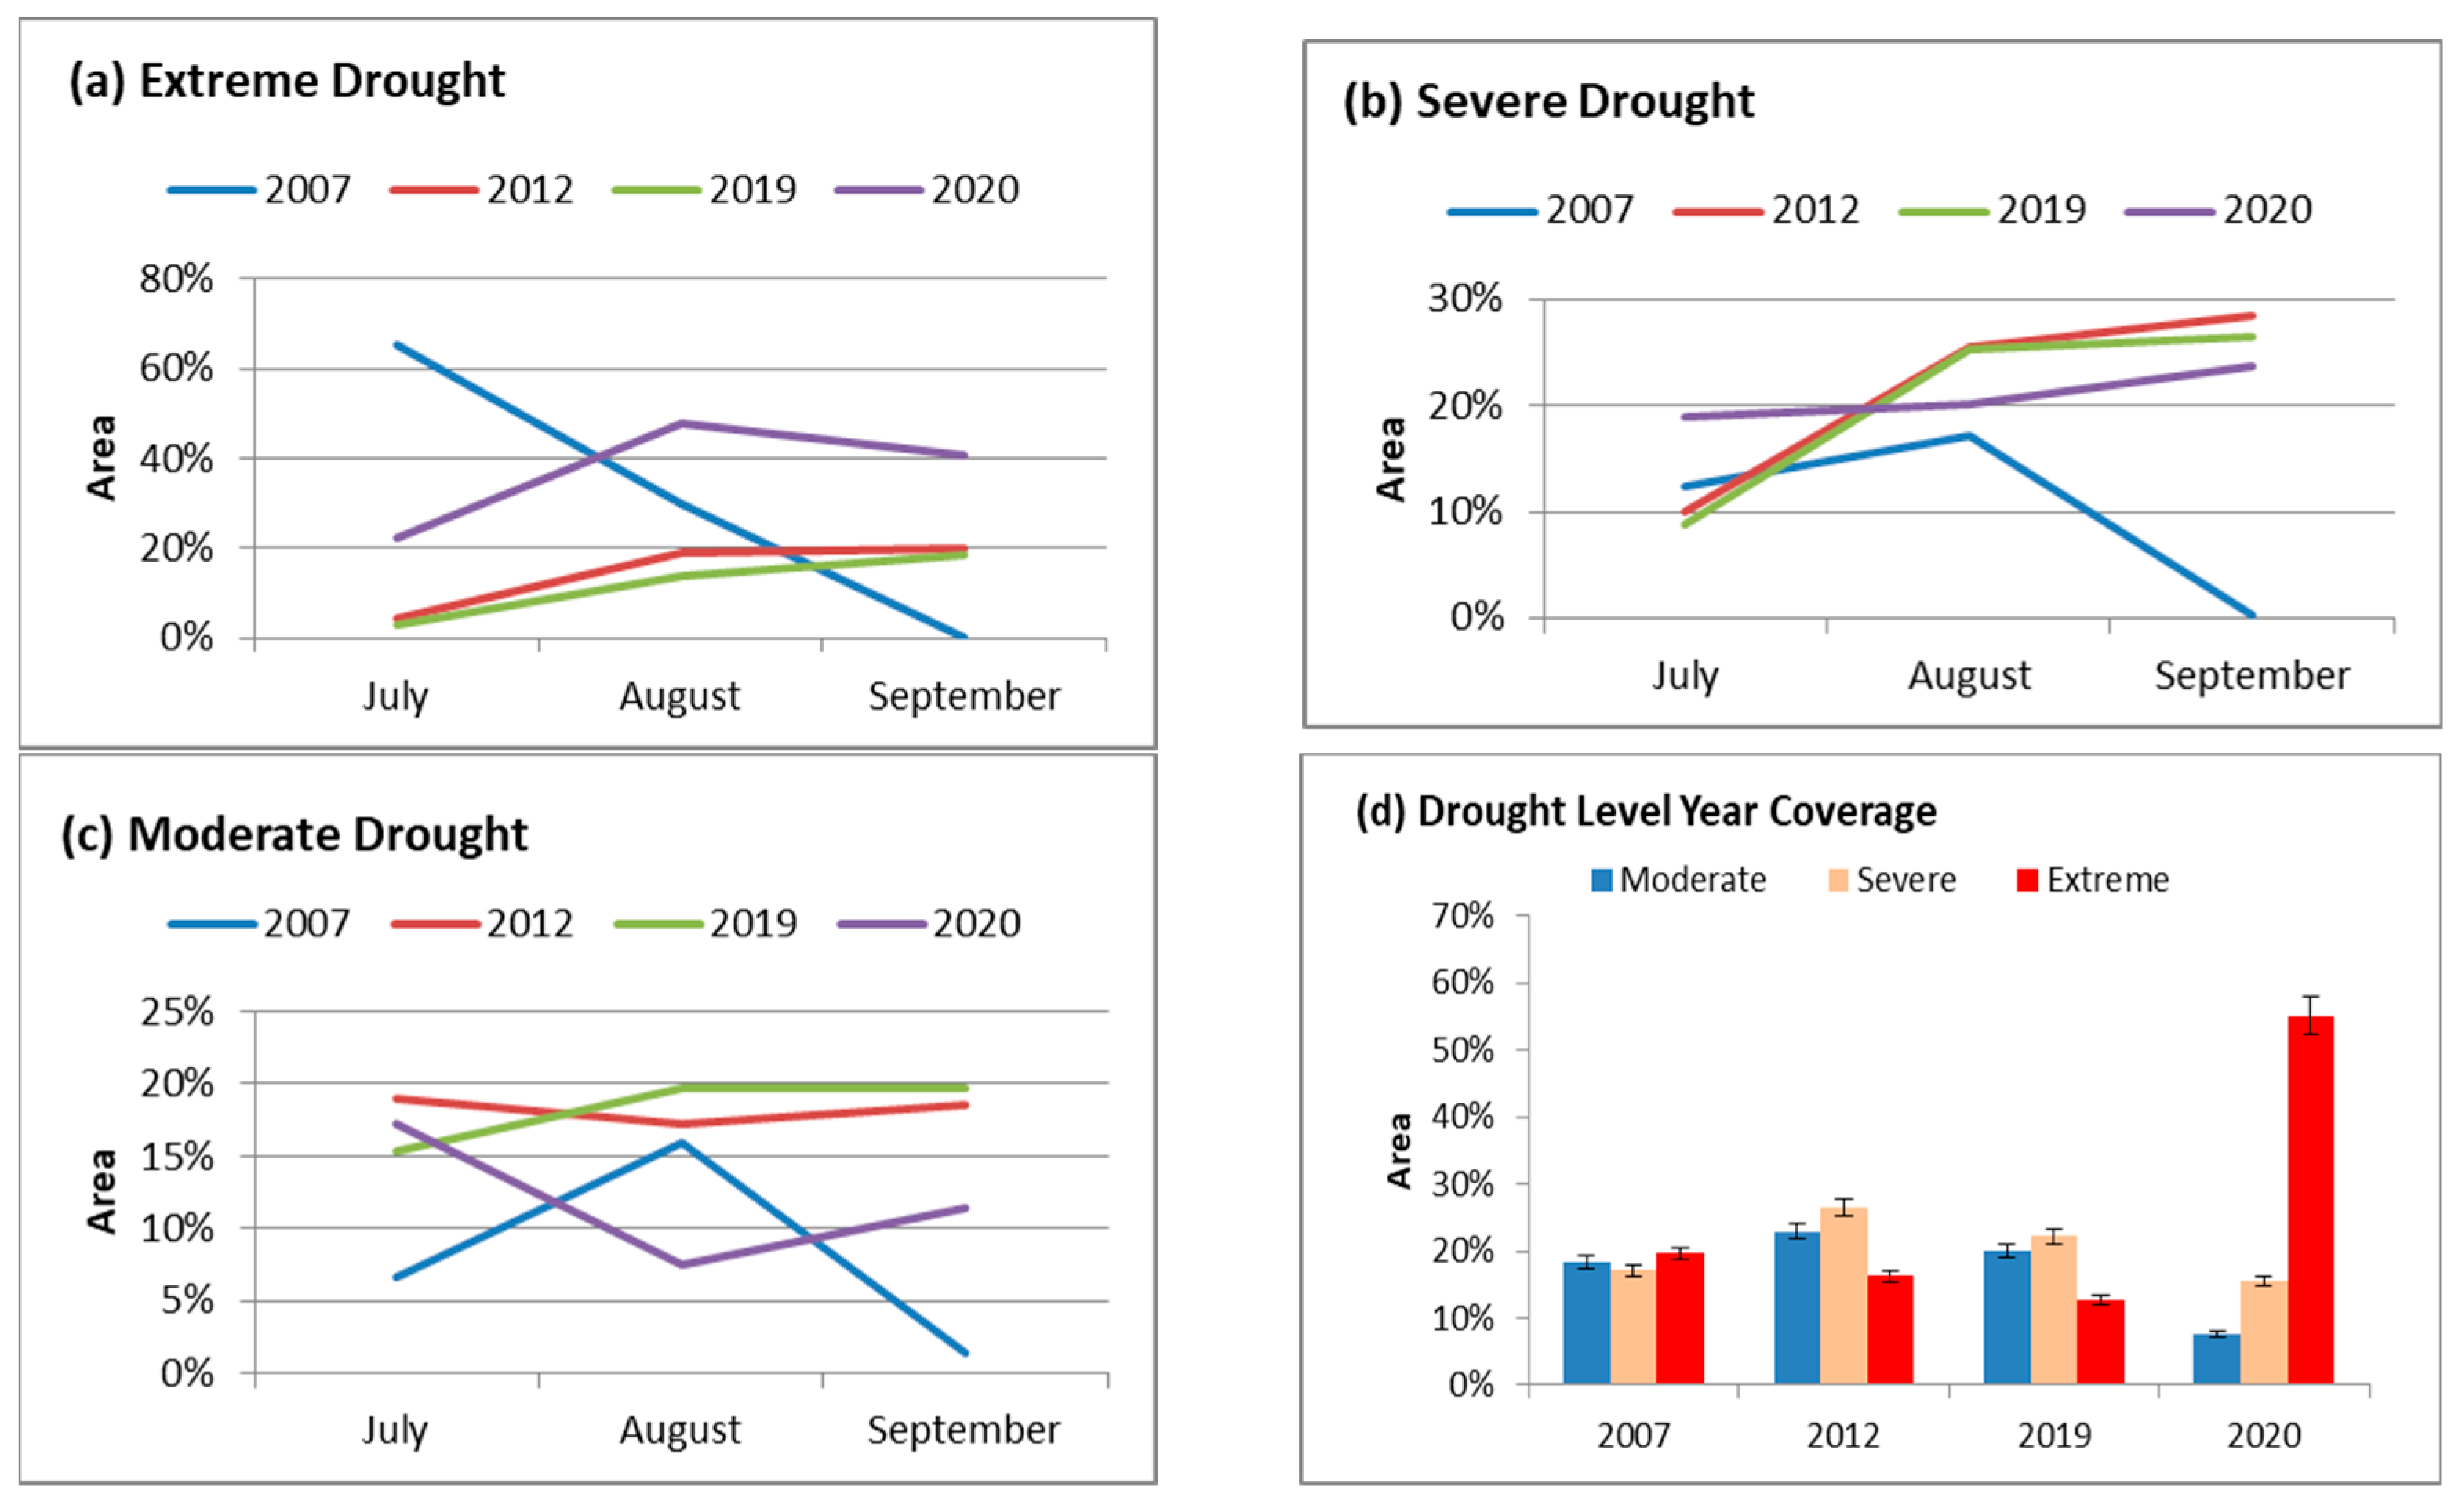
The extreme droughts showed increasing trends in 2012, 2019, and 2020 from July to September (
Figure 10a). A great part of the region (over 41%) suffered drought in August and September in 2020, with a slight decrease in September. In 2007, the extreme drought showed a decreasing trend from July to September. Apart from the year 2007, there was an increasing trend in severe droughts in all other years (
Figure 10b). The moderate drought showed a decreasing trend in 2012 and 2020 from July to August and an increasing one from August to September, in contrast to 2007 and 2019 (
Figure 10c).
In terms of area coverage, 2012 is the most severe- and moderate-drought-affected year, whereas the extreme drought was more widespread in 2020 (
Figure 10d). Therefore, 2012 and 2020 were considered the worst drought years during the study period, which had a high spatial coverage of extreme, severe, and moderate droughts.
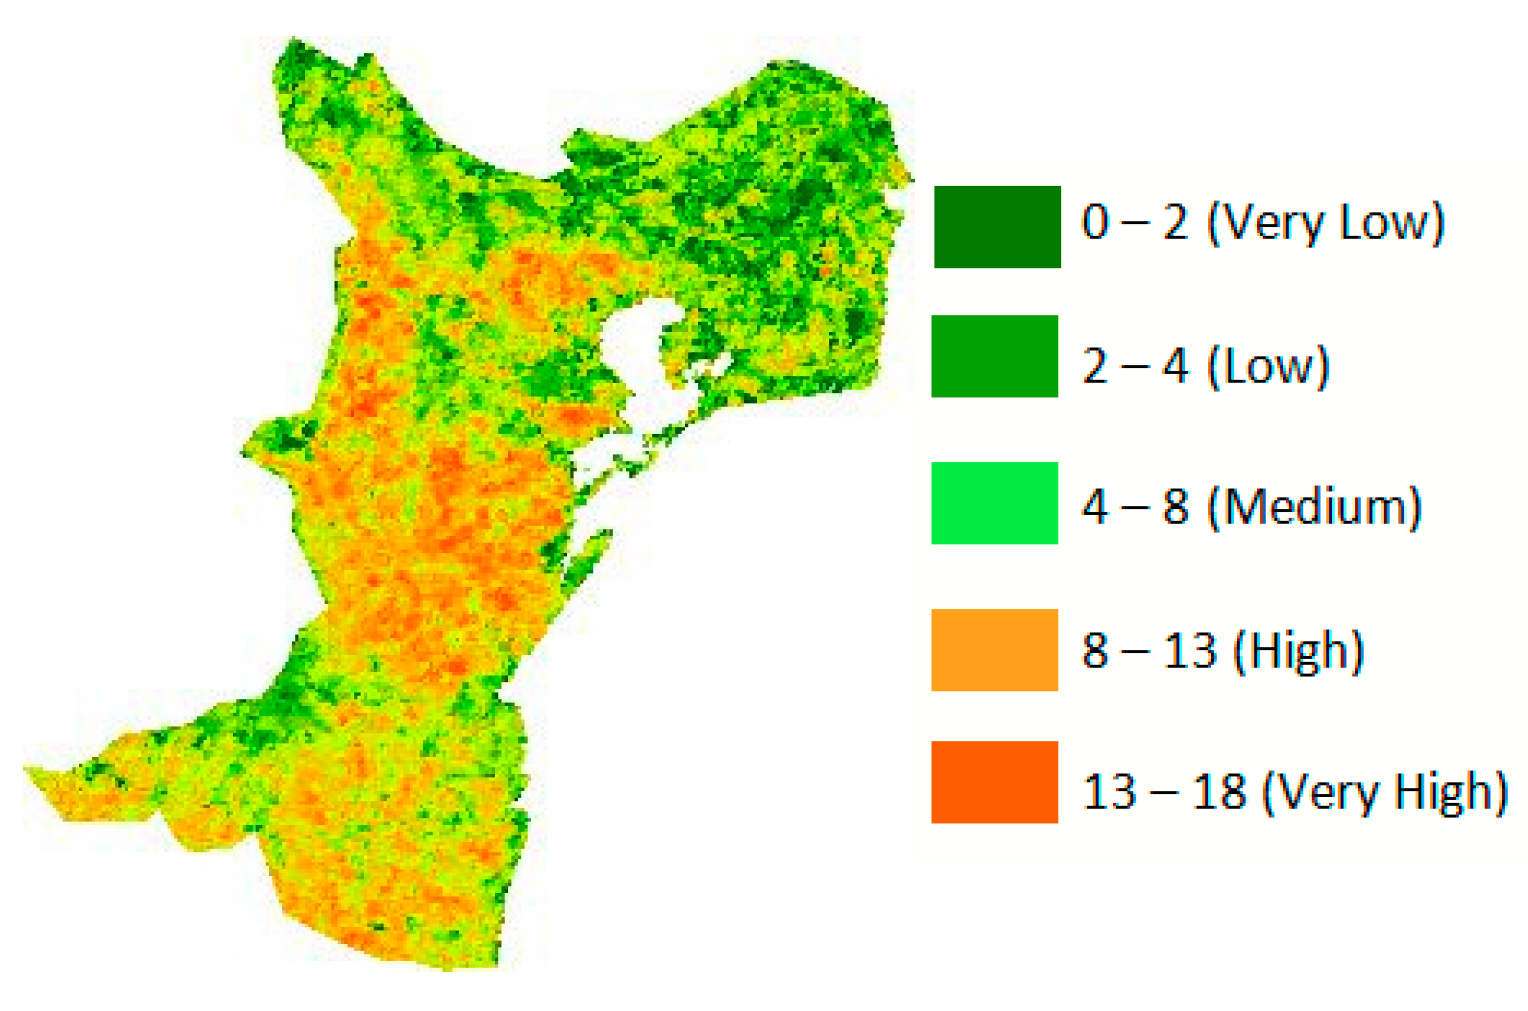
3.4. Spatial Drought Frequency Estimated by VHI
We created a drought frequency map using the VHI-3 estimates (
Figure 11). The results indicate that the region was affected by drought more than nine times from 2001 to 2021. The high-frequency class (8–13 times) and very-high-frequency class (13–18 times) covered 41.62% and 6.92% of the region, respectively. The latter frequency primarily affected the southern, central, and northwestern areas. We also noticed that the central area experienced drought with a very-high-frequency class (as indicated by [
34], also), which suggests that drought has affected this area every 1.5–2 years.
3.5. Relationships of Drought Indices with Other Environmental Variables
The Pearson correlation analysis was carried out using 200 random samples dispersed within drought-prone areas of Dobrogea that were pointed out by the drought frequency map, to study the relation between the drought indicators in the dry season of 2005, the year with extreme wet conditions, and 2012 and 2020, the worst drought years. The correlation matrices between the studied drought indices are presented in
Table 5.
With correlation coefficients of (0.85; 0.73) and (0.93; 0.93) in the dry years (2012, 2020) for TCI-3 and VCI-3, respectively, the VHI-3 showed strong positive correlations with both indices, suggesting that these indices provide information about drought conditions with a high degree of similarity. The VCI-3 and TCI-3 were also positively correlated (r > 0.43).
During 2012 and 2020, the negative correlations between the LST-3 and the NDVI-3 (r = (−0.62; −0.56)), the VHI-3 (r = (−0.58; −0.39)), the VCI-3 (r = (−0.57; −0.35)), and the TCI-3 (r = (−0.46; −0.31)) indicate that higher temperatures stress the vegetation by increasing the evaporation rate and decreasing soil moisture, which increases the severity of the drought, leading to sparse vegetation cover and lower values of vegetation indices.
In 2012 and 2020, the NDVI-3 had a strong positive correlation with the VHI-3 (r = (0.59; 0.49)) and the VCI-3 (r = (0.65; 0.48)), implying that these vegetation indices are closely related, and a moderate one with the TCI-3 (r = (0.37; 0.30)).
The VHI-3, VCI-3, TCI-3, and NDVI-3 were positively correlated with the seasonal SPEI-3 in 2020, suggesting that drier conditions due to water deficit reduce vegetation health. In the year 2012, these indices did not show any correlation. These types of relations between the VHI, VCI, TCI, NDVI, and SPEI show that the vegetation indices collect data not only about precipitation deficit but also about other factors that influence vegetation health, like temperature or land cover, which are not fully captured by the meteorological drought index, the SPEI.
A moderate negative correlation was spotted between the seasonal SPEI-3 and the LST-3 (r = −0.37) in 2020, and no correlation was found in 2012, which reinforces that when the SPEI increases (wet conditions), the temperature decreases and vice versa.
In the year 2005, with extreme wet conditions, the VHI-3 showed strong positive correlations with the VCI-3 and TCI-3 (0.94 and 0.93, respectively). Likewise, the VCI-3 and TCI-3 had a strong positive relationship (r = 0.76). The LST-3 showed a significant negative relationship with the NDVI-3 (r = −0.73), the VHI-3 (r = −0.81), the VCI-3 (r = −0.64), and the TCI-3 (r = −0.89). The NDVI-3 had a strong positive correlation with the VHI-3, TCI-3, and VCI-3 (r > 0.73). All vegetation indices had a positive correlation with the SPEI-3, which, in turn, had a moderate negative relation with the LST-3 (r = −0.35).
The seasonal SPEI-3 and precipitation exhibit a strong positive correlation (r > 0.89) in 2005 and 2020 and a medium one in 2012 (r = 0.40), suggesting that they capture many of the same features of drought severity associated with meteorological conditions. As expected, the results exhibited a negative correlation between precipitation and the LST, as the temperature increases when the precipitation drops.
Regarding the drought indices, when precipitation increases, the VI value does the same, in general [
67,
68], and our research reached the same conclusion. The seasonal NDVI, VCI, TCI, and VHI had a positive small or medium relation with precipitation in the studied years, except for 2012, when the TCI-3, VCI-3, and VHI-3 did not show any correlation with it. This may be a sign that the soil was not able to retain water. In general, soil moisture regulates rainfall storage, determining vegetation growth [
69]. The combined interactions in soil between low moisture and high land surface temperatures might explain the VI’s weakness or no correlation with precipitation in certain years.
In general, the seasonal vegetation indices VHI, VCI, TCI, and NDVI had a significant positive relationship with each other, indicating that they can be used singly or in combination to monitor vegetation health because of rainfall deficit and high temperatures, given their negative relation with the LST and positive relation with the SPEI. These results are consistent with those presented in [
70]. Furthermore, the strong negative correlation of the LST and NDVI aligns with the findings of [
71].
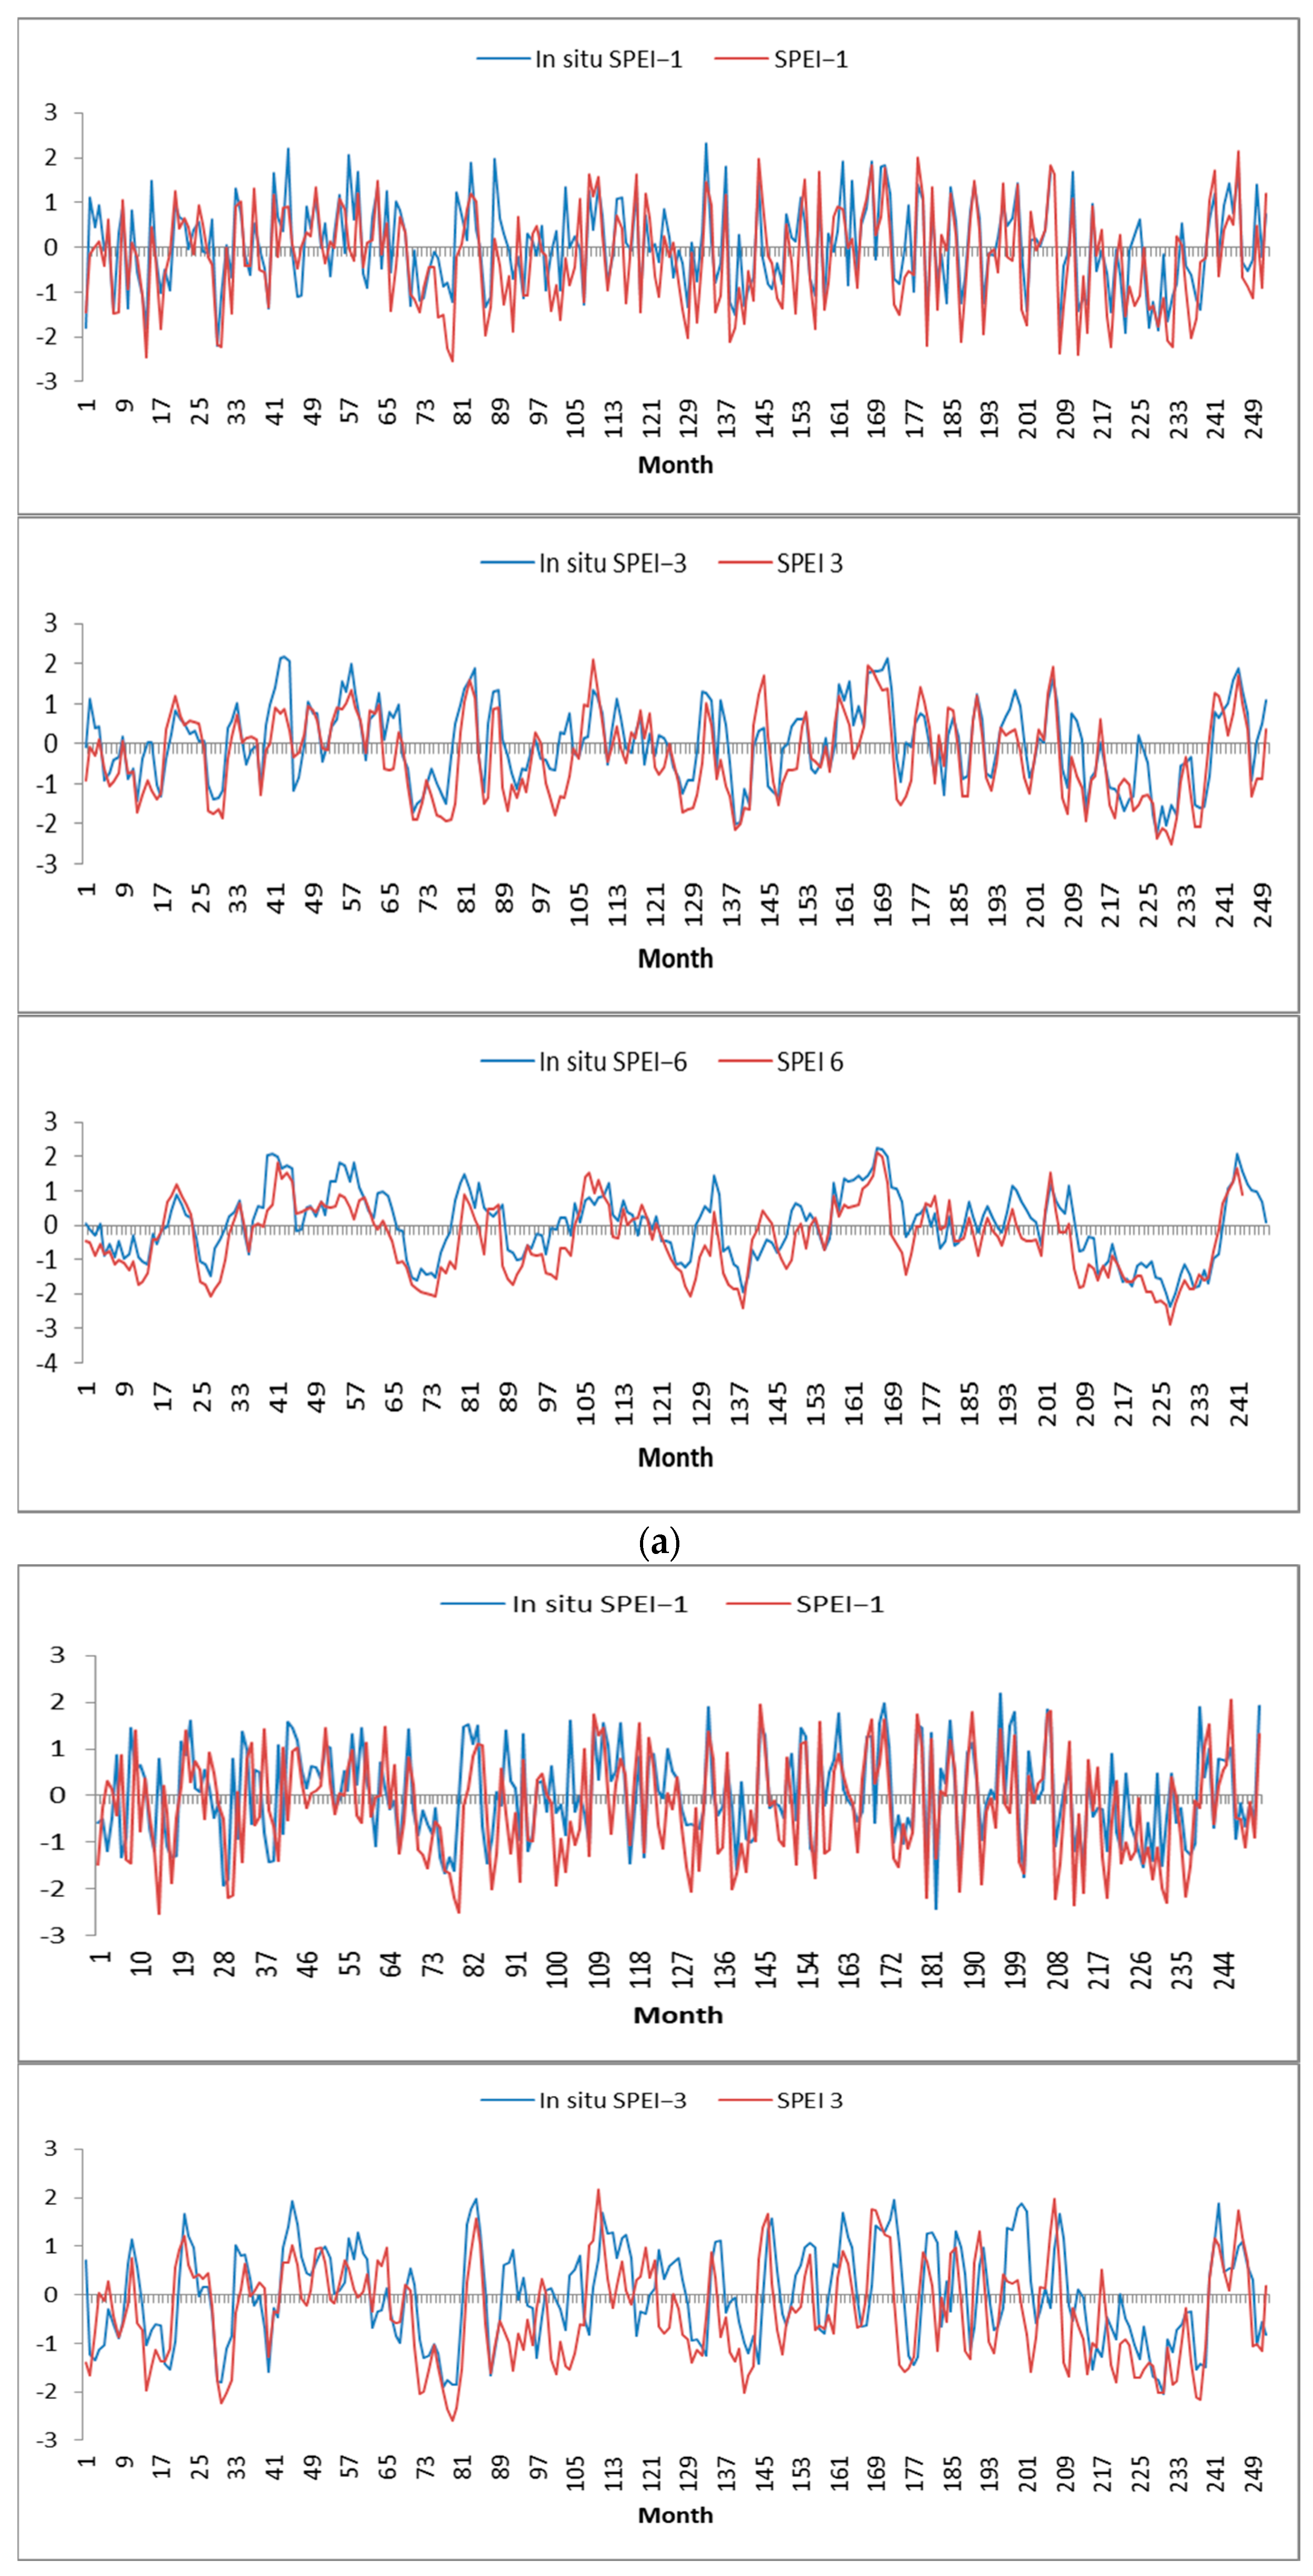
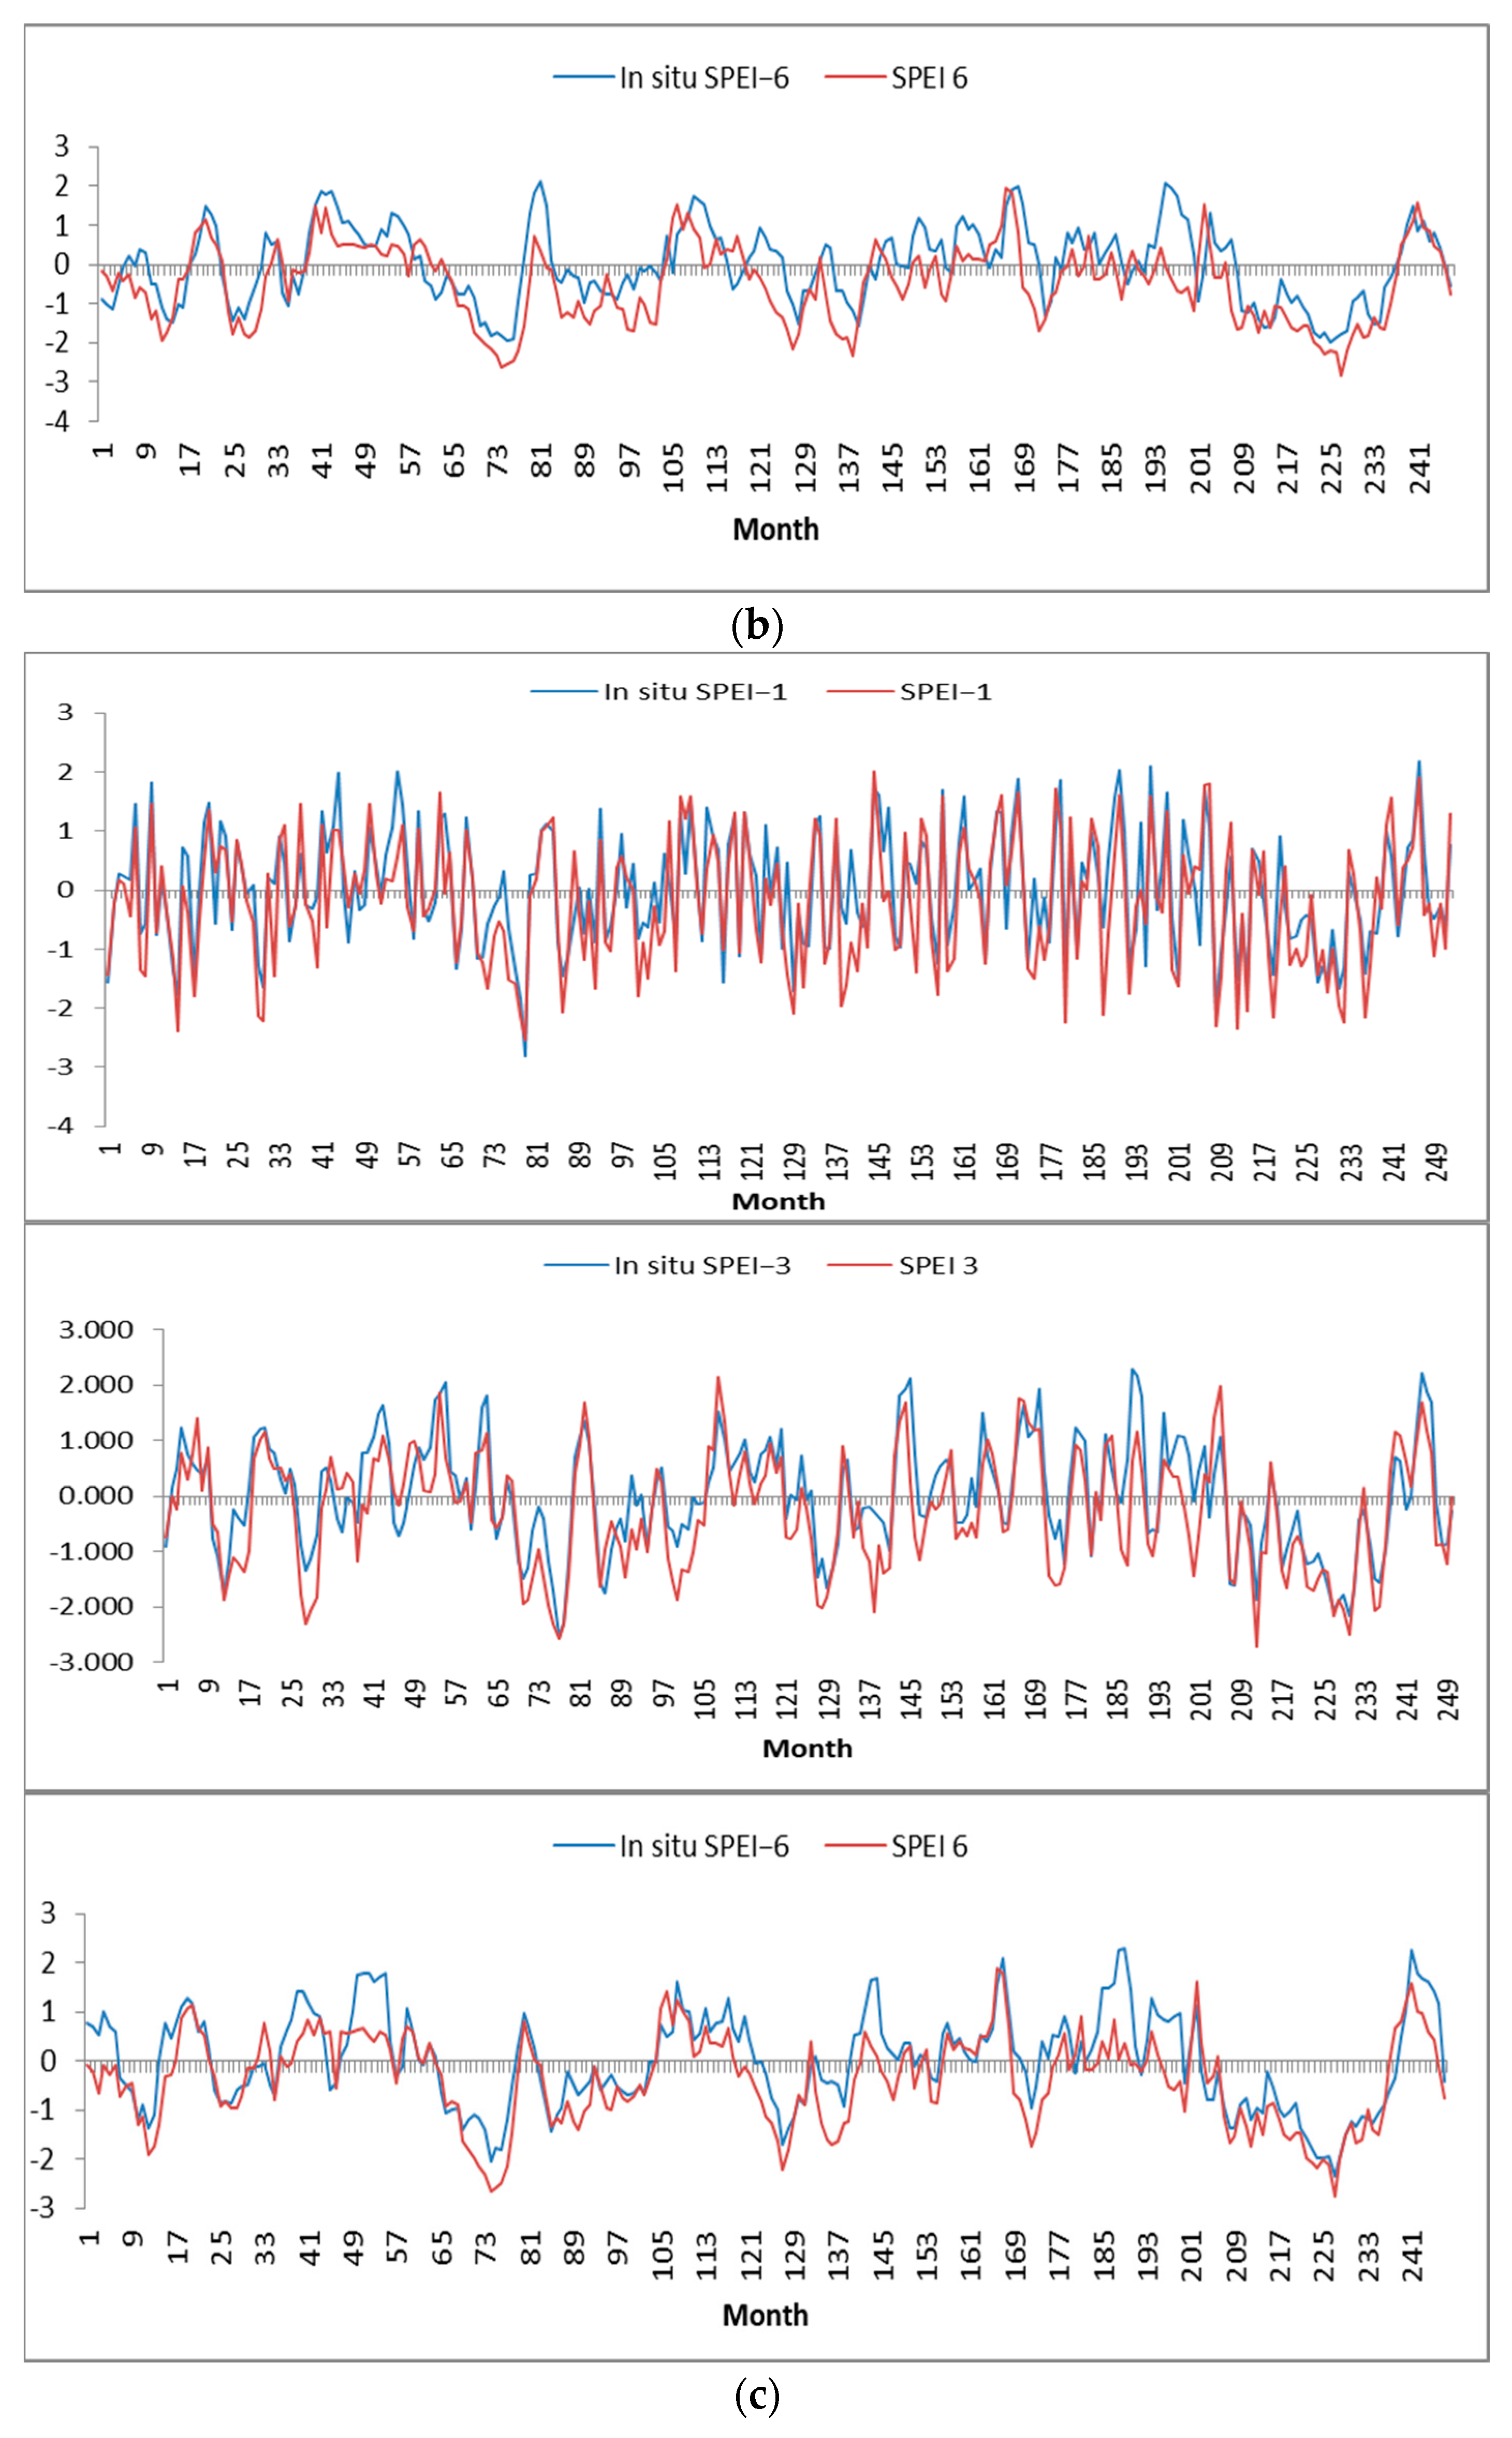
3.6. Evaluation of SPEIbase Data
The validation of the SPEI against the in situ SPEI has shown that the satellite-based SPEI index is relevant on a regional level and suitable to use. A similar magnitude and variation in time over the research period were shown through the comparison of the SPEI on 1-, 3-, and 6-month timescales (SPEI-1, SPEI 3, and SPEI 6) and ground station data (
Figure 12), with satellite-based SPEI data providing moderate underestimates and being generally consistent with the SPEI calculated based on observed data. Since we are interested in the relative deficiencies in soil moisture and precipitation, we presume that this does not bias the output.
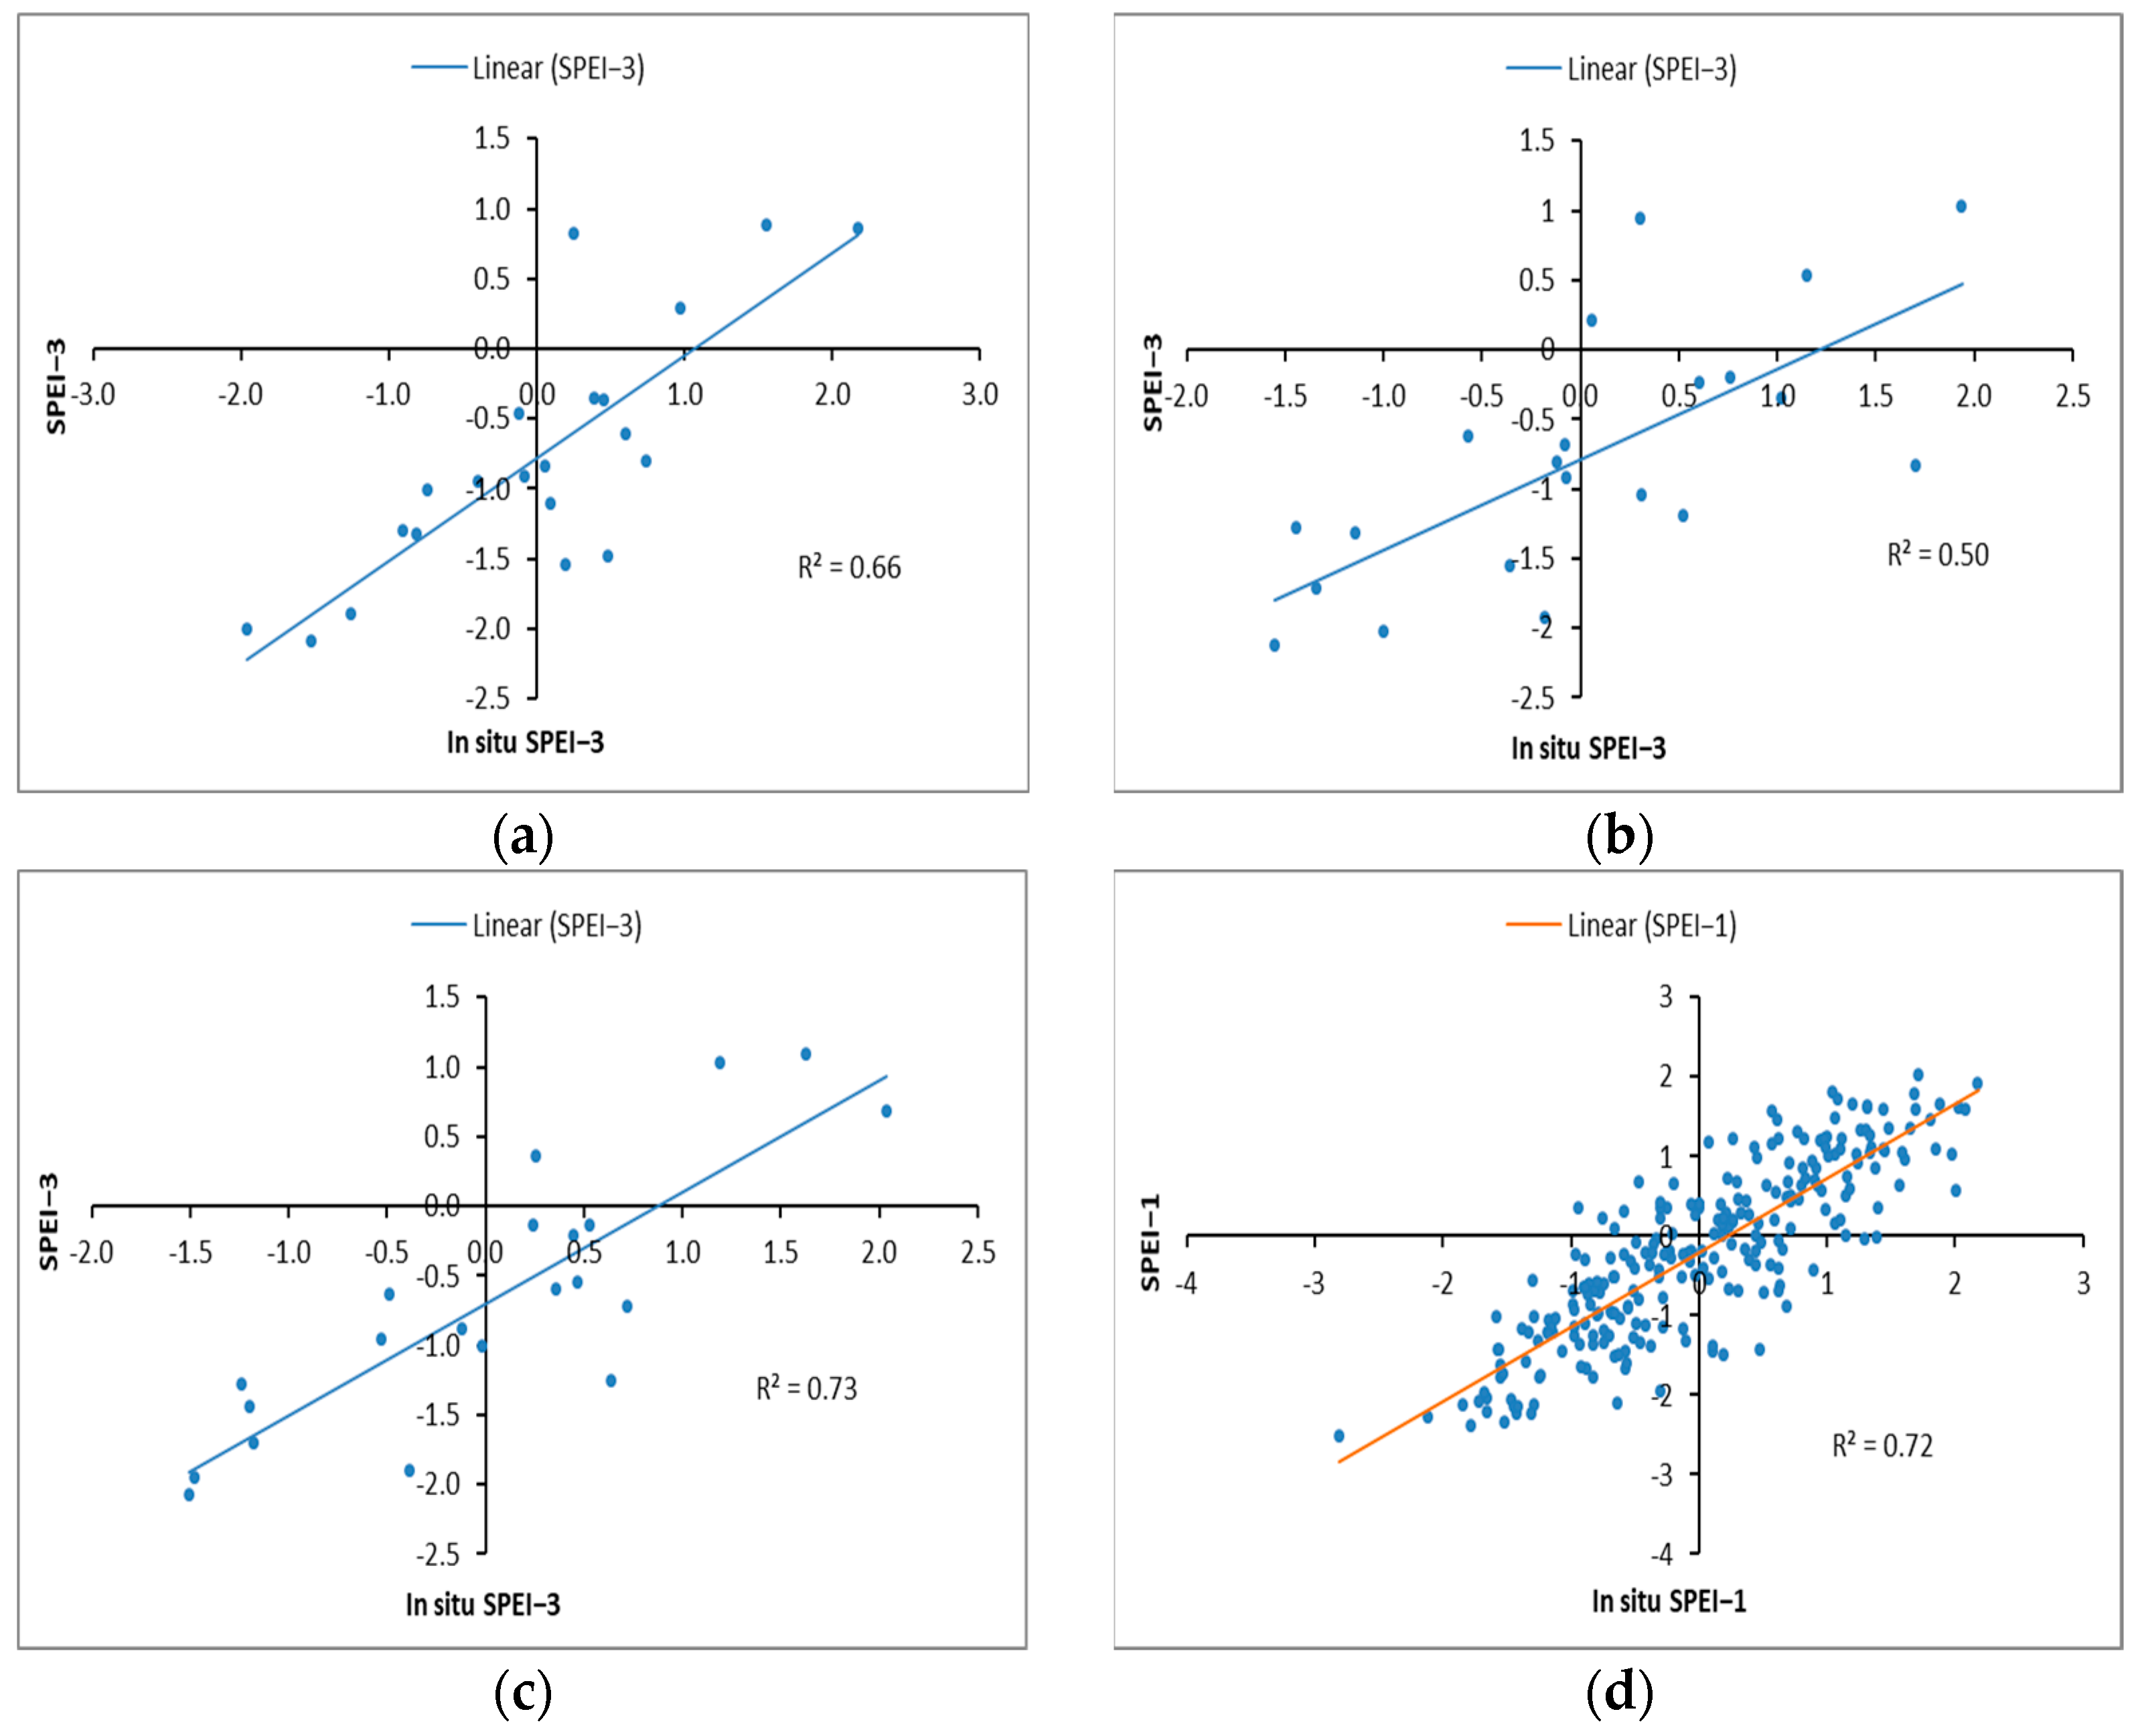
The correlation analysis (
Figure 13) indicates a high and statistically significant relationship, with a
p-value < 0.001 and a coefficient of determination,
R2, for both monthly (SPEI-1 and in situ SPEI-1) and seasonal (SPEI-3 and in situ SPEI-3) indices, ranging from 0.50 to 0.73, suggesting a strong linear association.
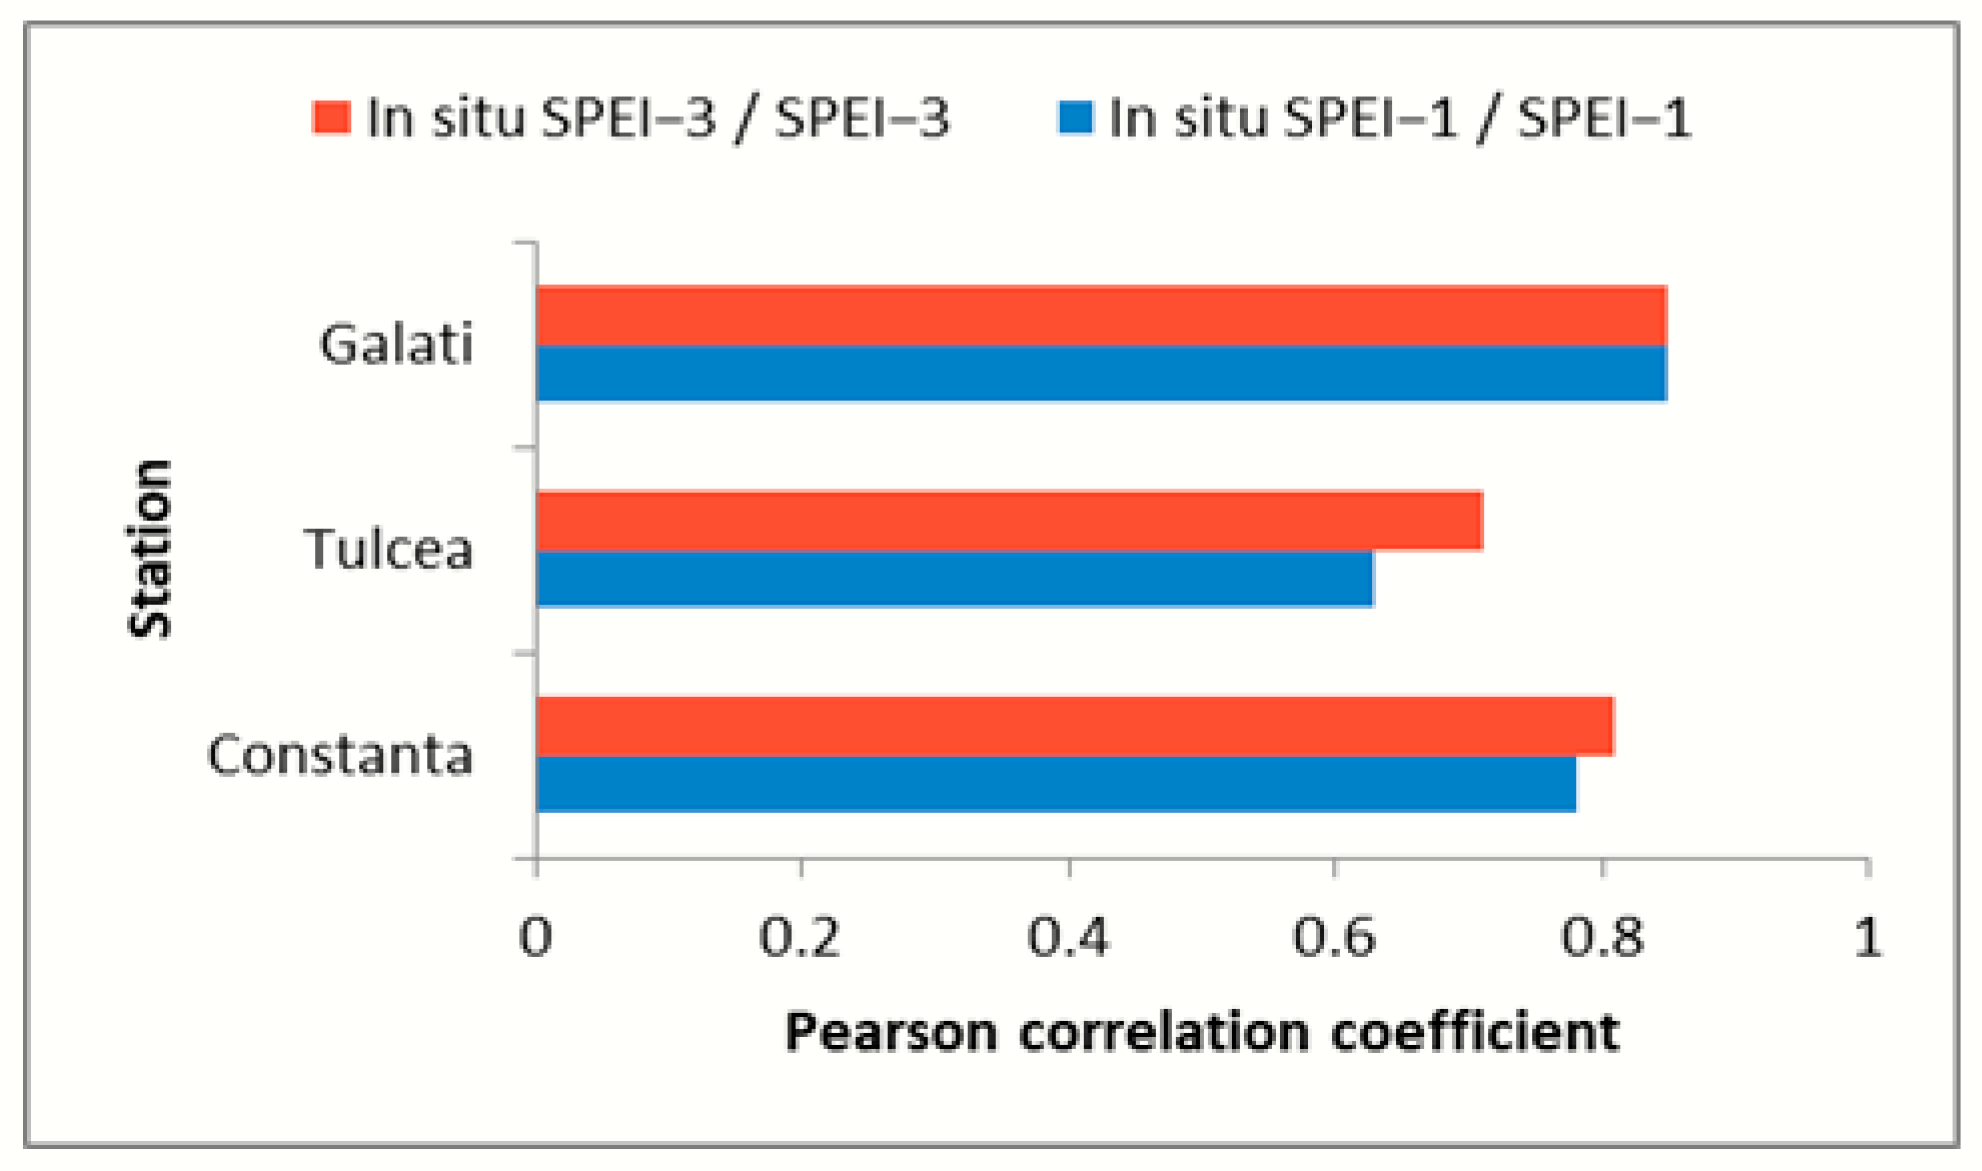
The
r values between the seasonal SPEI-3 and the in situ SPEI-3 vary from 0.71 to 0.85 with a median of 0.79 (
Figure 14). As for the SPEI-1 and the in situ SPEI-1, the minimum, maximum, and median values of
r were 0.63, 0.85, and 0.74, respectively. The results indicate almost the best fit of correlation at the meteorological stations considered in the present study.
3.7. Correlation Between VHI and SPEI
In the present study, the robustness of the VHI was validated through correlation analysis between the VHI and SPEI during the dry season of the study period.
The performance of the VHI-1 was analyzed in terms of the frequencies of drought categories identified during the period 2001–2021, making a comparison with those identified by the in situ SPEI-1.
Figure 15 reveals that the VHI-1 and the in situ SPEI-1 have the best similarity for severe drought conditions; the VHI-1 identified more extreme drought cases, which may be due to the VHI’s sensitivity to land surface temperature anomalies. The SPEI-1 identified more cases of moderate drought, which signifies that agricultural drought events in Dobrogea may not arise even in the presence of meteorological drought.
Furthermore, we performed a Pearson correlation study between the satellite-based SPEI-1 and the VHI-1, taking into account their average for each month of the dry season, from July to September, during the wettest year (2005) and the driest year (2020). The results revealed a significant positive correlation between the indices, with a correlation coefficient of 0.80 and 0.99, respectively. In the dry year, the rainfall shortfall had a negative effect on vegetation growth and enhanced the drought intensity. The best-fit positive correlation for the wet year indicated that the VHI-1 responded very well to precipitation and soil moisture content.
The VHI-3 time series were extracted at three reference stations and then compared to the ground-observation-based SPEI series. The Pearson correlation analysis between the seasonal VHI-3 and in situ SPEI-3 revealed a high positive correlation for all the stations (
Figure 16). The correlation coefficient (
r) values varied from 0.72 to 0.80, with a median of 0.77. A strong positive and statistically significant linear association was determined by the coefficient of determination, as well (
R2 > 0.52,
p-value < 0.001).
Figure 17 presents the time series of the seasonal VHI-3 and satellite-based SPEI-3 computed as yearly averages for the whole region. The mean VHI-3 had a significant downward trend (
p-value < 0.0001), similar to some extent to that of the mean SPEI-3, which suggests that during the study period the region experienced a decrease in vegetation health and soil moisture content. The years 2004–2005 were characterized by high values of both indices (0.67 < SPEI-3 < 0.88, 74.5 < VHI-3 < 90.9), indicating a period without drought. Near-normal wet conditions and mostly healthy vegetation were also experienced in 2002, 2010, and 2014 (0.062 < SPEI-3 < 0.241, VHI > 49.6).
Extreme dry conditions (SPEI-3 < −2) were met in 2007, followed by 2012 (SPEI-3 = −1.8), 2019, and 2020 (−1.2 and −1.4, respectively), when the mean VHI-3 showed severe drought conditions as well. In 2015, both indices revealed moderate dry conditions (SPEI-3 = −1.32, VHI-3 = 30.0). In 2003, there were moderate dry conditions (SPEI-3 = −1.3), while the mean VHI-3 indicates no stress in the vegetation (VHI-3 = 63.3). This may imply that rainfall did not play a significant role in vegetation conditions, which may have benefited from mitigating factors such as the use of irrigation or environmental factors such as land-use characteristics.
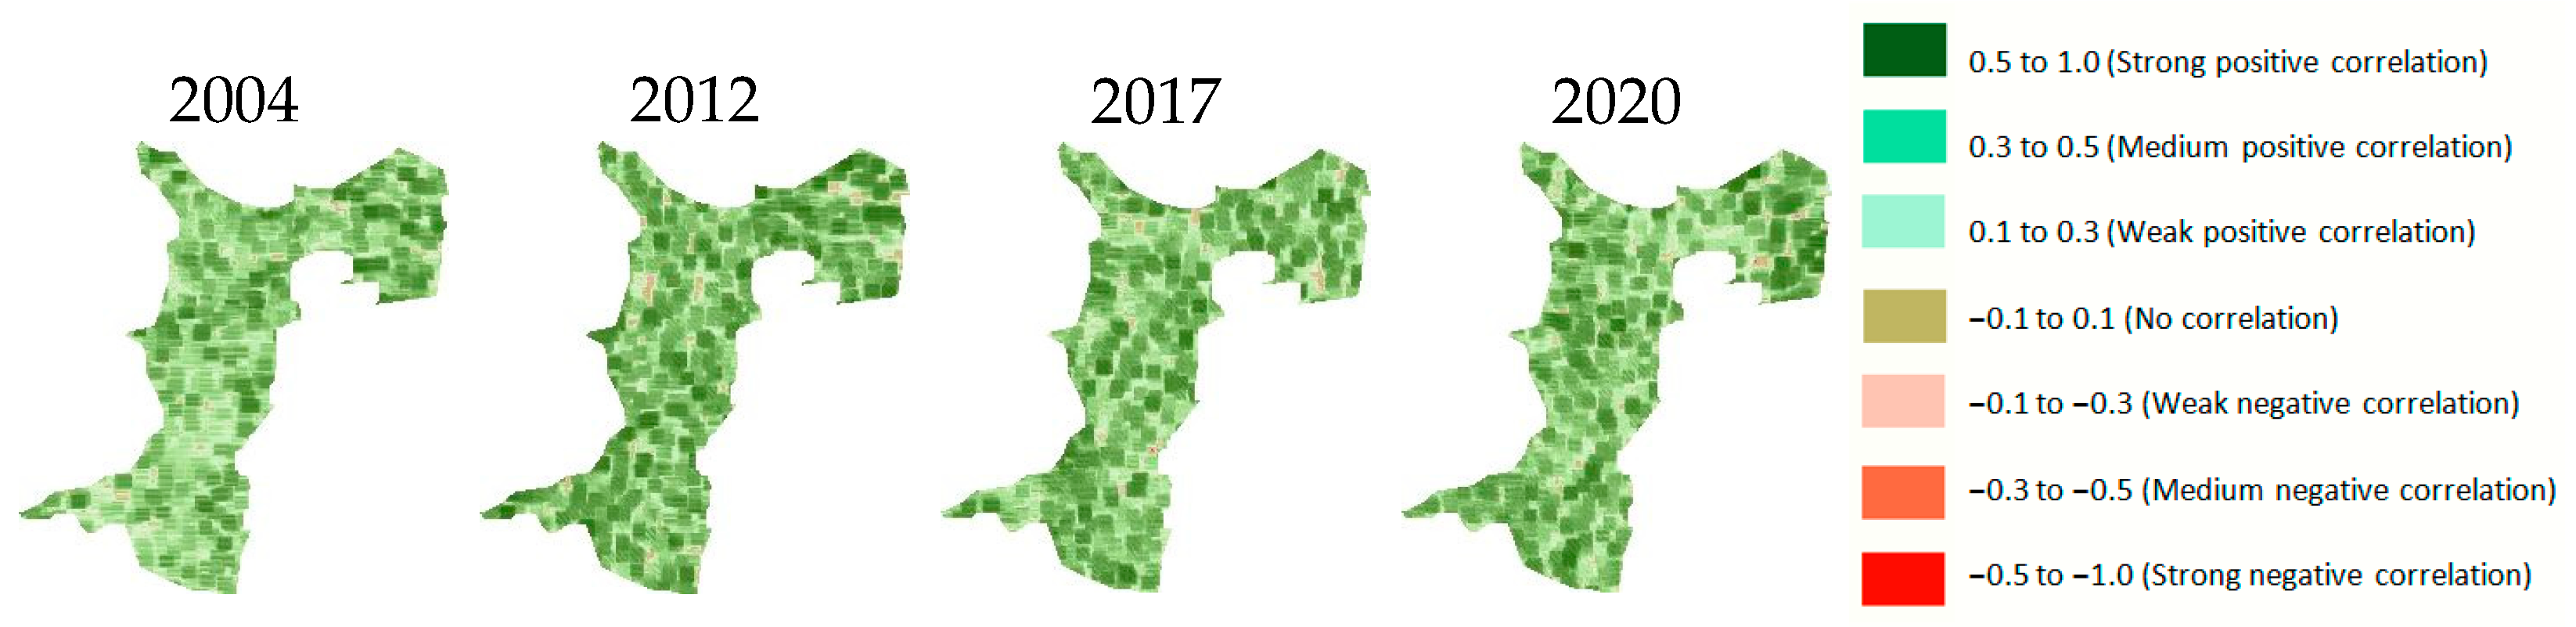
Furthermore, we evaluated the relationship between the seasonal VHI-3 and satellite-based SPEI-3 for years corresponding to each drought category established for the VHI index (
Table 3 and
Table 4): mild (2004), moderate (2017), severe (2012), and extreme (2020). The results (
Figure 18) indicated a moderate-to-strong positive correlation between the VHI-3 and SPEI-3 during the selected years in most parts of Dobrogea. However, a strong negative correlation was detected in some parts of the north, northeast, and center.
3.8. Correlation Between VHI and Crop Production
High temperatures and less rainfall are examples of atypical weather patterns that reduce agricultural yields and increase the need for irrigation techniques to preserve them. In Dobrogea, agricultural productivity is more dependent on climatic conditions in the central–southern part, whereas in the northern area, other factors influence crop yields [
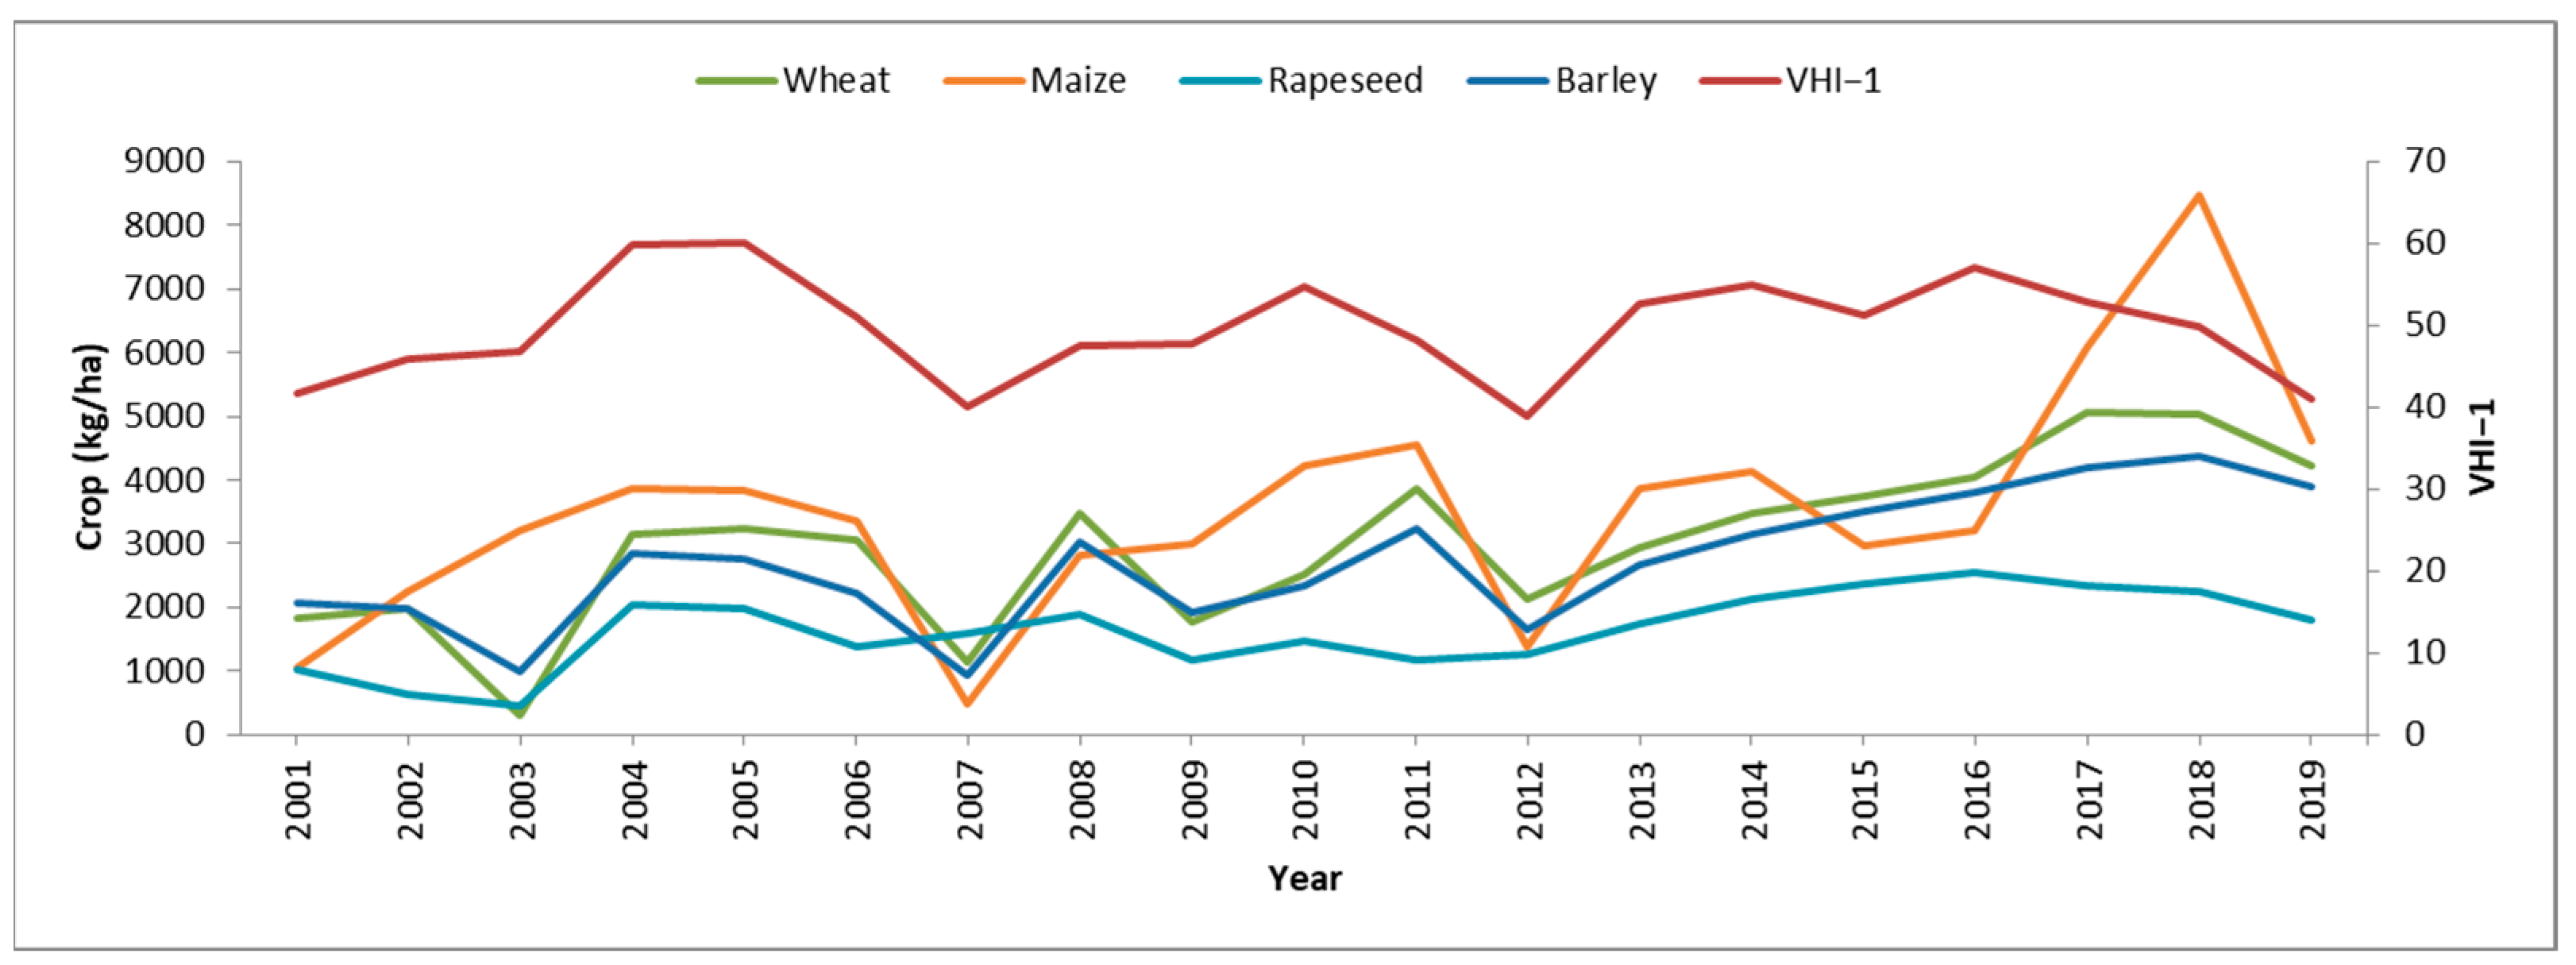
38]. The yearly mean of the VHI-1 series and the annual agricultural yield data for the years 2001–2019 were analyzed using a linear correlation. The Pearson correlation coefficient is 0.40 for wheat, 0.42 for barley, 0.44 for maize, and 0.53 for rapeseed, indicating a moderate-to-strong positive correlation with the annual mean of the VHI-1 data on the regional scale.
Figure 19 shows the dynamics of crop yield in Dobrogea for the period 2001–2019. The validation of each crop against the annual average of the VHI-1 data showed, in general, a considerable agreement between the two: as the VHI-1 increases, the crop yield also increases and vice versa. Wheat and barley crops had similar dynamics during the study period, which closely resembled that of the VHI-1, except for the years 2002–2003 and 2008–2009, when the VHI-1 showed a slight increase and the crop yields decreased greatly, and the years 2010–2011, 2014–2015, 2016–2017, and 2017–2018, when the VHI decreased while the crop yields increased, most likely due to intensive irrigation. The maize dynamics are even more similar to those of the VHI-1, with two periods in which they differ: the years 2010–2011, when the VHI-1 decreased and the corn production increased, and the years 2017–2018, when the VHI-1 decreased and the crop production increased greatly, most likely owing to the use of irrigation systems. The yield of rapeseed follows the same trend as the VHI-1 for the most part, except for the years 2002–2003 and 2008–2009, when the yield decreased, and the years 2006–2007 and 2014–2015, when the yield increased, despite the signs of drought indicated by the VHI-1 decrease. In 2003, all production decreased, except for maize, although the VHI-1 values did not indicate drought conditions. In general, the production of each crop, except for rapeseed, follows the dynamics indicated by the VHI-1 in terms of the years without drought, 2004–2005, and the driest years, 2007 and 2012. In 2019, also affected by severe-to-extreme drought according to the VHI values, all production decreased, with the largest decrease being in maize production, which was halved compared to the previous year.
3.9. Trend Analysis Comparisons
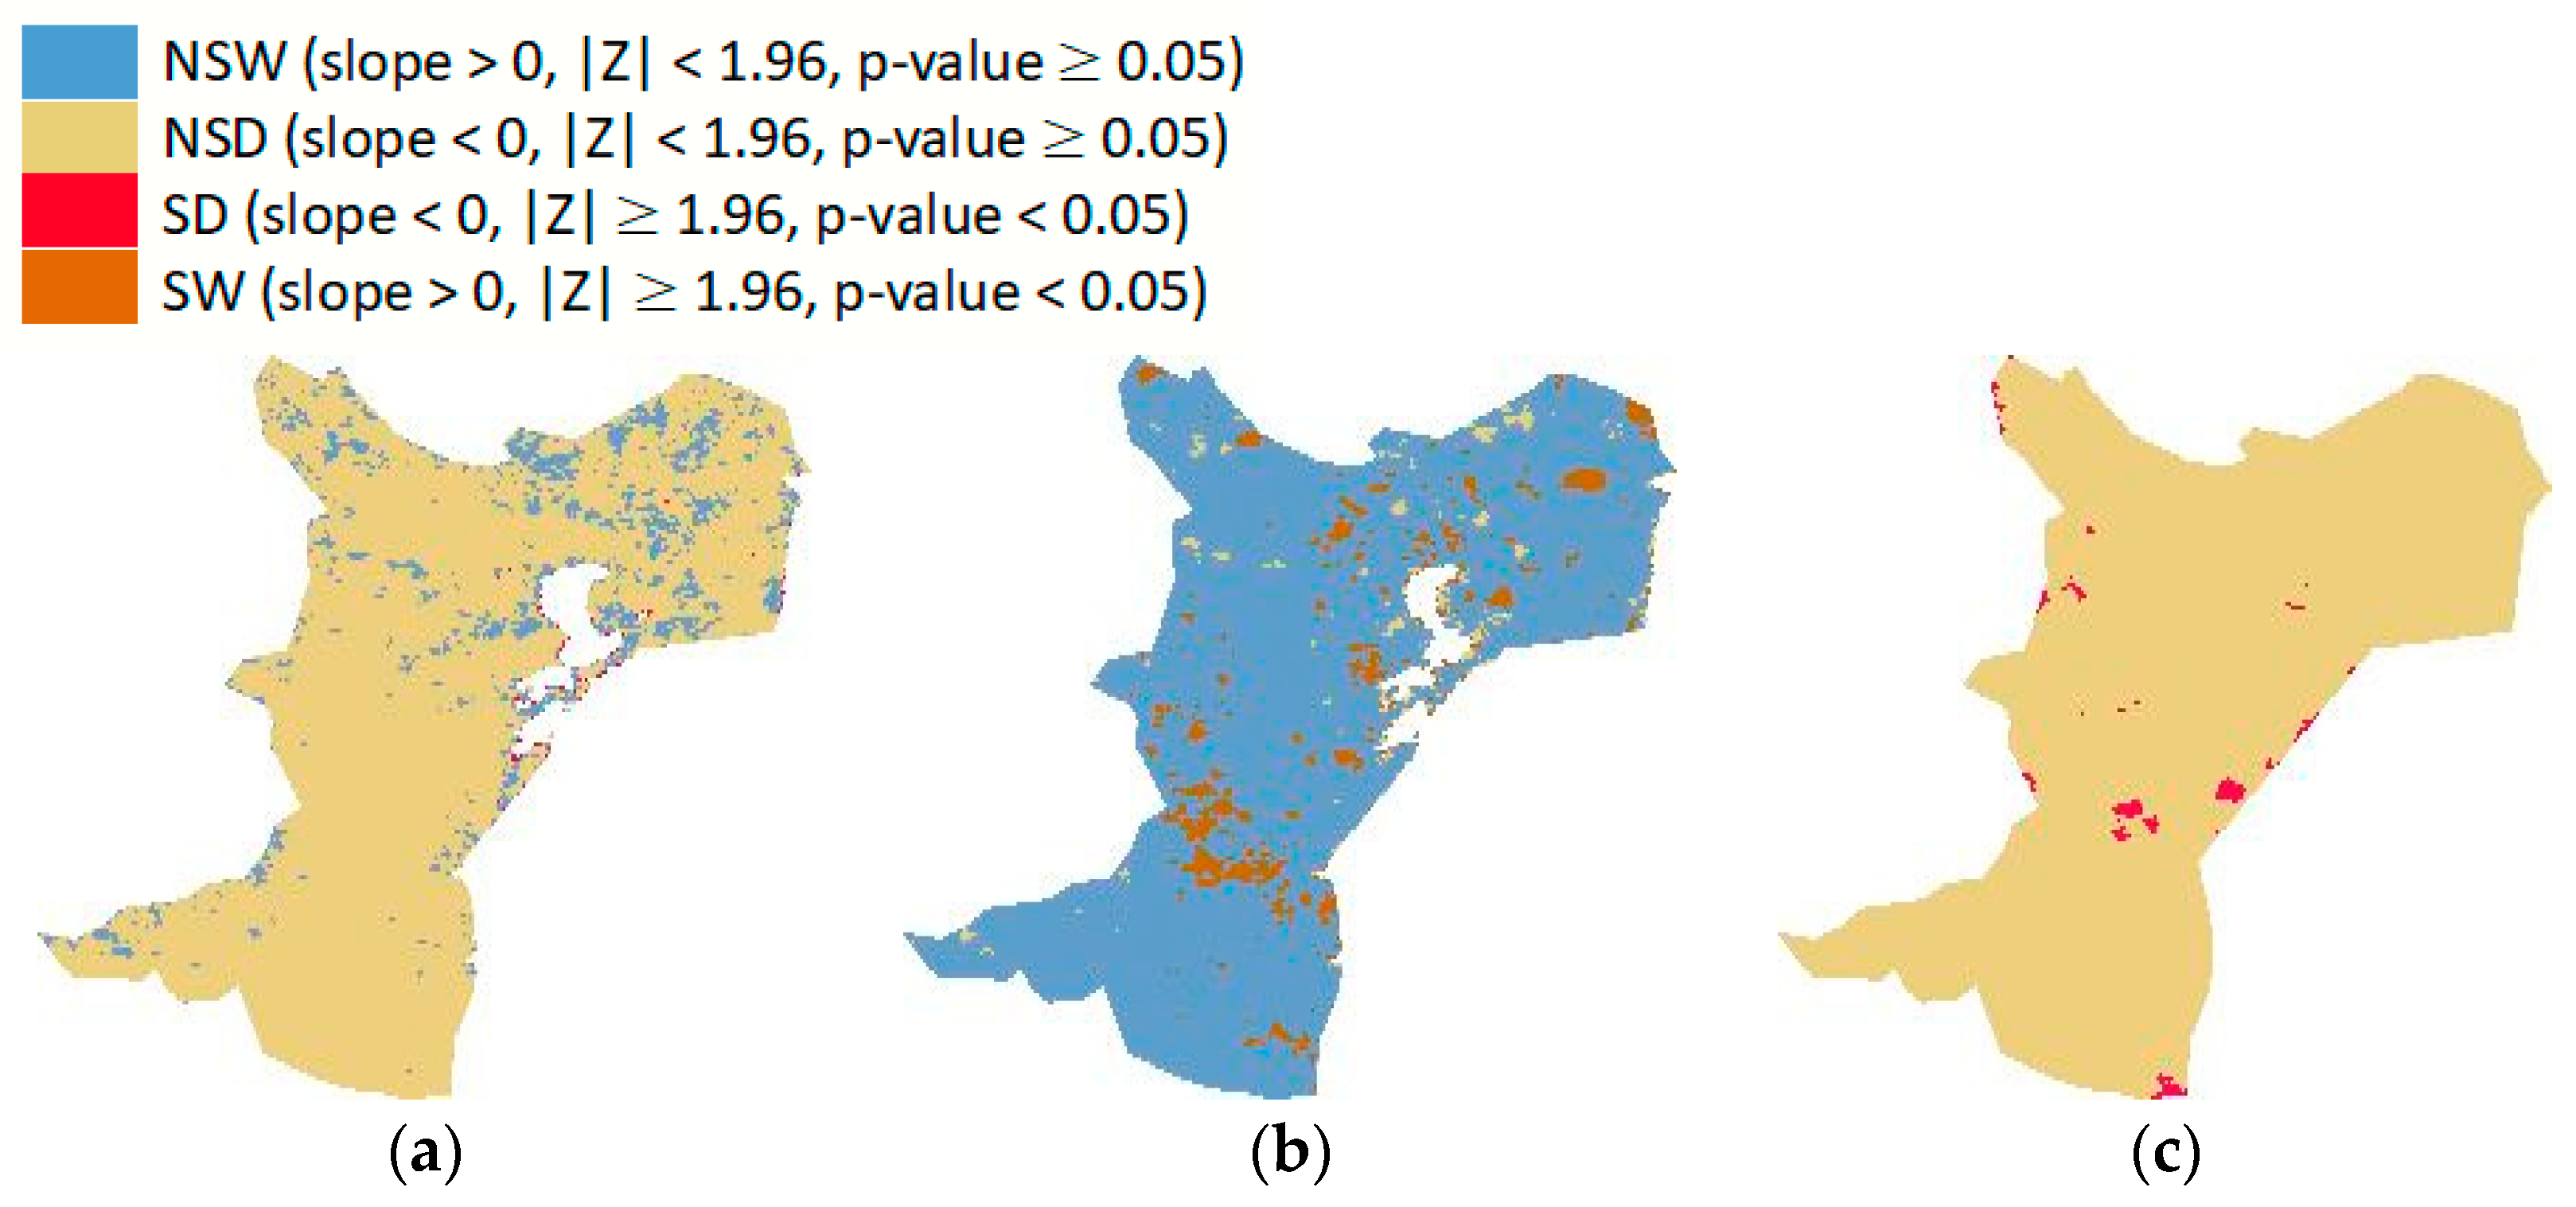
The Mann–Kendall test and Sen’s slope estimator were used to identify the trends in the precipitation, LST, and VHI series, on a seasonal (3-month) scale, between 2001 and 2021. In this work, the significance of the results was statistically tested at the 95% confidence level. The trend satisfies the significance levels of p-value < 0.05 when |Z| 1.96. We identified four classes for the significant and non-significant trends: Significant Wetting (SW) (slope > 0, |Z| 1.96), Non-Significant Wetting (NSW) (slope > 0, |Z| < 1.96), Significant Drying (SD) (slope < 0, |Z| 1.96), and Non-Significant Drying (NSD) (slope < 0, |Z| < 1.96).
Figure 20 shows that most of the region exhibited an insignificant increasing trend in the LST-3 and an insignificant decreasing trend in both the VHI-3 and precipitation, indicating an increase in both agricultural and meteorological drought severity in Dobrogea over time, but this increase was not statistically significant. Some parts of the region, mostly the northeastern one, showed an insignificant increasing trend in the VHI-3, which indicates that, here, MD and AD were gradually alleviated during the period from 2001 to 2021. The VHI-3 values significantly decreased in only small areas situated along lakes and the coast, just as the precipitation. This is consistent with the results in [
25,
40,
66], where the area of lakes on the coast of Dobrogea was studied, and the degradation of the ecosystem and a significant decrease in the water surface until complete drying were observed.
The LST-3 values insignificantly increased across almost the entire region, except for minor decreases in small areas in the northeast and northwest, and a significant increasing trend was observed in the center and north, indicating a progressive worsening of AD. This finding is supported by the research in [
21,
23,
25,
49], which showed, at the country level, an increasing trend in temperature starting from 1971 and intensifying from 1997, so, for example, in the interval 2001–2010, the temperature increased by 0.4−0.6 °C in comparison with previous decades. Furthermore, small areas in the center of the region showed a significant decreasing trend in precipitation, indicating a progressive aggravation of MD as well.
4. Discussion
4.1. Influence of Irrigation on VHI Results
Due to the climatic conditions and especially the annual precipitation of less than 500 mm, the risk of drought in Dobrogea has increased [
72,
73], and agriculture cannot develop here without irrigation. In the early 1970s, a giant irrigation system was put into operation, and, by the end of the 1980s, approximately 500,000 hectares could be irrigated [
43]. The major disadvantages of the irrigation systems in Dobrogea were the high pumping height and the long transport length [
46], which led to high energy consumption (over 2100 kWh/ha for 13.2% of the area). Starting from 1991, the irrigated area in Dobrogea began to decrease; the factors that led to this phenomenon were the dismantling of the large-scale exploitation structures; the degradation of water supply and distribution channels; the introduction of tariffs for water consumption, depending on the pumping height; and, last but not least, the ecological degradation of ecosystems such as Lake Techirghiol. According to the National Land Improvement Agency (ANIF) [
74], today, the irrigated area represents less than 10% of the total area (the area contracted for irrigation in 2024 was 49,900 hectares). In this context, some weak relationships in the correlation matrices presented in this study for the dry years (e.g., VHI against SPEI) could be attributed to irrigation practices in certain areas. As we previously mentioned, the irrigated areas have diminished considerably in the last period, and irrigation is used only in proximity to the Danube River, the Danube Black Sea Canal, and lakes with fresh water. Weak or moderate correlations have also been obtained due to the influence of forests (northern area). In other words, areas with different vegetation can influence the results.
4.2. Influence of Soil on VHI Results
It is well known that pedogenesis processes are evaluated differently depending on the bedrock. A common feature of the bedrock units of Dobrogea is the vast Quaternary cover, starting with Lower Pleistocene reddish clays and continuing up to the Holocene, with a sequence of various thicknesses (2–20 m), enclosing up to six couples of loess–paleosoil layers. For this reason, most of the soil types developed in the area (kastanozems, chernozems, and regosols) have a loessoid texture (dusty loam, loamy, and clayey loam texture). If the texture is loamy clay, then there is the possibility of the appearance of some crusts that prevent the circulation of water. Low values of structural hydro-stability imply high vulnerability to compaction, water erosion, and crust formation, which prevents or hinders the emergence of plants, especially those with small seeds and low penetration power. From a hydrological point of view, this soil type has moderate flow potential. A common characteristic of loessoid soils is their cracking as a result of frequent shrink–swelling phenomena. As a result, two processes can occur: a rapid infiltration of the water from precipitation (which cannot contribute to redistribution in the soil profile) and/or an increase in direct evaporation from the soil. These phenomena, combined with the phenomenon of the loss of structure, lead to water movement through the vadose zone and aquifer recharge, which in turn leads to an increase in drought in Dobrogea since plants cannot not retain water in the root zone, and their health deteriorates.
The VHI is a model based on the following hypothesis: when the NDVI value is low and the LST value is high, vegetation health is considered “poor”. Conversely, when the NDVI is high and the LST is low, the vegetation is in good health. In the study area, the NDVI is generally below 0.5, and the LST is above 30 °C, with a strongly negative correlation between the two values (r < −0.6, p-value < 0.0001). This indicates that the vegetation is in poor health. Since there is a strong positive correlation (r = 0.5–0.8, p-value < 0.0001) between the NDVI and VHI, we conclude that the VHI model provides a reliable estimation of vegetation health at the regional level.
4.3. Influence of Drought on the Plants
Drought is a phenomenon that occurs in different phases of plant development from germination to maturity (grain weight, grain per plant, ear/kernel number per plant, etc.), contributing to a decrease in plant growth, development, and crop production. Biomass variation is directly correlated with plant development and, ultimately, with crop production. Traditional biomass quantification methods typically involve destructive measures, which are time-consuming, effort-intensive, human-resource-intensive, and costly. Furthermore, for a regional estimate, these methods become practically impossible to implement. Some satellite products for biomass calculation, such as PlanetScope-based vegetation indices, could be used, and machine learning methods should be added to improve estimation accuracy. High-resolution satellite images require a lot of processing; in this context, crop production could be a useful indicator to express the influence of drought on plants.
In this study, we analyzed the relationship between the annual crop production and the VHI, and the comparison revealed that, generally, when the VHI increases, production also increases and vice versa (
Section 3.8). However, some discrepancies exist, particularly in drought years, where we suspect that higher production was due to irrigation in certain areas of Dobrogea. Unfortunately, we do not have data on agricultural production distribution by region, which prevents more detailed classification. This limitation may explain some of the observed inconsistencies.
4.4. Trend Analysis
The trend analysis results of this study, related to the VHI and LST, are similar to those in [
28], which revealed, after an analysis conducted with the SPI over the last five decades, a nonuniform spatial pattern of the wetting/drying trends at the country level, with statistically significant positive/negative trends only in small areas. However, the WMO findings, which indicated an increasing concern about long-term increases in drought severity due to climate change, are in contradiction with the lack of statistically significant trends in seasonal drought indices. This dispute emphasizes how complicated drought patterns can be in some areas, such as Dobrogea, where transient variations can cover long-term patterns.
4.5. Limitations
Spatial and temporal analysis revealed important regional patterns in drought occurrence in Dobrogea. However, our study is subject to certain limitations. Usually, research on extreme events such as agrometeorological droughts spans at least 30 years. Our study period was limited to only two decades (2001–2021) by the availability of satellite data (starting from February 2000 for the NDVI and LST datasets) and climate data (until December 2021). Therefore, the results of this research are significant for understanding short- and medium-term trends, rather than long-term drought conditions [
75].
Due to the unavailability of precipitation data at the resolution of the MODIS NDVI and LST products, this study applied the bicubic interpolation method to resample the SPEIbase and CHIRPS precipitation data to a higher scale (1 km). Bicubic interpolation is a popular method that preserves the smoothness and crucial details of the original image. This method is effective especially when upscaling images and yields enhanced edge clarity. However, the bicubic interpolation method can occasionally produce atypical smoothing artifacts, in particular in image areas with high contrast, which may lead to uncertainties in the output data. Other resampling methods or newly developed satellite products will be considered in future studies.
Further, the meteorological data used for validation were gathered from a network of weather stations with very low density. Moreover, the stations had to have complete precipitation and temperature datasets, so only a small number of stations met this condition, and this might alter the significance of our validation tests. In future research, datasets with missing data should be supplemented using regression methods.
Additionally, the data resolution and land cover types may have an impact on the estimation of drought areas using a pixel-based analysis. Future research could evaluate drought conditions related to various vegetation cover types using higher-resolution data and different techniques.
Lastly, our focus on climate data allows for a more in-depth analysis of socioeconomic factors that can exacerbate drought conditions (e.g., population density and topographical variations) [
76].
5. Conclusions
NDVI, LST, TCI, VCI, VHI, and SPEI data from 2001 to 2021 were analyzed using a multi-index approach to determine the dynamics of agrometeorological droughts in the Dobrogea region. Since the contributions of temperature and water to vegetation development are hard to estimate and depend on the environmental conditions of the studied area, when applying the VHI model to a region, it is essential to adjust the coefficient α accordingly, thus determining the optimal weighting values of the TCI and VCI within the VHI. The drought indices were then used to map the geographic distribution and drought severity on monthly and seasonal (July to September) scales. According to the results of the seasonal VHI, we found that the region experienced extreme and severe drought, primarily in its southern, northwestern, and central parts, in 2001, 2007, 2012, 2015, 2016, and 2019, with the worst event being in 2020 when most areas were affected. While no significant long-term trends were observed during the study period, the prevalence of mild and moderate droughts stresses a tendency towards drier conditions.
By analyzing spatial and temporal drought patterns, our research offers valuable insights into Dobrogea drought dynamics, which can be used to develop a strategy for drought mitigation measures such as planting protective forests in the center and south of the region. The VHI is a model used to identify and monitor the impact of drought on crop production as well, with its main advantage being its global coverage at a high spatial resolution. In this context, the VHI provided reliable results and proved to be in good agreement with precipitation and agricultural yield patterns, thus being suitable for monitoring agricultural droughts in Dobrogea. This knowledge will help raise drought resilience in the Dobrogea region, the central area being particularly vulnerable, with proper strategies for developing early warning systems, sustainable water management, and high crop productivity with efficient infrastructure for irrigation. It is well known that plants develop their own mechanisms of adaptation to drought-induced stress (morphological, anatomical, biological, etc.). In addition to these natural mechanisms, it is important to develop drought-tolerant/resistant varieties that offer a solution to the global food crisis. Further research should focus on additional factors, such as socioeconomics, to assess the region’s vulnerability to drought effects.


