Article

Safety Analysis of Agricultural Implement for Mulching and Soil Covering

1
Department of Biosystems Engineering, Chungbuk National University, Cheongju 28644, Republic of Korea
2
Daesung Agricultural Machinery Co., Ltd., Cheongju 28205, Republic of Korea
*
Author to whom correspondence should be addressed.
Agriculture 2025, 15(6), 632; https://doi.org/10.3390/agriculture15060632
Submission received: 19 December 2024 / Revised: 3 March 2025 / Accepted: 7 March 2025 / Published: 17 March 2025
(This article belongs to the Section Agricultural Technology)

Abstract

:
In recent years, the increasing use of mulching in agricultural practices has been driven by its benefits in weed suppression, soil moisture retention, and improved soil structure. However, Korean farms typically perform mulching and soil covering separately, leading to excessive labor requirements. To address this issue, this study analyzes the safety of a newly developed mulching and soil covering machine. To evaluate its structural safety, strain gauges were attached to critical points of the machine, and strain data were collected under various Power Take-Off (PTO) and engine speed conditions. The measured strain was converted into von Mises stress and maximum shear stress, and the safety factor was calculated using the maximum shear stress theory and the strain energy theory. Additionally, fatigue life was predicted using the rainflow counting method, the Goodman equation, and Palmgren–Miner’s rule. The results indicate that the safety factor ranged from 1.65 to 16.54 based on the maximum shear stress theory and 2.42 to 19.83 based on the strain energy theory, confirming that the machine can withstand operational loads without failure. Furthermore, fatigue life prediction revealed that the lowest estimated fatigue life is 14,575 h, equivalent to approximately 607 years of continuous use. These findings demonstrate that the developed machine possesses high safety, making it a viable solution for improving efficiency in mulching and soil covering operations.

1. Introduction

Rural aging and labor shortages have become serious issues in many regions worldwide [1,2,3]. This rural aging phenomenon is occurring due to young people’s aversion to agriculture and declining birth rates. While elderly farmers continue agricultural activities based on years of experience, changes in physical and cognitive abilities may make them more vulnerable to accidents during farm work. This aging trend is closely linked to the advancement of agricultural technology and labor shortages, leading to increased use of agricultural machinery. According to research by [4], analyzing 115 countries from 2006 to 2010, it was predicted that labor shortages due to population aging would lead to technological advancements and productivity improvements in agriculture. Consequently, the importance of ensuring agricultural machinery safety is being emphasized more than ever. Although the use of agricultural machinery has increased due to agricultural advancement and labor shortages, awareness of safety among farmers remains relatively low. However, the rate of safety accidents in the agricultural sector is increasing due to more harsh working environments compared to other industries [5,6,7]. Elderly farmers need to pay more attention to work efficiency and safety management, which can significantly impact agricultural productivity and sustainability. Accidents in agricultural settings can often lead to serious injuries or death, making safety measures essential in the use and management of agricultural machinery [8,9]. Therefore, agricultural machinery manufacturers should focus on designing safer machines and thoroughly testing the safety of manufactured equipment.
Meanwhile, a specific example of agricultural mechanization is the issue of weed management in vegetable crop cultivation. When growing leafy vegetables and other crops in open fields, manual labor for weed removal and the use of herbicides are inevitable [10]. As a solution, many farms are implementing mulching. Mulching has been reported to have various advantages, including weed suppression, soil moisture retention, improvement of soil structure, and maintenance of appropriate soil temperature [11,12,13]. The use of mulching film has significantly increased over the past decade, with global annual usage reaching 4 million tons and showing an annual growth rate of 5.6% [14]. Currently, the widely used walk-behind mulching machines in Korean farms can only mulch one ridge at a time, requiring extensive work hours and labor. Additionally, four-ridge tractor-mounted mulching machines do not simultaneously perform mulching and soil covering, necessitating additional soil covering work with a hoe. However, if it rains after mulching, soil from the furrows washes away, causing the film to peel off and making soil covering impossible. Therefore, there is a need for the development of agricultural machinery that can perform both plastic mulching and soil covering simultaneously.
Understanding material strength and failure mechanisms is crucial for improving the safety and efficiency of agricultural machinery. Material failure occurs when materials cannot withstand applied external loads. In other words, machines or components break when the internal stresses induced by external loads exceed the material’s strength. To predict material failure, it is essential to identify the internal stresses generated by external loads. Failure theories are based on these internal stresses. The main failure theories include the maximum principal stress theory [15], maximum shear stress theory [16], and strain energy theory [17]. The maximum shear stress theory posits that a machine or component fails when the maximum shear stress induced by external loads exceeds the maximum shear stress at failure in a simple tensile test. The strain energy theory, on the other hand, states that failure occurs when the strain energy per unit volume in a machine or component surpasses the strain energy per unit volume at failure in a simple tensile test.
Failure due to a single load can lead to severe accidents. To prevent such occurrences, extensive research is being conducted to determine appropriate safety factors. This research is vital for enhancing the overall safety and reliability of agricultural machinery. Menacho-Mendoza et al. [18] conducted a comparative analysis of stress distribution and safety factors for three dental implant systems using the finite element method. Henriques et al. [19] compared high-cycle fatigue design approaches using the Soderberg method and the DIN 743 standard; Calculation of load capacity of shafts and axles. Deutsches Institut für Normung: Berlin, Germany, 2012., demonstrating that the Soderberg method consistently provided lower safety factor values under various loading conditions. Matvienko [20] proposed a simplified approach for estimating safety factors. This approach calculates safety factors by considering the correlation between the collapse safety factor relative to yield stress and the fracture safety factor based on fracture toughness or fracture assessment diagrams. Al-Oqla and Hayajneh [21] conducted a study using finite element analysis to investigate the effects of various geometric shapes and discontinuities on the safety factors of cellulose-based composite beams. This research aimed to determine optimal structures for the design of sustainable bio-products.
Failure can also occur due to the accumulation of damage from repeated loading. Fatigue failure is a phenomenon that occurs when materials are subjected to repeated stress or loads. Generally, even if a material can withstand a large single load, it may fail due to accumulated fatigue when continuously subjected to smaller, repetitive loads [22,23,24]. Fatigue failure typically begins with microscopic cracks that gradually expand. These cracks primarily originate at stress concentration points (weak points) in the material and grow over time, eventually leading to complete material separation or loss of functionality. This type of failure can pose a serious threat to structural integrity. To prevent such failures, extensive research is being conducted on fatigue life prediction. Understanding and predicting fatigue behavior is crucial for ensuring the long-term safety and reliability of structures and components subjected to cyclic loading, particularly in critical applications such as agricultural machinery. Chen et al. [25] estimated structural damage using an independent rainflow counting method for each element under general loading conditions. Wu et al. [26] proposed and validated a new model for fatigue life prediction under random vibration conditions. Abdullah et al. [27] evaluated the fatigue life characteristics and reliability of automotive components using random strain data measured under various road conditions. Li et al. [28] predicted fatigue life under irregular variable amplitude loads with statistical and spectral similarities. Loew et al. [29] proposed a new model for predicting the fatigue life of wind turbines.
These studies play an important role in the design and safety assessment of agricultural machinery. Agricultural mechanization is accelerating in response to rural aging and labor shortages. In this context, improving the safety and efficiency of agricultural machinery has become a critical challenge. This requires the development of technology that reflects the needs of actual agricultural fields along with a materials engineering approach. These comprehensive efforts will ultimately contribute to improving agricultural productivity and ensuring the safety of farmers.
This research establishes a methodology for safety assessment in agricultural machinery design, presenting practical safety evaluation techniques that can be utilized in machine development processes. The study contributed to improving the long-term reliability of agricultural machinery by developing a fatigue life prediction model. It is the first comprehensive analysis of the structural stability of machinery that simultaneously performs mulching and soil covering, providing useful data for the future development of similar agricultural equipment. These research findings are expected to enhance machine safety in agriculture and contribute to addressing the shortage of agricultural labor.

2. Materials and Methods
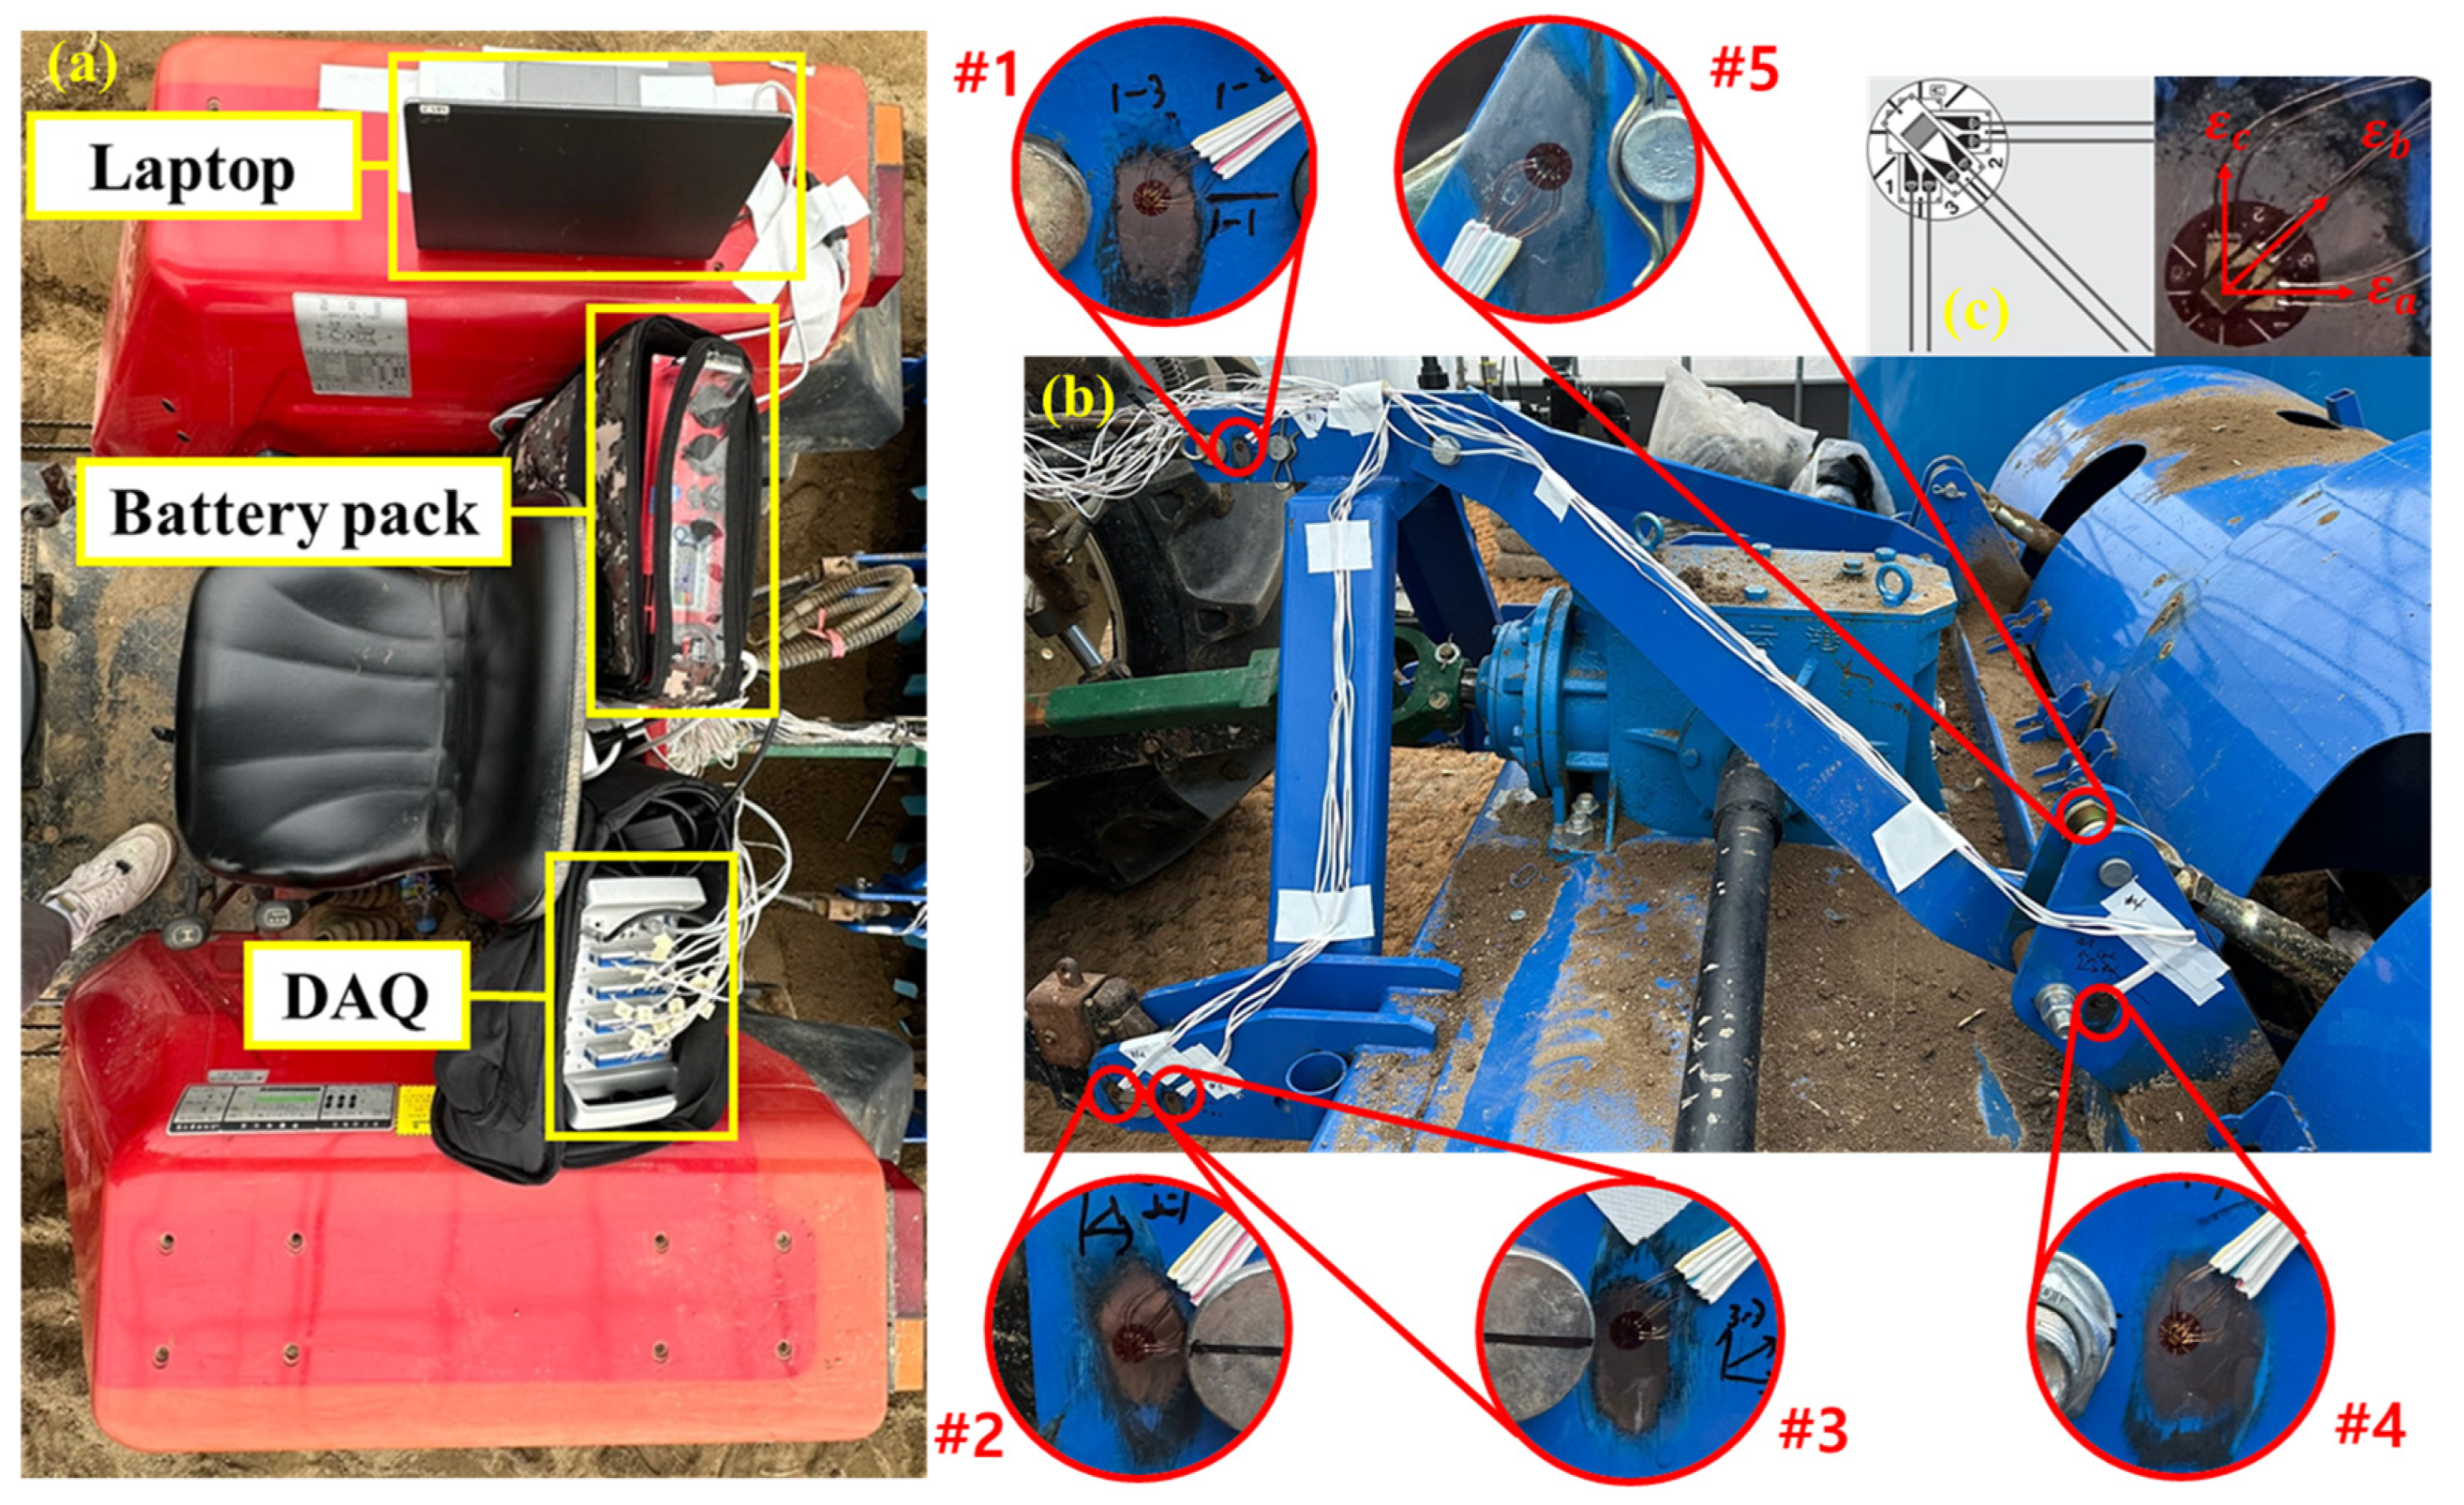
2.1. Test System

The test equipment used in this study consisted of a tractor and a mulching and soil covering machine, as shown in Figure 1a. The specifications of the tractor are presented in Table 1, and the specifications of the mulching and soil covering machine are presented in Table 2.
The test was conducted at a paddy field in Chungbuk National University (36°37′27.78 N, 127°27′19.12 E), as shown in Figure 1b. Analysis of the farm soil characteristics revealed an average electrical conductivity (EC) of 48.03 μs/cm and an average pH of 7.59. The cone index (CI) ranged from 207 to 3208 kPa, while the moisture content varied between 11.1% and 23.4%. The soil composition consisted of 13.4% gravel, 56.5% sand, and 30.1% clay, classifying it as loam according to the USDA soil classification system [30].

2.2. Strain Measurement

In this study, a measurement system, consisting of rosette strain gauges, a data acquisition system (DAQ), a laptop, and a battery pack, was used for strain measurement. The configuration of the measurement system is shown in Figure 2. Data were transmitted to the laptop at a sampling rate of 100 Hz and analyzed using data collection software (Dewesoft 7-Professional, Trbovlje, Slovenia).
Rosette strain gauges can simultaneously measure strain in three directions at a single point on a material, allowing for accurate analysis of multi-axial stress states. This capability is particularly useful for stress analysis in structures with complex stress states and for evaluating the mechanical properties of materials. For example, when a structure is subjected to forces in multiple directions, rosette strain gauges can provide a comprehensive understanding of the overall stress state at a specific point. This information is crucial for assessing structural safety and improving design. The rosette strain gauge (Kyowa, Tokyo, Japan) used in this study is shown in Figure 2c, and its main specifications are presented in Table 3. The attachment points of the rosette strain gauges are shown in Figure 2b. These locations were selected as a joint based on the frequently damaged areas of the machine identified by the manufacturer and the opinions of measurement experts. The rosette strain gauges were used to measure strain ( ε a , ε b , ε c ).
When the mulching and soil covering machine was in operation, it was observed that higher PTO (Power Take-Off) gear settings resulted in more soil being thrown. Consequently, in actual field operations, the lowest PTO gear setting is typically used. However, as this study aimed to assess safety, tests were conducted by measuring loads at PTO gear settings 1 and 2 to evaluate performance under the most demanding conditions. Additionally, the tractor used in this study had two travel gear settings, so tests were also conducted to examine the effects of changing these settings. The tests measured loads under a total of four conditions, combining two travel gear settings and two PTO gear settings. Each condition was tested three times, and the average of these three tests was used for results analysis. This comprehensive approach allowed for a thorough evaluation of the machine’s safety under various operating conditions.

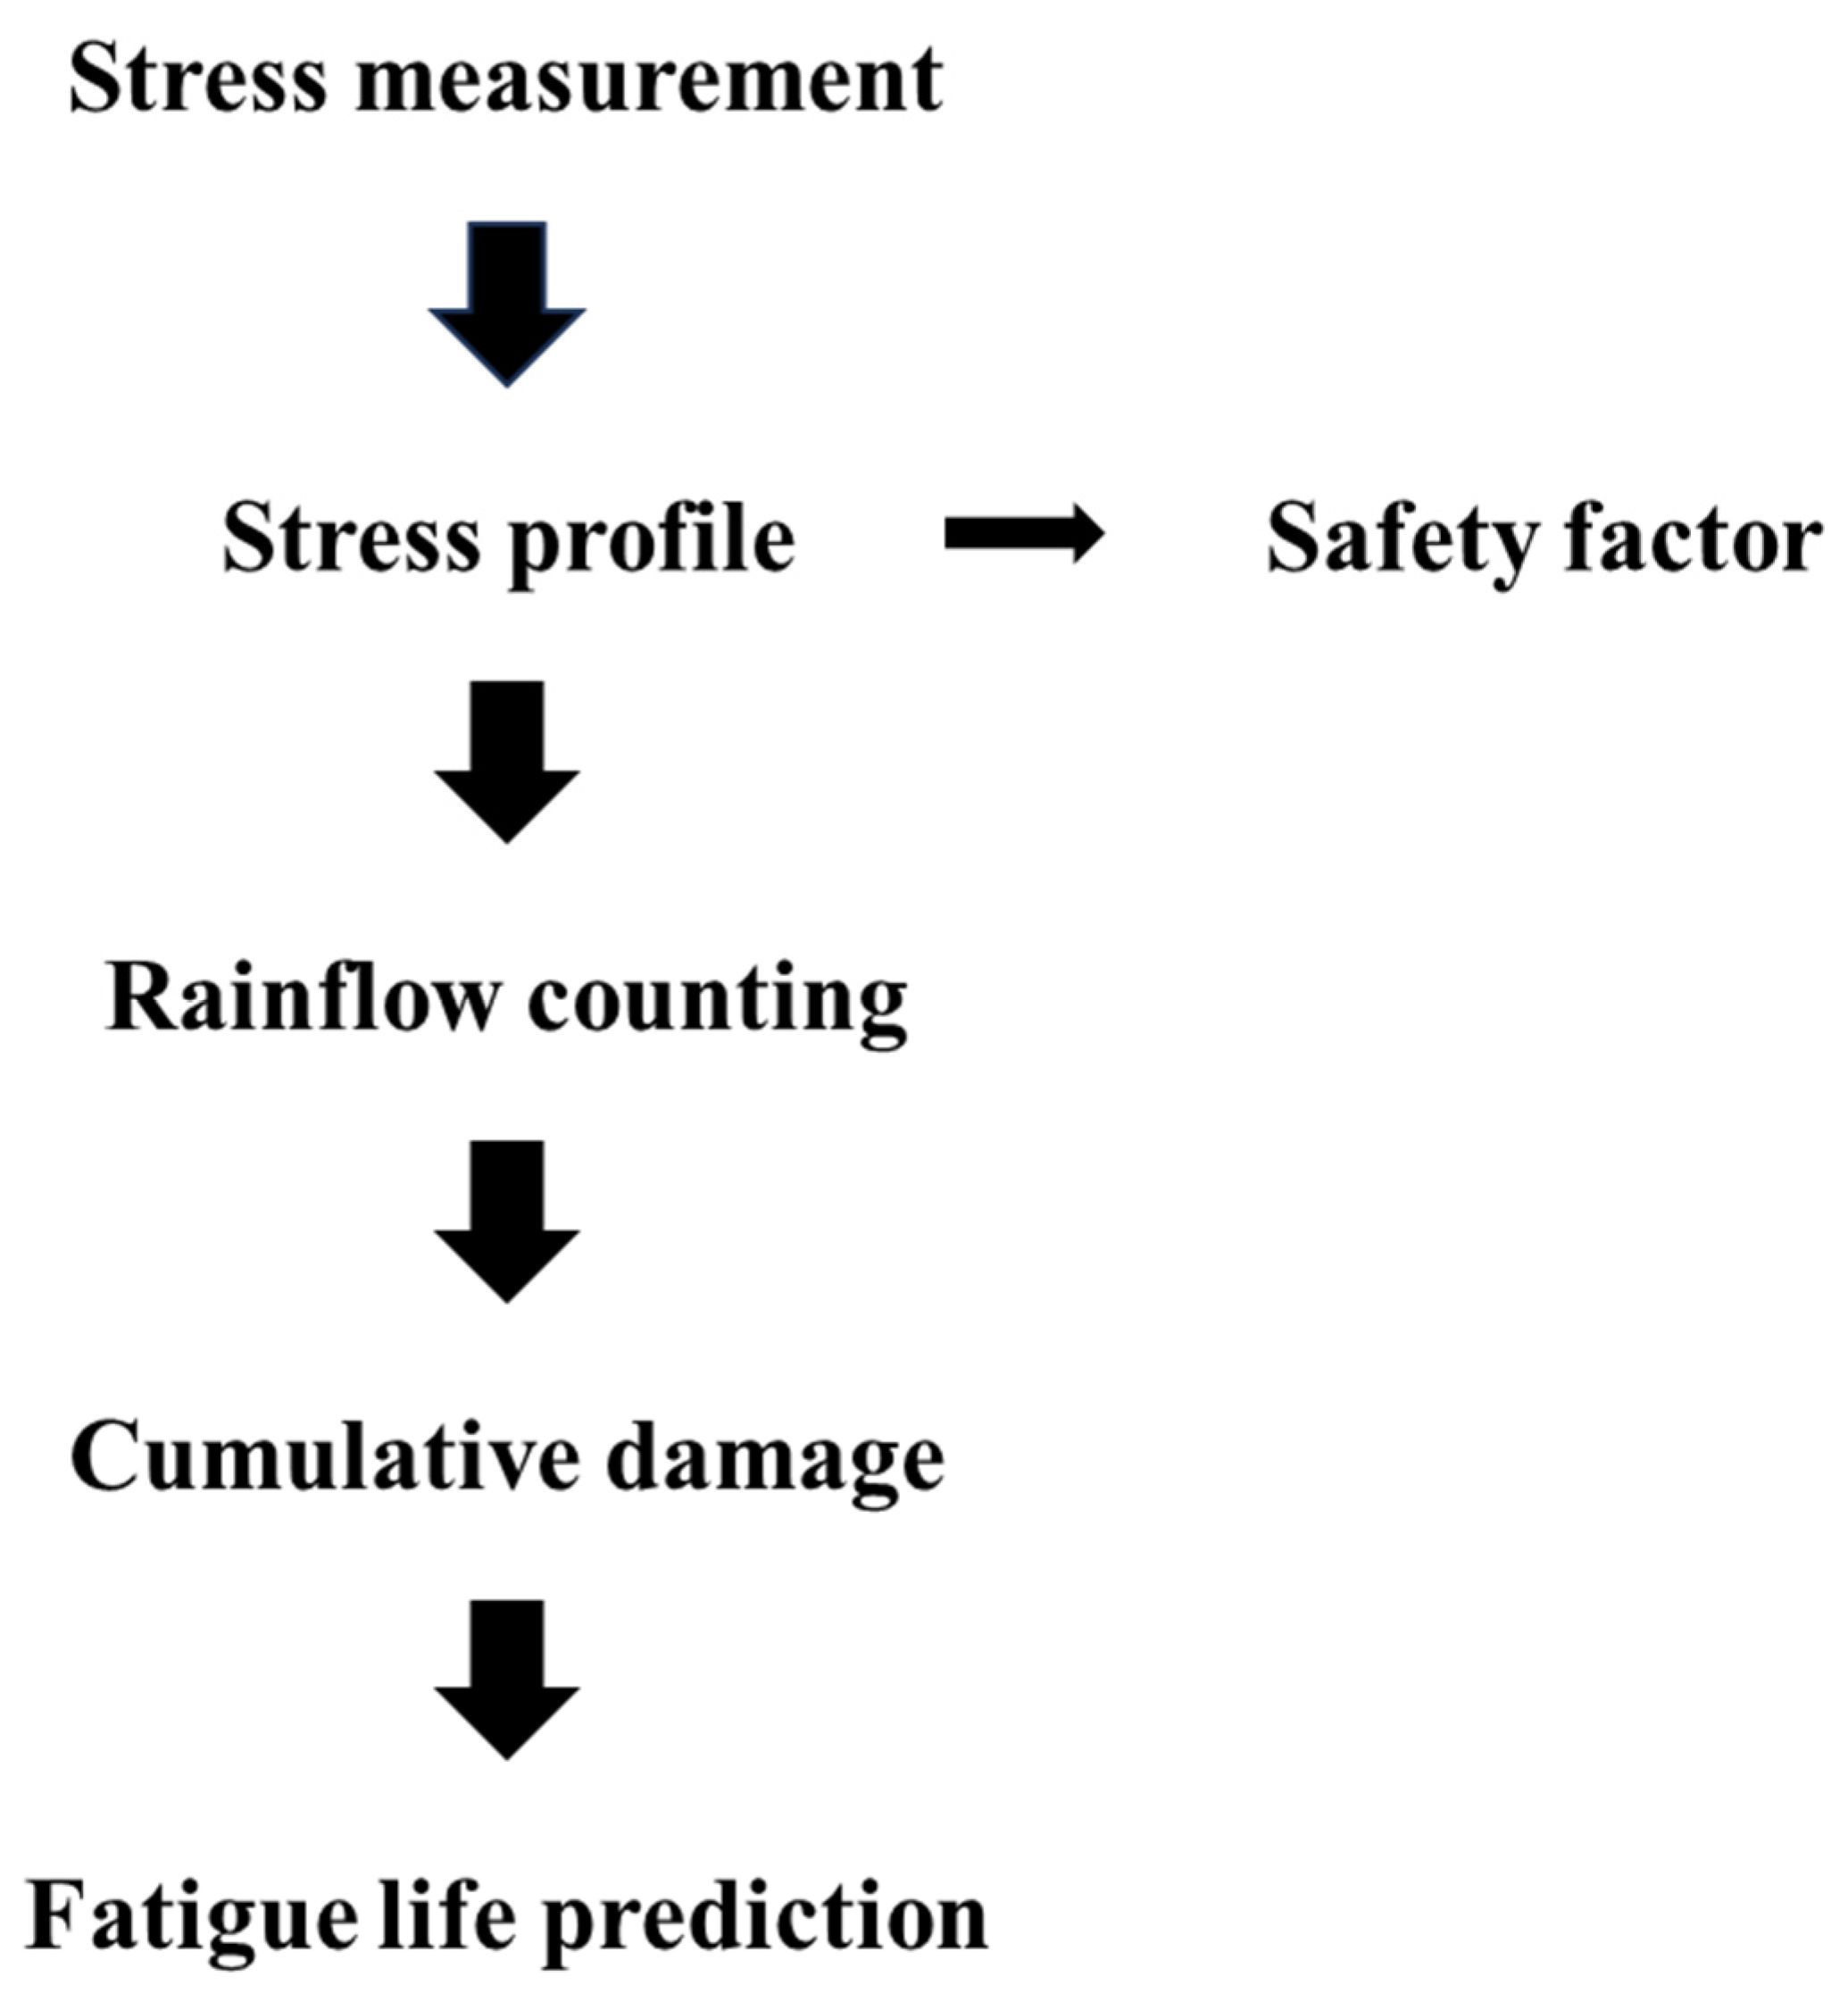
2.3. Safety Analysis

The analysis process is shown in Figure 3. After measuring stress data in the time domain, the cycles are calculated using rainflow counting. Based on these calculated cycles, cumulative damage is analyzed, and fatigue life is predicted.

2.3.1. Converting Strain to Stress

The strain measured by the strain measurement system was converted into maximum principal stress, minimum principal stress, von Mises stress, and maximum shear stress using Equations (1)–(4).
σ m a x = E 2 ( 1 ν 2 ) 1 + ν ε a + ε c + ( 1 ν ) 2 ε a ε b 2 + ε b ε c 2
σ m i n = E 2 ( 1 ν 2 ) 1 + ν ε a + ε c ( 1 ν ) 2 ε a ε b 2 + ε b ε c 2
σ v m = σ m a x 2 σ m a x σ m i n + σ m i n 2
τ m a x = 1 2 σ m a x σ m i n = E 2 ( 1 + ν ) 2 ε a ε b 2 + ε b ε c 2
where σ m a x is the maximum principal stress, σ m i n is the minimum principal stress, σ v m is von Mises stress, τ m a x is maximum shear stress, ν is Poisson’s ratio and E is Young’s modulus.
The material used for the mulching and soil covering machine was stainless steel 400, with mechanical properties as shown in Table 4.

2.3.2. Safety Factor

Since the material used for the mulching and soil covering machine, stainless steel 400, is a ductile material, both the maximum shear stress theory and the strain energy theory can be applied. The maximum shear stress theory states that failure occurs when the maximum shear stress τ m a x in a simple tensile test exceeds half of the material’s yield strength at the point of yield failure. According to the maximum shear stress theory, yield failure occurs when τ m a x S y 2 . The safety factor against yield failure, based on the maximum shear stress theory, is given by Equation (5).
n = S y 2 τ m a x
where S y is yield strength.
The strain energy theory, related to von Mises stress, states that failure occurs when the von Mises stress exceeds the yield strength of the material. According to the strain energy theory, yield failure occurs when σ v m S y . The safety factor against yield failure, based on the strain energy theory, is given by Equation (6).
n = S y σ v m
In this study, safety factors were derived based on both the maximum shear stress theory and the strain energy theory.

2.3.3. Fatigue Life Prediction

When random amplitude loads are applied rather than constant amplitude loads, cycle counting is necessary to output stress amplitude, mean stress, and the corresponding number of cycles. Various cycle counting methods exist, including peak counting, level-crossing counting, and rainflow counting. Among these, rainflow counting is the most commonly used method. Rainflow counting reduces the dimensionality of time series data, thereby decreasing the amount of data and allowing for reconstruction of response amplitudes. However, it has the disadvantage of removing sequential information from the data. Since sequential information is not required for fatigue life prediction, this study employed rainflow counting. Rainflow counting was used to analyze the stress-time history data obtained from the experiment. This method effectively extracts stress cycles from complex loading patterns, which is crucial for accurate fatigue life estimation.
Fatigue life prediction is performed by applying the S-N curve after converting the results obtained from rainflow counting into equivalent fully reversed stress. Although the mean stress in real-world scenarios is not zero, fatigue damage calculations are conducted under equivalent fully reversed stress conditions where the mean stress is zero. The Goodman equation, as shown in Equation (7), was used for the conversion to equivalent fully reversed stress.
σ e q = σ a S u t S u t σ m
where σ e q is equivalent fully reversed stress, σ a is stress amplitude, S u t is ultimate tensile strength and σ m is mean stress.
The fatigue behavior of stainless steel 400, the material of the implement, can be represented by an S-N curve with two main fatigue strength equations at different cycles. Equation (8) describes the fatigue strength at 10 3 cycles ( S f ), which is calculated as 75% of the material’s ultimate tensile strength (UTS). This provides the initial reference point for the S-N curve behavior.
S f = 0.75 U T S
Equation (9) defines the fatigue strength at 10 6 cycles ( S n ), which takes a more comprehensive approach by incorporating multiple influencing factors. It starts with 50% of the ultimate tensile strength and is then modified by five correction factors: the load factor ( C L ), gradient factor ( C G ), surface factor ( C S ), temperature factor ( C T ), and reliability factor ( C R ). Each of these factors accounts for specific operational and environmental conditions that affect the material’s fatigue performance [31].
S n = 0.5 U T S C L C G C S C T C R
Predicting fatigue life is complex due to randomly varying stress cycles. To address this situation, Palmgren [32] and Miner [33] proposed the linear cumulative damage rule. Equation (10) represents the linear cumulative damage rule. Failure occurs when D 1 . Although the linear cumulative damage rule has the limitation of not being able to consider the effect of load sequence on fatigue life, it is simple to apply and remains the most widely used fatigue life prediction theory to date.
D t = i = 1 k n i N i
where D t is total damage, n i is number of cycles to failure and N i is number of applied cycles.

3. Results and Discussion
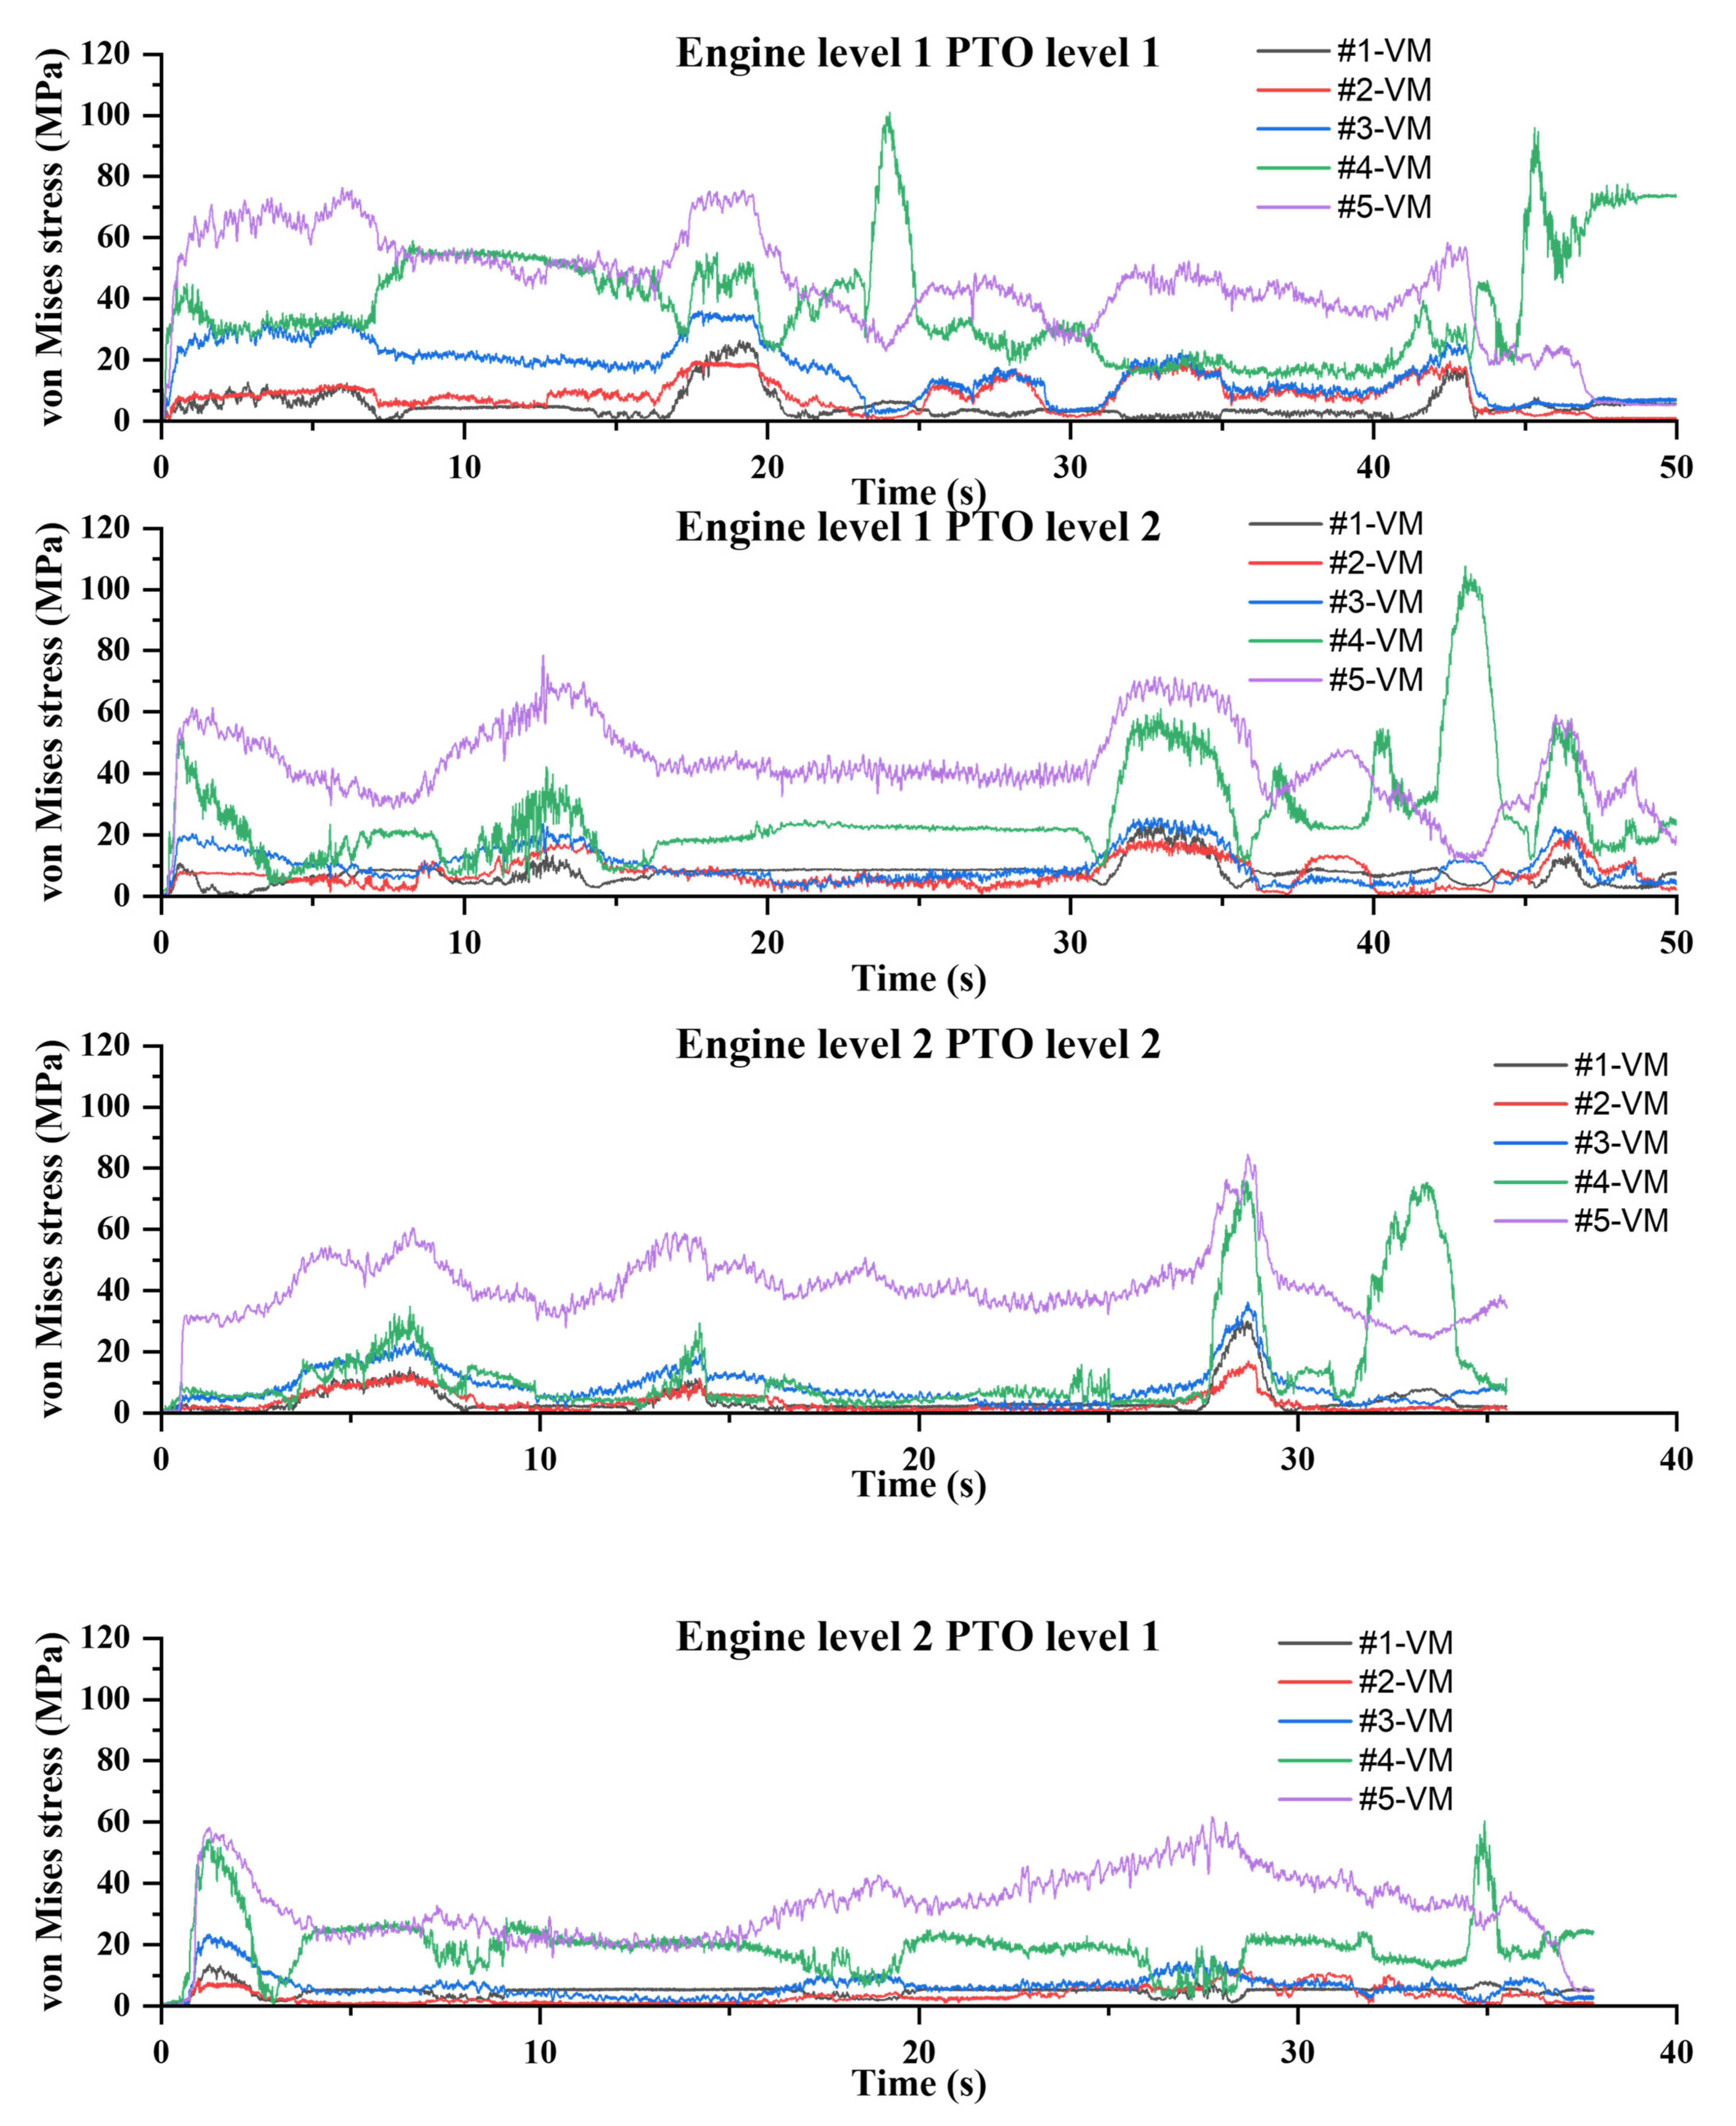
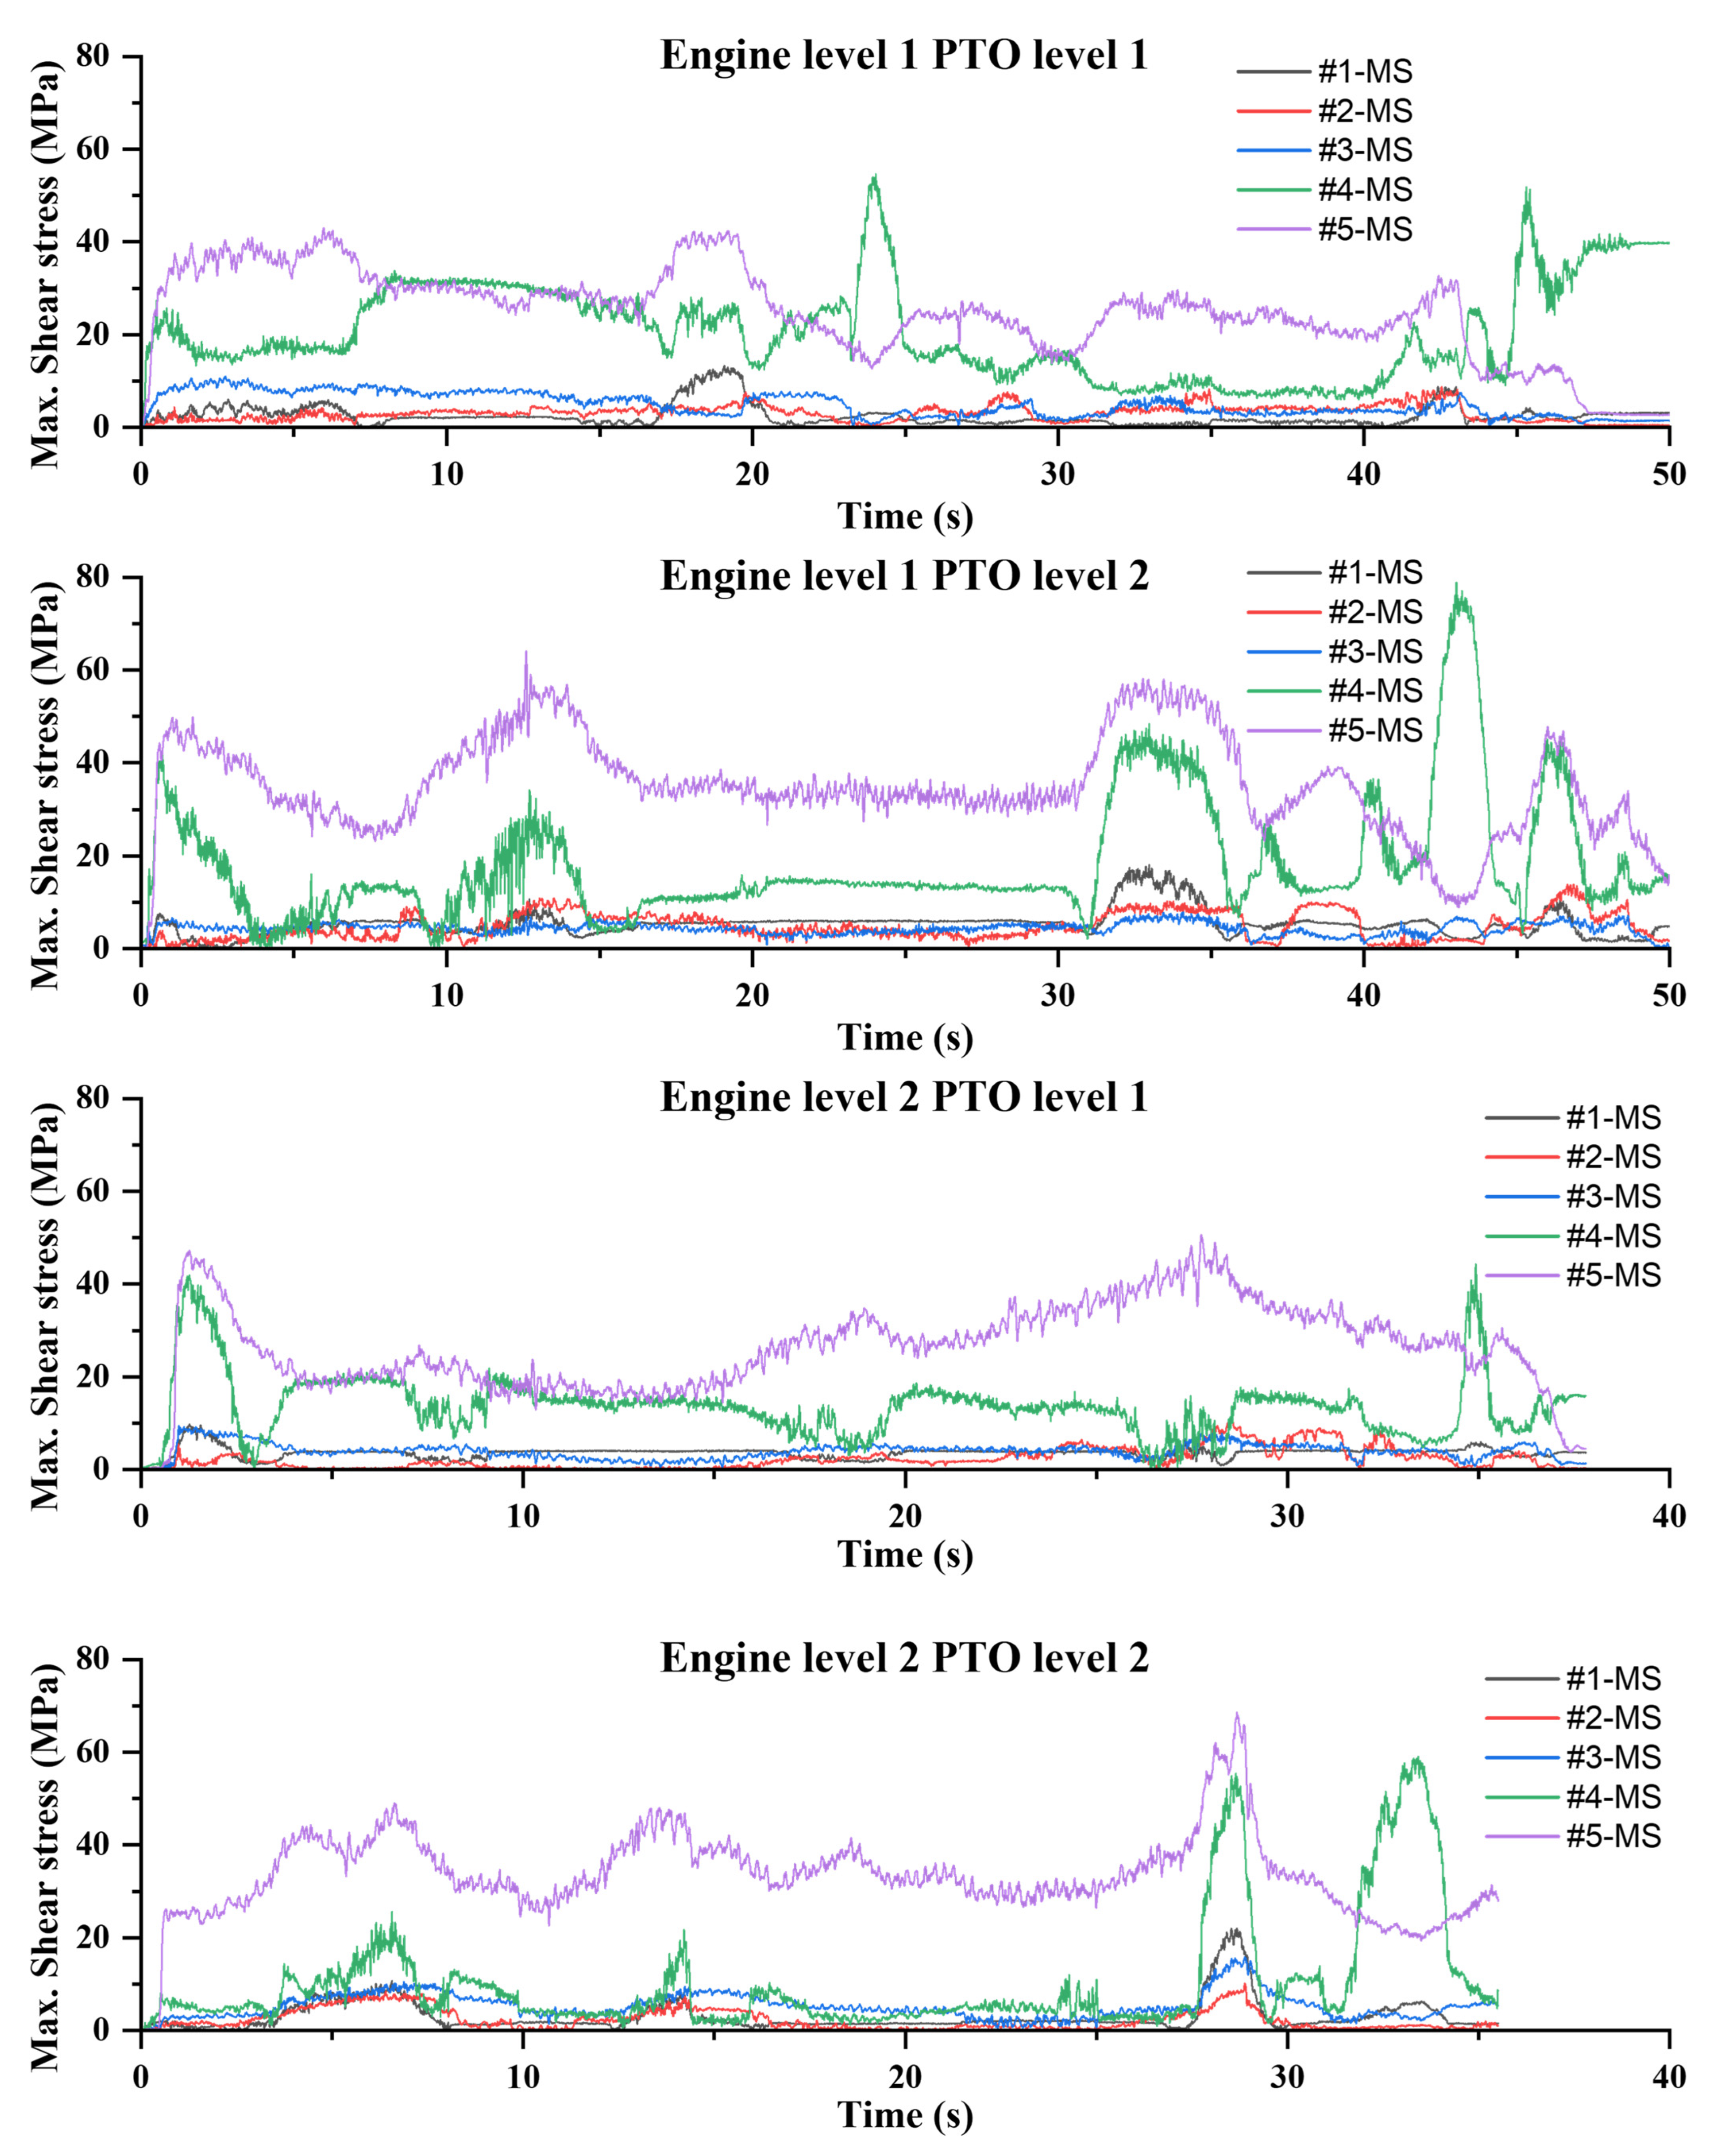
3.1. Stress Profile

Figure 4 and Figure 5 present the von Mises stress and maximum shear stress recorded at each strain gauge attachment point under different operational conditions. The data indicate that stress levels vary significantly based on component location, PTO gear settings, and engine speed. Among the five attachment points, point #5 exhibited the highest average von Mises stress at 43.75 MPa, indicating that this area experiences the most mechanical loading during operation. The highest single stress recorded was at point #4, where the von Mises stress peaked at 107.52 MPa, suggesting that this location is structurally vulnerable and requires close monitoring to prevent fatigue failure. In contrast, points #1, #2, and #3 generally showed low to moderate stress levels, remaining well below the material’s yield strength, which confirms that these sections operate in a relatively safe mechanical range.
The measured stress values varied depending on PTO and engine speed settings, revealing key trends. At lower PTO gear settings, stress levels remained moderate due to reduced torque transmission, which minimized overall mechanical strain on the system. However, at higher PTO gear settings, stress values increased significantly, particularly at attachment points #4 and #5, where soil displacement forces and vibration effects were more pronounced. Additionally, increased engine RPM contributed to higher stress levels, especially when combined with high PTO settings, as greater mechanical loading was induced throughout the system.

3.2. Safety Factor

The yield strength at the strain gauge attachment point is 260 MPa, as shown in Table 4. Table 5 shows the maximum stress that occurred at the attachment point for each condition, and based on this, the safety factors derived according to the maximum shear stress theory and the strain energy theory are also presented. The range of safety factors according to the maximum shear stress theory is from 1.65 to 16.54, while the range according to the strain energy theory is from 2.42 to 19.83. The safety factors derived from the maximum shear stress theory were lower than those from the strain energy theory, confirming that the maximum shear stress theory is a more conservative approach in mechanical design.
Safety factors of 1.25 to 1.5 are used when loads and stresses can be determined with certainty under controllable conditions. Safety factors of 1.5 to 2 are used when loads and stresses can be easily determined under relatively constant environmental conditions. Safety factors of 2 to 2.5 are used when loads and stresses can be determined in general environments. Safety factors of 2.5 to 3 are used for brittle materials under average environmental conditions, loads, and stress conditions. Safety factors of 3 to 4 should be used in uncertain environments or situations where uncertain stresses are applied [34].
In this study, the lowest safety factor for attachment point #4 is 1.65, suggesting that it is recommended to operate under relatively constant environmental conditions. The same applies to attachment point #5. The remaining attachment points (#1, #2, #3) show safety factors significantly higher than the recommended values for their conditions and are thus considered safe. However, excessively high safety factors can lead to issues such as increased costs, increased weight, and reduced efficiency. Therefore, there is a need to redesign the safety factors to more appropriate levels.

3.3. Fatigue Life Prediction

The fatigue strength of stainless steel 400 was calculated using Equations (8) and (9). As shown in Figure 6, the fatigue strength ( S f ) at 10 3 cycles was calculated to be 337.5 MPa, which corresponds to 75% of the UTS. The fatigue strength ( S n ) at 10 6 cycles was determined to be 98.89 MPa, representing 50% of the UTS after considering various influence factors ( C L , C G , C S , C T , C R ). The stress reduction between these two points shows a linear relationship on a logarithmic scale, which well represents the typical fatigue behavior characteristics of stainless steel 400.
The results of cycle counting the von Mises stress profile using the rainflow counting method are shown in Figure 7a. The histogram represents the distribution of stress cycles across various ranges and mean stress levels. The colors indicate the number of cycles, with red representing high cycle counts and blue representing low cycle counts. The highest concentration of cycles appears in the lower left corner of the histogram. This area represents relatively low values for both stress range and mean stress. This indicates that the stress cycles occurring in the machine have low amplitudes and mean stress. Some stress cycles can be observed at larger stress ranges in the histogram. These long-range stress cycles are significant from a fatigue damage accumulation perspective and, as seen in Figure 7b, cause the most damage. The cumulative damage occurring at stress values with high cycle counts is low, potentially resulting in relatively long fatigue life. However, the cumulative damage present in a small number of cycles can have a significant impact on fatigue life and should be carefully considered in the design and analysis process.

4. Conclusions

In this study, the stresses occurring at weak points of a simultaneous mulching and soil covering machine were measured during operation to analyze safety factors and fatigue life. A measurement system based on rosette strain gauges was established, and experiments were conducted by varying the tractor’s engine gear (1st/2nd) and PTO gear (1st/2nd) conditions.
  • When measuring stress at the strain gauge attachment points under various conditions, point #5 showed the highest average von Mises stress at 43.75 MPa. However, the maximum single von Mises stress during operation was observed at point #4, reaching 107.52 MPa. The average stress at points other than #4 and #5 was mostly measured below 10 MPa.
  • The range of safety factors according to the maximum shear stress theory is from 1.65 to 16.54, while the range according to the strain energy theory is from 2.42 to 19.83. As the safety factors derived from the maximum shear stress theory were lower than those from the strain energy theory, it was confirmed that the maximum shear stress theory is a more conservative approach in mechanical design. Attachment points (#1, #2, #3) show safety factors significantly higher than the recommended values for their conditions and are thus considered safe. However, excessively high safety factors can lead to issues such as increased costs, increased weight, and reduced efficiency. Therefore, there is a need to redesign the safety factors to more appropriate levels.
  • Analysis of the rainflow counting histogram and cumulative damage histogram revealed that most stress cycles are distributed in small stress ranges and low mean stresses. Large stress ranges and high mean stresses do not occur in many cycles. However, it was observed that these high-stress cycles, although few in number, cause significant damage.
  • Calculation of predicted fatigue life values showed that the lowest calculated fatigue life was 14,575 h, which translates to approximately 607 years of use if operated all day, every day. Therefore, the developed implement is evaluated as safe in terms of safety factor and fatigue life analysis.
Based on the safety analysis, future research will focus on real-world validation under various soil and terrain conditions. Additionally, reinforcing high-stress attachment points (#4 and #5) will improve durability. Finally, comparative studies with commercial equipment will help optimize design and material selection for practical agricultural applications. These improvements will contribute to enhancing the reliability and efficiency of agricultural machinery.

Author Contributions

Conceptualization, C.-S.S.; methodology, C.-S.S.; software, I.-S.H.; validation, I.-S.H., W.-T.I. and S.-M.J.; formal analysis, I.-S.H.; investigation, I.-S.H., S.-M.J. and C.-S.S.; resources, C.-S.S. and S.-M.J.; data curation, I.-S.H.; writing—original draft preparation, I.-S.H.; writing—review and editing, I.-S.H., W.-T.I. and C.-S.S.; visualization, I.-S.H.; supervision, C.-S.S.; project administration, C.-S.S.; funding acquisition, C.-S.S. All authors have read and agreed to the published version of the manuscript.

Funding

This work was supported by the Korea Institute of Planning and Evaluation for Technology in Food, Agriculture, Forestry (IPET) through the Eco-friendly Power Source Application Agricultural Machinery Technology Development Program, funded by the Ministry of Agriculture, Food and Rural Affairs (MAFRA) (RS-2022-IP322044). This work was supported by Chungbuk National University National University Development Project (NUDP) program (2024).

Data Availability Statement

Data are contained within the article.

Conflicts of Interest

Author Sung-Min Ji was employed by the company Daesung Agricultural Machinery Co., Ltd. The remaining authors declare that the research was conducted in the absence of any commercial or financial relationships that could be construed as a potential conflict of interest.

References

  1. Zou, B.; Mishra, A.K.; Luo, B. Aging population, farm succession, and farmland usage: Evidence from rural China. Land Use Policy 2018, 77, 437–445. [Google Scholar] [CrossRef]
  2. Liu, J.; Fang, Y.; Wang, G.; Liu, B.; Wang, R. The aging of farmers and its challenges for labor-intensive agriculture in China: A perspective on farmland transfer plans for farmers’ retirement. J. Rural. Stud. 2023, 100, 103013. [Google Scholar] [CrossRef]
  3. Salzwedel, M. Labor Shortage Poses Safety Challenges for Growing Agritourism Industry. J. Agromed. 2023, 28, 53–56. [Google Scholar] [CrossRef] [PubMed]
  4. Lee, R.; Mason, A. Fertility, Human Capital, and Economic Growth over the Demographic Transition. Eur. J. Popul./Rev. Eur. De Demogr. 2009, 26, 159–182. [Google Scholar] [CrossRef] [PubMed]
  5. Lee, D.; Yoo, H.-j.; Shin, M.; Oh, J.; Shim, S.-B. Analysis of Overturning Stability of Small off-Road Vehicle. J. Biosyst. Eng. 2023, 48, 309–318. [Google Scholar] [CrossRef]
  6. Benos, L.; Bechar, A.; Bochtis, D. Safety and ergonomics in human-robot interactive agricultural operations. Biosyst. Eng. 2020, 200, 55–72. [Google Scholar] [CrossRef]
  7. Kumar, G.V.P.; Dewangan, K.N. Agricultural accidents in north eastern region of India. Saf. Sci. 2009, 47, 199–205. [Google Scholar] [CrossRef]
  8. Rondelli, V.; Casazza, C.; Martelli, R. Tractor rollover fatalities, analyzing accident scenario. J. Saf. Res. 2018, 67, 99–106. [Google Scholar] [CrossRef]
  9. Rautiainen, R.H.; Reynolds, S.J. Mortality and Morbidity in Agriculture in the United States. J. Agric. Saf. Health 2002, 8, 259–276. [Google Scholar] [CrossRef]
  10. Christensen, S.; Søgaard, H.T.; Kudsk, P.; Nørremark, M.; Lund, I.; Nadimi, E.S.; Jørgensen, R. Site-specific weed control technologies. Weed Res. 2009, 49, 233–241. [Google Scholar] [CrossRef]
  11. Namdeo, R.; Shrivastava, A.K.; Kumar, A.; Nandini, Y. Optimization of the performance parameters of the L-shaped rotary blade for the development of a plastic mulching machine. Pharma Innov. J. 2022, 11, 5944–5953. [Google Scholar]
  12. Balli, S.R.; Shetty, P.; Sajjan, S. Design and Development of Tractor Operated Plastic Mulch Laying Machine. J. Mech. Robot. 2020, 5, 16–19. [Google Scholar] [CrossRef]
  13. Khazimov, Z.M.; Bora, G.C.; Khazimov, K.M.; Khazimov, M.Z.; Ultanova, I.B.; Niyazbayev, A.K. Development of a dual action planting and mulching machine for vegetable seedlings. Eng. Agric. Environ. Food 2018, 11, 74–78. [Google Scholar] [CrossRef]
  14. Parmar, B.S.; Shrivastava, A.K.; Singh, S.K.; Patel, A.; Gajendra, S. Economic Analysis of Low-Cost Tractor Drawn Plastic Mulching Machine. Int. J. Environ. Clim. Change 2023, 13, 2401–2408. [Google Scholar] [CrossRef]
  15. Collins, J.A. Failure of Materials in Mechanical Design: Analysis, Prediction, Prevention; John Wiley & Sons: New York, NY, USA, 1993. [Google Scholar]
  16. Yu, T.; Xue, P. Chapter 4—Yield criteria. In Introduction to Engineering Plasticity; Yu, T., Xue, P., Eds.; Elsevier: Amsterdam, The Netherlands, 2022; pp. 67–87. [Google Scholar] [CrossRef]
  17. Mises, R.v. Mechanik der festen Körper im plastisch-deformablen Zustand. Nachrichten Von Der Ges. Der Wiss. Zu Göttingen Math.-Phys. Kl. 1913, 1913, 582–592. Available online: http://eudml.org/doc/58894/ (accessed on 20 February 2001).
  18. Menacho-Mendoza, E.; Cedamanos-Cuenca, R.; Díaz-Suyo, A. Stress analysis and factor of safety in three dental implant systems by finite element analysis. Saudi Dent. J. 2022, 34, 579–584. [Google Scholar] [CrossRef]
  19. Henriques, B.; Carvalho, M.; Tavares, S.; de Castro, P. A comparison of safety factor values for Soderberg and DIN 743 fatigue analyses. U. Porto J. Eng. 2021, 7, 11–21. [Google Scholar] [CrossRef]
  20. Matvienko, Y.G. The simplified approach for estimating probabilistic safety factors in fracture mechanics. Eng. Fail. Anal. 2020, 117, 104814. [Google Scholar] [CrossRef]
  21. Al-Oqla, F.M.; Hayajneh, M.T. Stress failure interface of cellulosic composite beam for more reliable industrial design. Int. J. Interact. Des. Manuf. (IJIDeM) 2022, 16, 1727–1738. [Google Scholar] [CrossRef]
  22. Xi, L.; Songlin, Z. Changes in mechanical properties of vehicle components after strengthening under low-amplitude loads below the fatigue limit. Fatigue Fract. Eng. Mater. Struct. 2009, 32, 847–855. [Google Scholar] [CrossRef]
  23. Wöllner, U.; Szlosarek, R.; Kröger, M. Fatigue behavior of agricultural rims under rotating bending load. Fatigue Fract. Eng. Mater. Struct. 2022, 45, 2143–2158. [Google Scholar] [CrossRef]
  24. Barna, R.A.; Popovych, P.V. Influence of Operating Media on the Fatigue Fracture of Steels for Elements of Agricultural Machines. Mater. Sci. 2014, 50, 377–380. [Google Scholar] [CrossRef]
  25. Chen, Z.; Long, K.; Zhang, C.; Yang, X.; Lu, F.; Wang, R.; Zhu, B.; Zhang, X. A fatigue-resistance topology optimization formulation for continua subject to general loads using rainflow counting. Struct. Multidiscip. Optim. 2023, 66, 210. [Google Scholar] [CrossRef]
  26. Wu, S.-D.; Shang, D.-G.; Liu, P.-C.; Hao, G.-C.; Hou, G.; Shi, F.-T.; Miao, B. Fatigue life prediction based on modified narrowband method under broadband random vibration loading. Int. J. Fatigue 2022, 159, 106832. [Google Scholar] [CrossRef]
  27. Abdullah, L.; Singh, S.S.K.; Abdullah, S.; Azman, A.H.; Ariffin, A.K. Fatigue reliability and hazard assessment of road load strain data for determining the fatigue life characteristics. Eng. Fail. Anal. 2021, 123, 105314. [Google Scholar] [CrossRef]
  28. Li, H.-W.-X.; Chelidze, D. Fatigue life estimation of structures under statistically and spectrally similar variable amplitude loading. Mech. Syst. Signal Process. 2021, 161, 107856. [Google Scholar] [CrossRef]
  29. Loew, S.; Obradovic, D.; Bottasso, C.L. Model predictive control of wind turbine fatigue via online rainflow-counting on stress history and prediction. J. Phys. Conf. Ser. 2020, 1618, 022041. [Google Scholar] [CrossRef]
  30. Eun-Jin, C.; Jin-Kyeong, L.; Min-Ho, J.; Min, A.C.; Jae-Hyun, K.; Seung-Je, H.; Jin-Hee, P.; Chang-Seop, S. Soil Characterization of the Field where Rice has been Cultivated during Five Years. J. Korean Soc. Manuf. Process Eng. 2021, 20, 8–13. [Google Scholar] [CrossRef]
  31. Juvinall, R.C.; Marshek, K.M. Fundamentals of Machine Component Design; John Wiley & Sons: Hoboken, NJ, USA, 2020. [Google Scholar]
  32. Palmgren, A. Die Lev/bensdauer von kugellagern. VDI. Z. 1924, 68, 339–341. [Google Scholar]
  33. Miner, M.A. Cumulative Damage in Fatigue. J. Appl. Mech. 2021, 12, A159–A164. [Google Scholar] [CrossRef]
  34. Vidosic, J. Machine Design Projects; Ronald Press: New York, NY, USA, 1957. [Google Scholar]
Figure 1. Test system: (a) test equipment; (b) test field.
Agriculture 15 00632 g001
Figure 2. Strain measurement system: (a) measurement system; (b) strain gauge attachment points (weak points); (c) strain measurement direction of the strain gauge.
Agriculture 15 00632 g002
Figure 3. Flow chart for safety analysis.
Agriculture 15 00632 g003
Figure 4. von Mises stress at the attachment points under each condition.
Agriculture 15 00632 g004
Figure 5. Maximum shear stress at the attachment points under each condition.
Agriculture 15 00632 g005
Figure 6. S-N curve for stainless steel 400.
Agriculture 15 00632 g006
Figure 7. Results of the fatigue life prediction: (a) rainflow counting; (b) cumulative damage.
Agriculture 15 00632 g007
Table 1. Tractor specifications.
ItemsSpecifications
ModelLT470D
Size (L × W × H) (mm)3655 × 1655 × 2328
Weight (kg)2395
EngineWater cooled, 4 Cycle, Diesel
Engine displacement2505
Power (ps/rpm)45/2600
Driving system4WD
Table 2. Mulching and soil covering machine specifications.
ItemsSpecifications
ModelMulching and soil covering implement
Size (L × W × H) (mm)2240 × 2120 × 1140
Weight (kg)796
Mulching (line)2
Soil covering (line)2
Table 3. Specifications of the rosette strain gauge.
ItemsSpecifications
ModelKFGS-1-350-D17-11
Manufacturer/NationKYOWA/Japan
Gage factor2.11 ± 1.0%
Gage length (mm)1
Gage resistance (Ω)350.0 ± 0.75
Table 4. Mechanical properties of stainless steel 400.
MaterialMechanical PropertiesValue
Stainless steel 400Young’s modulus (GPa)206
Poisson’s ratio0.3
Density   ( k g / m 3 )7800
Ultimate tensile strength (MPa)450
Yield strength (MPa)260
Table 5. Safety factors according to test conditions.
PointEngine
Level
PTO
Level
Maximum Shear
Stress (MPa)
Von Mises Stress (MPa)Safety Factor Based on Maximum Shear StressSafety Factor Based on von Mises Stress
#11113.3026.469.779.83
218.0824.367.1910.67
219.7613.6313.3219.08
222.0330.015.908.66
#2118.7119.6014.9313.27
213.8921.109.3612.32
2110.7413.1112.1019.83
210.1517.0712.8115.23
#31111.0236.0411.807.21
27.8625.6716.5410.13
219.4123.4313.8211.10
215.8636.198.207.18
#41154.60101.002.382.57
278.81107.521.652.42
2144.3160.272.934.31
259.0575.912.203.43
#51142.9776.393.033.40
264.1178.502.033.31
2150.5661.792.574.21
268.5884.491.903.08
Disclaimer/Publisher’s Note: The statements, opinions and data contained in all publications are solely those of the individual author(s) and contributor(s) and not of MDPI and/or the editor(s). MDPI and/or the editor(s) disclaim responsibility for any injury to people or property resulting from any ideas, methods, instructions or products referred to in the content.

