1. Introduction
In the European Union, the agrifood industry represents 15.9% of the total turnover of the manufacturing industry, with a value of more than EUR 1.2 trillion and EUR 250 billion in value added [
1]. The implementation of photovoltaic (PV) systems in agro-industries should be a key factor in reducing dependence on fossil fuels and contributing to achieving climate change targets. The viability of photovoltaic energy has been studied in many types of agro-industries, like wineries [
2], the dairy industry [
3], and olive mills [
4].
Load matching is a crucial challenge that limits the development of PV systems in buildings [
5]. The optimization of PV systems based on consumption patterns has been analyzed in various contexts, such as the industrial sector, residential buildings, and commercial buildings, among others [
6,
7,
8]. Within the agro-industrial sector, the lack of uniformity in demand across many subsectors makes the optimization of PV systems more complex. In industries with high seasonality, PV installations have a restricted ability to generate savings, even when energy prices rise sharply. Similarly, industries with a stable consumption pattern throughout the year but is characterized by significant peaks and drops during weekends also experience limited savings potential from PV systems [
9].
The optimization of the tilt angle and azimuth of solar panels is a critical aspect in determining the feasibility and profitability of PV systems. A common design criterion is to maximize energy generation throughout the year [
10,
11,
12]. However, a suboptimal tilt angle and azimuth can still result in acceptable levels of electricity production [
13]. The strong seasonality of many agro-industries significantly influences the design of PV systems, as observed in wineries [
14] and olive mills [
15]. Therefore, studies conducted in this sector should optimize the tilt angle based on the specific consumption pattern of each agro-industrial application.
Another crucial factor in the sizing and economic viability of PV systems is energy pricing. When energy prices are high, the installed peak power must increase significantly to minimize overall energy costs. In this scenario, investment profitability tends to be highly attractive, with shorter payback periods [
9]. Moreover, elevated energy prices have led to a substantial shift in the viability of inclined PV mounting structures compared to coplanar installations [
16].
Until the first half of 2021, the average electricity price for typical tariffs in agro-industries generally did not exceed 0.10 EUR/kWh in Spain. However, following the tariff changes implemented in June 2021, there was a significant surge in energy prices [
17]. By March 2022, during the peak of the Ukraine war crisis, prices reached nearly 0.30 EUR/kWh. The energy prices remained above 0.25 EUR/kWh until mid-2023, eventually decreasing to 0.20 EUR/kWh by the end of that year. This strong upward pressure prompted a significant number of agro-industries to invest heavily in photovoltaic self-consumption installations, drawn by short payback periods and substantial savings on annual energy bills [
18]. However, in 2024, electricity prices experienced a rapid decline, with offers from energy suppliers resembling those seen at the beginning of 2021.
If this new pricing context persists in the future, many of the investments made over the past two years may face reduced profitability [
19], as the economic return of photovoltaic (PV) systems is highly sensitive to electricity price variations. The value of the electricity generated by a PV system can fluctuate significantly across different seasons and years, even when production remains constant. These fluctuations introduce uncertainty, making it difficult to accurately predict long-term financial returns.
Sharp variations in electricity prices can lead to unforeseen scenarios that challenge the initial profitability estimates of PV investments. When prices drop, the financial benefits of self-consumption diminish, extending payback periods and reducing the incentive for new installations. Conversely, when prices rise, the revenue potential of PV systems increases, improving their economic feasibility.
Previously, projections suggested that the average electricity prices in the current decade will be higher than in the previous one, with potential increases in PV revenues of up to 60% by 2030 compared to their 2015–2020 levels. However, the current downward trend in electricity prices contradicts these forecasts, undermining the expected long-term profitability of PV investments. This shift highlights the risks of relying on past energy price projections and underscores the need for flexible system sizing and adaptive investment strategies to mitigate financial uncertainty in the evolving energy market [
20,
21,
22]. Furthermore, the optimal peak capacity for new installations is impacted by this uncertainty in energy prices.
Additionally, the peer effects observed in the digital value chain also influence the photovoltaic (PV) sector, where regional collaboration, policy incentives, and technological diffusion drive adoption and profitability. Just as digitalization advances through mutual learning, PV adoption benefits from shared best practices, regulatory support, and investment incentives. Government policies play a crucial role in both sectors, shaping market growth and industry positioning. Understanding these peer-driven dynamics is essential for optimizing PV system profitability and accelerating the renewable energy transition [
23]. Other methods to consider for the future include dynamic pricing algorithms, AI-driven demand forecasting, and blockchain for supply chain transparency. Optimizing pricing and promotions in declining markets is crucial for sustainability and profitability, especially in green industries like photovoltaics. Green inventory models help maximize profits by balancing costs, preservation technology investments, and sustainability efforts. In photovoltaics, strategic pricing, promotions, and green investments drive market adoption and profitability. Demand is influenced by eco-value perception, government incentives, and production costs, making it essential to integrate financial and environmental strategies for long-term success [
24].
Therefore, the main objective of this study was to quantify the impact of declining energy prices on the profitability, energy savings, and optimal sizing of photovoltaic systems in agro-industries with varying degrees of seasonality. A broad range of scenarios was considered, including different locations, panel tilts, installed peak power, and other relevant factors.
2. Materials and Methods
The profitability of the photovoltaic system was analyzed across more than half a million scenarios by combining six energy prices (0.05 EUR/kWh to 0.30 EUR/kWh), two consumption patterns (uniform and seasonal), three locations (Lleida, Huelva, and Lugo), 70 panel tilt angles (ranging from 10° to 80°), and 200 scenarios with different installed peak power values.
The three locations were specifically chosen for their distinct geographical and agricultural characteristics. They are situated in three widely separated points of the Iberian Peninsula, with Lleida in the northeast, Lugo in the northwest, and Huelva in the southwest, providing a comprehensive spatial representation. The incident radiation data for the different capture planes were obtained through simulations using EnergyPlus, following the methodology of previous studies [
9,
14]. For this purpose, data from the following EnergyPlus climatological files were used: ESP_Huelva.083830_SWEC.epw, ESP_Lerida.081710_SWEC.epw and ESP_Lugo.080080_SWEC.epw.
Moreover, all three locations are renowned for their designations of origin for wine, making them significant players in the agro-industrial sector. In terms of fruit and vegetable production, the regions also showcase unique specialties: Lleida is well-known for its sweet fruits and asparagus; Lugo for its apples, chestnuts, and various vegetables; and Huelva for its strawberries and red berries. These distinctions make them representative of diverse agro-industrial activities across Spain.
Another key factor influencing the selection was the variation in their peak sun hours, a critical variable for photovoltaic performance. Lleida has 5.3 peak sun hours, Lugo has 4, and Huelva boasts 5.8, reflecting a broad range of solar resource availability. This diversity in solar conditions allows for a robust analysis of photovoltaic profitability across different climatic and agricultural contexts.
Two agro-industries were selected, both with an annual demand of approximately 115 MWh but with very different consumption patterns. Specifically, the first case considers a fruit and vegetable processing plant with a relatively uniform consumption pattern throughout the year, characterized by stable daily energy demand and maximum power. The second case examines a winery with a highly seasonal consumption pattern, experiencing significant peaks in energy demand and high-power requirements in September and October (
Figure 1).
The methodology used has been validated in previous studies by the authors’ team [
9]. The calculations were performed with software developed in VBA (Visual Basic for Applications), which replicates the quarter-hourly billing structure of electricity companies under a 6.1 TD tariff. The 6.1 TD tariff is a regulated electricity tariff in Spain designed for consumers with contracted power above 15 kW, typically industrial, commercial, and large-scale facilities. For simplicity, the same average kWh price was assumed across the six periods. The 2024 values for power term charges, excess power penalties, and taxes were used.
The tool includes a solar calculation module that estimates grid energy consumption by comparing energy demand with PV system generation. The energy supplied by the PV system in each interval is calculated based on the system’s peak power, solar panel irradiation, and a fixed global efficiency of 0.8 across all cases for consistency.
For each scenario, the energy generated by the PV system (
) during a 15 min interval was determined using Equation (1):
where
is the installed peak power of the system;
is the duration of the interval;
is the radiation on the inclined plane;
is the overall efficiency of the system (0.8).
At each interval, the PV electricity generation is compared to industrial demand to determine
: Savings from PV energy generation;
: Grid energy required when PV supply is insufficient;
: Surplus PV energy, which may generate revenue if regulations allow.
The balance was calculated using Equations (2) and (3):
In addition, in each 15 min interval, the new power demanded from the grid (
, kW) was calculated as the difference between the power demanded by the industry
and the effective power of the PV system
(Equation (4)). According to this, any possible penalty applicable for excess power was calculated in a precise and realistic way.
After computing the electricity balances for each 15 min interval throughout the year, the total energy supplied by the PV system (reducing grid consumption), the energy drawn from the grid due to PV limitations, and the surplus energy fed into the grid (when generation exceeds demand) were aggregated for each tariff period. This approach replicates the methodology employed by electricity providers.
Based on the results of the energy analysis, a profitability analysis was conducted, assuming a system lifespan of 20 years, an investment cost of 1000 EUR/kWp, a discount rate of 3%, and an annual maintenance cost of 1% of the investment. Among all the tilt angle scenarios, the results refer to the optimal case tailored to the consumption pattern and location, i.e., the tilt angle that maximizes total savings.
3. Results
3.1. Energy Cost Savings
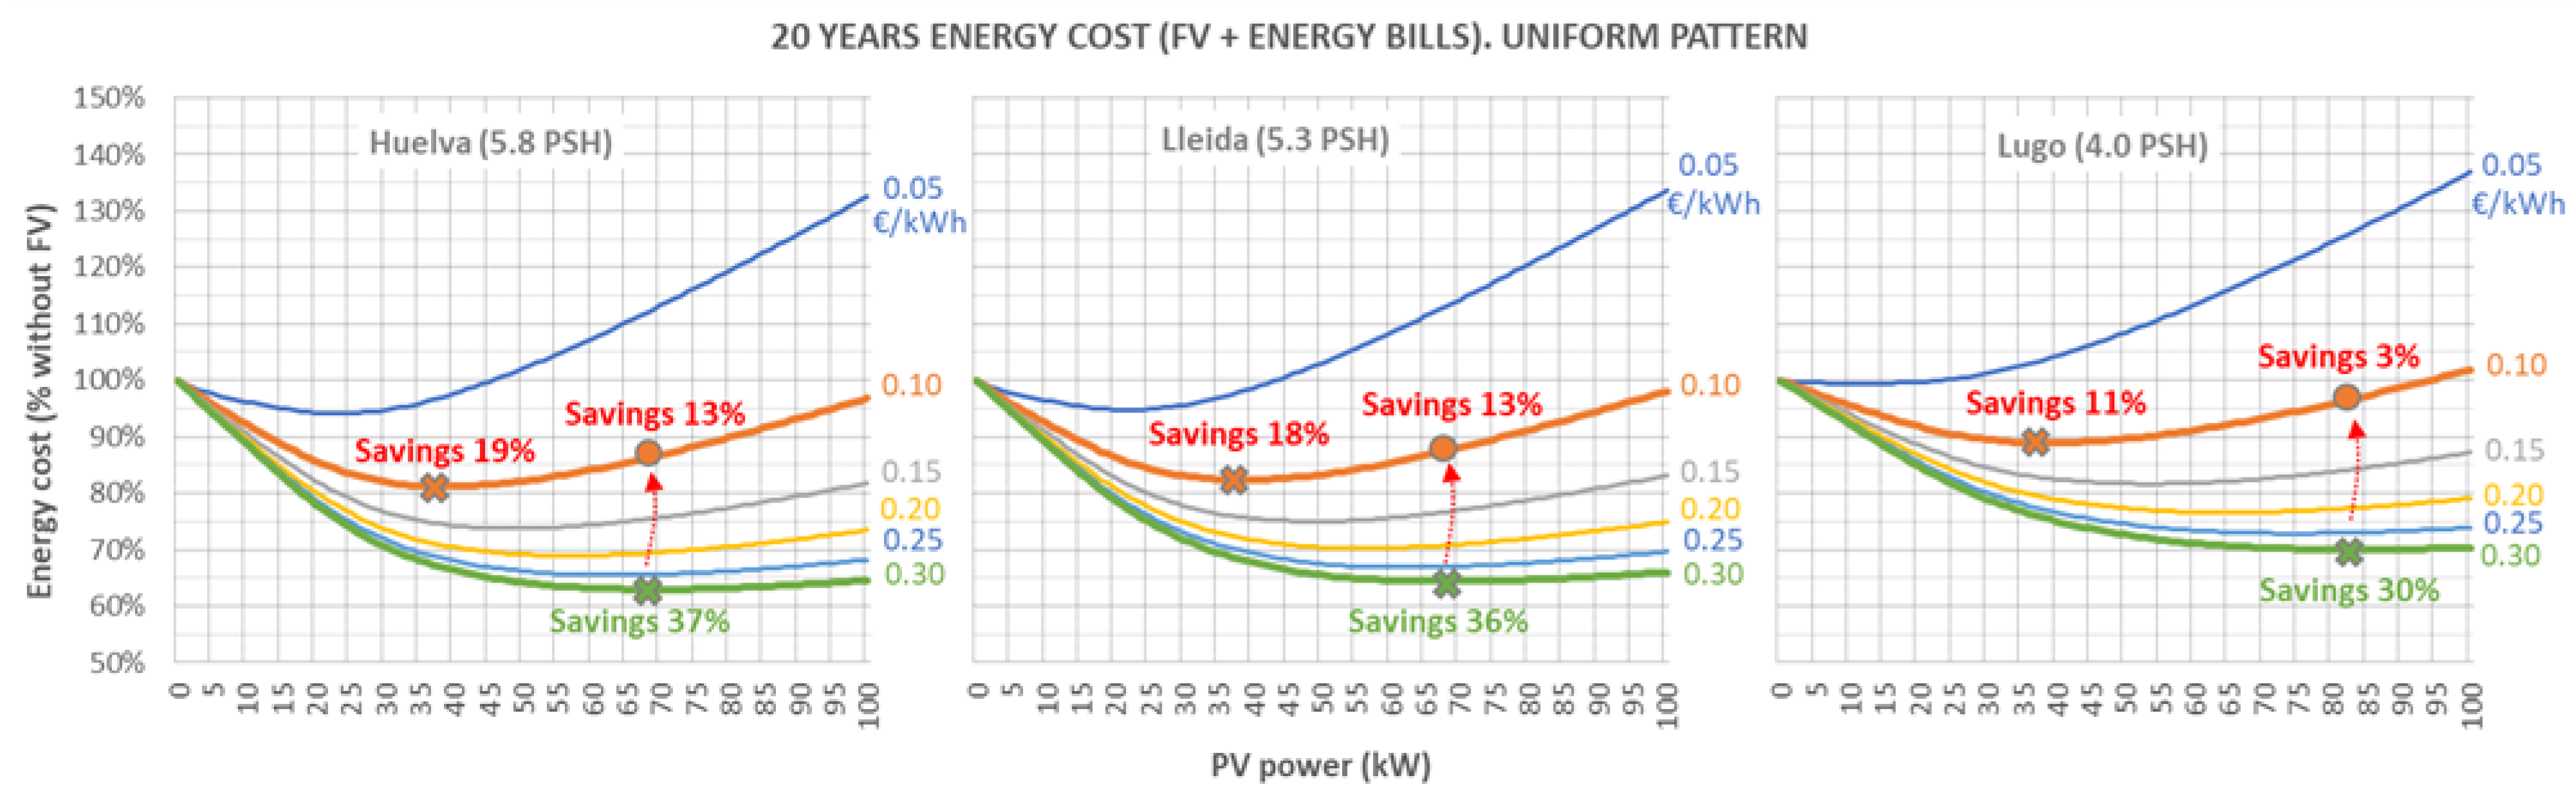
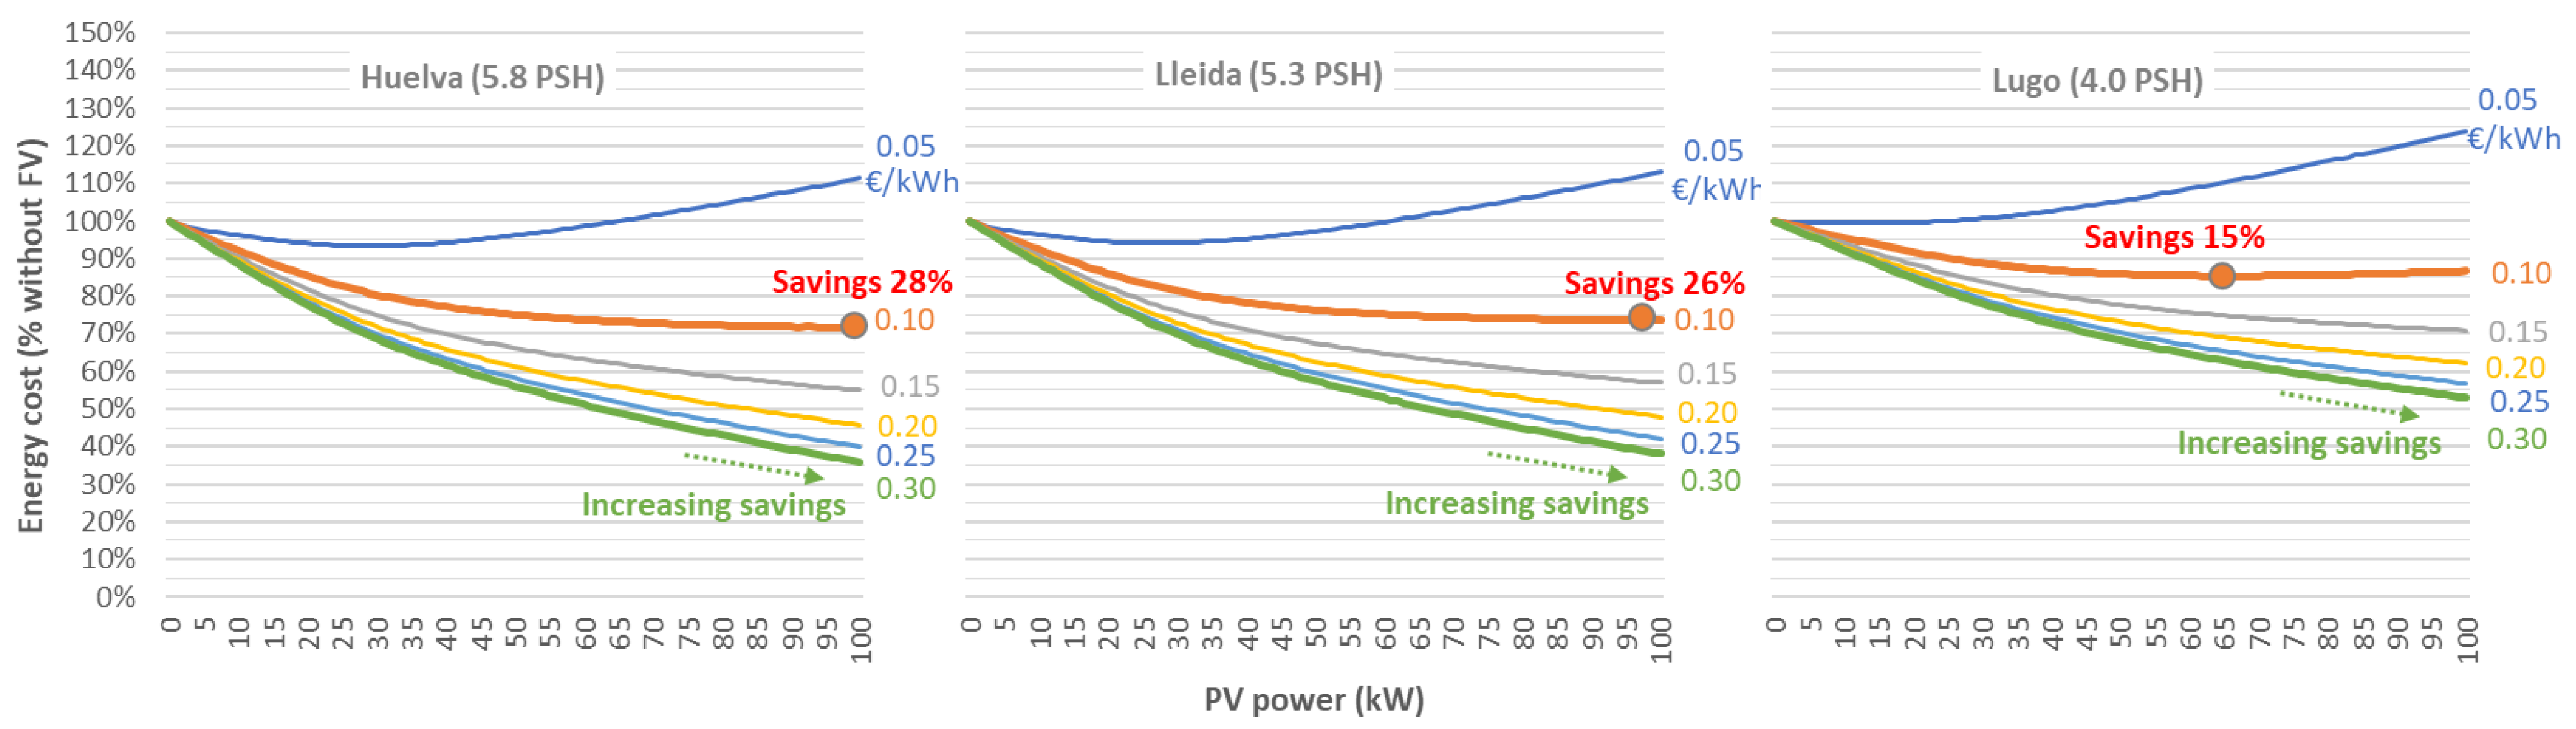
The energy savings achieved over 20 years (annual bills plus the investment in the photovoltaic system) were significantly reduced due to the drop in energy prices. When energy prices decreased from 0.30 EUR/kWh in 2022 to 0.10 EUR/kWh at present, the maximum potential savings for the industry with a uniform consumption pattern, which exceeded 35% in Lleida and Huelva and 30% in Lugo, would fall to values between 11% and 19% (
Figure 2).
However, these maximum savings were obtained with an optimized size adapted to each price level, where the optimal peak capacity was significantly reduced, from 69 to 83 kWp to 38 kWp. The previous values quantify the reduction in potential savings for new installations designed with optimized sizing. If the installation was carried out in previous years, it would very likely be oversized, resulting in lower savings, between 3% and 13% (
Figure 2).
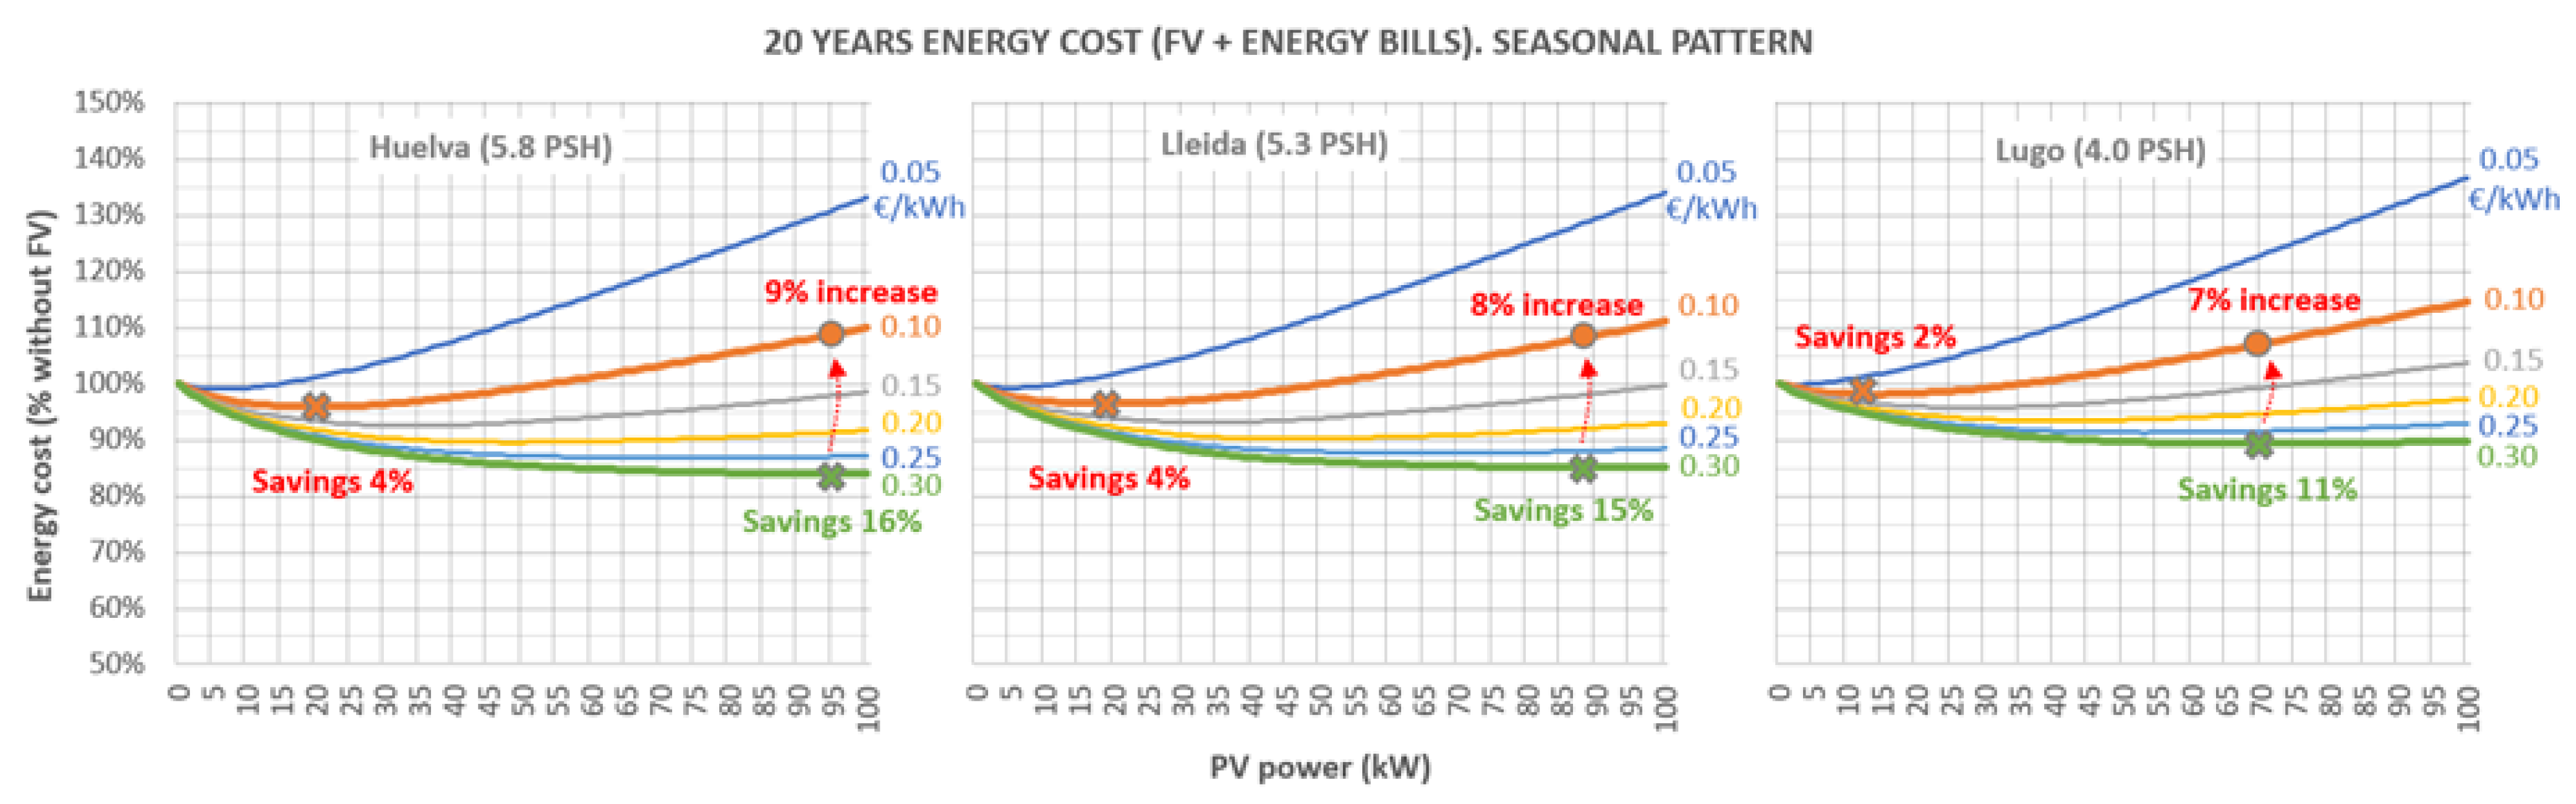
In the case with a highly seasonal consumption pattern (winery), the total savings were initially lower, with maximum values ranging between 11% and 16% under a high-energy-price scenario. However, with current prices, the total savings would decrease due to the irregularity of demand, reaching a maximum of only 2% to 4% if the current low prices persist in the future. In existing oversized installations (optimized for high energy prices), additional costs often arise compared to scenarios without a photovoltaic system, which can reach up to 9% (
Figure 3).
3.2. Profitability
Because of the drop in energy prices, the payback period for investments made in photovoltaic systems increased significantly (
Figure 4). In the industry with a uniform consumption pattern, the most attractive payback period for a new installation (in cases with low capacities that minimize surpluses) would increase from 2 to 3 years at 0.30 EUR/kWh to 5–8 years at 0.10 EUR/kWh. Considering an optimal capacity that maximizes total savings, the payback period would rise from 3.5–4.5 years to 7–10 years, depending on the location. For existing installations, the payback period would fall in an intermediate range, closer to the 0.30 EUR/kWh scenario the longer the system operates under high-price conditions.
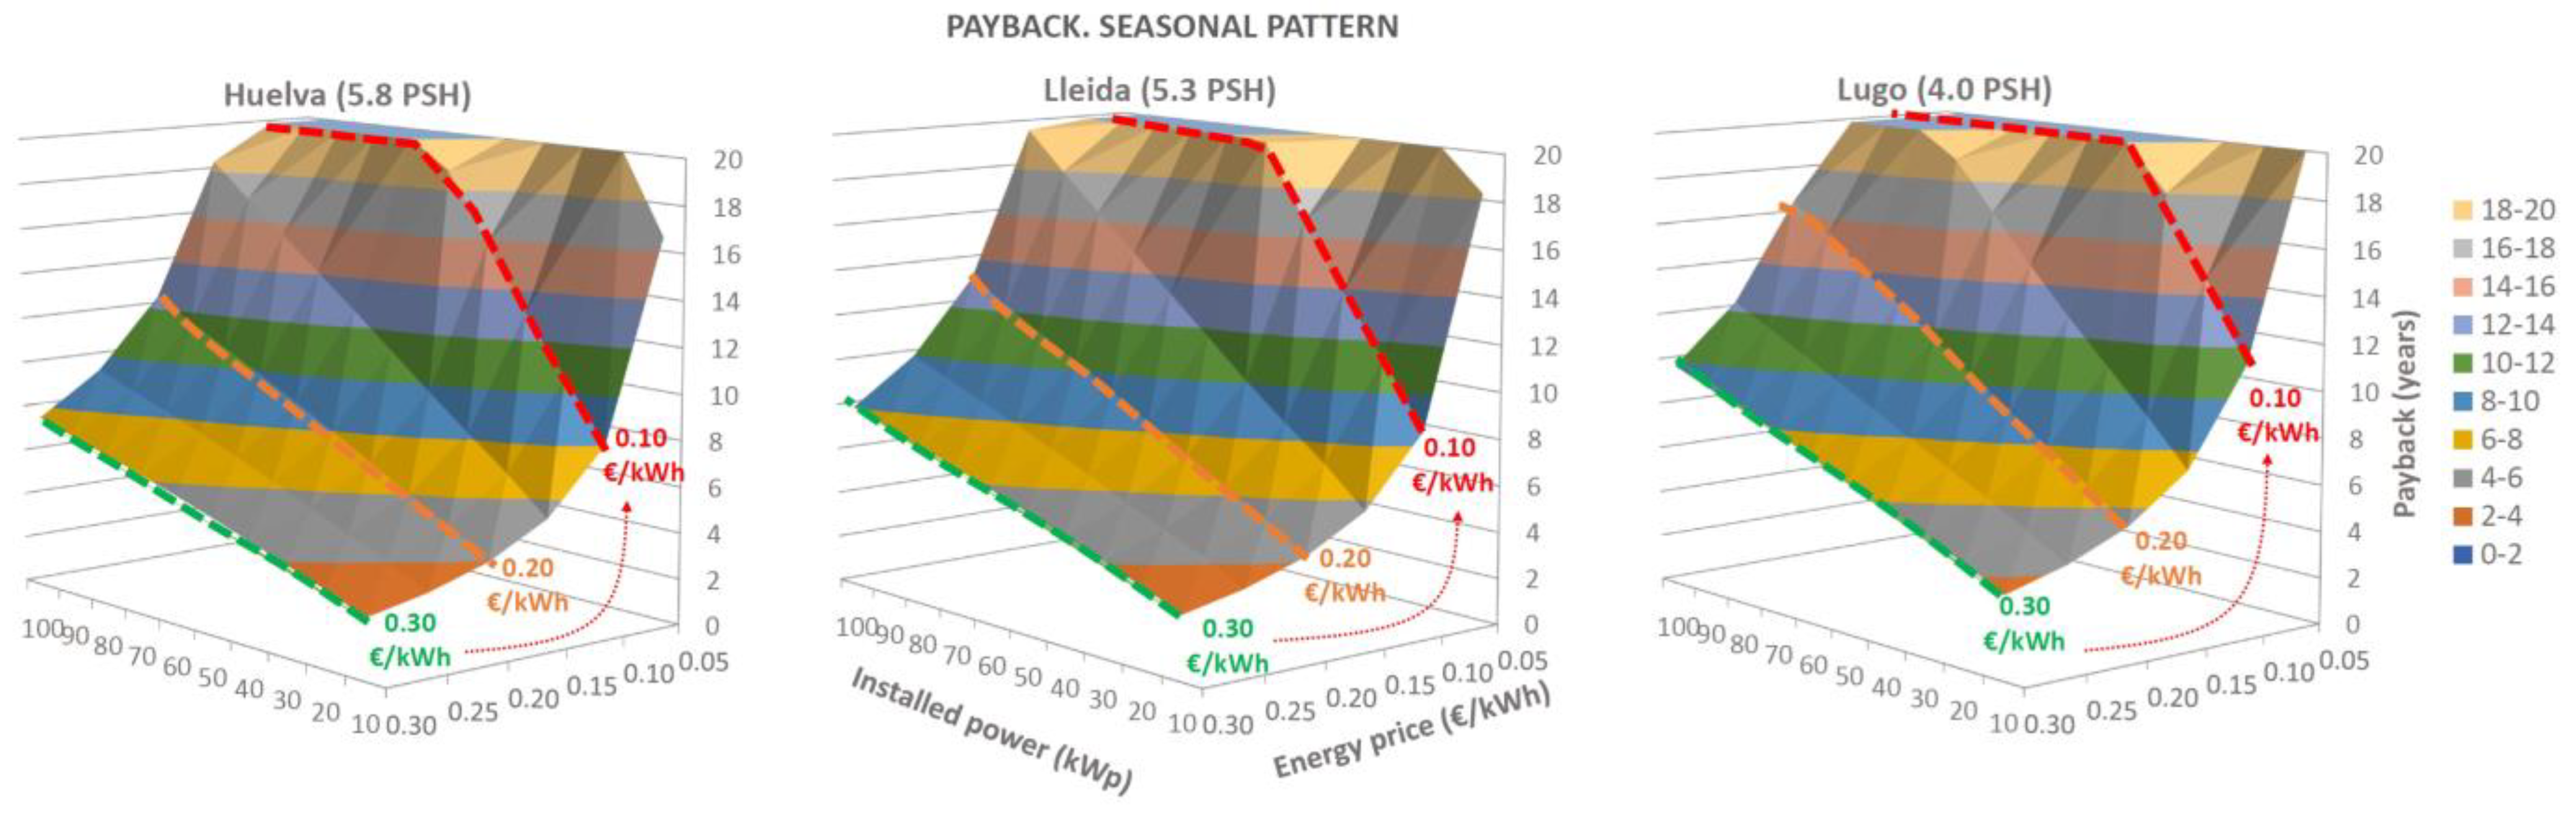
In the case of the industry with a seasonal consumption pattern, the most attractive payback period would increase from 3.5–4.5 years at 0.30 EUR/kWh to 6–11 years at 0.10 EUR/kWh in cases of low capacities. The payback period for an installation with optimal capacity would increase from values close to 7–8 years to 11–13 years. In oversized installations, profitability would disappear, with payback periods exceeding 20 years (
Figure 5).
3.3. Energy Savings
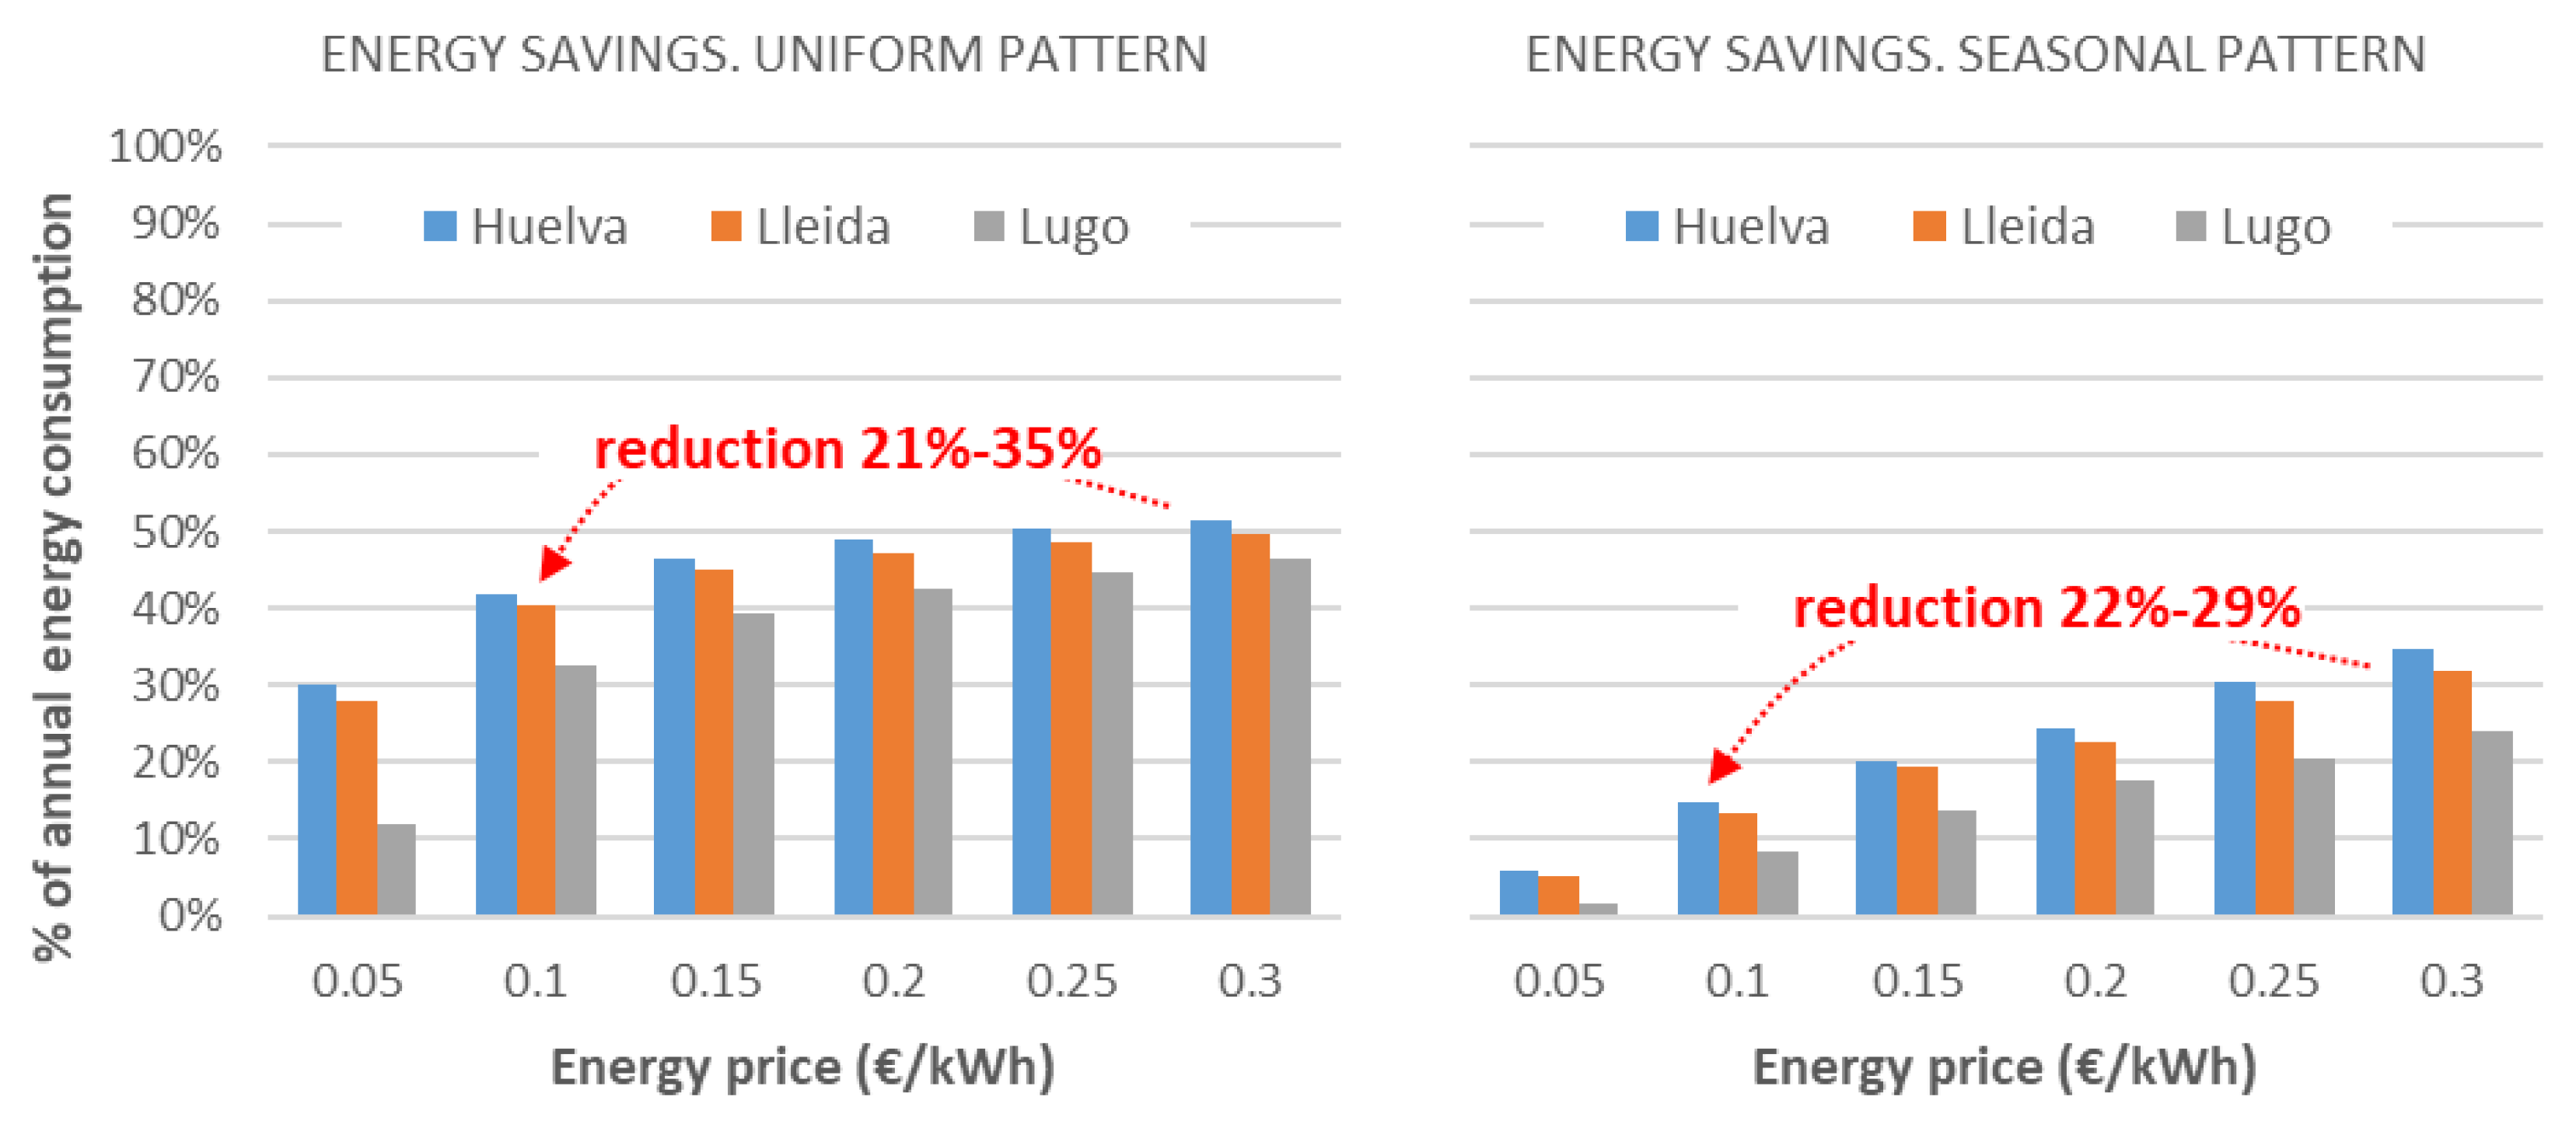
The decline in electricity prices did not impact the energy savings achieved (kWh) in existing photovoltaic installations, as the installed capacity and consumption pattern remained unchanged. Assuming an optimized design (minimizing energy costs) during the period of high electricity prices, the energy supplied by the PV system would range between 46% and 52% of the total consumption in the industry with a uniform pattern and between 24% and 35% in the one with a seasonal pattern (
Figure 6).
In contrast, for the design of new installations, a drop in electricity prices to levels close to the current rate (0.10 EUR/kWh) would significantly affect the energy savings due to the reduction in the optimal installed capacity. In the industry with a uniform consumption pattern, the share of demand met by the PV system will decrease by 21% to 35%, depending on the location. For the industry with a seasonal consumption pattern, the reduction would range between 22% and 29% (
Figure 6).
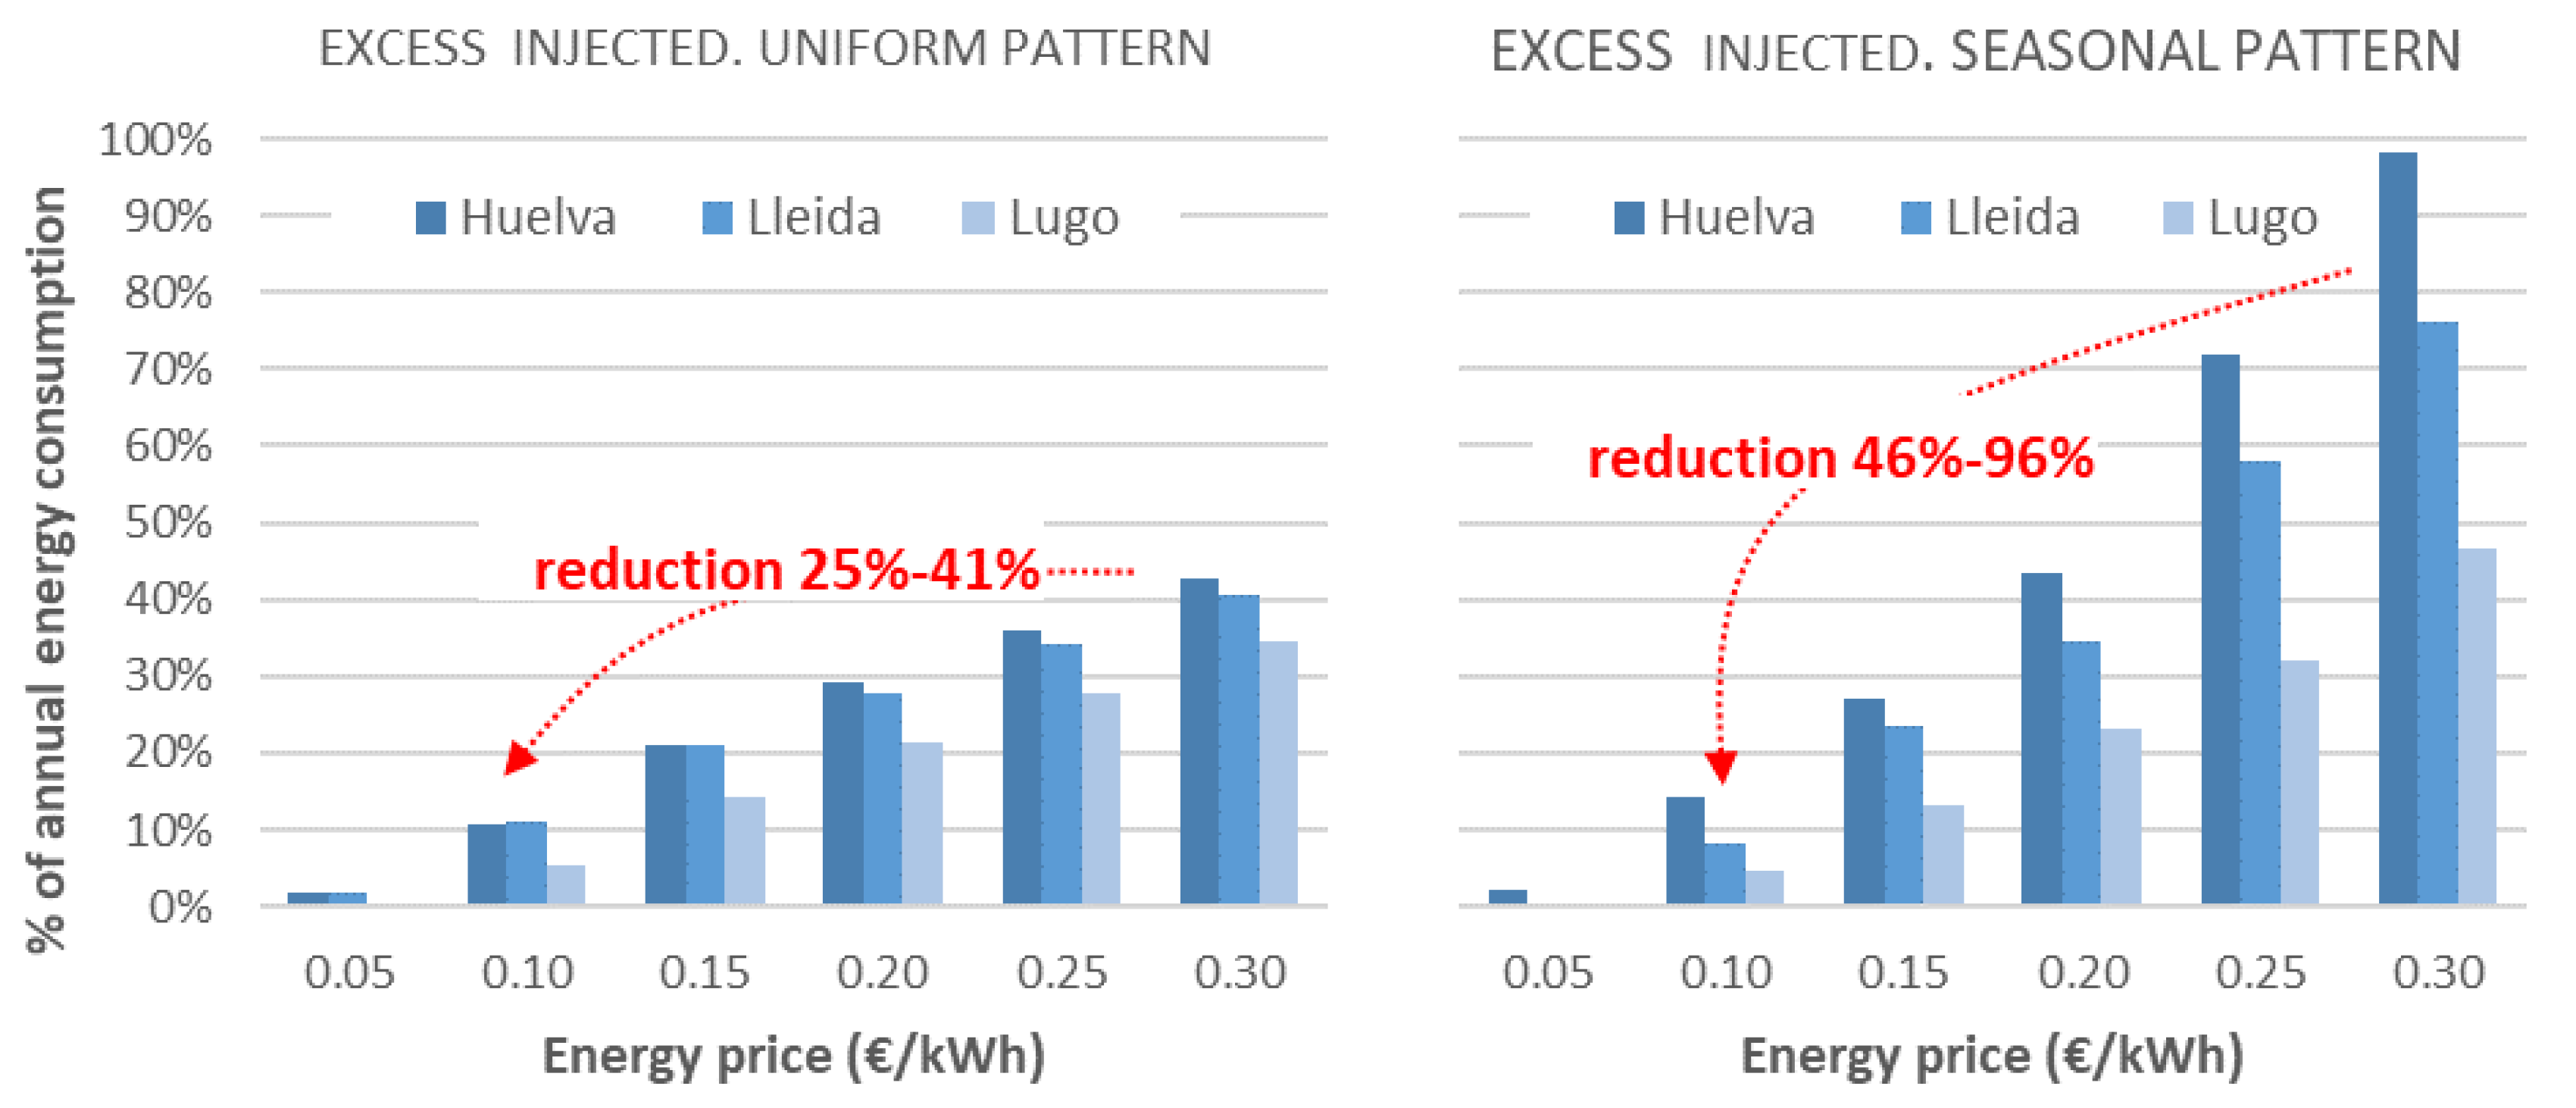
3.4. Surplus Energy Injected into the Grid
When electricity prices decrease, the optimized sizing (to minimize total costs) would lead to a reduction in installed peak power. In the industry with a seasonal consumption pattern, the optimal installed capacity will increase significantly. As a result, surplus energy injected into the grid will also decrease in newly designed installations that can be optimized, with reductions ranging from 25% to 41% of the energy demand in the industry with a uniform pattern and from 46% to 96% in those with a seasonal pattern (
Figure 7).
In existing installations, the price drop would not affect surplus energy, which would remain unchanged as long as the demand remains constant.
The previously presented results refer to scenarios where industries do not receive revenue from surplus energy injected into the grid. However, when national regulations and grid characteristics allow it, agro-industries can take advantage of these excesses. Although the compensation mechanisms and feed-in tariffs vary widely, any additional income contributes to improving the profitability of PV systems and mitigating the impact of falling energy prices.
The additional income from the sale of excess energy increases the total savings and significantly shifts the optimum toward a higher installed peak power. Thus, in the current scenario of low energy prices, this extra income enables substantial total savings. For example, assuming a typical compensation rate for surplus energy equivalent to 50% of the purchased electricity price, the total savings would range between 15% and 28% with a uniform pattern—values comparable to cases with high energy prices but without extra income from excess energy (
Figure 8). The savings would increase significantly if the energy prices were to rise again. The more peak power installed, the greater the total savings. In other words, additional revenue helps mitigate the risk of system oversizing.
The extra income allows for profitability in any range of installed peak power, improving it for higher values. However, the profitability threshold set by the low energy price does not vary and starts from the same value as in the case without excesses (5–8 years for case with uniform demands and 6–11 years for the case with seasonal demands).
4. Discussion
The results of this study highlight the significant impact of energy price fluctuations on the profitability of PV systems in agro-industries. The sharp reduction in energy prices, from 0.30 EUR/kWh to 0.10 EUR/kWh notably decreased potential savings and extended the payback periods for PV investments. This underscores the critical importance of adapting PV system sizing to current and anticipated energy price conditions to ensure economic viability.
The findings demonstrate that many investments made in recent years could experience a significant reduction in profitability if energy prices remain low in the future. Furthermore, many of these installations may now be oversized in the current context, where the optimal required peak capacity is considerably lower. Oversized systems not only reduce profitability but may also incur additional costs, particularly in industries with highly seasonal consumption patterns, such as wineries. The seasonality of these consumption patterns exacerbates the loss of profitability for PV systems, further limiting their economic viability in such cases. This has been already elucidated by other authors [
25].
For industries with uniform consumption patterns, the maximum savings depend significantly on the installed peak capacity and electricity prices. The study revealed that savings exceeding 30% under higher-energy-price conditions could fall to as low as 3% in low-price scenarios (0.10 EUR/kWh). This reduction highlights the importance of optimizing system sizing, as oversized installations severely impact profitability. The optimal capacity required to maximize savings decreases drastically when energy prices fall, indicating that many systems installed during periods of higher prices may now be oversized [
26].
Furthermore, the decline in energy prices has substantially increased the payback periods for PV systems. For new installations optimized to minimize surpluses, the payback period increased from 2–4 years at 0.30 EUR/kWh to 5–11 years at 0.10 EUR/kWh. For optimally sized systems maximizing total savings, the payback period extended to 7–10 years depending on the location. Seasonal consumption patterns pose even greater challenges, with payback periods rising to 11–13 years for optimally sized systems and exceeding 20 years for oversized installations, rendering them economically unfeasible.
The previous discussions refer to scenarios in which industries do not receive revenue from surplus energy injected into the grid. Any additional income helps improve the cost savings of PV systems and mitigates the impact of falling energy prices. The total savings can reach values like those observed in cases with high energy prices but without extra income from excess energy. Additionally, surplus revenue reduces the risk of system oversizing. Nevertheless, despite the increase in savings, the payback period remains long.
These findings carry critical implications for decision-making in agro-industries considering PV investments. The sharp reduction in profitability and extended payback periods underscore the need for dynamic investment strategies that account for market trends and price fluctuations [
27]. Policymakers and industry stakeholders should also consider supportive mechanisms, such as feed-in tariffs or net metering, to enhance the economic viability of PV systems under low-price scenarios. Additionally, advancements in energy storage and demand management technologies could help mitigate the challenges posed by seasonality and optimize PV system performance [
28,
29].
While photovoltaic systems are a widely adopted renewable energy solution for agro-industries, other renewable technologies such as wind energy and biomass cogeneration could provide complementary or alternative solutions, particularly in scenarios where PV faces profitability challenges due to low electricity prices or a high seasonality of demand. Wind energy, for example, may offer more stable generation in regions with high wind potential, reducing the reliance on surplus energy injection into the grid. Similarly, biomass-based energy systems, particularly in agro-industries with significant organic waste streams, can enhance energy independence by providing continuous power generation regardless of solar availability. Future studies should explore hybrid renewable energy models that integrate solar energy with wind or biomass to improve economic viability and energy self-sufficiency in agro-industrial settings [
30,
31,
32].
Additionally, the integration of pricing algorithms, AI-driven demand forecasting, and blockchain technologies should be considered to optimize energy management, improve financial predictability, and enhance transparency in energy transactions, ensuring a greater resilience for PV investments under fluctuating market conditions.
In summary, while PV systems remain a valuable tool for reducing energy costs and environmental impact, their economic feasibility is highly sensitive to energy price dynamics, system sizing, and the seasonality of consumption patterns. Careful planning and adaptive strategies are essential to ensure the long-term profitability of PV investments in agro-industries.
5. Conclusions
This study quantified the impact of declining electricity prices on the profitability, optimal sizing, and energy savings of photovoltaic (PV) systems in agro-industries with different consumption patterns. The drop in electricity prices has significantly reduced PV investment profitability, increasing the payback period from as low as 2–4 years to 7–11 years in low-price scenarios for optimally sized systems. Many existing PV systems, originally sized for high electricity prices, are now oversized, which in highly seasonal industries can lead to negative economic impacts, with additional costs of up to 9% compared to scenarios without PV systems. Industries with uniform energy demands can achieve the highest cost savings, with potential reductions of up to 19% in total energy costs under the current low-price conditions, whereas seasonal industries face greater profitability challenges, with maximum achievable savings dropping to just 2–4% due to the mismatch between PV generation and demand. Without financial compensation for surplus energy, profitability declines further, as excess PV generation cannot offset costs effectively, although if surplus energy is compensated at 50% of the purchase price, total savings can reach levels comparable to high-price scenarios, mitigating some of the negative financial impacts. The findings underscore the need for adaptive PV system sizing to ensure financial viability under variable electricity prices, while policy interventions such as dynamic tariffs, improved feed-in compensation, and incentives for storage solutions could enhance profitability and stabilize PV investment returns in the agro-industrial sector. While PV remains a valuable tool for reducing energy costs and emissions, its long-term financial success depends on accurate pricing forecasts, flexible system designs, and supportive regulatory frameworks that account for market volatility. Future research should explore demand-side management strategies and advanced storage solutions to further enhance PV integration in agro-industries, while also considering hybrid photovoltaic models that integrate multiple energy sources to improve reliability, efficiency, and economic viability.


