Article

Combinatorial Approaches to Image Processing and MGIDI for the Efficient Selection of Superior Rice Grain Quality Lines

1
Department of Agronomy and Plant Breeding, Faculty of Agricultural Sciences, University of Guilan, Rasht 41996-13776, Iran
2
Department of Biosystems Engineering, Faculty of Agricultural Sciences, University of Guilan, Rasht 41996-13776, Iran
3
Department of Plant Biotechnology, Faculty of Agricultural Sciences, University of Guilan, Rasht 41996-13776, Iran
*
Author to whom correspondence should be addressed.
Agriculture 2025, 15(6), 615; https://doi.org/10.3390/agriculture15060615
Submission received: 24 January 2025 / Revised: 1 March 2025 / Accepted: 10 March 2025 / Published: 13 March 2025
(This article belongs to the Special Issue Genetic Diversity Assessment and Phenotypic Characterization of Crops)

Abstract

:
Rice is a vital staple in many countries, and as the demand for food diversity rises, the focus has shifted towards improving rice quality rather than just yield. This shift in breeders’ goals has led to the development of breeding populations aimed at comprehensively assessing rice grain appearance quality. In this regard, we developed an F11 rice recombinant inbred line population derived from a cross between the IR28 and Shahpasand (SH) varieties and assessed the grain appearance characteristics of 151 lines and seven varieties using a computer vision system and a new generation of phenotyping tools for rapidly and accurately evaluating all grain quality-related traits. In this method, characteristics such as area, perimeter, length, width, aspect ratio, roundness, whole kernel, chalkiness, red stain, mill rate, and brown kernel were measured very quickly and precisely. To select the best lines, considering multiple traits simultaneously, we used the multi-trait genotype ideotype distance index (MGIDI) as a successful selection index. Based on the MGIDI and a 13% selection intensity, we identified 17 lines and three varieties as superior genotypes for their grain appearance quality traits. Line 59 was considered the best due to its lowest MGIDI value (0.70). Lines 19, 31, 32, 45, 50, 59, 60, 62, 73, 107, 114, 122, 125, 135, 139, 144, and 152 exhibited superior grain quality traits compared to the parents, making them high-quality candidates and indicating transgressive segregation within the current RIL population. In conclusion, the image processing technique used in this study was found to be a fast and precise tool for phenotyping in large populations, helpful in the selection process in plant breeding. Additionally, the MGIDI, by considering multiple traits simultaneously, can help breeders select high-quality genotypes that better match consumer preferences.

1. Introduction

Rice is one of the cereals that people in developed and developing countries use as a staple diet [1]. Due to the increasing demand for food diversity, improving living standards, and a growing world population, breeders have increasingly focused on the edible quality of rice [2]. Therefore, the goal of many breeders has shifted from increasing yield to producing rice with better quality [3]. Comprehensive assessments of rice quality are divided into four main aspects: milling quality (MQ), which refers to the grain integrity during processing, including the roughness rate, milled rice rate, and head rice rate; nutritional quality (NQ), which is influenced by the quantity and quality of starch, protein, vitamins, minerals, and other phytochemicals beneficial to human health; eating and cooking quality (ECQ), which primarily impacts the characteristics and palatability of cooked rice; and appearance quality (AQ), typically involving grain shape, chalkiness, transparency, and other indicators [4,5]. Among these attributes, grain shape plays a critical role in determining both the appearance and edibility of rice. It is influenced by characteristics such as length, width, thickness, and aspect ratio, influencing both grain quality and yield [4]. The grain hull affects rice size and shape, with long, slender grains especially valued for their translucency and higher edible quality [6]. However, larger grains are often more prone to chalkiness, which can lower their appeal [7]. Milling quality is also economically important, with people having a strong preference for whole, unbroken kernels over broken ones, and it is evaluated based on traits like brown rice recovery, milled rice recovery, whole grain recovery, head rice recovery, and the percentage of head rice [8].
Additionally, the opacity and transparency of the rice endosperm are vital for determining appearance quality, which in turn influences milling, taste, and nutritional aspects [9,10]. Notably, the starch content of milled rice, which constitutes approximately 90% of its dry weight, is pivotal for cooking and eating quality and overall appearance [11]. These interconnected factors highlight the multifaceted nature of assessing and understanding rice grain appearance and quality.
Given the escalating demand for high-quality rice, there is a pressing need to develop rapid, nondestructive methods for evaluating rice quality. Traditional methods, including manual visual inspections, are often time-consuming and costly [12]. Consequently, rice quality research has increasingly turned to nondestructive techniques such as image processing and spectral methods. Additionally, computer vision systems offer rapid and reliable outcomes, demonstrating potential for cost-effective adoption in the rice industry to assess quality traits and consumer preferences compared to traditional methods [13]. The abundance of studies on the application of computer vision and image processing post-harvest underscores the significance of quality assessment and grading of agricultural grains [14]. By using image processing, a large number of traits can be examined for each genotype in less time [15]. Hence, this method proves highly beneficial in plant breeding, particularly for phenotyping large populations. High-throughput image-based phenotyping allows for the rapid and precise measurement of numerous traits across extensive plant populations, facilitating the selection of superior genotypes [16]. Recent studies have further advanced the field of rice quality assessment. For instance, Aznan et al. [17] used artificial neural networks (ANNs) to classify rice types and predict quality traits such as the aroma, color, texture, and pH of cooked rice. By integrating a low-cost electronic nose and near-infrared spectrometer with machine learning (ML), their approach achieved high accuracy in the classification (up to 98.7%) and prediction of quality attributes (R = 0.95–0.98). This method provides a rapid, cost-effective, and reliable solution for rice quality assessment, advancing the use of digital technologies in the industry. Similarly, Kurade et al. [18] demonstrated a low-cost, automated system utilizing a Raspberry-Pi-based image acquisition module to extract structural and geometric features from rice grains. Their study employed ML algorithms to classify rice varieties based on perimeter, area, solidity, and shape factor, achieving notable accuracy with the random forest classifier.
Genetic selection is pivotal in plant breeding, and relying solely on one trait is not always the most suitable strategy. Breeders often strive to incorporate various desirable traits into a new genotype. Several linear selection indices exist for choosing superior genotypes, aiding breeders in this process [19]. Recent advancements in selection indices have revolved around the simultaneous consideration of various performance and trait criteria for selecting superior genotypes. Notable among these indices are factor analysis and ideotype design via the best linear unbiased prediction (FAI-BLUP) index, multi-trait genotype ideotype distance index (MGIDI), and Multiple-Trait Stability Index (MTSI) [20,21]. Among these, the MGIDI is particularly noteworthy; Olivoto and Nardino [22] introduced the MGIDI, an innovative index based on factor analysis designed to select superior genotypes, by considering multiple traits across one or more environments. Recently, the MGIDI was used to select superior genotypes in strawberries, wild wheat, and cultivated barley [22,23,24]. They demonstrated the effectiveness of this index by simultaneously considering multiple traits or indices and evaluating the strengths and weaknesses of the tested genotypes.
A literature review reveals that despite the advancements in rice quality assessment, there remains a significant gap in the rapid and nondestructive evaluation of appearance quality in large rice populations. Traditional methods are often labor-intensive and time-consuming, limiting their applicability in large-scale breeding programs. Moreover, the integration of advanced selection indices like MGIDI into rice quality assessment has not been extensively explored. In the present study, a recombinant inbred line (RIL) population was developed through the crossing of IR28 and Shahpasand (SH) varieties. This population served as the basis for achieving the following objectives:
1.
To develop and implement an image processing technique to rapidly assess appearance quality in a large rice population.
2.
To utilize the MGIDI for selecting the best lines from the assessed rice population based on multiple traits related to the appearance quality of head rice.

2. Materials and Methods

2.1. Plant Materials and Field Experiment

The plant materials for this study consisted of 151 RILs in the F11 generation, derived from a cross between the IR28 and SH varieties numbered 1 to 154. Note that lines 7, 39, and 120 were not evaluated in this project due to a lack of sufficient seeds. The SH rice variety is an Iranian landrace, traditionally grown in the northern provinces of Iran, such as Guilan and Mazandaran. It is known for its grain and aromatic qualities and is well suited to the subtropical humid climate of these regions [25]. Landraces like SH are valued for their genetic diversity, adaptation to local environmental stresses (e.g., drought, salinity), and contributions to breeding programs [26]. IR28 (IR2061-214-3-8-2) is a high-yielding rice variety developed by the International Rice Research Institute (IRRI) and released in the Philippines in 1974; derived from the cross IR833-6-2-1-1/IR1561-149-1//IR24*4/O. nivara, it was selected for its resilience and adaptability. Widely adopted across Asia and Africa, it was released in countries such as Iran [27].
Each RIL represents a genetically distinct lineage derived from repeated cycles of meiosis and recombination, resulting in unique combinations of parental alleles. The final population comprised 151 RILs, along with seven check varieties, comprising the parental varieties (SH and IR28), along with Dorfak, Neda (improved varieties), Hashemi, Domsiah, and Sadri (native varieties), providing a genetically diverse panel for phenotyping grain quality traits.
Grains of the lines/varieties were first sown in a nursery, and 25-day-old seedlings were transplanted with a single seedling per hill, maintaining a 25 cm spacing between rows and hills. The experiment followed an augmented block design with four replications at the experimental field of the Rice Research Institute of Iran (RRII) in 2020. Following soil fertility recommendations, the field was fertilized with 100 kg ha−1 of potassium oxide (K2O) from potassium sulfate, 80 kg ha−1 of nitrogen from urea, and 45 kg ha−1 of phosphorus pentoxide (P2O5) from a superphosphate triple source. Transplanting was performed manually, placing 25-day-old seedlings with a 25 cm spacing between hills and rows. Each plot measured 4 m2 for the lines and 6 m2 for the parental and varieties. Weed control was performed through hand weeding twice per season, while pest management measures were implemented as needed to ensure comprehensive crop management.
After harvesting and threshing the rice plants, paddy samples with approximately 14% moisture content were dehulled using a laboratory paddy husker (JLGJ4.5, Mbest Technology Co., Hangzhou, China). The resulting brown rice was then milled into white rice using a laboratory whitening machine (LTJM-2099, Shijiazhuang Sanli Grain Sorting Machinery Co., Shijiazhuang, China). This milled rice was used to evaluate the grain’s appearance characteristics.

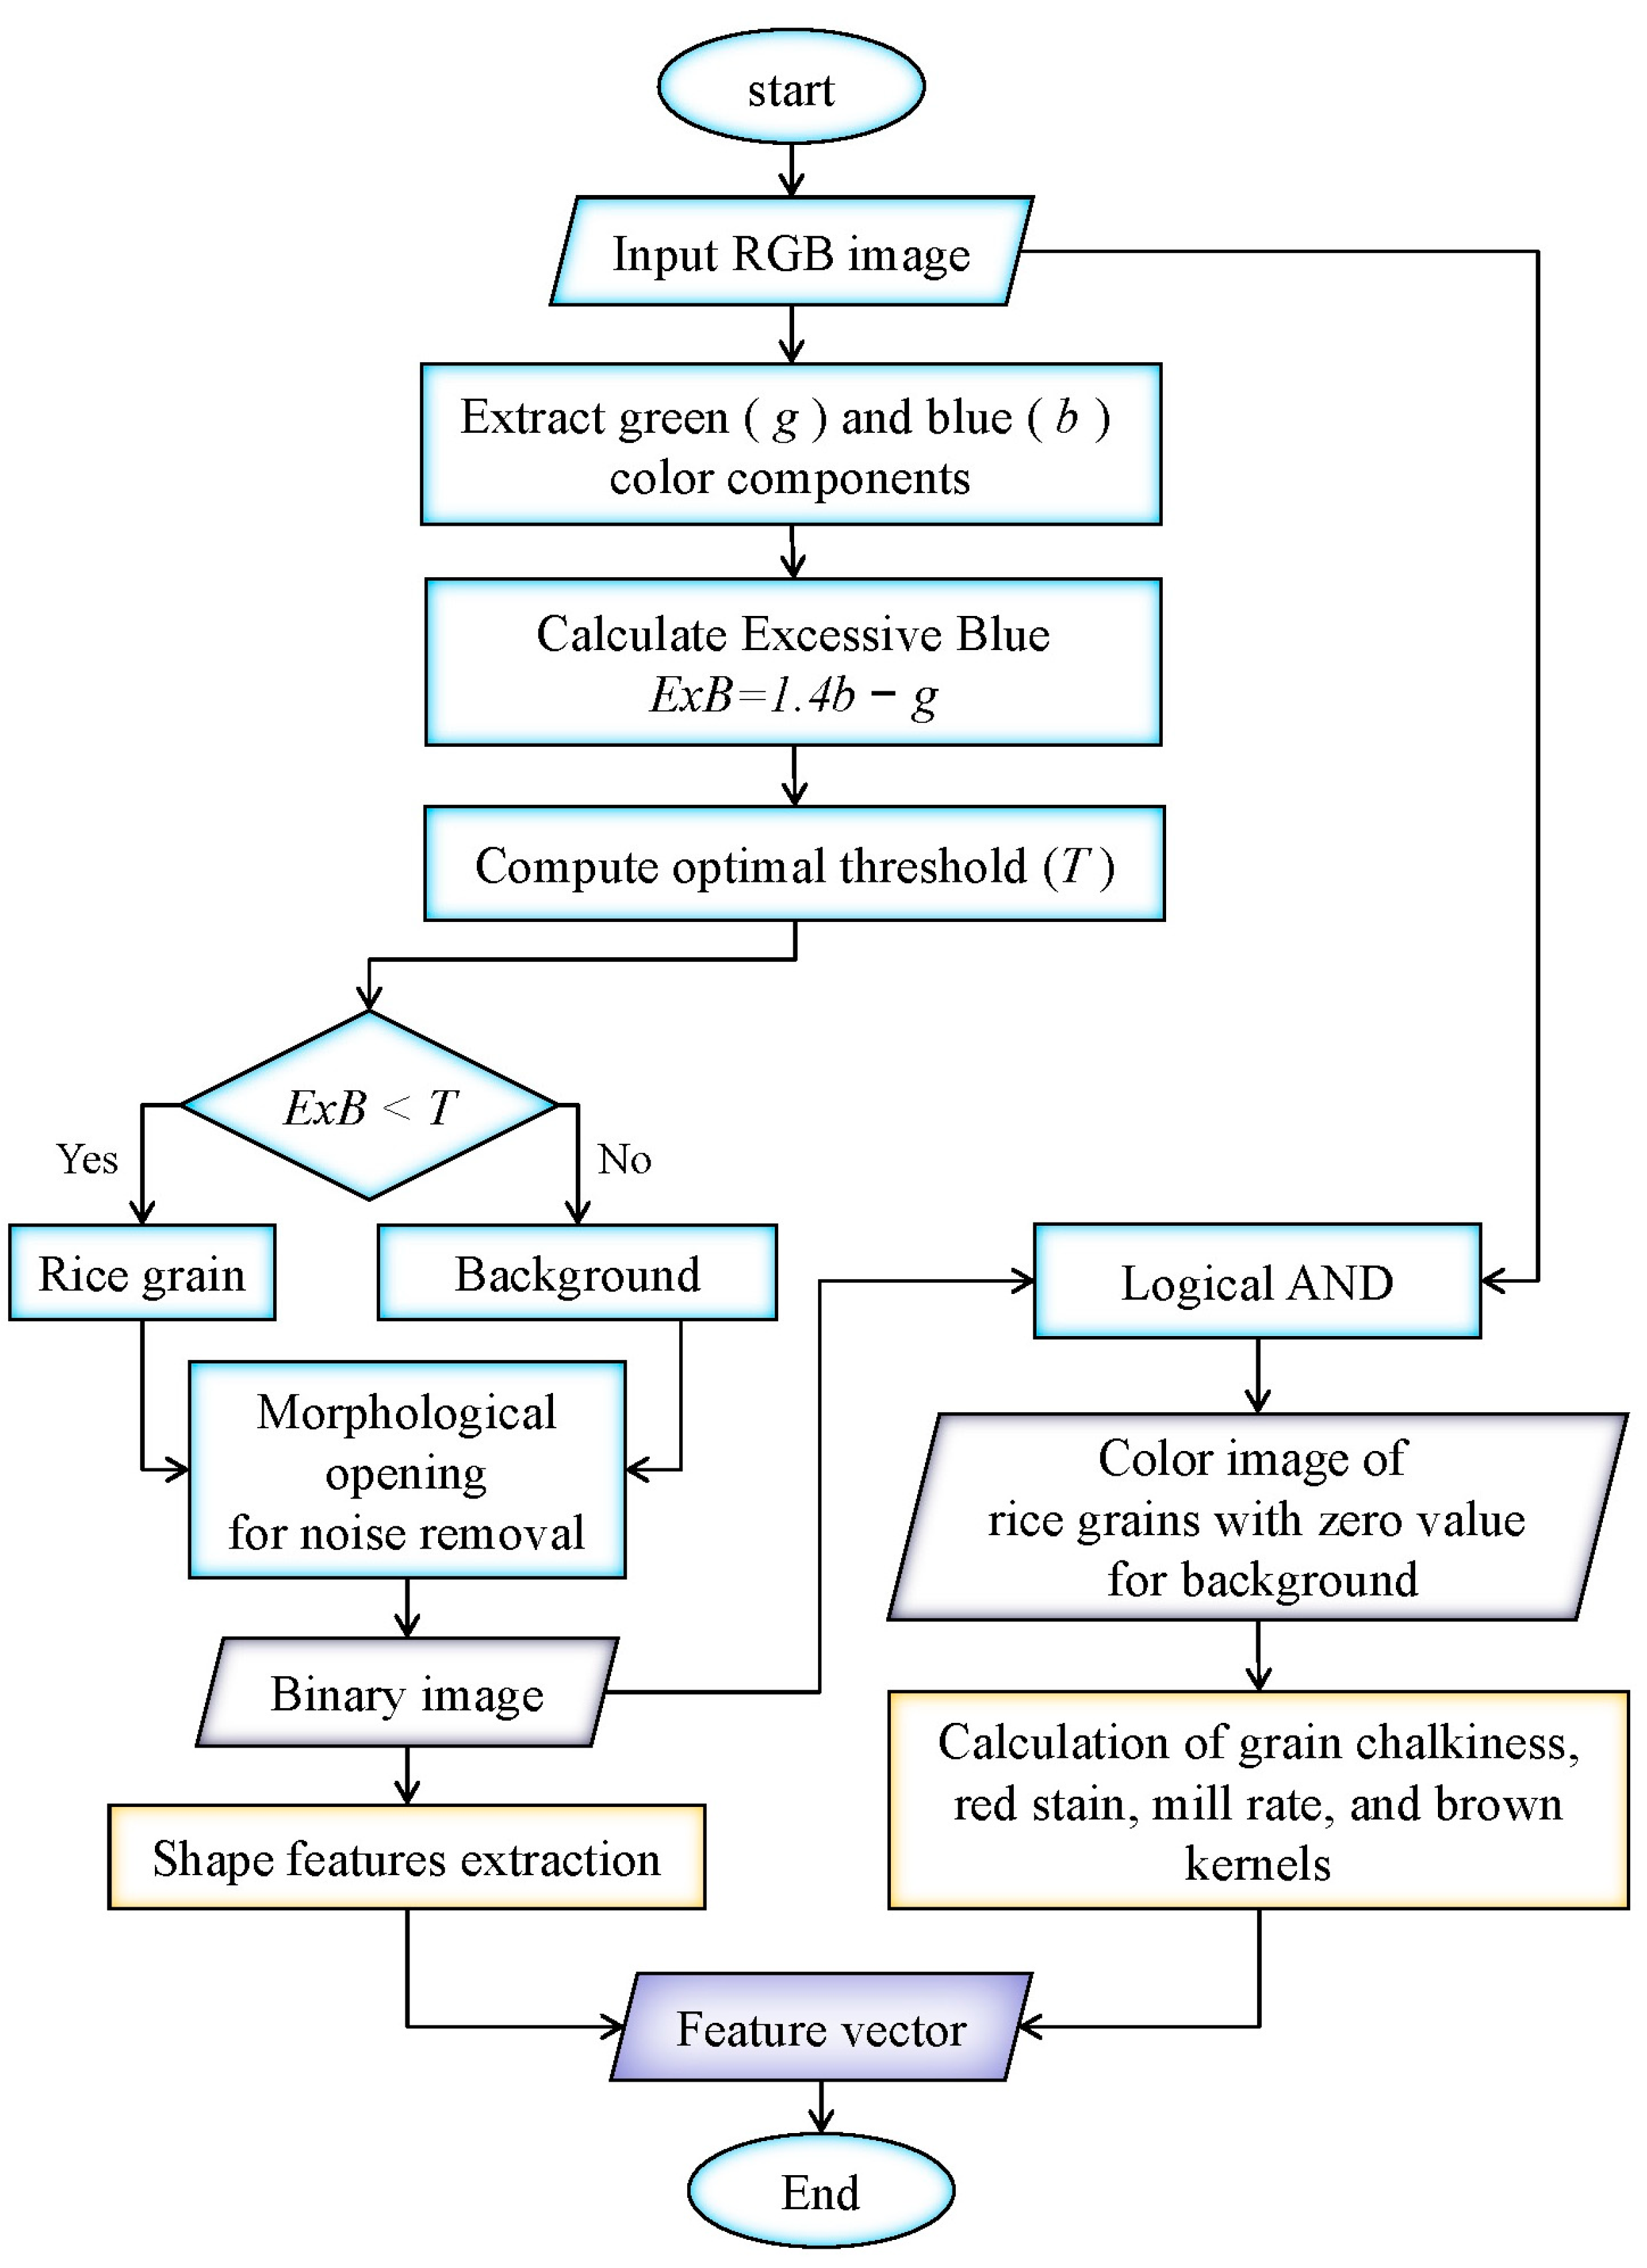
2.2. Methods System and Appearance Quality Trait Measurement

The appearance quality traits were evaluated at the Faculty of Agricultural Sciences of the University of Guilan in 2023–2024. A computer vision system comprising a flatbed scanner, computer processor, and image processing software was employed to assess appearance characteristics [14]. Three replications were conducted for each line at the head rice stage, with each replication containing 50 grains. The seed tray was fabricated using 3 mm thick dark-blue plexiglass and designed with precisely spaced holes, each measuring 10 × 3.2 mm. These holes were tailored to ensure the singulation of individual rice kernels, preventing the seeds from coming into contact with one another. After placing the tray on the scanner glass, individual rice samples were carefully arranged within each of the tray’s holes, and images of the rice samples with dark-blue backgrounds were captured at a resolution of 1000 dpi. A blue background was chosen because it provided high contrast with the rice, making it easier to segment the grain samples from the background during image processing.
Following the acquisition of the images on the computer, an image processing program was developed in the image processing toolbox of MATLAB software (MATLAB, Version 2021a, Math-Works, Portola Valley, CA, USA) to extract the desired characteristics. A flowchart of image processing steps is presented in Figure 1. By applying an optimal threshold to the excessive blue color index [28], rice kernels were segmented from the image background, resulting in a binary image of samples. To eliminate possible noises, morphological opening (erosion followed by dilation) was applied on the primary binary images, and the resulting binary images were utilized in subsequent procedures. The “regionprops” function was used to extract shape features from the binary images of rice grains. To extract dimensional features such as area, perimeter, length, and width, the sub-functions of “Area”, “Perimeter”, “MajorAxisLength”, and “MinorAxisLength” were used, respectively. Additionally, the aspect ratio (length-to-width ratio) was calculated. Moreover, the grain roundness was computed using Equation (1) [14,29]:
Roundness = 4π Area/Perimeter3
The other properties, including whole kernel, chalkiness, red stain, mill rate, and brown kernel, were calculated according to Payman et al. [14]. The extracted data of rice grains were stored in Excel files.

2.3. Statistical Analysis

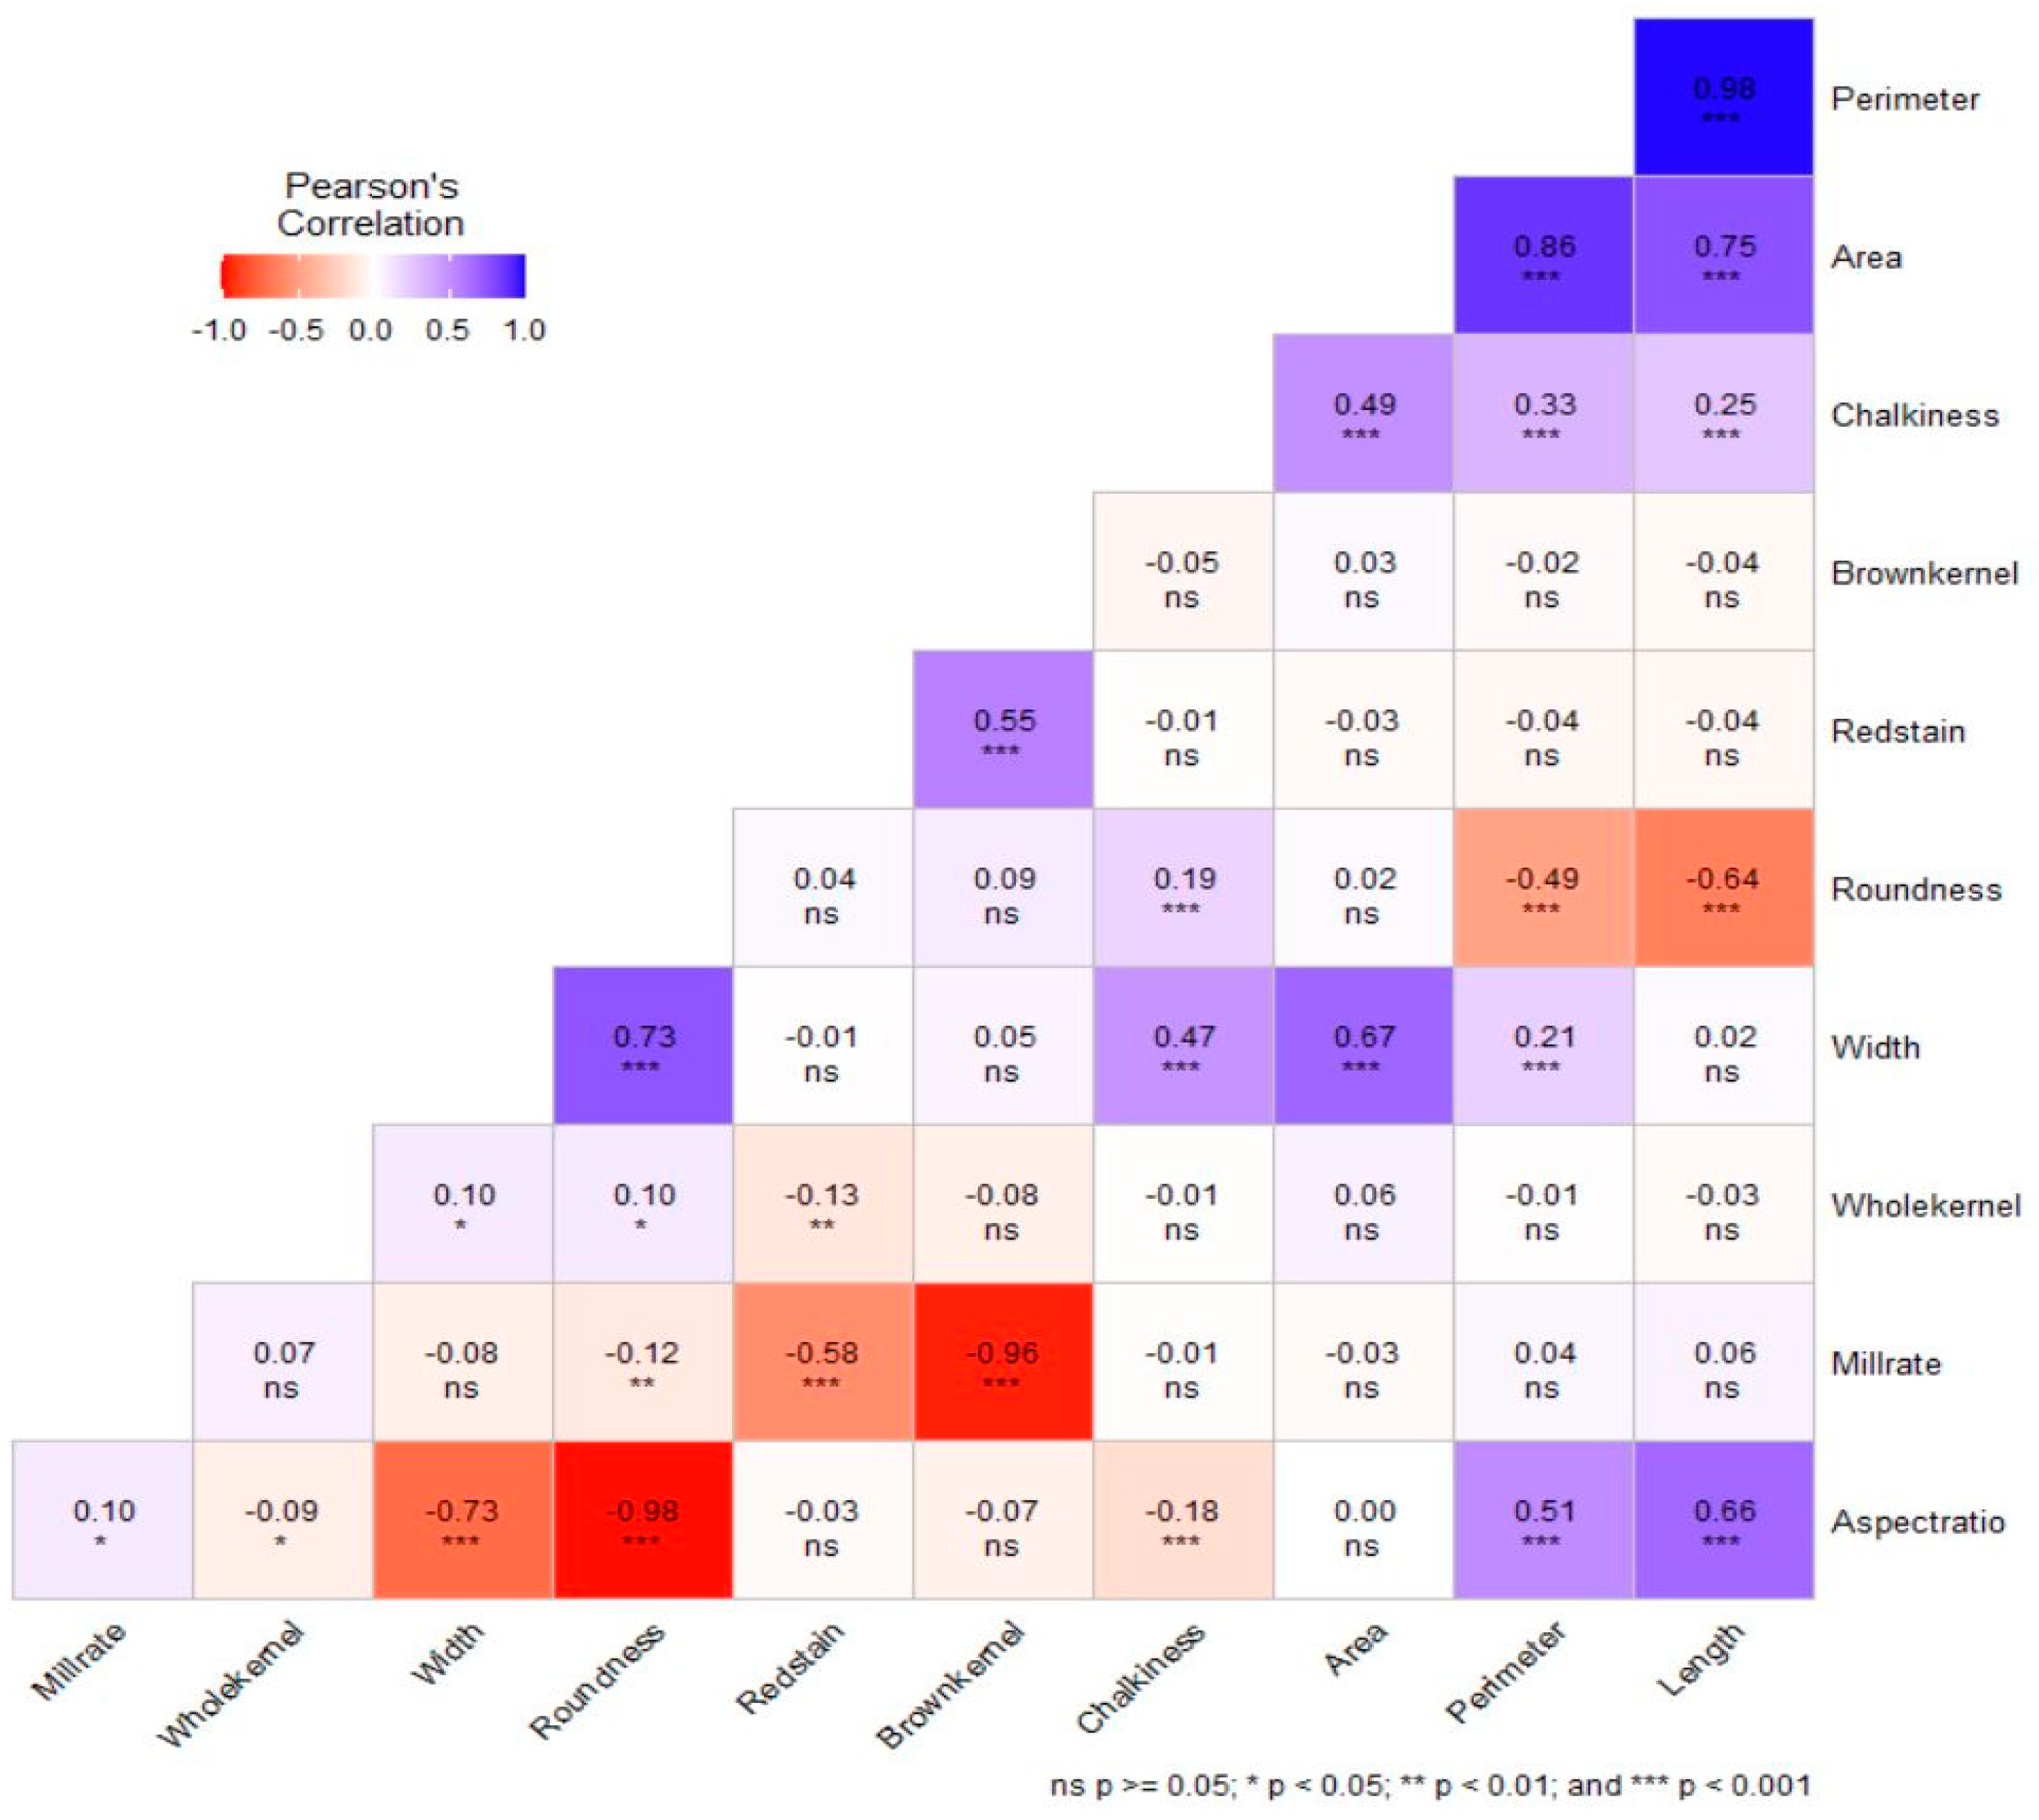
2.3.1. Descriptive Statistics and Correlation Coefficient Calculation

After sorting the data in Excel, SPSS software version 27 and the SRplot platform (https://www.bioinformatics.com.cn/en, accessed on 16 June 2024) were used to calculate descriptive statistics and Pearson correlation analysis, respectively.

2.3.2. MGIDI

The MGIDI was employed for genotypic ranking, carried out based on information from examined traits (area, perimeter, length, width, aspect ratio, roundness, whole kernel, chalkiness, red stain, mill rate, and brown kernel). The calculation stages are outlined as follows.
1.
Rescaling the traits:
Xij is a two-dimensional table with i rows representing genotypes and j columns representing traits. The scaled value for row i and column j (rXij) is calculated using the following equation, Equation (2):
r X i j = η n j ϕ n j η o j ϕ o j × ( θ i j η o j ) + η n j
Here, ηnj and ϕnj are specific parameters associated with row i. At the same time, ηoj and ϕoj are parameters related to column j, ηnj and ϕnj represent the new minimum and maximum value for trait j after scaling, respectively, and θij represents the original values for trait j of genotype i. The scaling transformation for ηnj and ϕnj is calculated as follows.
For traits where a high value is desirable, ϕnj is set to zero, and ηnj is set to 100. These traits include aspect ratio, whole kernel, area, perimeter, length, and mill rate. Conversely, for traits where a low value is desirable, such as width, roundness, red stain, chalkiness, and brown kernel, ϕnj is set to 100, and ηnj is set to zero. In the scaled two-dimensional table (rXij), each column has a range of 0–100, considering the desired direction (increase or decrease) and maintaining the correlation structure of the original set of variables [21].
2.
Factor analysis:
In the subsequent stage, factor analysis was conducted to reduce the dimensionality of the data and construct the relationship structure. This analysis uses r X i j to cluster correlated traits into factors and then calculate factorial scores for each genotype as per Equation (3):
X = μ + L f + ε
Here, X is a p × 1 vector of rescaled observations, μ   is a p × 1 vector of standardized means, L is a p × f matrix of factorial loadings, f is a p × 1 vector of common factors, and ε is a p × 1 vector of residuals. Here, p and f denote the number of traits and retained common factors, respectively. Eigenvalues and eigenvectors are derived from the correlation matrix of r X i j . Initial loadings are determined by considering only factors with eigenvalues higher than one. Subsequently, the varimax rotation is applied for the analytic rotation and the estimation of final loadings. Factorial scores are then computed using Equation (4):
F = Z ( A T R 1 ) T
In this equation, F is a g × f matrix of factorial scores, Z is a g × p matrix with standardized means (scaled values), A is a p × f matrix of canonical loadings, and R is a p × p correlation matrix between traits. Additionally, g, f, and p represent the number of genotypes, the number of factors with eigenvalues greater than 1, and the number of analyzed traits, respectively [22].
3.
Definition of ideal genotype (Ideotype):
According to Equation (2), the ideotype can be defined by 1 × p vector. The scores for the ideal genotype are estimated according to Equation (4).
4.
Calculation of MGIDI:
The MGIDI is calculated by determining the Euclidean distance between the genotype scores and the ideal genotype using Equation (5):
M G I D I = i = 1 f ( γ i j γ j ) 2 0.5
Here, γij denotes the score of the i-th genotype in the j-th factor. (i = 1, 2, …, g; j = 1, 2, …, f) where g and f represent the number of genotypes and the number of factors. γij is the j-th score of the ideal genotype. Genotypes with the lowest MGIDI values are closest to the ideal genotype, indicating desirable values for all calculated traits. The MGIDI, along with the best linear unbiased prediction (BLUP) for genotypes, was calculated using the ‘metan’ package in R (https://github.com/NEPEM-UFSC/metan, accessed on 16 June 2024) [21,30].

2.3.3. Selection Differential and Selection Gain

The selection differential (SD) for all traits with a 10% selection intensity was calculated as the difference between the mean of the selected genotypes ( X ¯ s ) and the original population ( X ¯ 0 ). The predicted selection gain (SG) for each trait was computed using the MGIDI as described in Equation (6).
S G ( % ) = X ¯ s X ¯ o × h 2 X ¯ o × 100
where X ¯ s is the mean of the selected genotypes, X ¯ o is the mean of the original population and h2 is the broad-sense heritability.

3. Results

3.1. Enhanced Efficiency and Accuracy with Image Processing

The image processing technique used in the present study significantly enhanced the efficiency and accuracy of assessing the appearance quality traits of rice grains. By employing a computer vision system, we were able to evaluate and extract various visual traits of 420 grains in approximately 10 min (the overall process time including placing the seeds onto the scanner bed, scanning, and analysis), compared to the traditional method using Photo Enlarger, which required the same amount of time to assess only 15 grains for measuring only two traits (length and width of kernels). This substantial increase in throughput demonstrates the method’s capability to handle large sample sizes effectively. It should be noted that the mentioned automated system can provide precise measurements of the area, perimeter, length, width, aspect ratio, roundness, whole kernel, chalkiness, red stain, mill rate, and brown kernel with minimal human intervention. The high-resolution images and advanced image processing algorithms ensured consistent and reliable data, crucial for accurate selection and breeding programs.

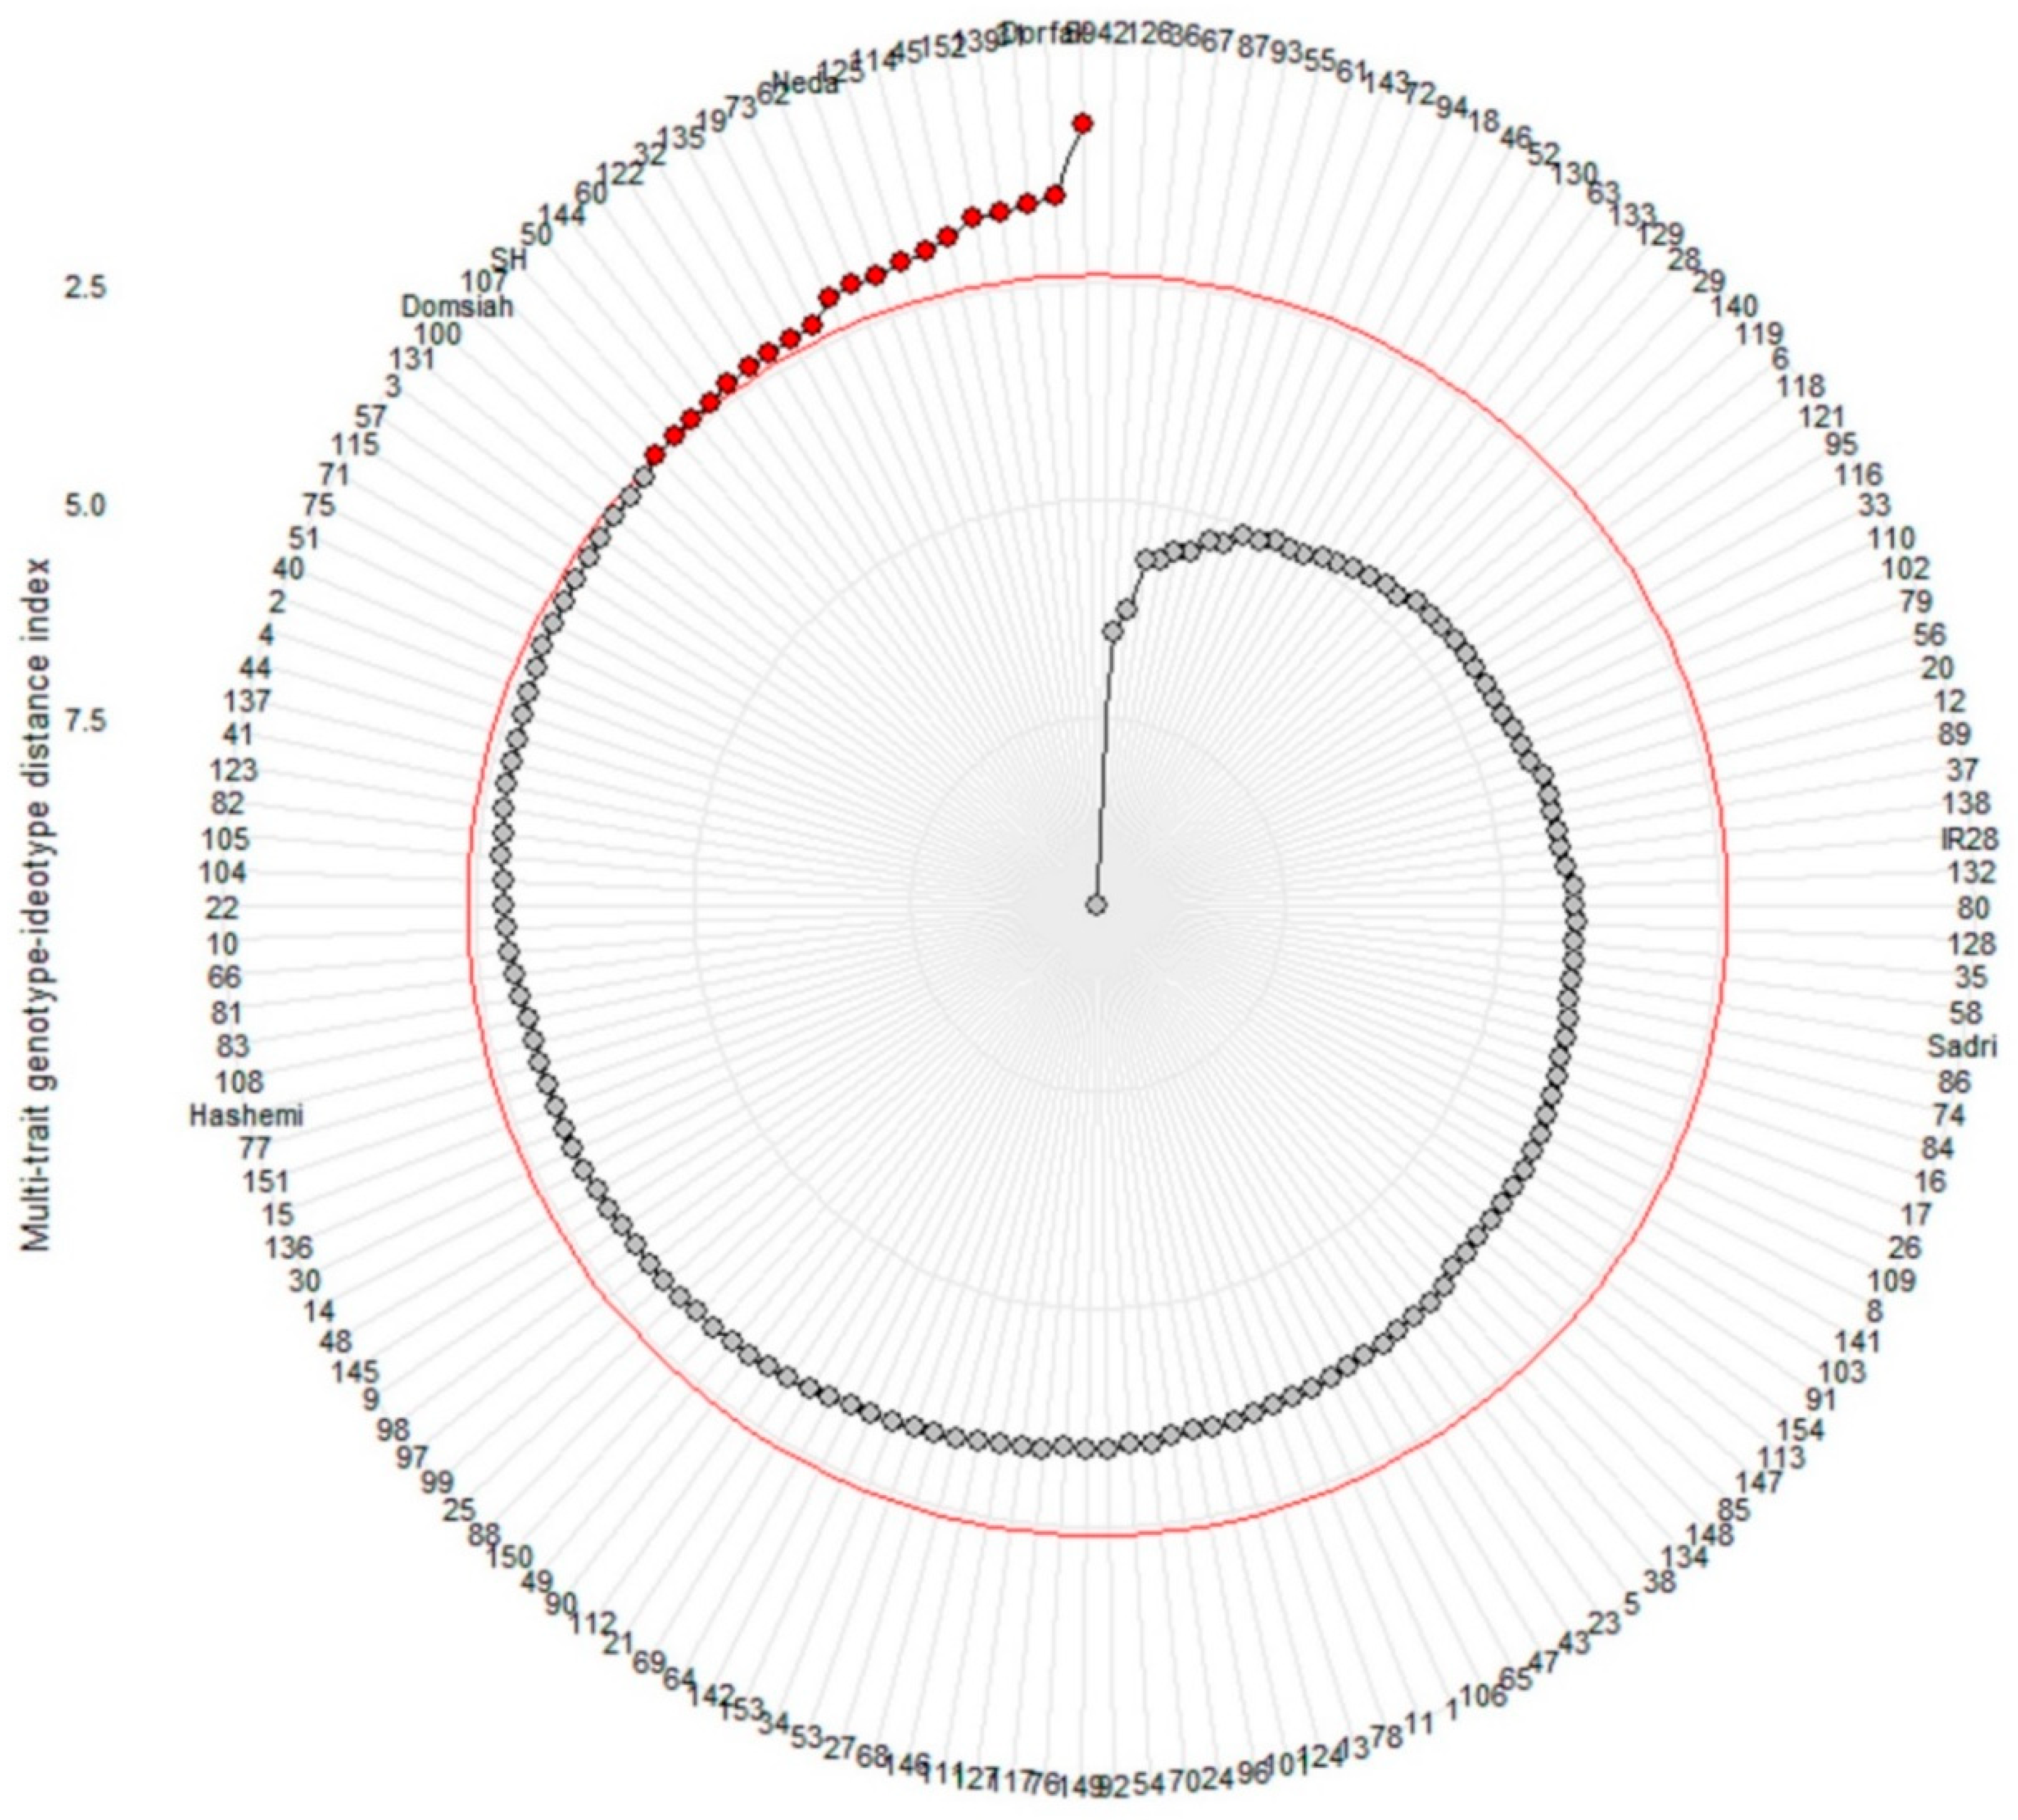
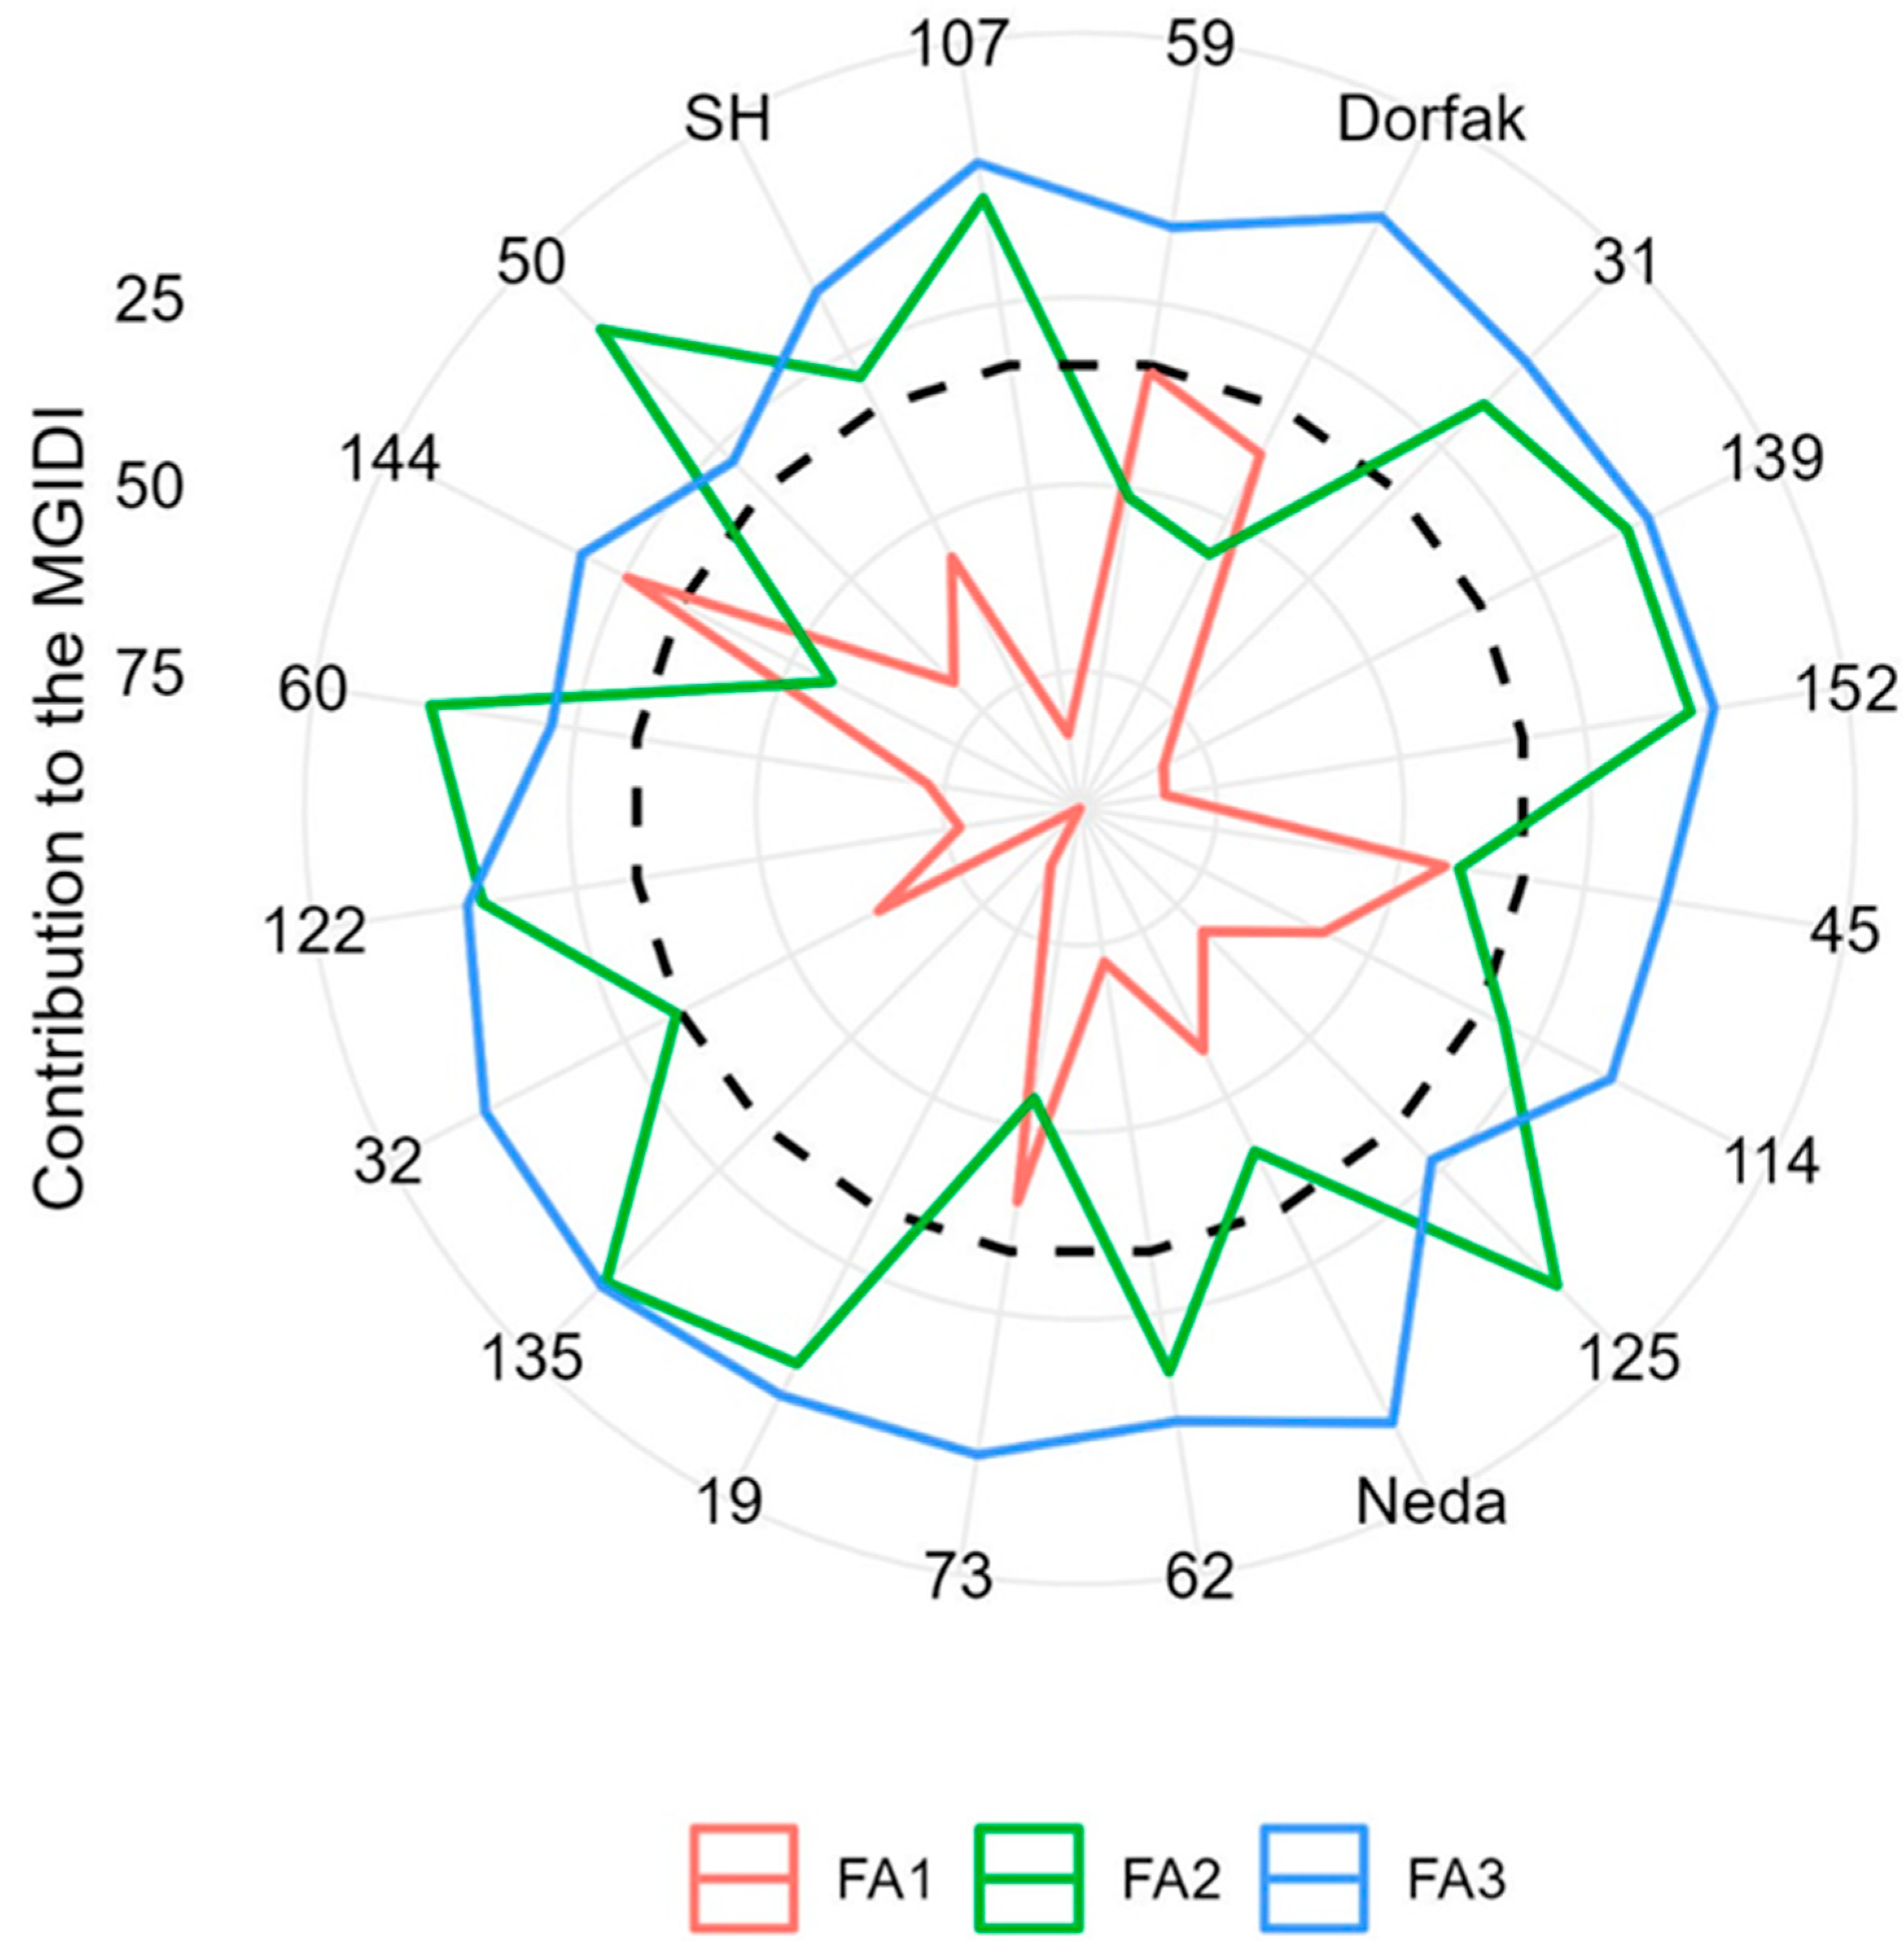
3.2. Selection of Genotypes Based on the MGIDI

The MGIDI was calculated using factor analysis, which reduces data dimensionality and accounts for multicollinearity among traits. Genotypes with lower MGIDI values are considered closer to the ideotype, highlighting the success of the selection process in improving desired traits. The MGIDI identified 17 superior lines and 3 varieties, representing 13% selection pressure among 158 lines/varieties, based on multiple appearance characteristics. The selected 17 RILs and three varieties with the lowest MGIDI values (between 0.70 and 2.41) included the following: 59, Dorfak, 31, 139, 152, 45, 114, 125, Neda, 62, 73, 19, 135, 32, 122, 60, 144, 50, SH, and 107, respectively (Figure 2). These lines/varieties were selected based on a 13% selection intensity, meaning they were among the top 13% of the genotypes regarding their MGIDI values. Line 59 was considered the best due to its lowest MGIDI value (0.70). The graph presented in Figure 2 shows how the appearance and quality of head rice in different lines can be ranked from most desirable to least desirable based on several trait values.
Given that the MGIDI is rooted in factor analysis, we applied this technique to all measured traits. Three factors with eigenvalues exceeding one were retained, collectively explaining 81.11% of the total variance in the dataset. This dimensionality reduction enables the retention of high explanatory power while streamlining the data, ensuring only the most relevant traits are prioritized and minimizing redundancy. By retaining these factors, the analysis balances parsimony with robust interpretability. The 11 traits under study were grouped into the three factors as follows: in the first factor (FA1), the aspect ratio, roundness, and grain width showed negative loadings, while the whole kernel exhibited positive loadings, collectively explaining 32.13% of the phenotypic variation. Correlation analysis revealed a significant negative correlation between roundness and aspect ratio (−0.98 **), and a positive correlation between roundness and grain width (0.76 **). These findings suggest that as the grain roundness increases, the aspect ratio decreases. Moreover, when the aspect ratio increases, the grain becomes less round, making it more desirable for markets that favor elongated rice grains. In the second factor (FA2), traits influenced by area, perimeter, grain length (negative loadings), and chalkiness (positive loadings) accounted for 26.46% of the total variation explained by this factor. This factor is strongly associated with grain size characteristics. The strongest positive correlations were observed between grain length, perimeter, and area, as well as between perimeter and area, confirming the previous results. The third factor (FA3) was positively influenced by mill rate, brown kernel, and red stain, explaining 22.52% of the total variation (Figure 3 and Table 1). Figure 3 also shows a significant negative correlation between the mill rate and the traits of brown kernel and red stain. Furthermore, the positive correlation of chalkiness with grain area and perimeter suggests that larger grains perhaps tend to have higher chalkiness, which can negatively impact consumer preference. The loadings obtained through orthogonal rotation range from −1 to +1 and represent the correlation coefficients between each trait and the respective factor.
The strengths and weaknesses of the lines are presented in Figure 4. The positioning of factors relative to lines indicates their influence, while dotted lines represent the average performance in factor contribution. These lines illustrate the magnitude of each variable’s contribution to the MGIDI of the lines. Factor contributions to MGIDI were categorized as less and more contributing factors. The factors contributing more were positioned closer to the center, whereas less-contributing factors were located towards the edge. Therefore, a lower proportion of the factor explaining the MGIDI means that the traits within this factor are closer to the ideotype (closer to the outer edge) [22]. All 17 lines and the three selected varieties exhibit strengths related to FA3, with genotype differentiation occurring in terms of strength mainly on FA1 and FA2. Lines 50, 60, and 125 have slightly higher strength in FA2 compared to FA3. These three lines showed more remarkable similarity to the ideal genotype in terms of having a larger perimeter, area, and grain length, while exhibiting less chalkiness. Line 144 has more remarkable strengths in FA1 than the other selected lines. These lines showed more significant similarity to the ideal genotype, having grains with a narrower width, lower roundness, higher aspect ratio, and higher proportion of whole kernels.
The heritability (h2) for eight traits exceeds 0.99, while the lowest h2 value was observed in the whole kernel at 0.63 across different lines. High h2 values of the selected traits indicate that the selection gain (SG) of these traits is promising. These traits deserve attention in future studies as they may indicate the quality of different rice lines. The predicted SG presented a favorably increased direction for aspect ratio, area, perimeter, length, mill rate, and whole kernel, with the aspect ratio ranging from 0.12% (mill rate) to 11.30%. It can be concluded that successful selection is achieved when the average of the selected lines in the desired state increases from the initial or original population state. Conversely, a decrease in trait averages indicates successful selection in the opposite direction. In general, the MGIDI provided higher total gains, with 31.69% for traits that increased, and −93.66% for traits that decreased. The selection differentials (SDs) quantify the population’s mean trait value changes between the original population and selected lines. The results of the SD analysis via the MGIDI showed gains in the desired direction for 11 traits, highlighting an SD of 11.37% for the aspect ratio. It is also important to mention that there was an SD of 7.62% for length. Genetic gain analysis based on the MGIDI demonstrated that the MGIDI was the most efficient index for selecting lines with desirable characteristics (Table 2).

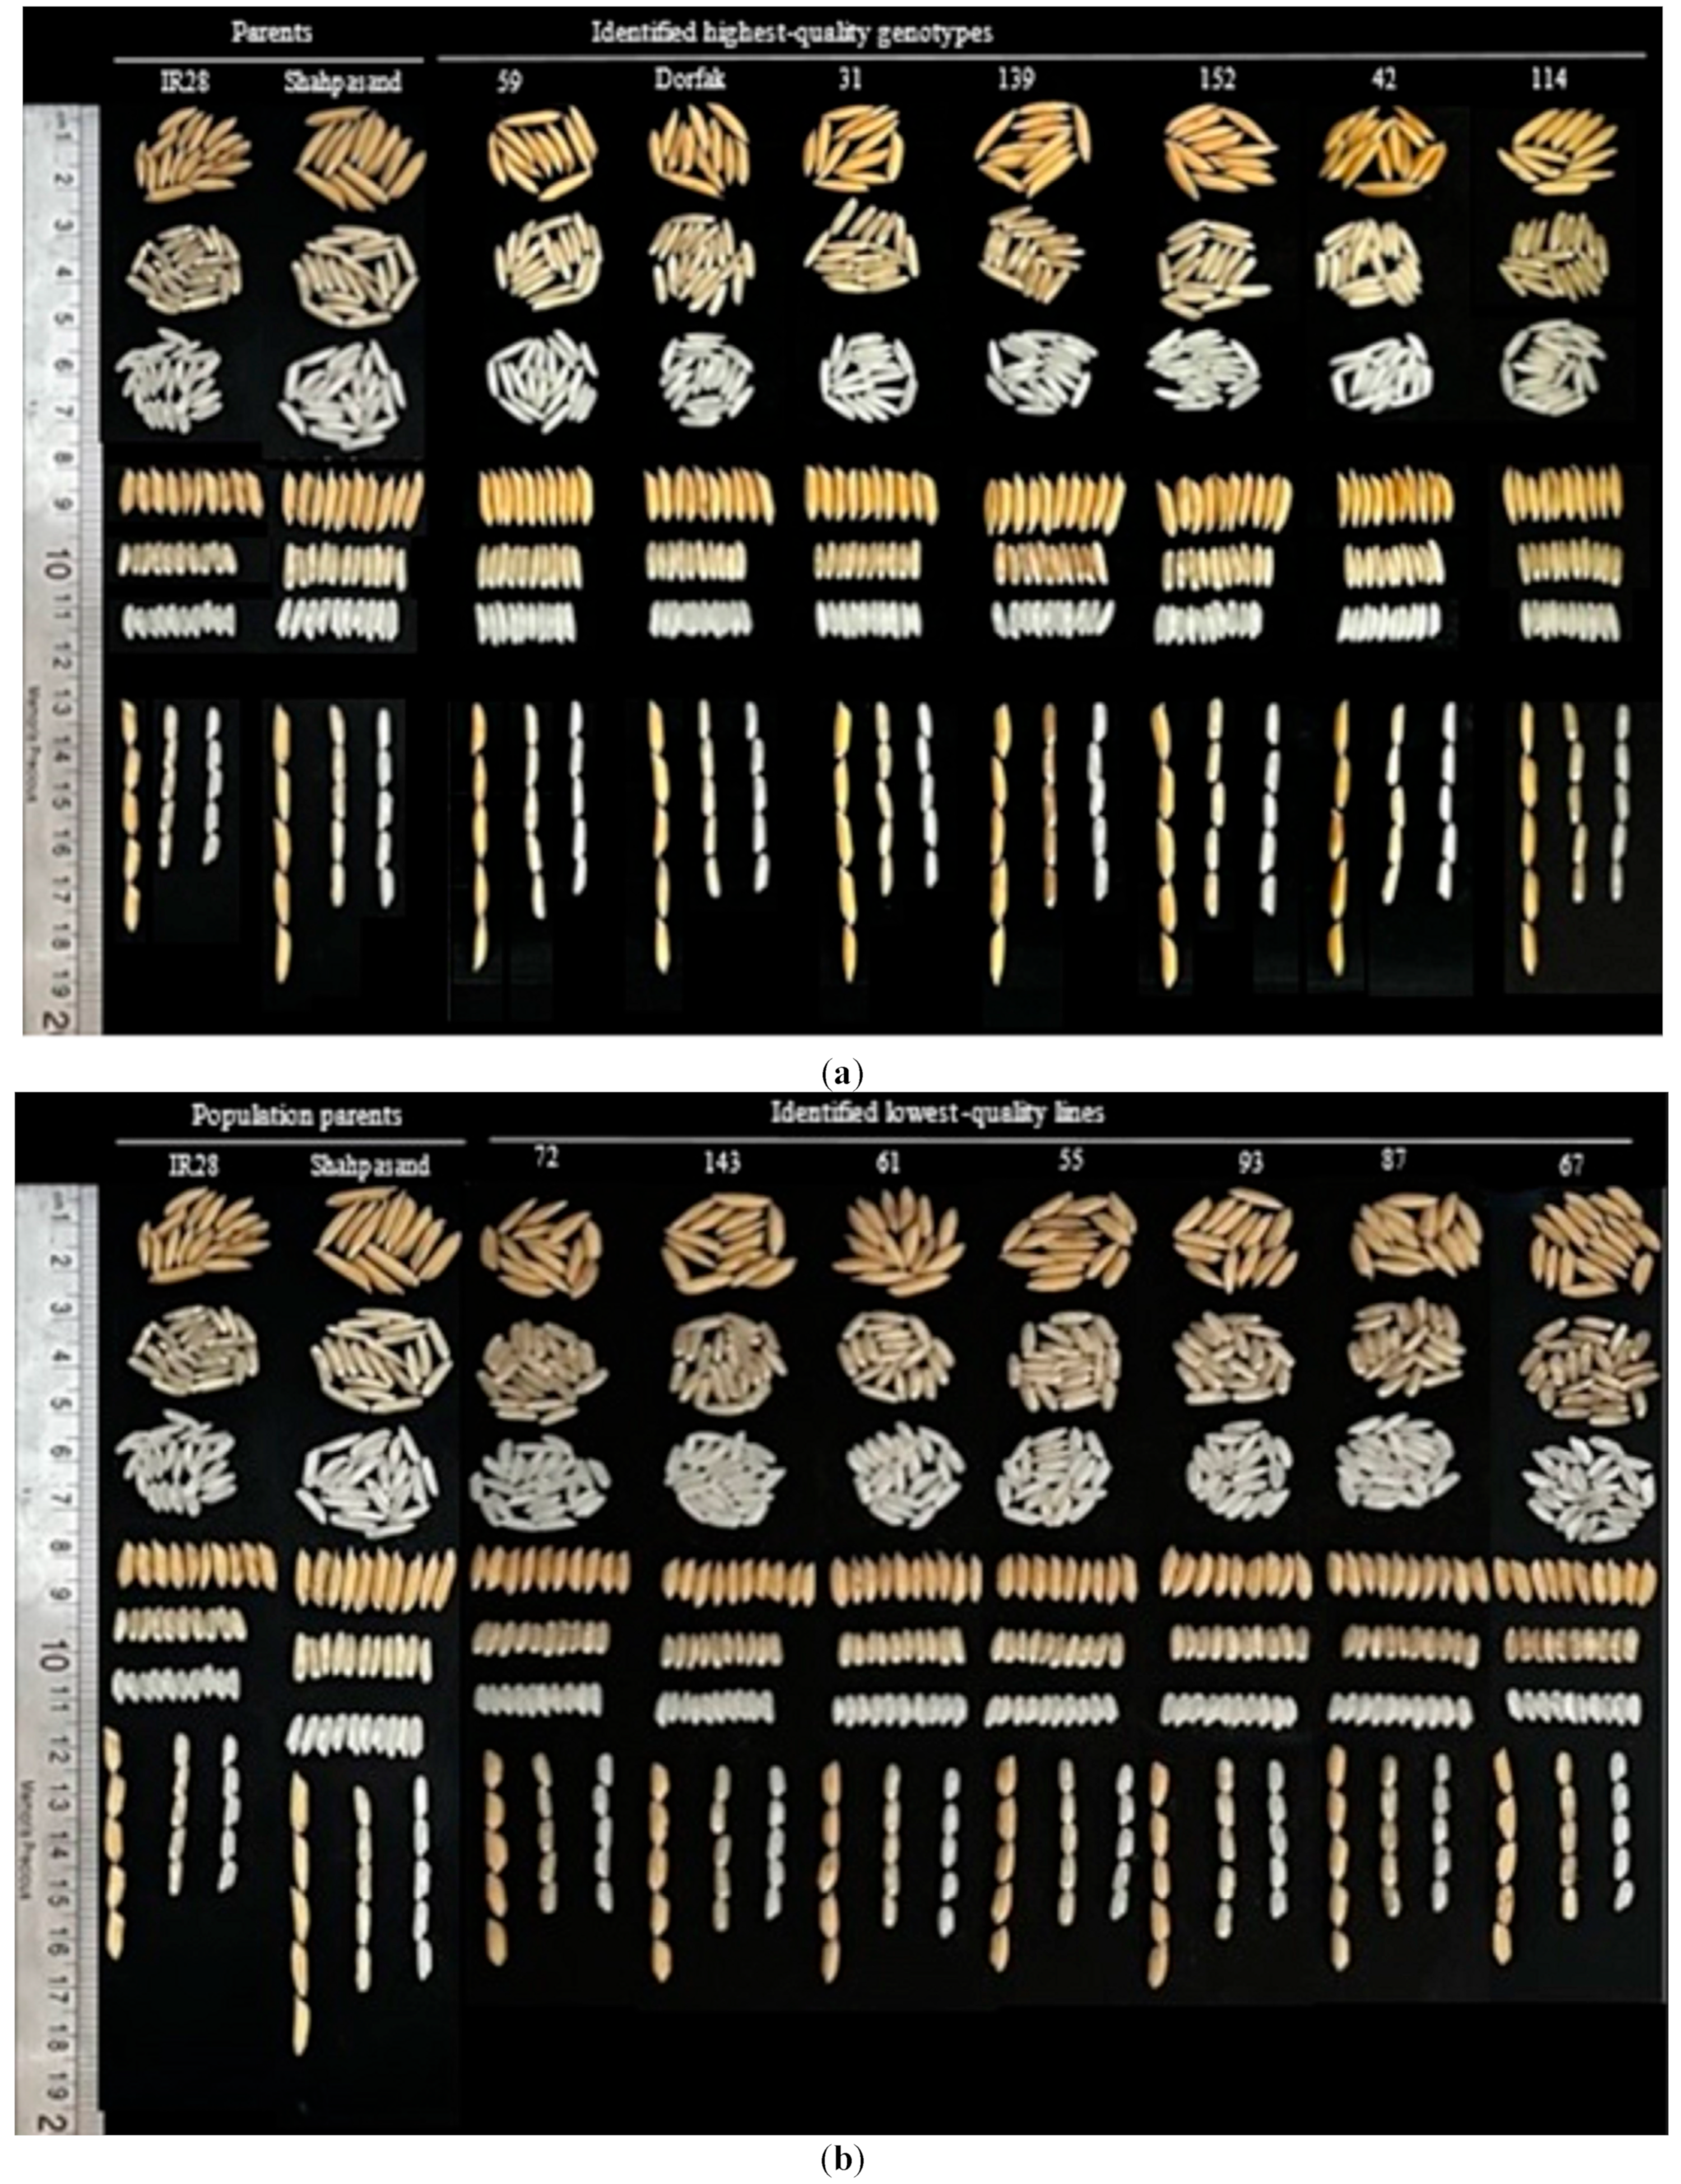
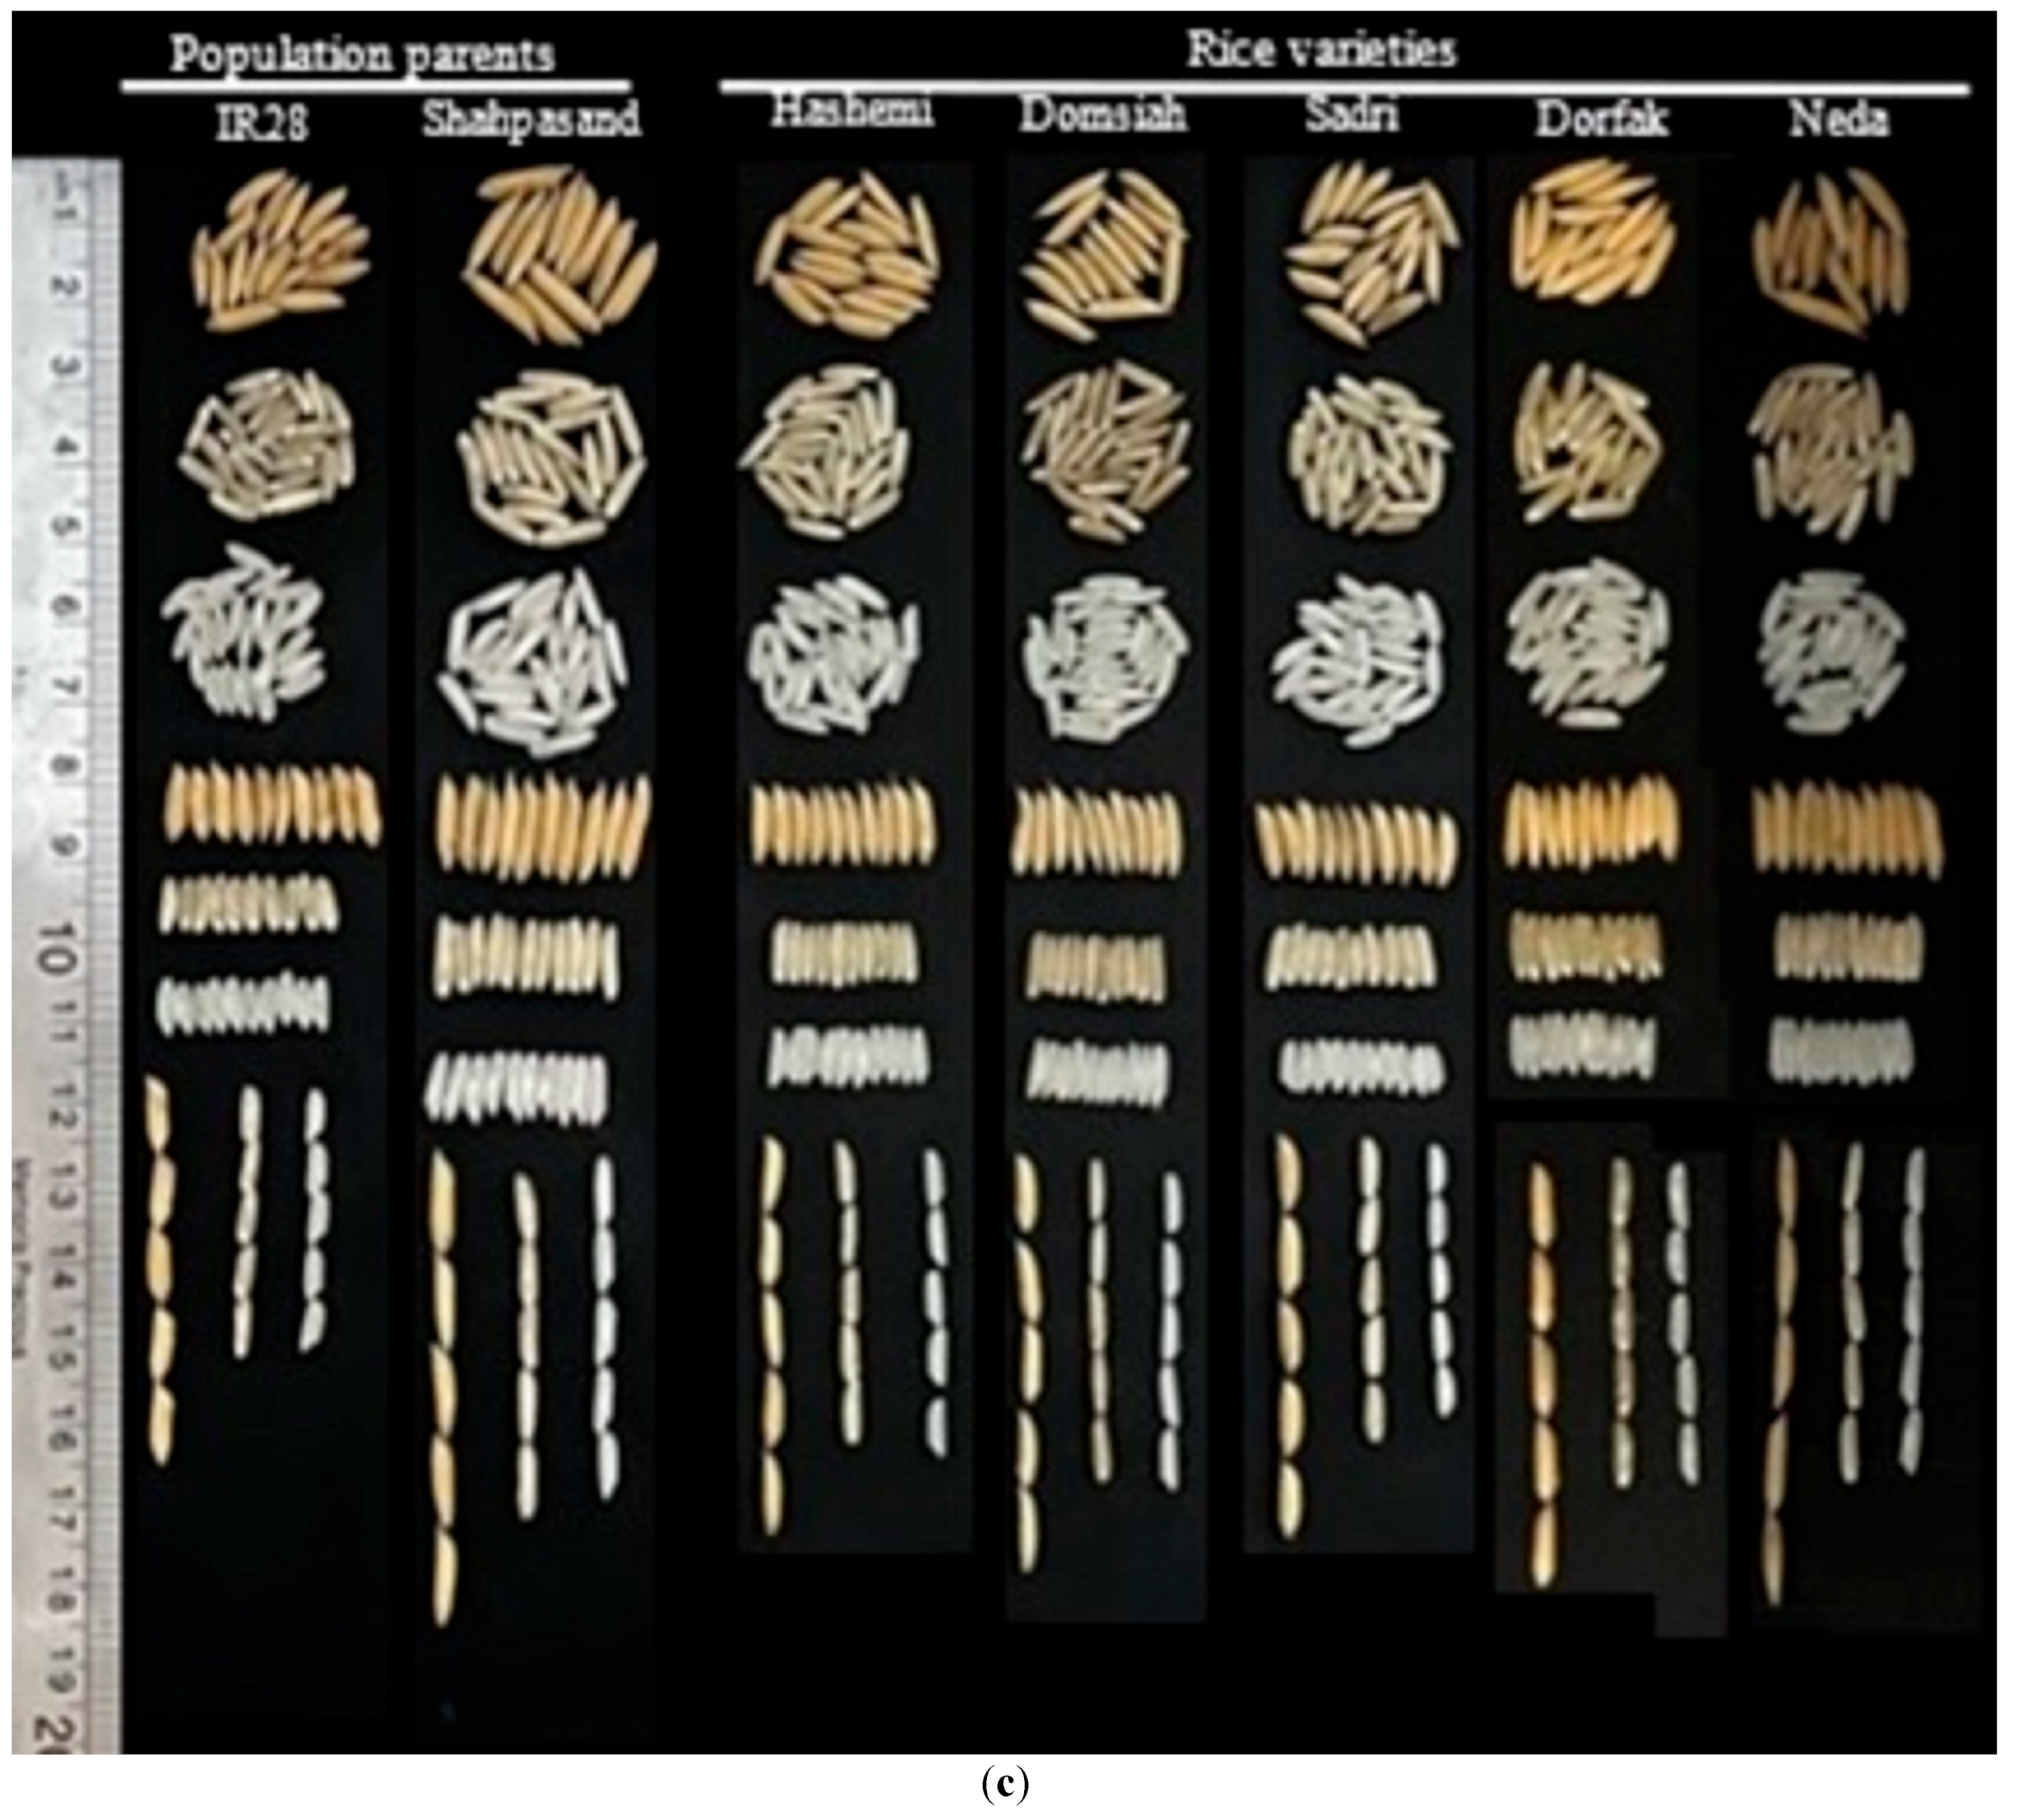
3.3. Comparison of RILs with Varieties and Population Parents

Table 3 presents the mean traits related to appearance quality for the rice RIL population, varieties, selected lines, and parents (IR28 and SH). The analysis shows that the selected lines generally exhibit superior or comparable traits to the varieties and parents, particularly in terms of grain area, perimeter, and length. Among the varieties, Dorfak exhibited the highest quality (Figure 5a–c). These findings highlight the successful selection of desirable traits in the selected lines, demonstrating their potential for superior grain appearance quality.

4. Discussion

To meet consumer expectations and market demands, it is of great importance to develop rice with desirable visual quality, along with increasing product yield [31]. In this research, the quality of grains of 158 rice lines/varieties, including 5 varieties and 151 RILs and their parents, was evaluated. This study focused on the area, perimeter, length, width, aspect ratio, roundness, whole kernels, chalkiness, red stain, mill rate, and brown kernel. The results showed that image processing is an efficient, low-cost, and fast method for analyzing the appearance quality of head rice, consistent with previous research indicating its higher accuracy and speed than those of manual methods [32]. The comparison between the image processing technique and traditional methods highlights several advantages of the former. Conventional methods, involving manual measurements such as using a “Photo enlarger” device and millimeter paper, are time-consuming and prone to human error. In contrast, the image processing technique offers a rapid, automated, and highly accurate alternative [14]. According to our study, processing 420 grains in the same time it takes to measure 15 grains manually represents a significant improvement in efficiency. Additionally, the automated system reduces the potential measurement errors and variability associated with manual methods. Using MATLAB software (MATLAB, Version 2021a, Math-Works, Portola Valley, CA, USA) for image analysis allows for the extraction of detailed and consistent trait data, essential for reliable phenotypic assessments. This method not only accelerates the evaluation process but also enhances measurement precision, making it a valuable tool for rice breeding programs. Future studies should continue to refine this technology to further improve its application in agricultural research.
A key strength of this study is the extensive use of RIL populations, which provide a unique genetic background for selecting high-grain quality lines. Created by crossing two parental lines and undergoing multiple generations of self-pollination, RILs promote gene exchange and result in diverse progeny. This genetic diversity is crucial for identifying offspring with optimal traits from both parents. The single-seed descent (SSD) method enhances this process by producing diverse genetic variations, increasing the chances of transgressive segregation, and facilitating the development of homozygous lines. This careful selection and breeding strategy enables the creation of superior RIL populations with traits superior to those of their parents [33,34]. In this research, it was found that lines 19, 31, 32, 45, 50, 59, 60, 62, 73, 107, 114, 122, 125, 135, 139, 144, and 152, exhibit superior grain quality traits compared to their parents, making them high-quality candidates and indicating transgressive segregation within the current RIL population.
A strong negative correlation (−0.98) was observed between the aspect ratio and grain roundness, indicating that roundness decreases as the aspect ratio increases. It is evident that longer and thinner objects typically have less roundness. On the other hand, the positive correlation between roundness and grain width (0.75) indicates that wider grains tend to be rounder, which may reduce visual attractiveness since round grains are generally less preferred by consumers. Additionally, a positive correlation was observed between grain size and whiteness (0.47), suggesting that larger grains can be chalkier, potentially affecting grain quality. The positive selection differential (SD = 11.37%) for the aspect ratio indicates that selecting this trait improves grain appearance. Furthermore, the length and perimeter also show a positive selection differential (7.62% and 6.40%), indicating an increase in grain size, contributing to a better appearance.
Phenotypic evaluation is the first step in identifying superior genotypes in breeding science, but optimal selection methods are crucial for utilizing these data effectively. In this study, we used the MGIDI, which employs factor analysis. Understanding trait correlations is essential in breeding programs, as highlighted by Krstic et al. [35]. In the present study, the MGIDI effectively utilized factor analysis to maintain these correlations, simplifying complex data into three latent variables representing over 81% of the variance (Table 1). This reduction aids breeders in decision-making by providing precise and multicollinearity-free genotype scores. The Euclidean distance measures how close genotypes are to the ideal, with visual aids like figures and tables demonstrating the index’s practicality. The MGIDI’s strength lies in its ability to discern genotypes with optimal traits and genetic gains, offering breeders a robust tool for selection [36]. This aids breeders by providing clear, multicollinearity-free genotype scores and measures the proximity of genotypes to the ideal using Euclidean distance. The MGIDI, proposed by Olivoto and Nardino [22], addresses multicollinearity issues and selects genotypes closer to the ideal genotype. Lines or varieties with lower MGIDI scores, such as 31, 45, 62, 114, 125, 139, 152, Dorfak, and Neda, exhibited superior appearance traits like aspect ratio, length, and perimeter, and were less chalky. The efficiency of the MGIDI in identifying superior genotypes has been confirmed in various studies, including those on wheat, eggplant, and corn [36,37,38].
This study introduces the novel integration of ML and the MGIDI, significantly enhancing the accuracy and efficiency of rice line selection. While previous studies have utilized either ML-based image classification for grain quality assessment [18,39] or MGIDI for multi-trait selection [22], our study is the first to combine both approaches. This integration enables the automated, high-throughput ranking of lines/varieties based on multiple appearance-related traits, offering a faster, more precise, and comprehensive selection process compared to traditional single-trait or manual methods. Unlike previous ML studies that primarily analyzed perimeter, chalkiness, or basic shape factors [7,40], our research simultaneously evaluated 11 key traits, including aspect ratio, grain width, roundness, whole kernel percentage, chalkiness, red stain, milling rate, area, perimeter, length, and brown kernel. This comprehensive approach improves selection accuracy by capturing multiple quality traits essential for consumer preference and industrial processing.
Consistent with our findings, prior studies have demonstrated the superior performance of ML algorithms over traditional methods in plant phenotyping and classification tasks, particularly in terms of accuracy and scalability [16,17,18,41]. This study demonstrated the effectiveness of the MGIDI, image processing techniques, and the genetic potential of RIL populations in identifying superior lines for breeding programs, making it a valuable tool for improving rice quality.
Future research should extend this ML-MGIDI framework to other cereal crops, and integrate it with genomic and metabolomic datasets for a more refined selection strategy.

5. Conclusions

This study emphasizes that developing rice varieties with preferred appearance quality is a key market demand. The automated system provided precise measurements of multiple traits, with minimal human intervention. The high-resolution images and advanced image processing algorithms ensured consistent and reliable data, crucial for accurate selection and breeding programs. This level of precision and comprehensiveness is not achievable with traditional methods, which are not only slower but also limited in scope and prone to human error. Furthermore, the extensive utilization of RIL populations was highlighted as a significant strength of the study. Seventeen lines were identified as exhibiting superior quality across various traits compared to the high-quality parent (SH). This study utilized the MGIDI as a powerful tool for identifying lines, with better mean performance and desired genetic gain for traits related to appearance quality. Our results demonstrated the effectiveness of the combined image processing technique with the MGIDI for the efficient and accurate selection of superior rice lines within a large breeding population. Future research should focus on integrating genomic selection with machine learning to further enhance selection efficiency and predictive accuracy. By combining high-throughput phenotyping with genomic prediction models, breeders can gain deeper insights into genetic potential while improving selection precision. Additionally, leveraging deep learning for automated trait analysis will streamline feature extraction, making the process more efficient. Expanding these advanced methods to other crops and validating them across diverse environments will be key to ensuring their reliability and broad applicability in modern breeding programs.

Author Contributions

Conceptualization, A.S. and A.B.; methodology, N.F.; formal analysis, A.S., A.B. and N.F.; investigation, N.F. and A.S.; software, A.B. writing—original draft preparation, N.F.; writing—review and editing, A.S., A.B. and A.A.; supervision, A.S. All authors have read and agreed to the published version of the manuscript.

Funding

This research did not receive any external funding.

Institutional Review Board Statement

Not applicable.

Data Availability Statement

All datasets generated for this study are available within the article, Tables, and Figures provided.

Acknowledgments

The authors express their gratitude to the University of Guilan for their support of this research. They would also like to acknowledge the Research Core of Seed Production and Processing of Agronomic, Horticultural, and Medicinal Plants at the University of Guilan for providing spiritual support.

Conflicts of Interest

The authors declare that there are no conflicts of interest.

References

  1. Shah, M.A.; Sunooj, K.V.; Mir, S.A. Cereal-Based Food Products; Springer Nature: Cham, Switzerland, 2023. [Google Scholar] [CrossRef]
  2. Cordero-Lara, K.I. Temperate japonica rice (Oryza sativa L.) breeding: History, present and future challenges. Chil. J. Agric. Res. 2020, 80, 303–314. [Google Scholar] [CrossRef]
  3. Ren, Z.W.; Kopittke, P.M.; Zhao, F.J.; Wan, G.P. Nutrient accumulation and transcriptome patterns during grain development in rice. J. Exp. Bot. 2023, 74, 909–930. [Google Scholar] [CrossRef] [PubMed]
  4. Li, P.; Chen, Y.H.; Lu, J.; Zhang, C.Q.; Liu, Q.Q.; Li, Q.F. Genes and their molecular functions determining seed structure, components, and quality of rice. Rice 2022, 15, 18. [Google Scholar] [CrossRef]
  5. Bao, J. Genes and QTLs for Rice Grain Quality Improvement. In Genes and QTLs for Rice Grain Quality Improvement; IntechOpen: London, UK, 2014; Volume 9, pp. 239–278. [Google Scholar] [CrossRef]
  6. Li, N.; Xu, R.; Li, Y. Molecular networks of seed size control in plants. Annu. Rev. Plant Biol. 2019, 70, 435–463. [Google Scholar] [CrossRef]
  7. Lee, J.H.; Seo, J.; Lar, S.M.; Jang, S.G.; Zhang, H.; Lee, A.R.; Kwon, S.W. QTL analysis of rice grain size using segregating populations derived from the large grain line. Agriculture 2021, 11, 565. [Google Scholar] [CrossRef]
  8. Septiningsih, E.M.; Prasetiyono, J.; Lubis, E.; Tai, T.H.; Tjubaryat, T.; Moeljopawiro, S.; McCouch, S.R. Identification of quantitative trait loci for yield and yield components in an advanced backcross population derived from the Oryza sativa variety IR64 and the wild relative O. rufipogon. Theor. Appl. Genet. 2003, 107, 1419–1432. [Google Scholar] [CrossRef]
  9. Fitzgerald, M.A.; McCouch, S.R.; Hall, R.D. Not just a grain of rice: The quest for quality. Trends Plant Sci. 2009, 14, 133–139. [Google Scholar] [CrossRef]
  10. Zhao, M.; Wang, Y.; He, N.; Pang, X.; Wang, L.; Ma, Z.; Zheng, W. QTL Detection for Rice Grain Length and Fine Mapping of a Novel Locus qGL6. 1. Rice 2022, 15, 60. [Google Scholar] [CrossRef]
  11. Huang, M.; Cao, J.; Liu, Y.; Zhang, M.; Hu, L.; Xiao, Z.; Cao, F. Low-temperature stress during the flowering period alters the source–sink relationship and grain quality in field-grown late-season rice. J. Agron. Crop. Sci. 2021, 207, 833–839. [Google Scholar] [CrossRef]
  12. Yasmin, J.; Lohumi, S.; Ahmed, M.R.; Kandpal, L.M.; Faqeerzada, M.A.; Kim, M.S.; Cho, B.K. Improvement in purity of healthy tomato seeds using an image-based one-class classification method. Sensors 2020, 20, 2690. [Google Scholar] [CrossRef]
  13. Aznan, A.; Viejo, C.G.; Pang, A.; Fuentes, S. Review of technology advances to assess rice quality traits and consumer perception. Food Res. Int. 2023, 172, 113105. [Google Scholar] [CrossRef] [PubMed]
  14. Payman, S.H.; Bakhshipour, A.; Zareiforoush, H. Development of an expert vision-based system for inspecting rice quality indices. Qual. Assur. Saf. Crops Foods 2018, 10, 103–114. [Google Scholar] [CrossRef]
  15. Yashaswini, S.; Dubey, P.; Kumar, S.R. Rice Quality Analysis Based on Physical Attributes Using Image Processing and Machine Learning. In Proceedings of the International Conference on Advances in Electronics, Communication, Computing and Intelligent Information Systems (ICAECIS), Bangalore, India, 19–21 April 2023; pp. 400–405. [Google Scholar] [CrossRef]
  16. Das Choudhury, S.; Samal, A.; Awada, T. Leveraging image analysis for high-throughput plant phenotyping. Front. Plant Sci. 2019, 10, 436562. [Google Scholar] [CrossRef]
  17. Aznan, A.; Gonzalez Viejo, C.; Pang, A.; Fuentes, S. Rapid assessment of rice quality traits using low-cost digital technologies. Foods 2022, 11, 1181. [Google Scholar] [CrossRef]
  18. Kurade, C.; Meenu, M.; Kalra, S.; Miglani, A.; Neelapu, B.C.; Yu, Y.; Ramaswamy, H.S. An automated image processing module for quality evaluation of milled rice. Foods 2023, 12, 1273. [Google Scholar] [CrossRef]
  19. Pour-Aboughadareh, A.; Koohkan, S.; Zali, H.; Marzooghian, A.; Gholipour, A.; Kheirgo, M.; Askari-Kelestani, A. Identification of high-yielding genotypes of barley in the warm regions of Iran. Plants 2023, 12, 3837. [Google Scholar] [CrossRef]
  20. Olivoto, T.; Licio, A.D.C.; da Silva, J.A.G.; Marchioro, V.S.; de Souza, V.Q.; Jost, E. Mean performance and stability in multi-environment trials I: Combining features of AMMI and BLUP techniques. Agronomy 2019, 111, 2949–2960. [Google Scholar] [CrossRef]
  21. Olivoto, T.; Lucio, A.D. metan: An R package for multi-environment trial analysis. Methods Ecol. Evol. 2020, 11, 783–789. [Google Scholar] [CrossRef]
  22. Olivoto, T.; Nardino, M. MGIDI: Toward an effective multivariate selection in biological experiments. Bioinformatics 2021, 37, 1383–1389. [Google Scholar] [CrossRef]
  23. Pour-Aboughadareha, A.; Poczaib, P. Dataset on the use of MGIDI index in screening drought -tolerant wild wheat accessions at the early growth stage. Data Brief 2021, 36, 107596. [Google Scholar] [CrossRef]
  24. Pour-Aboughadareha, A.; Poczaib, P. A dataset on multi -trait selection approaches for screening desirable wild relatives of wheat. Data Brief 2021, 39, 107541. [Google Scholar] [CrossRef] [PubMed]
  25. Food and Agriculture Organization of the United Nations (FAO). Iran (Islamic Republic of). Available online: https://openknowledge.fao.org/server/api/core/bitstreams/392ee95b-6852-42cd-a8ec-1a8d8ad6eaf8/content/y4347e0y.htmk (accessed on 11 February 2024).
  26. Sabouri, A.; Dadras, A.R.; Azari, M.; Saberi Kouchesfahani, A.; Taslimi, M.; Jalalifar, R. Screening of rice drought-tolerant lines by introducing a new composite selection index and competitive with multivariate methods. Sci. Rep. 2022, 12, 2163. [Google Scholar] [CrossRef] [PubMed]
  27. Khush, G.S.; Virk, P.S. IR Varieties and Their Impact; International Rice Research Institute (IRRI): Los Baños, Philippines, 2005. [Google Scholar]
  28. Biró, L.; Kozma-Bognár, V.; Berke, J. Comparison of RGB Indices used for Vegetation Studies based on Structured Similarity Index (SSIM). J. Plant Sci. Phytopathol. 2024, 8, 007–012. [Google Scholar] [CrossRef]
  29. Momin, M.A.; Rahman, M.T.; Sultana, M.S.; Igathinathane, C.; Ziauddin, A.T.M.; Grift, T.E. Geometry-based mass grading of mango fruits using image processing. Inf. Process. Agric. 2017, 4, 150–160. [Google Scholar] [CrossRef]
  30. R Core Team. R: A Language and Environment for Statistical Computing; R Foundation for Statistical Computing: Vienna, Austria, 2021; Available online: https://www.rproject.org (accessed on 16 June 2024).
  31. Selvaraj, R.; Singh, A.K.; Singh, V.K.; Abbai, R.; Habde, S.V.; Singh, U.M. Superior haplotypes towards development of low glycemic index rice with preferred grain and cooking quality. Sci. Rep. 2021, 11, 10082. [Google Scholar] [CrossRef]
  32. Sandiya, M.; Christy, S. Estimation of Varietal Classification and Quality Analysis in Rice Seeds Using Digital Image Processing—A Survey. In Proceedings of the International Conference on Res Methodologies in Knowledge Management, Artificial Intelligence and Telecommunication Engineering (RMKMATE), Chennai, India, 1–2 November 2023; pp. 1–5. [Google Scholar] [CrossRef]
  33. Hu, J.; Wang, X.; Zhang, G.; Jiang, P.; Chen, W.; Hao, Y.; Ma, X.; Xu, S.; Jia, J.; Kong, L.; et al. QTL mapping for yield-related traits in wheat based on four RIL populations. Theor. Appl. Genet. 2020, 133, 917–933. [Google Scholar] [CrossRef]
  34. Jalalifar, R.; Sabouri, A.; Mousanejad, S.; Dadras, A.R. Estimation of genetic parameters and identification of leaf blast-resistant rice RILs using cluster analysis and MGIDI. Agronomy 2023, 13, 2730. [Google Scholar] [CrossRef]
  35. Krstic, M.; Mladenov, V.; Cuk, N.; Ovuka, J.; Gvozdenac, S.; Krstic, J.; Miklic, V. Agro-morphological traits of inbred sunflower lines and their genetic assessment. Contemp. Agric. 2022, 71, 87–95. [Google Scholar] [CrossRef]
  36. Singamsetti, A.; Zaidi, P.H.; Seetharam, K.; Vinayan, M.T.; Olivoto, T.; Mahato, A.; Madankar, K.; Kumar, M.; Shikha, K. Genetic gains in tropical maize hybrids across moisture regimes with multi-trait-based index selection. Front. Plant Sci. 2023, 14, 1147424. [Google Scholar] [CrossRef]
  37. Silva, C.M.; Mezzomo, H.C.; Ribeiro, J.P.O.; de Freitas, D.S.; Nardino, M. Multi-trait selection of wheat lines under drought-stress condition. Bragantia 2023, 82, e20220254. [Google Scholar] [CrossRef]
  38. Alexandru, A.M.; Mihai, G.; Stoica, E.; Curtu, A.L. Multi-trait selection and stability in Norway Spruce (Picea abies) provenance trials in Romania. Forests 2023, 14, 456. [Google Scholar] [CrossRef]
  39. Son, N.H.; Thai-Nghe, N. Deep Learning for Rice Quality Classification. In Proceedings of the 2019 International Conference on Advanced Computing and Applications (ACOMP), Nha Trang, Vietnam, 26–28 November 2019; pp. 92–96. [Google Scholar] [CrossRef]
  40. Misra, G.; Anacleto, R.; Badoni, S.; Butardo, V.; Molina, L.; Graner, A. Dissecting the genome-wide genetic variants of milling and appearance quality traits in rice. J. Exp. Bot. 2019, 70, 5115–5130. [Google Scholar] [CrossRef] [PubMed]
  41. Çınarer, G.; Erbaş, N.; Öcal, A. Rice classification and quality detection success with artificial intelligence technologies. Braz. Arch. Biol. Technol. 2024, 67, e24220754. [Google Scholar] [CrossRef]
Figure 1. Flowchart of the main steps of rice image segmentation and feature extraction.
Agriculture 15 00615 g001
Figure 2. Rice line/variety ranking in ascending order for the multi-trait genotype ideotype distance index (MGIDI). The selected lines/varieties are shown as red dots, while the unselected lines are in black circles. The red circle represents the cut-off point based on the selection intensity (13%).
Agriculture 15 00615 g002
Figure 3. Pearson’s correlation coefficient matrix for 11 grain quality traits in rice lines.
Agriculture 15 00615 g003
Figure 4. Strengths and weaknesses view of the quality traits of the rice lines. The dashed black line represents the overall average contribution of all factors, serving as a reference to visualize deviations in strengths and weaknesses among the rice lines.
Agriculture 15 00615 g004
Figure 5. (a) Comparison of head rice appearance quality between the population parents (IR28 and Shahpasand (SH)) and the identified highest-quality lines/varieties in the population. (b) Comparison of head rice appearance quality between the population parents (IR28 and Shahpasand (SH)) and the identified lowest-quality lines. (c) Comparison of head rice appearance quality between parents (IR28 and Shahpasand (SH)) and the different varieties.
Agriculture 15 00615 g005aAgriculture 15 00615 g005b
Table 1. Explained variance, eigenvalues, factorial loadings after varimax rotation, and communalities estimated in the factor analysis.
TraitsFA1FA2FA3CommunalityUniquenesses
Area0.08−0.98−0.0250.960.038
Perimeter−0.44−0.880.030.980.02
Length−0.60−0.800.040.990.01
Width−0.770.600.050.960.04
Aspect ratio−0.98−0.090.070.980.02
Roundness−0.98−0.070.090.980.02
Whole kernel0.250.010.150.080.92
Chalkiness−0.300.62−0.010.470.53
Red stain0.03−0.040.810.670.33
Mill rate−0.050.020.960.930.07
Brown kernel−0.010.010.960.910.09
Eigenvalue3.532.912.48
Variance (%)32.1326.4622.52
Cumulative (%)32.1358.5981.11
Table 2. The predicted selection differentials, goals, and selection gains for traits related to appearance quality in the multi-trait genotype ideotype distance index (MGIDI) analysis for the rice recombinant inbred line population and different varieties.
TraitsFactorGoalXoXsSDSD%h2SGSG%
WidthFA1decrease2.272.19−0.08−3.530.99−0.08−3.50
Aspect ratioFA1increase3.163.520.3611.370.990.3611.30
RoundnessFA1decrease0.330.29−0.03−9.570.99−0.03−9.52
Whole kernelFA1increase0.950.94−0.01−1.100.63−0.007−0.69
AreaFA2increase12.9213.560.644.980.990.644.95
PerimeterFA2increase16.1617.191.036.400.991.036.35
LengthFA2increase7.137.670.547.620.990.547.57
ChalkinessFA2decrease14.2714.48−0.021.420.990.201.40
Red stainFA3decrease0.070.05−0.02−32.080.72−0.02−23.11
Mill rateFA3increase99.8199.940.130.130.930.120.12
Brown kernelFA3decrease0.010.002−0.004−65.270.87−0.003−56.84
Total (Increase) 31.69
Total (Decrease) −93.66
Xo: The original population mean. Xs: the mean of selected lines/varieties; SD and SD%: the selection differential and selection differential in percentage, respectively; h2: the broad-sense heritability after selection; SG and SG%: the selection gains and selection gains in percentage, respectively.
Table 3. The mean of traits related to grain appearance quality in the rice RIL population, varieties, selected lines/varieties, and parents of the population.
TraitSelected Line/Variety MeanRIL MeanRILs MinRILs MaxVarietiesParents
DorfakNedaHashemiDomsiahSadriSHIR28
Area (mm2)13.4912.949.6115.6512.6012.9212.2511.4511.0015.1911.96
Perimeter (mm)17.1316.1614.1418.4016.9216.7616.0516.1814.7618.1615.35
Length (mm)7.657.126.288.157.657.517.147.356.548.046.71
Width (mm)2.192.281.882.642.042.122.161.952.152.362.28
Aspect ratio3.563.152.623.973.763.553.323.793.053.432.96
Roundness0.290.330.270.390.280.290.310.270.330.300.34
Whole kernel0.930.950.820.990.950.970.990.930.840.970.98
Chalkiness (%)14.2414.560.2244.748.546.324.341.222.7426.017.07
Red stain (%)0.060.080.000.800.010.000.0120.080.000.070.02
Mill rate (%)99.8699.8195.63100.00100.00100.00100.0099.78100.0099.8899.88
Brown kernel0.000.010.000.150.000.000.000.010.000.070.01
Disclaimer/Publisher’s Note: The statements, opinions and data contained in all publications are solely those of the individual author(s) and contributor(s) and not of MDPI and/or the editor(s). MDPI and/or the editor(s) disclaim responsibility for any injury to people or property resulting from any ideas, methods, instructions or products referred to in the content.

