Article

Evaluation of Environmental Quality in Northern Winter Fattening Pig Houses Based on AHP-EWM

1
College of Animal Science and Technology, Jilin Agricultural University, Changchun 130118, China
2
College of Engineering and Technology, Jilin Agricultural University, Changchun 130118, China
*
Author to whom correspondence should be addressed.
Agriculture 2025, 15(6), 584; https://doi.org/10.3390/agriculture15060584
Submission received: 27 January 2025 / Revised: 6 March 2025 / Accepted: 7 March 2025 / Published: 10 March 2025
(This article belongs to the Section Farm Animal Production)

Abstract

:
The interior of a pigsty is a nonlinear system formed by multiple interacting environmental factors, making it challenging to reasonably and accurately assess the environmental comfort levels. To address this, we propose an environmental comfort evaluation index based on livestock farming standards. By combining the analytic hierarchy process (AHP) and entropy weight method (EWM), we determine the weights of each evaluation index. Finally, the evaluation results are visualized using radar charts, and the model is validated. We apply this model to monitor and analyze environmental factors in a fattening pigsty at a farm in Central Jilin Province. The results demonstrate that the AHP-EWM multi-factor comprehensive evaluation method effectively reflects overall environmental comfort variations in the pigsty and captures interactions among environmental factors across different time periods. This study establishes a methodological foundation for comprehensive pigsty environmental assessment, precision control, and enhanced environmental comfort.

1. Introduction

With the advancement of large-scale production in the pig farming industry, environmental conditions in pigsties have garnered increasing attention [1,2]. The pigsty environment encompasses critical factors, such as temperature, relative humidity, air velocity, and concentrations of harmful gases (e.g., carbon dioxide (CO2), ammonia (NH3), hydrogen sulfide (H2S), and volatile organic compounds (VOCs)). Temperature plays a pivotal role in pigsty environments. Excessively high temperatures impede timely heat dissipation from pigs’ bodies, resulting in elevated core body temperatures. Conversely, excessively low temperatures beyond the pigs’ thermoregulatory capacity lead to hypothermia [3]. Humidity, another vital parameter, primarily influences evaporative heat loss. Higher humidity levels hinder evaporative cooling, whereas lower humidity facilitates heat dissipation by accelerating moisture evaporation from the pigs’ bodies [4]. Ventilation effectively removes surplus heat and moisture from pigsties while maintaining air quality. Harmful gases, such as NH3, CO2, and H2S, adversely affect pig health, productivity, and disease susceptibility [5]. Consequently, evaluating pigsty environmental quality is essential for the industry, as it directly impacts animal welfare, production efficiency, and farm sustainability.
The environmental conditions within a pigsty are determined by the interplay of multiple interacting factors. Through systematic assessment and proactive management, it is possible to regulate critical parameters, such as temperature, relative humidity, ammonia (NH3) concentration, carbon dioxide (CO2) concentration, and other variables. This approach mitigates the risk of respiratory diseases and limits the transmission of health-related complications [6]. The current methods for evaluating the environmental quality of pigsties include air quality evaluation, temperature and humidity evaluation, thermal environment evaluation, and evaluation of the pigsty structure and site [7,8,9,10]. For example, Anthony et al. [11] evaluated pigsty air quality by monitoring carbon dioxide (CO2) concentrations. Zhu Jiaming et al. [12] employed Pearson correlation analysis and developed a multivariate time-series prediction network (DDGCRN model) based on graph convolutional networks (GCNs) to assess temperature and humidity in farming environments. Shin H. et al. [13] established a predictive mechanical ventilation model using the indoor temperature and CO2 concentration as key parameters, enabling on-demand ventilation control and subsequent evaluation of pigsty environmental comfort. However, these studies neglected the effects of harmful gases, such as ammonia (NH3) and hydrogen sulfide (H2S), on environmental comfort. Buoio E. et al. [14] highlighted the acute toxicity of pollutants in livestock housing. Through investigations into air pollutant impacts on animal welfare, they demonstrated the necessity of incorporating harmful gas monitoring in farm air quality assessments. Nevertheless, their work omitted analysis of thermal environment influences. Chen Chong et al. [15] proposed a sow housing comfort prediction model (MSCCS-LSSVR) using a scale-variable chaotic cuckoo algorithm-optimized hybrid kernel least squares support vector regression, focusing on air quality evaluation. However, this model disregarded temperature and humidity effects on environmental suitability. These studies utilized limited environmental factors as evaluation metrics, failing to comprehensively analyze multi-factor interactions or decode the complex relationships among environmental parameters, thereby restricting their capacity to reveal systemic environmental dynamics.
Methods for determining the weights of environmental factors in swine building environmental evaluation have been extensively explored and implemented in both theoretical and practical contexts. Subjective approaches, such as the Delphi method, analytic hierarchy process (AHP), and basic scoring method, rely on expert judgment or evaluator preferences. Objective techniques include principal component analysis (PCA) and the entropy weight method (EWM), among others [16,17,18,19,20,21,22]. However, due to the inherent complexities of livestock housing environments, such as multivariable interactions, nonlinear dynamics, coupling effects, and time delays, the application of a single methodology often encounters challenges, including time-consuming processes, high costs, subjective biases, data dependency, and restrictive assumptions. To address these limitations, this study adopted an integrated AHP-EWM framework to determine the environmental parameter weights. This hybrid approach not only corrects subjective deviations in weight allocation but also reduces reliance on data distribution assumptions. Furthermore, it enhances robustness against uncertainty while minimizing dependency on dataset size [23,24,25,26]. By synergistically leveraging the strengths of both methods and mitigating their individual limitations, the proposed framework improves the objectivity and flexibility of comprehensive analyses. This integration supports more informed and holistic decision-making, thereby better accommodating the demands of multidimensional environmental parameter analysis in pigsty environments.
Therefore, this study focuses on the pigsty as the experimental subject, with temperature, relative humidity, air velocity, CO2 concentration, and NH3 concentration as the key parameters. To address the limitations of single-factor analyses, the AHP-EWM comprehensive evaluation is employed as the methodological framework to assess environmental comfort levels in pigsties. The objectives are to provide decision support for precise environmental control in pigsties and establish a theoretical foundation and scientific methodology for optimizing livestock environmental management and advancing sustainable agricultural practices.

2. Materials and Methods

2.1. Test Site and Experimental Design

The experimental piggery is situated at an intensive swine production facility in Jilin Province, China, which experiences a temperate continental monsoon climate with hot–humid summers and cold–arid winters. The facility operates as an integrated breeding–fattening system under standardized intensive management practices. This study utilized a representative piggery measuring 22 m (L) × 10 m (W) × 3 m (H), featuring a double-row pen configuration bisected by a 2 m wide central longitudinal aisle. This layout partitions the space into 14 enclosures (2.5 m × 4 m each), separated by 1.2 m high brick concrete walls (120 mm thickness). The aisle perimeter is enclosed with galvanized steel pipes (30 mm diameter, 3 mm wall thickness). Each pen housed eight crossbred Duroc × Landrace × Yorkshire finishing pigs (mean body weight: 75 kg), totaling 112 animals. Natural ventilation was maintained through two roof-mounted apertures (350 mm diameter). Ad libitum feeding and watering were provided, with manual manure removal conducted twice daily (morning and evening), perform manure removal one hour after feeding. The heating systems remained deactivated throughout the trial period. The architectural specifications and material compositions are detailed in Figure 1 and Table 1.
The environmental parameters within the experimental pigpen—including temperature, relative humidity, CO2 concentration, NH3 concentration, and air velocity—were continuously monitored at 5 min intervals from 23–28 December 2023. The sensor array comprised integrated temperature–humidity sensors, non-dispersive infrared CO2 sensors, electrochemical NH3 sensors, and ultrasonic anemometers. The temperature–humidity and CO2 sensors were positioned at Location ②, with dual measurement heights of 0.4 m (floor level) and 1.6 m (breathing zone) along the central aisle axis. The anemometer was installed at Location ① (1.6 m height), while the NH3 sensor occupied Location ③ (0.4 m height). All instruments were mounted on vertical poles under static conditions, with data logging initiated following a 1 min stabilization period to ensure measurement validity.

2.2. Test Equipment

This study used temperature and relative humidity, air velocity, CO2, and NH3 sensors from the brand “Jianda Renke” (Jinan, China). The sensors are powered by a supply voltage of 10–30 V and use the standard ModBus-RTU communication protocol, with an RS-485 signal interface. The main technical specifications are shown in Table 2.
The sensor devices can connect to the LoRa gateway via LoRa wireless communication, obtaining real-time data from the LoRa collector based on the Agricultural Four Conditions platform, allowing users to view relevant information in real time on a computer or mobile phone.

2.3. AHP-EWM Comprehensive Evaluation

The weighting methodology integrates subjective and objective weighting approaches. The subjective weighting approach derives index weights through expert elicitation, systematically incorporating domain-specific expertise and intentional prioritization. The objective weighting approach employs statistical classification and correlation analysis of raw datasets to algorithmically determine the weights of the indicator system, ensuring enhanced methodological rigor through data-driven logical coherence.
In this study, we integrated subjective evaluations of pigsty comfort indicators with an analysis of historical empirical data to derive composite weight values for each parameter. This hybrid strategy enhanced the capacity to authentically represent the actual comfort levels within pigsty environments, thereby improving the reliability of environmental assessments for precision livestock farming applications.

2.3.1. AHP Evaluation of Subjective Weights

The analytic hierarchy process (AHP) is a decision-making methodology that systematically integrates qualitative and quantitative analyses. By decomposing complex problems into a structured hierarchical framework—typically organized into goal, criterion, and alternative levels—the AHP employs pairwise comparison matrices to calculate the weight coefficients. This approach enables the unification of both qualitative judgments and quantitative data within a cohesive decision-making framework [27].
A judgment matrix was constructed through a pairwise comparison of any two factors within the environmental factor set {temperature, relative humidity, air velocity, CO2, and NH3}, based on their relative impacts on environmental comfort. The interdependencies among these factors vary depending on the climatic conditions, geographical location, and environmental control strategies, leading to differential weighting of the evaluation indicators. To scientifically determine the indicator weights and enhance evaluation accuracy, the 9-point scaling method [28] (Table 3) was adopted for judgment matrix development, as it systematically quantifies the relative importance of paired parameters through a standardized scoring framework.
The judgment matrix was obtained as presented in Table 4:
Following the construction of the judgment matrix based on factor importance rankings and weight calculation formulas, the maximum eigenvalue of the matrix was computed, and its corresponding eigenvector was derived. The normalized components of this eigenvector represent the relative weights of the evaluation indicators.
To validate the logical consistency of the pairwise comparisons, a consistency verification process is required [29]. The consistency ratio (CR) was calculated as follows:
CI = λ m a x     1 / n     1   ( n = 1 ,   2 ,   3 ,   ,   n )
In the formula, n is the order of the judgment matrix, and λ m a x is the maximum eigenvalue.
The consistency ratio (CR) was calculated based on CI.
C R = C I / R I
In the formula: CR represents the random consistency ratio, and RI represents the random consistency index.
When CR < 0.1, the consistency of the judgment matrix is considered satisfactory; when CR ≥ 0.1, the consistency of the judgment matrix is unsatisfactory, indicating that some element values are illogical and the judgment matrix needs to be corrected.

2.3.2. EWM Objective Weight Evaluation

The entropy weight method (EWM) is an objective weighting approach that quantifies the variability of individual indicators through entropy-based calculations. Its fundamental principle posits that higher information content corresponds to reduced uncertainty (lower entropy), whereas lower information content reflects greater uncertainty (higher entropy) [30]. The EWM computational procedure is outlined as follows:
(1) Standardize the data of each indicator. The weight vector matrix of the corresponding factor subset is shown in Formula (3):
X k i = x k i k = 1 m x k i   ( k = 1 ,   2 ,   3 ,   ,   n ;   i = 1 ,   2 ,   3 ,   ,   m )
(2) Calculate the information entropy E i of the i -th evaluation indicator:
E i = 1 l n m k = 1 m x k i l n x k i   ( i = 1 ,   2 ,   3 ,   ,   n )
where it satisfies: 1 l n m ≥ 0, ej ≥ 0.
(3) Calculate the coefficient of variation D i for the i -th evaluation indicator, and use the coefficients of variation of each evaluation indicator as a measure of the utility value of the information provided by the indicators. As the value of E i increases, it indicates that the information utility of the indicator is greater, which means that the importance of the indicator in the evaluation results is higher, and its weight is larger.
D i = 1 E i   ( i = 1 ,   2 ,   3 ,   ,   n )
(4) Calculate the entropy weight θ i for the i -th indicator:
θ i = D i / i = 1 n D i   ( i = 1 ,   2 ,   3 ,   ,   n )

2.3.3. Comprehensive Weight

The analytic hierarchy process (AHP) exhibits strong subjectivity in weight determination, which may introduce arbitrariness during pairwise comparisons. Conversely, the entropy weight method (EWM) relies solely on sample data, ensuring data-driven objectivity but lacking integration with expert knowledge. To bridge this gap and enhance the practical relevance and persuasiveness of evaluation outcomes, a hybrid methodology that synthesizes subjective and objective perspectives is essential. By processing historical datasets, the subjective weights (derived from AHP) and objective weights (calculated via EWM) for each indicator are quantitatively determined [31,32,33]. To construct a composite weighting scheme that meets practical requirements, a matrix-based methodology is adopted to optimize the integration of these dual weighting systems [34].
The significant differences in the weights obtained from these two methods indirectly indicate that the analytic hierarchy process and the entropy method focus on different perspectives. Let α and β represent the relative importance of subjective and objective weights. In this context, the matrix approach is used to denote the importance coefficients α i and β i for subjective and objective weights (i = 1, 2, 3, …, n).
α i = w i w i + θ i
β i = θ i w i + θ i
After obtaining the importance coefficients α i and β i for the subjective and objective weights, the comprehensive weight λ i for each indicator can be calculated as shown in the following formula:
λ i = α i w i + β i θ i i = 1 m   α i w i + β i θ i

3. Results and Discussion

3.1. Construction of the Environmental Comfort Evaluation Weight Set

3.1.1. Construction of the Evaluation Index System

In this study, five key indicators were selected to evaluate the environmental comfort level of pigsties: temperature, relative humidity, air velocity, carbon dioxide concentration, and ammonia concentration. These parameters constitute the comprehensive evaluation factor set for pigsty environmental comfort analysis:
U = u 1 , u 2 , u 3 , u 4 , u 5
where U represents the set of comfort evaluation factors; u1 is the temperature; u2 is the relative humidity; u3 is the air velocity; u4 is the CO2 concentration; and u5 is the NH3 concentration.
In accordance with China’s national standards for environmental parameters in commercial swine facilities and the existing literature [35,36,37,38,39,40], the environmental comfort level of pigsties was categorized into three tiers: comfortable, relatively comfortable, and uncomfortable (Among them C represents comfortable, R represents relatively comfortable, and U represents uncomfortable). The threshold ranges of environmental factors corresponding to each comfort tier were established as detailed in Table 5.
Among them, C represents comfortable, R represents relatively comfortable, and U represents uncomfortable.
A set of comments is constructed, as shown in Formula (11).
V = { C ,   R ,   U }
where V represents the set of evaluation comments.

3.1.2. Membership Function Determination

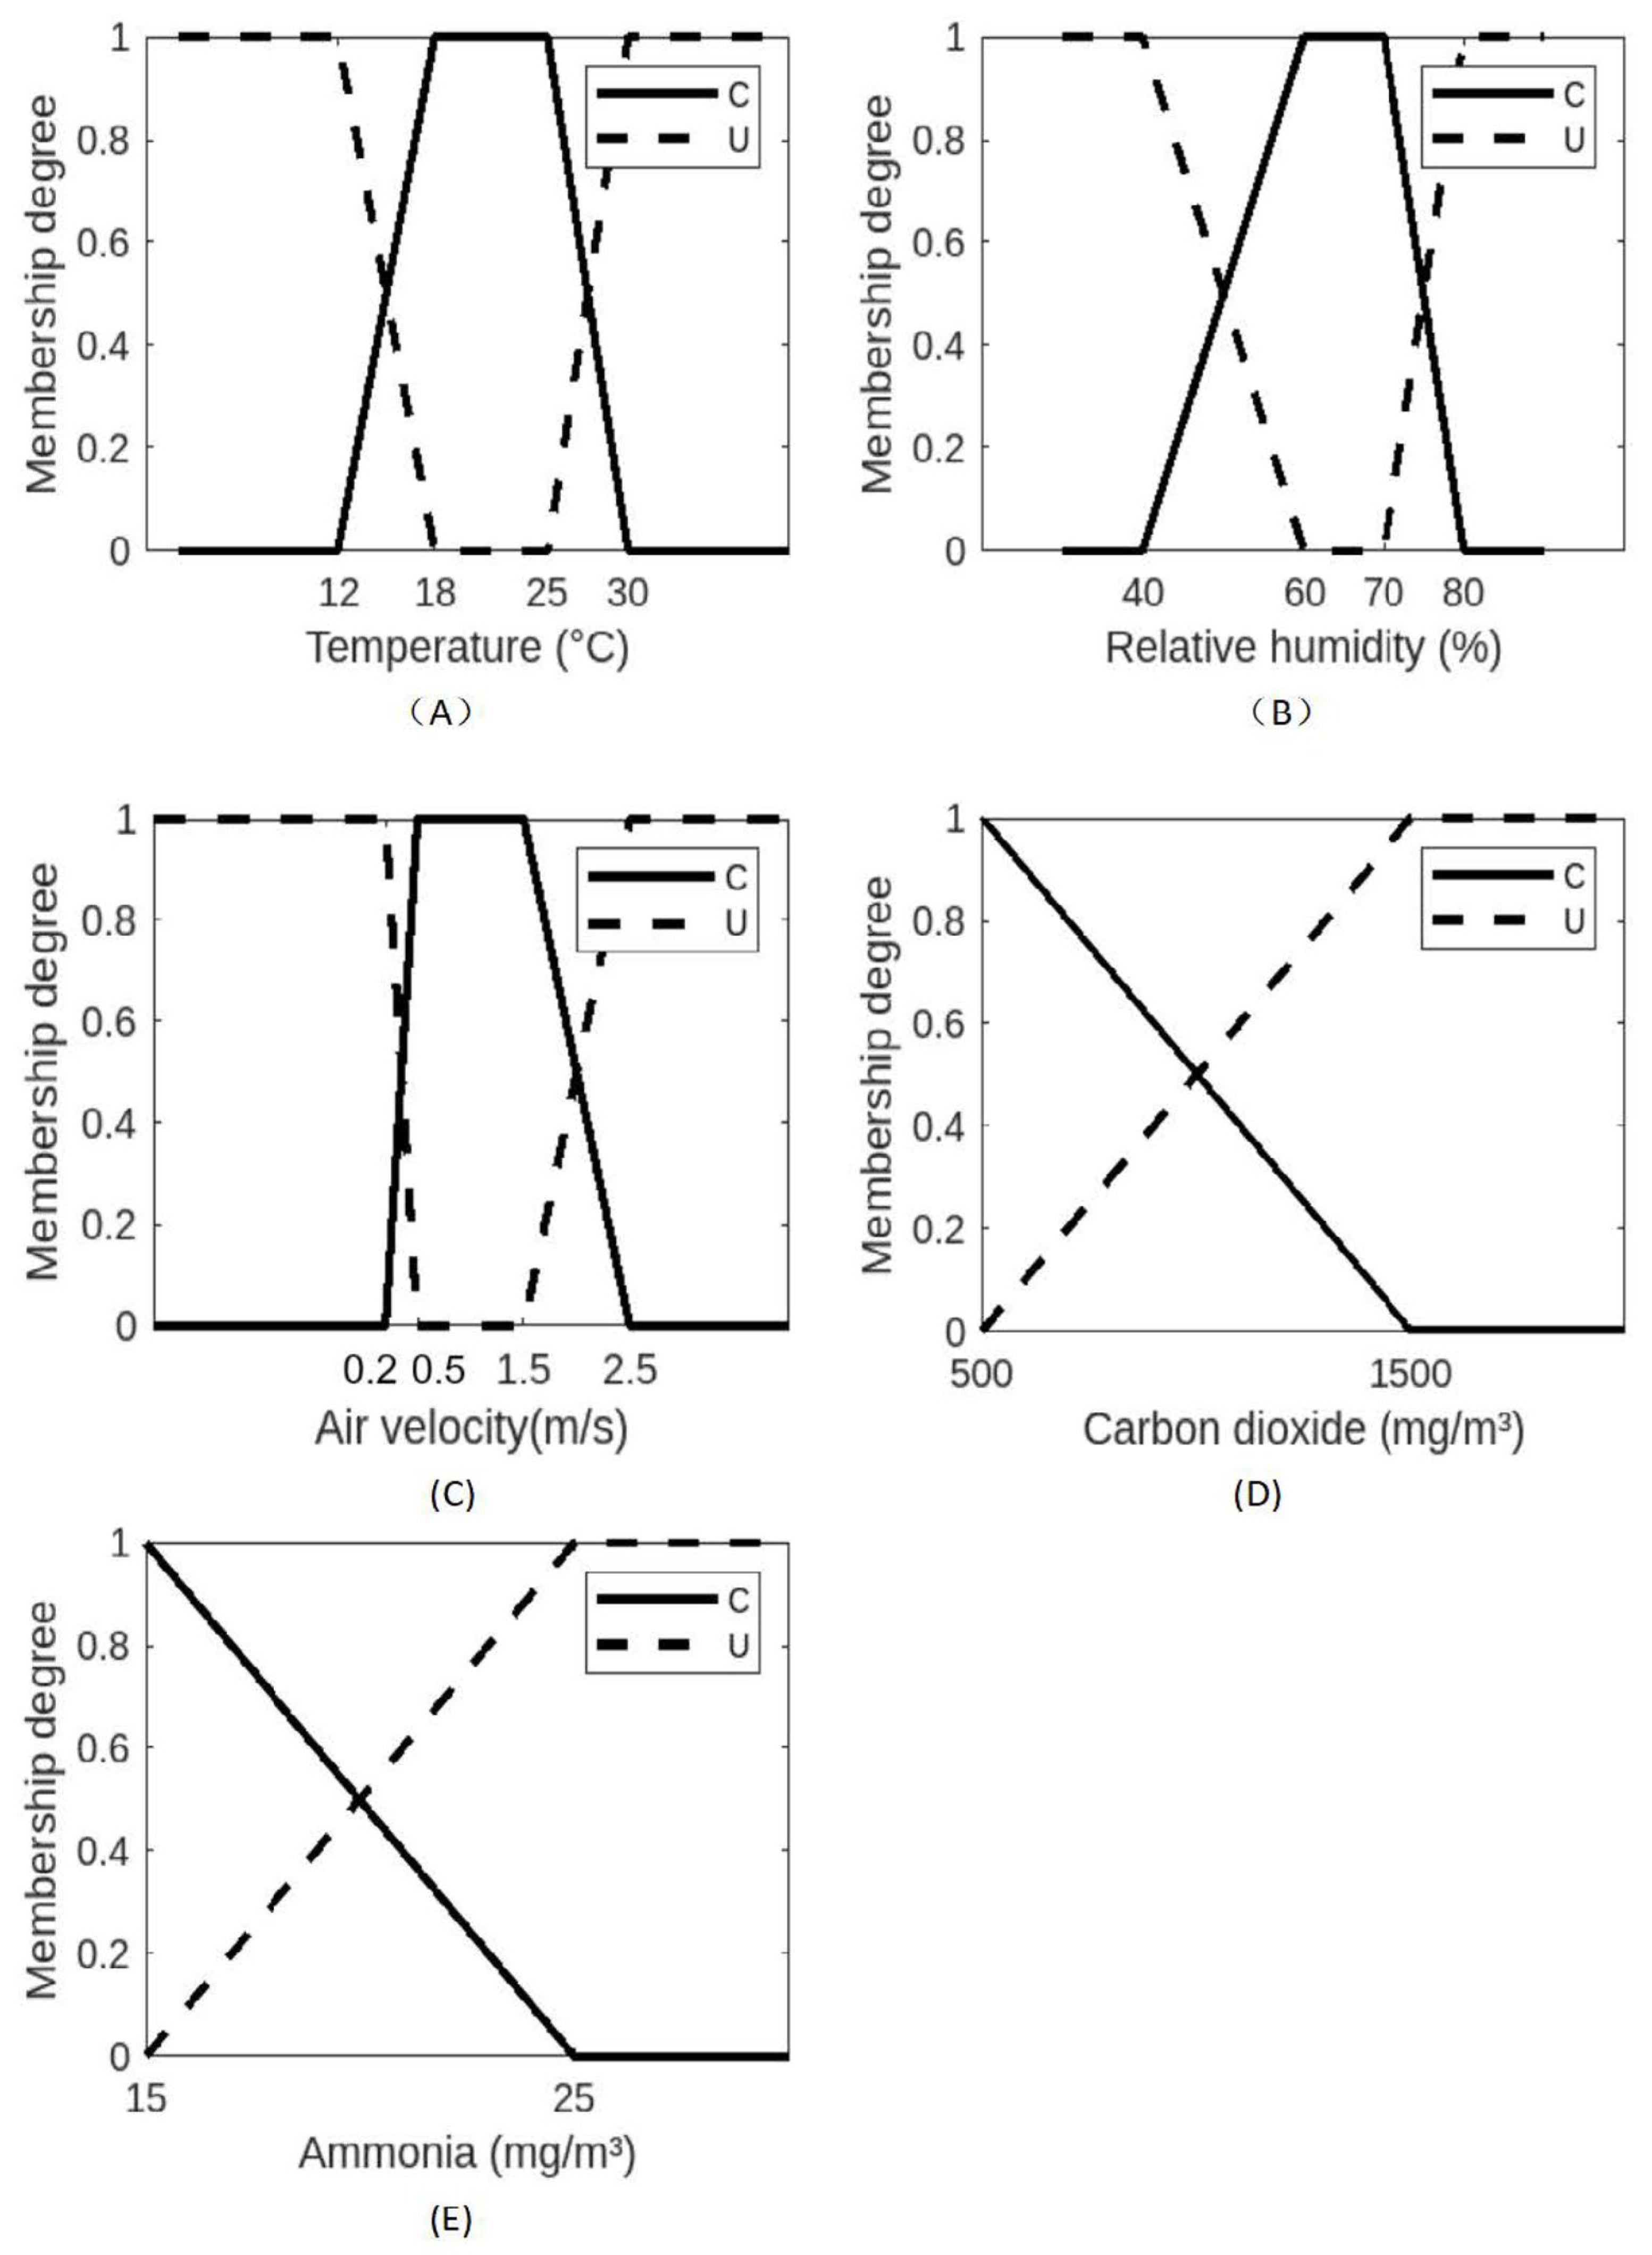
Upon defining the factor set and evaluation criteria set, membership degrees were established to quantify the affiliation level of elements to fuzzy sets. Utilizing a fuzzy relational matrix, the interconnections between the environmental factors and the evaluation tiers were systematically characterized through membership functions [41,42]. Based on empirical datasets, a comprehensive environmental assessment matrix for pigsties was developed, integrating the proposed evaluation index system with calibrated membership functions.
Through this analytical framework, the decision matrix for pigsty environmental evaluation was derived via fuzzy synthetic evaluation as follows:
R = r i j 5 × 3
Environmental comfort is a complex concept that inherently resists precise quantification. To improve the accuracy and scientific validity of the modeling process, the comfort thresholds reflecting environmental suitability were systematically adjusted and nonlinearly scaled based on empirical calibration. The fitted membership function curves for the five environmental parameters (temperature, relative humidity, air velocity, CO2, and NH3) are graphically presented in Figure 2, demonstrating the fuzzy transformation relationships between the measured parameters and the comfort levels.

3.1.3. Determination of Comprehensive Weights Using AHP-EWM

Using the aforementioned methodology, the subjective weight set was derived as follows: temperature (0.4583), relative humidity (0.1979), air velocity (0.1868), CO2 (0.0924), and NH3 (0.0646). The objective weight set, calculated through entropy-based analysis, yielded the following values: temperature (0.5153), relative humidity (0.2620), air velocity (0.1016), CO2 (0.0833), and NH3 (0.0378). Finally, the combined weight set was determined through a matrix-based optimization framework, integrating both subjective and objective weighting approaches: temperature (0.4777), relative humidity (0.2293), air velocity (0.1533), CO2 (0.0862), and NH3 (0.0535).

3.2. Radar Chart Analysis of Pigsty Environmental Assessment

3.2.1. Environmental Factor Data Scoring Conversion

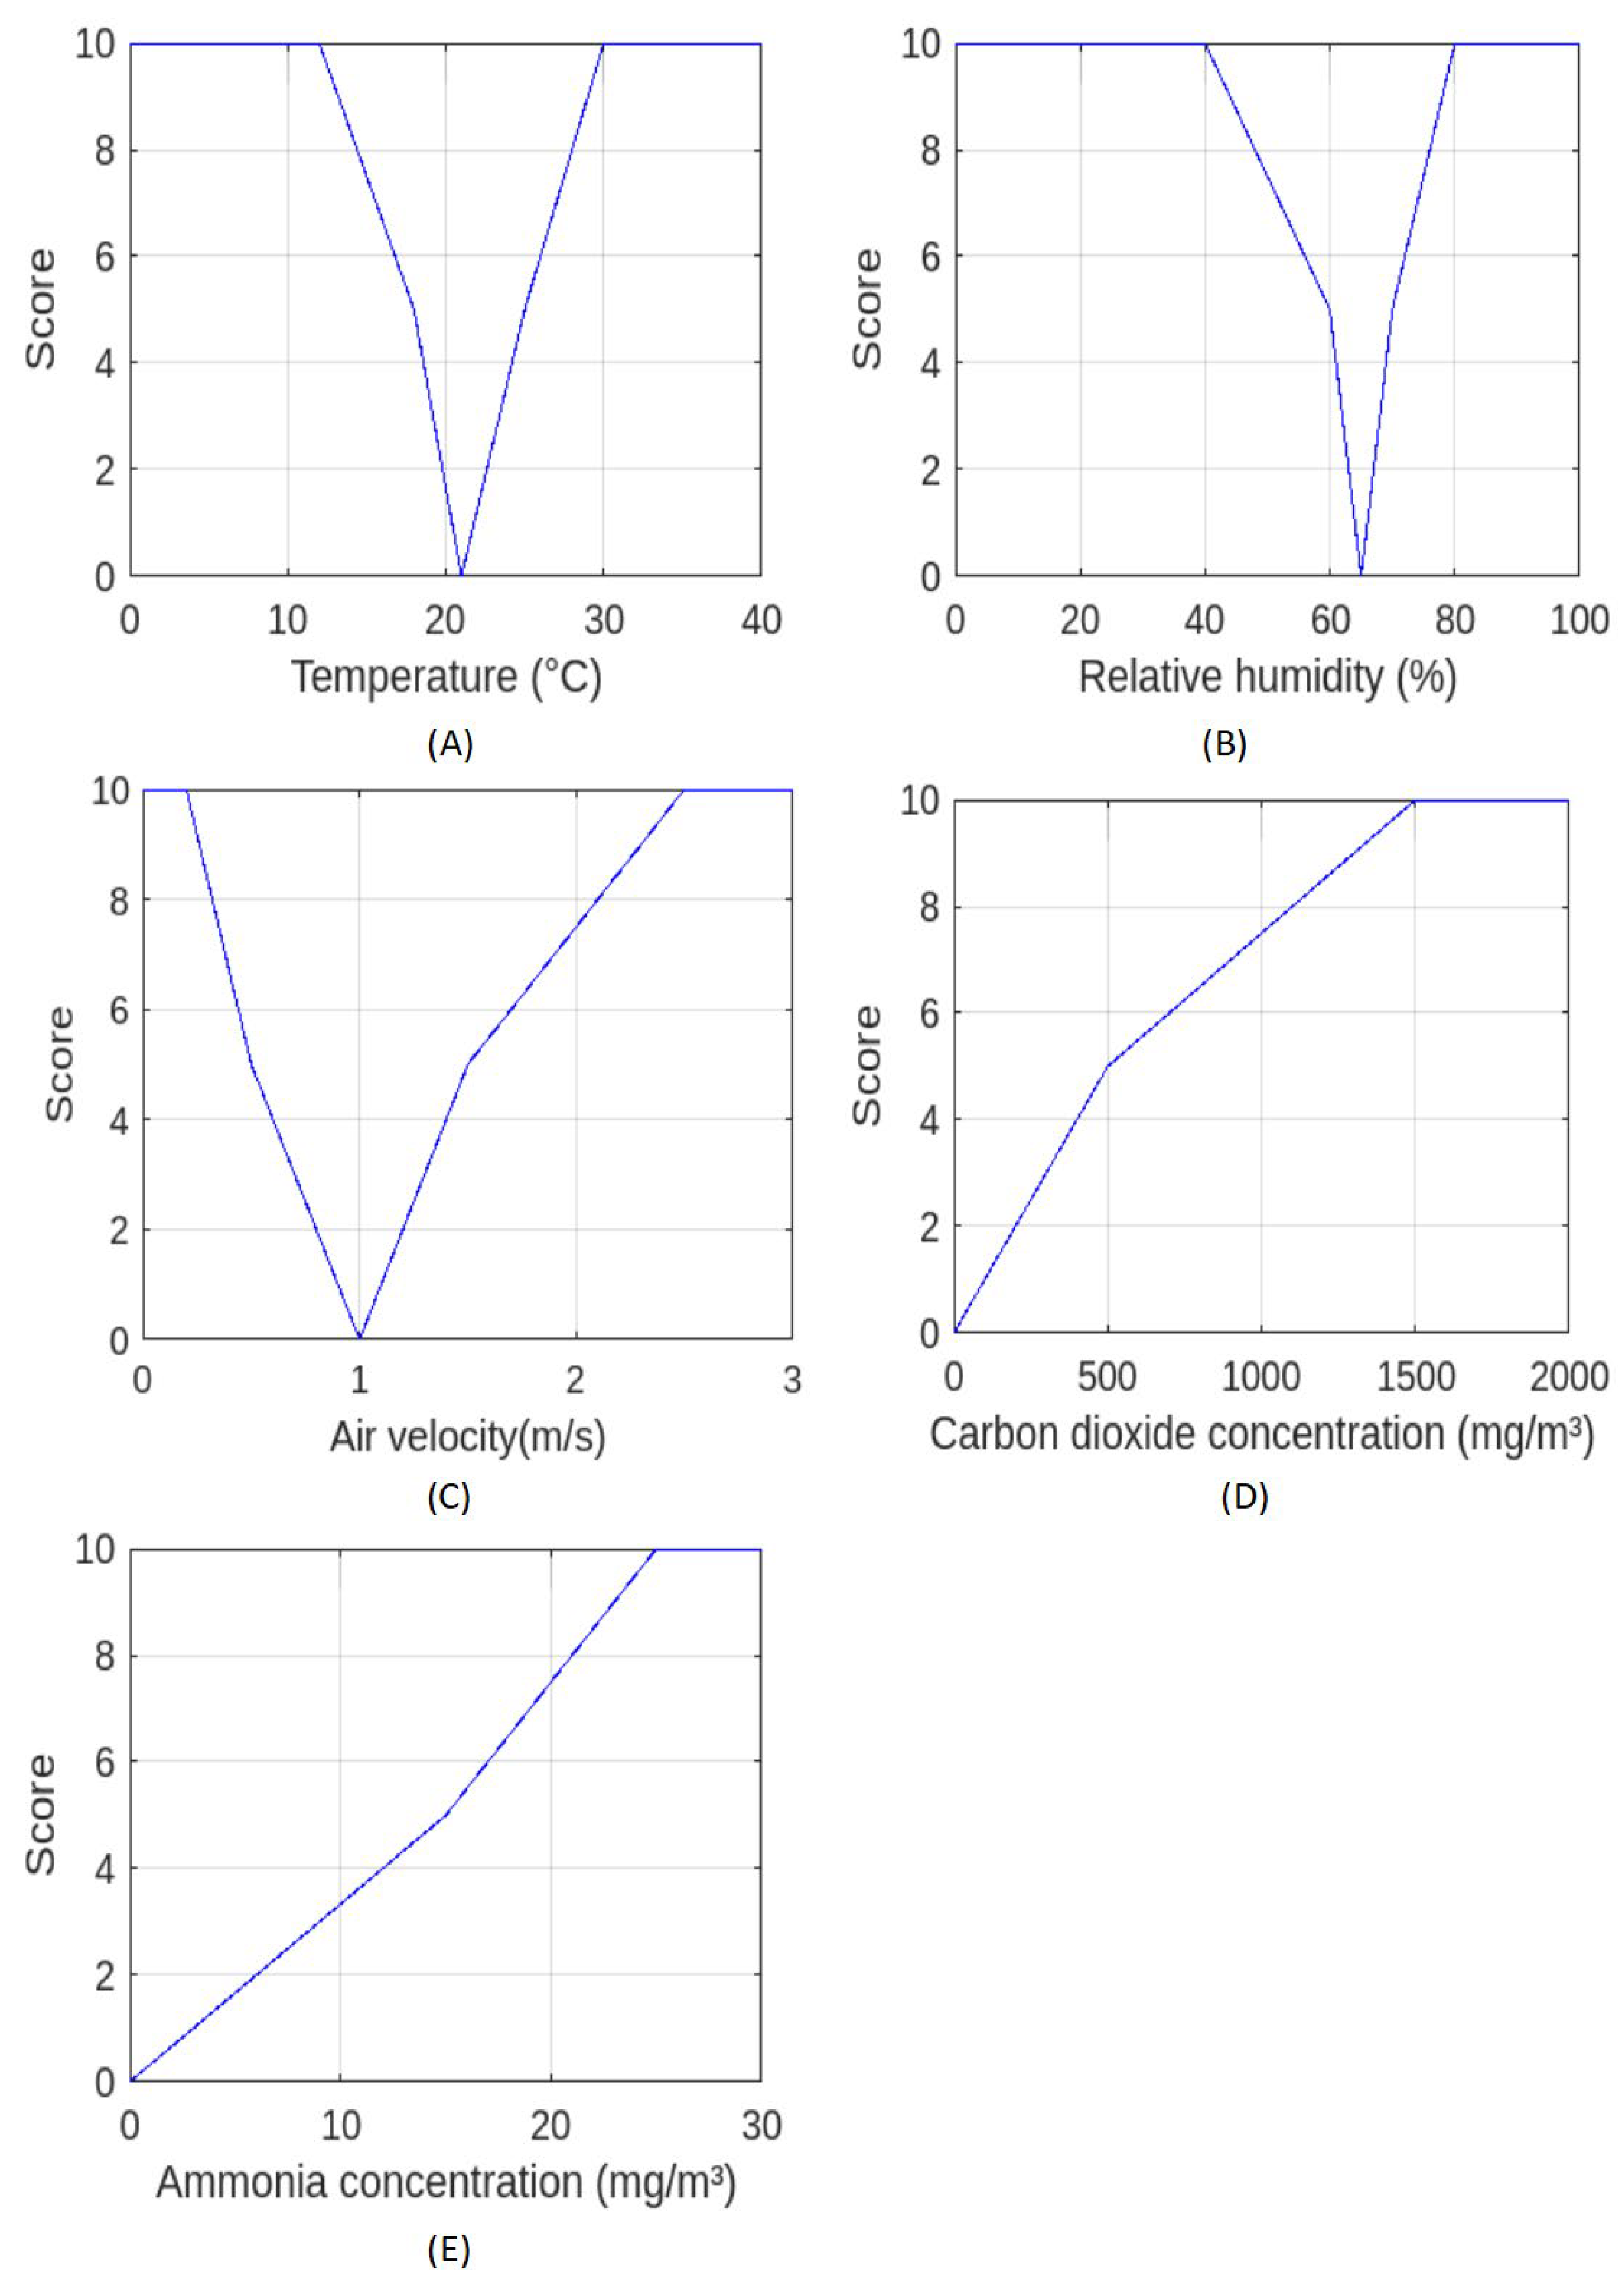
After defining the comfort intervals and survival thresholds of the environmental factors, the data were mapped onto radar charts for area-based analysis. Given the methodological challenges posed by varying parameter scales, dimensional heterogeneity, and an incomplete understanding of inter-factor interaction mechanisms, direct quantitative comparisons were deemed infeasible. To address this, all environmental parameters were systematically normalized to unitless relative values within a standardized range [0, 1] using a fuzzy mathematics approach, thereby eliminating dimensional dependencies [43,44]. The resultant normalized scores for the five environmental factors are visualized in Figure 3.

3.2.2. Construction of Radar Charts

Following the determination of combined weights, the five environmental parameters—temperature, relative humidity, air velocity, CO2, and NH3—were assigned to individual axes of the radar chart. The combined weights were transformed into normalized scores and analyzed using an area-based computation method for radar charts [45]. The environmental comfort indices were calculated as 2.236 and 8.934, representing the thresholds for the comfort zone (red sector) and relatively comfortable zone (yellow sector), respectively. Lower index values (approaching 0) indicate higher environmental comfort levels. The resultant radar chart analysis is visualized in Figure 4.

3.3. Environmental Comfort Assessment Model Verification Analysis

Following model development, the environmental comfort evaluation framework was validated through quantitative analysis using 2023 experimental pigsty data, which were implemented within the model framework for computational processing and visualization. The comfort index was calculated by applying the corresponding environmental factor weights, with benchmark thresholds established to contextualize evaluation outcomes. This systematic approach enables data-driven environmental assessment and early-warning alerts based on predefined critical values.

3.3.1. Analysis of Diurnal Variation in Environmental Comfort Evaluation Indicators

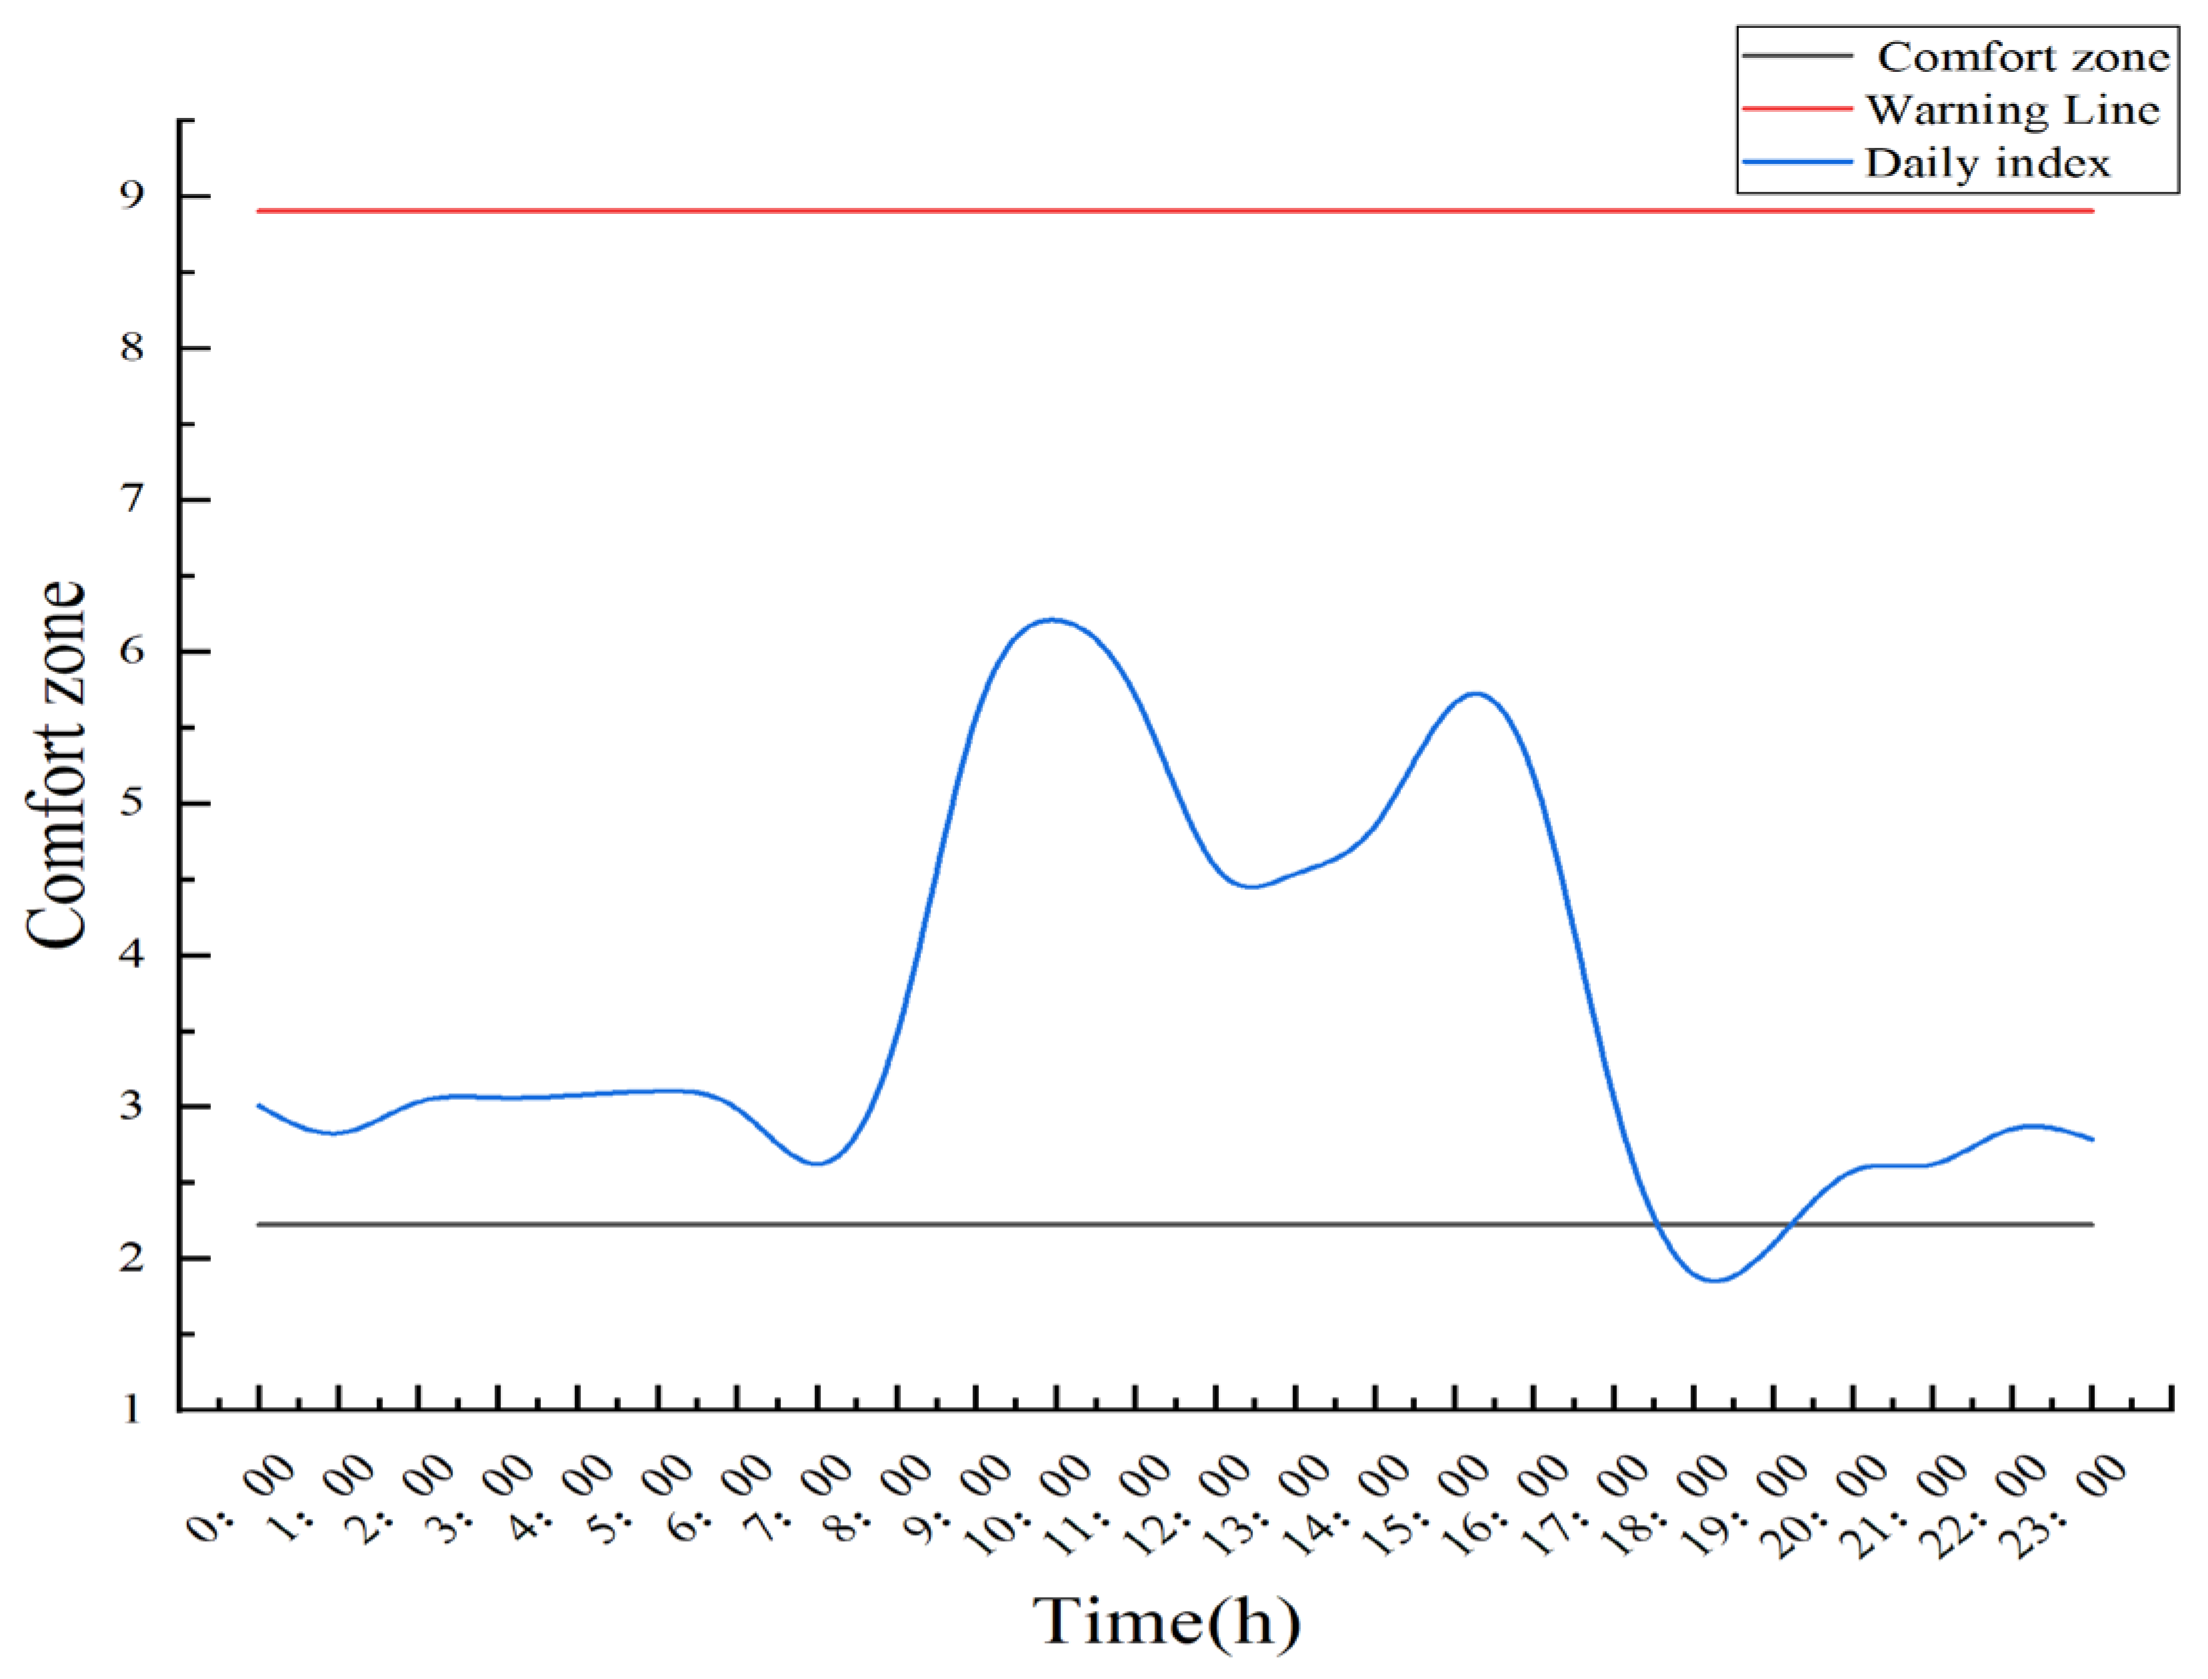
During the computation of the comfort index, the raw environmental data were first converted into quantifiable metrics based on predefined standardized scoring criteria. These normalized scores were then aggregated through weighted summation according to the assigned factor weights. The resultant polygonal area of the radar (pentagonal) chart, derived from integrating all weighted parameters, was defined as the daily comfort index (Figure 5). Predefined critical thresholds were established to contextualize the index values, enabling systematic evaluation and early warning alerts for environmental anomalies.
The experimental results indicate that on 24 December, the environmental comfort index of the pigsty remained consistently below the warning threshold, signifying that the overall conditions throughout the day fell within the relatively comfortable range, suitable for swine habitation. The daily index exhibited two distinct troughs at approximately 07:00 and 18:00, reflecting optimal environmental conditions during these periods. However, between 09:00 and 11:00 and 14:00 and 16:00, the index approached critical thresholds, necessitating heightened monitoring of the environmental parameters during these intervals.
During winter operations, balancing minimal ventilation requirements with temperature stability and air quality maintenance is critical. Temperature (assigned weight: 0.4777) and CO2 concentration (weight: 0.2293) dominated the environmental evaluation criteria, collectively accounting for the majority of the weighting system. This underscores the importance of the precise regulation of airflow velocity to mitigate risks associated with elevated CO2 levels (potentially causing respiratory distress) or NH3 accumulation (compromising air quality), while ensuring thermal comfort.
As illustrated in Figure 5, the daily index remained stable between 22:00 and 06:00, coinciding with steady nighttime temperatures. Despite adequate airflow to maintain the thermal conditions, insufficient ventilation during this period reduced the air exchange rates, resulting in minor fluctuations in the overall comfort. From 06:00 to 07:00, rising temperatures improved the comfort levels but simultaneously accelerated the swine respiratory rates, triggering a sharp increase in the CO2 concentration (observed as an inflection point). After 07:00, concurrent declines in the temperature, humidity, and CO2 levels were recorded. The ventilation system, programmed to dynamically adjust the airflow based on thermal feedback, responded to the temperature increases by modulating the fan speeds to optimize environmental equilibrium.

3.3.2. Single-Factor Environmental Indicator Trends

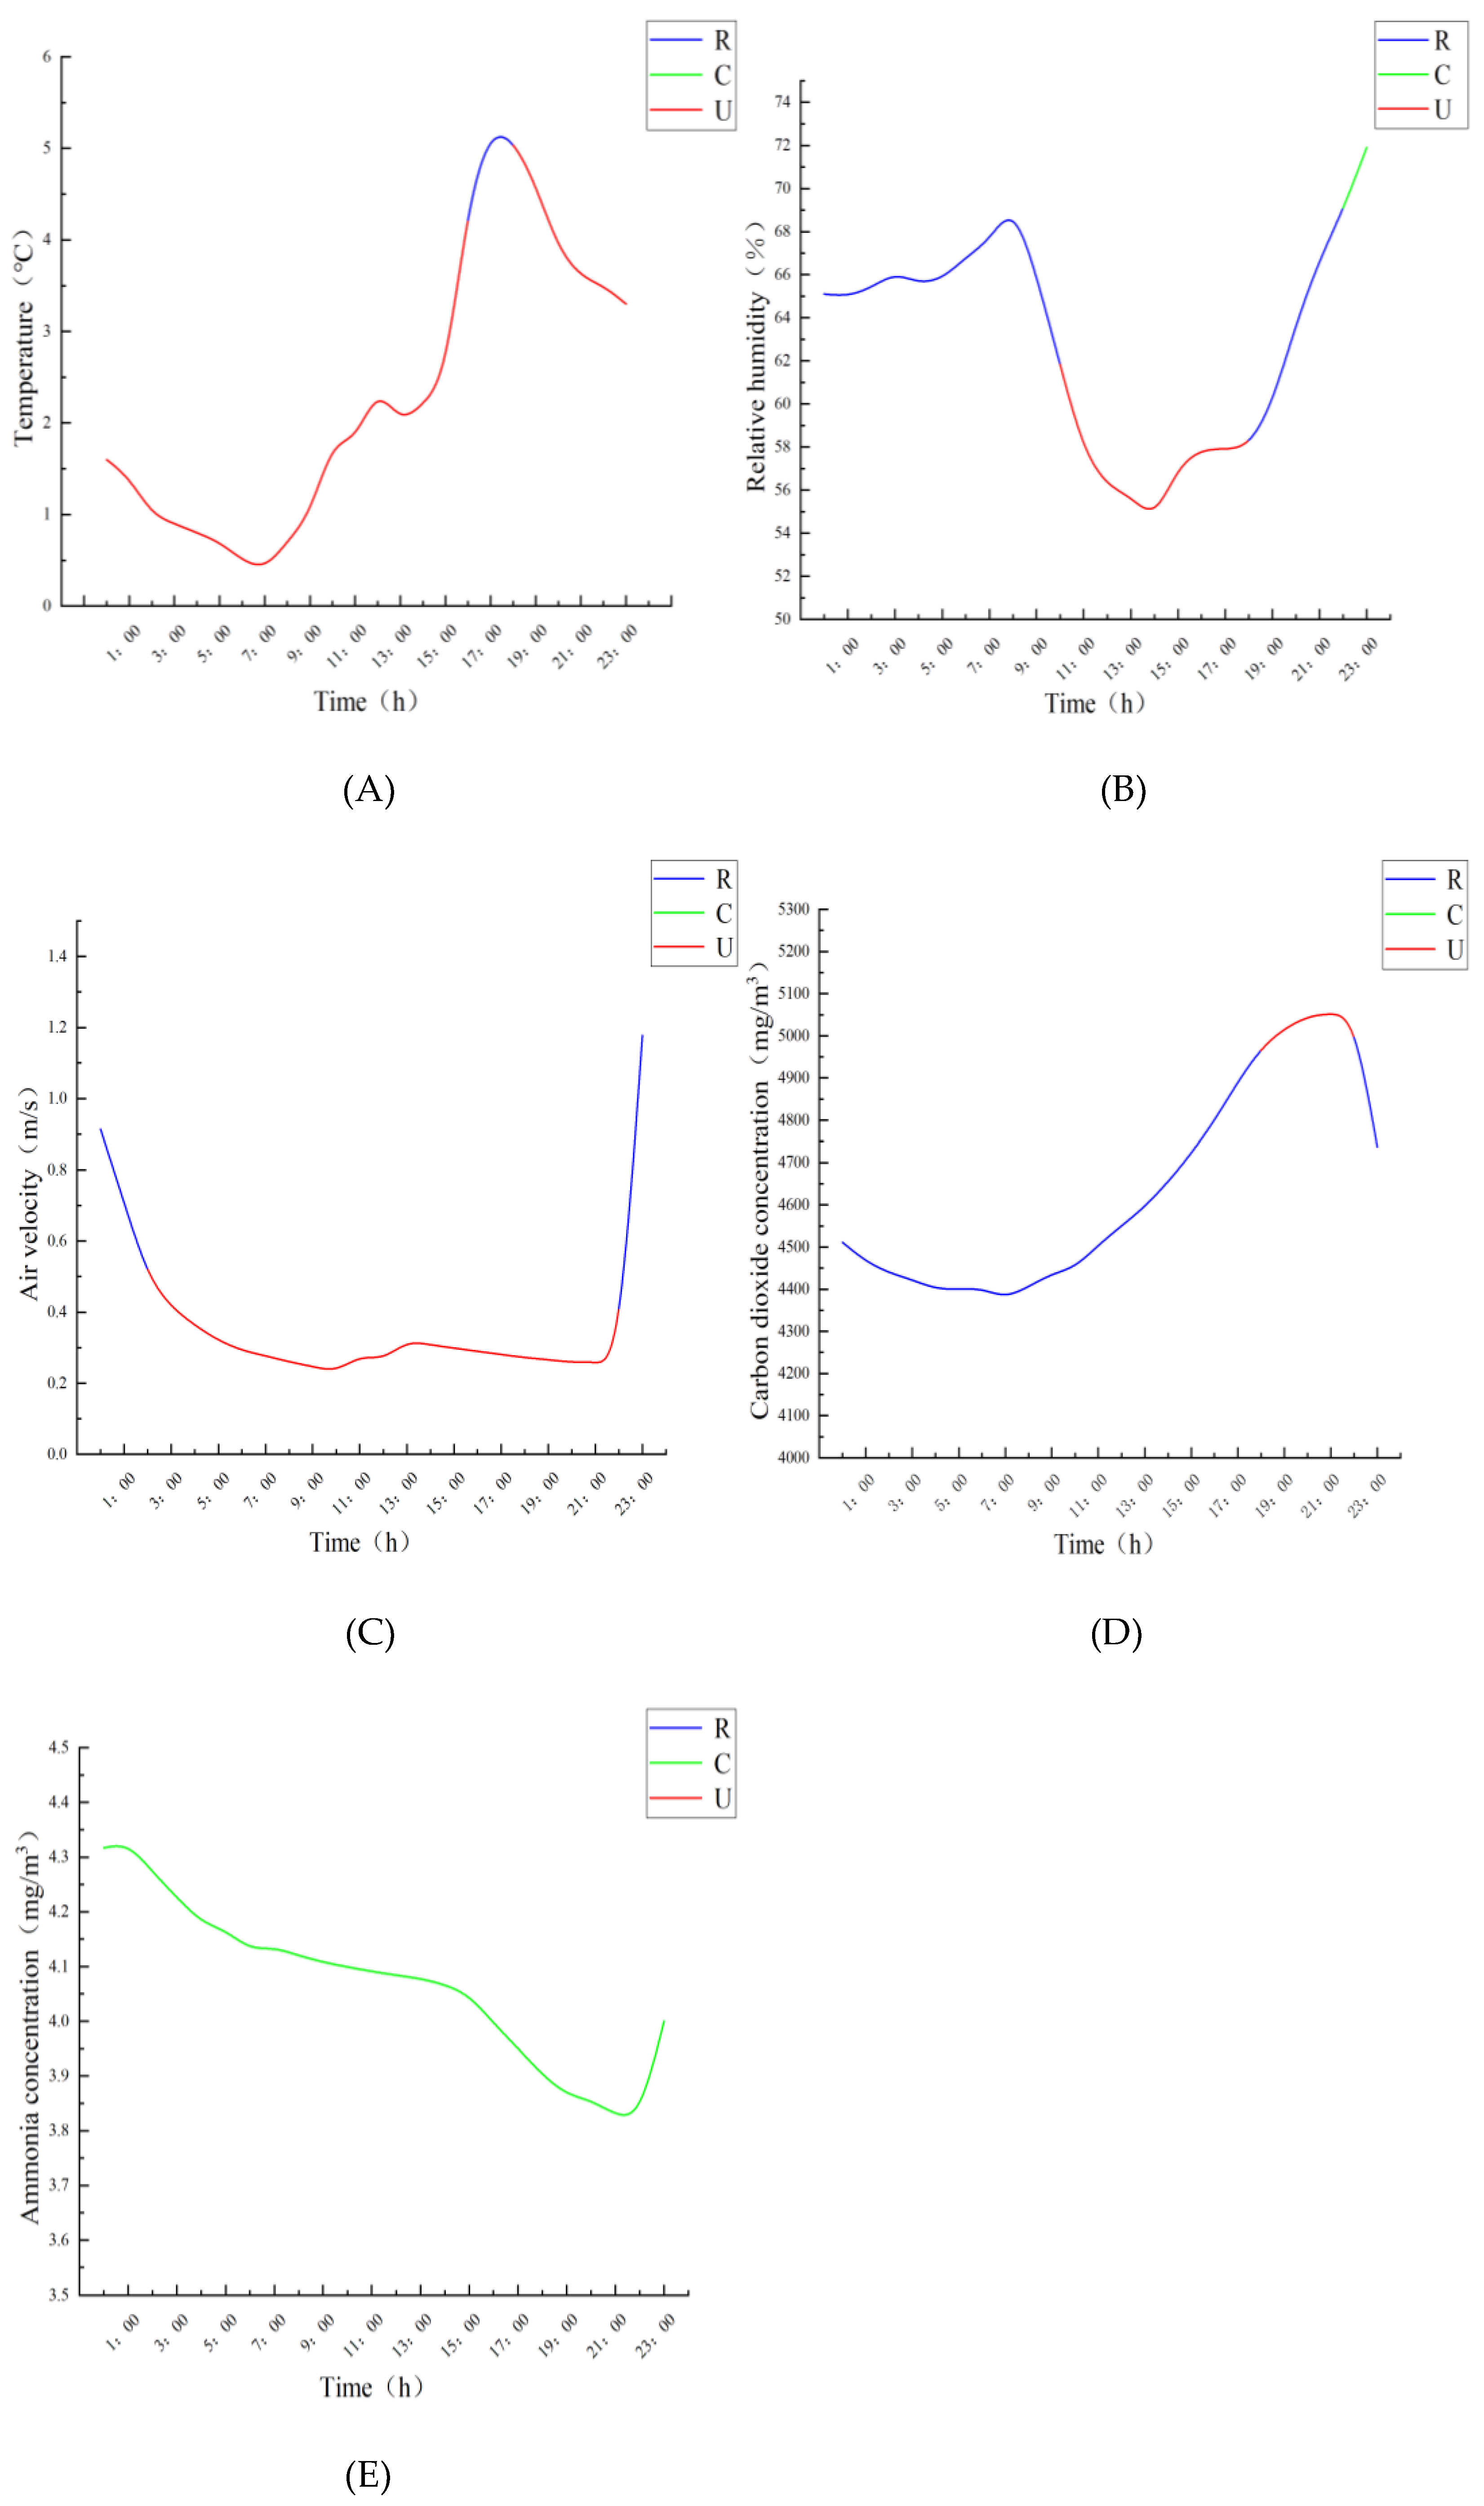
Using hourly environmental monitoring data from 25 December 2023, the pigsty was evaluated using five individual parameters: temperature, relative humidity, NH3 concentration, CO2 concentration, and air velocity. The resulting single-factor indicator distribution maps, illustrating the spatial and temporal variability of environmental conditions across these tiers, are presented in Figure 6.
The evaluation results obtained from individual environmental data were compared with the comprehensive evaluation results. The comfort, relatively comfortable, and uncomfortable zones are represented by C, R, and U, respectively. The results are shown in Table 6.
As shown in Table 6, the environmental conditions within the pigsty at any given time were determined by multiple interacting factors, including the temperature, humidity, air velocity, NH3 concentration, and CO2 concentration. The comprehensive evaluation results indicate that the majority of assessments fell within the relatively comfortable range. For instance, at 19:00, the single-factor evaluations revealed that the temperature and NH3 concentration were within the comfort zone, the humidity was in the relatively comfortable zone, while the air velocity and CO2 concentration were in the uncomfortable zone. However, the multi-factor integrated evaluation classified the overall environmental conditions as comfortable during this period. Between 20:00 and 22:00, reduced airflow velocity and elevated CO2 concentrations (attributable to decreased swine activity during nighttime rest) placed the CO2 levels in the uncomfortable zone. Nevertheless, the comprehensive evaluation concluded that the overall environment remained relatively comfortable. These findings demonstrate that pigsty environmental conditions are not governed by individual factors but rather by synergistic interactions among multiple parameters, aligning with previous studies by Xie et al. [46,47].

4. Conclusions

This study conducted an applied analysis of the environmental comfort evaluation model for pigsties, yielding the following conclusions:
(1)
Comprehensive Weighting Evaluation: By employing the AHP-EWM comprehensive evaluation, the combined weights of the environmental factors were determined as {0.4777, 0.2293, 0.1533, 0.0862, 0.0535}.
(2)
Comfort Index Visualization: Normalized scoring of the combined weights enabled the derivation of environmental comfort metrics. Using radar chart visualization, the comfort indices were quantified as 2.236 (comfort zone) and 8.934 (relatively comfortable zone), providing intuitive spatial–temporal representations of the environmental conditions.
(3)
Multi-Factor Sensitivity Analysis: Comparative analysis revealed that the multi-factor comfort index exhibited higher sensitivity to environmental dynamics than the single-factor evaluations, offering a more comprehensive and accurate assessment of pigsty conditions. Under extreme climatic scenarios, the model identified periods of suboptimal environmental quality, necessitating targeted adjustments to ventilation and thermal regulation strategies to mitigate adverse impacts on swine productivity and economic returns.
(4)
Weight assignments must undergo region-specific calibration based on the local climatic conditions and geographical contexts to ensure practical relevance. Consequently, adaptive recalibration and optimization of weights are imperative during implementation. Furthermore, sensor configurations and environmental monitoring protocols should be tailored to specific operational requirements across diverse farming practices and pigsty architectures, thereby enhancing the scientific validity and reliability of evaluations. Transient environmental dynamics, such as abrupt fluctuations in temperature and relative humidity during the activation of evaporative cooling systems, significantly impact indoor comfort levels. Future research should prioritize the integration of advanced computational technologies (e.g., IoT-enabled real-time monitoring platforms) and automated control systems to achieve dynamic environmental management. This integration will improve the temporal resolution and sensitivity of evaluation frameworks, addressing critical gaps in transient response capabilities—a key focus for next-generation precision livestock farming innovations.

Author Contributions

Conceptualization, J.L. and T.L.; methodology, J.L. and H.J.; software, J.L. and T.J.; validation, Z.W. and T.Z.; formal analysis, T.J.; investigation, J.L.; resources, H.J.; data curation, J.L.; writing—original draft preparation, J.L. and T.L.; writing—review and editing, H.J.; visualization, L.Z.; supervision H.J.; project administration, H.J.; funding acquisition, H.J. All authors have read and agreed to the published version of the manuscript.

Funding

This study was funded by the Jilin Provincial Department of Education (No. JJKH2024042KJ), the China National Key Research and Development Project (No. 2023YFD1301803), and the Jilin Provincial Department of Science and Technology (No. 20210202054NC).

Institutional Review Board Statement

This study did not require ethical approval.

Informed Consent Statement

Informed consent was obtained from all subjects involved in the study.

Data Availability Statement

The data presented in this study are available upon request from the corresponding author. They are restricted to the experimental results.

Acknowledgments

We thank the Jilin Provincial Department of Education (No. JJKH2024042KJ), the China National Key Research and Development Project (No. 2023YFD1301803), and the Jilin Provincial Department of Science and Technology (No. 20210202054NC) for financial support.

Conflicts of Interest

The authors declare no conflicts of interest.

References

  1. Peng, H. Current Status and Development Trends of Modern Pig Farming. Today Anim. Husb. Vet. 2020, 36, 73–106. [Google Scholar]
  2. Tu, K.K. Analysis of Influencing Factors and Research on Simulation Countermeasures of Pig Cycle in China. Master’s Thesis, Nanchang University, Nanchang, China, 2023. [Google Scholar]
  3. Yeo, U.H.; Lee, S.Y.; Park, S.J.; Kim, J.-G.; Jetong, D.-Y.; Decano-Valentin, C.S.; Kim, R.-W.; Lee, I.-B. Determination of the optimal location and the number of sensors for efficient heating, ventilation, and air conditioning system operation in a mechanically ventilated pig house. Biosyst. Eng. 2023, 229, 1–17. [Google Scholar] [CrossRef]
  4. Shin, H.; Lee, S.; Kim, J.; Park, D.-H.; Jo, S.-K.; Kwak, Y. Applicability evaluation of a temperature humidity index-controlled ventilation system in livestock using a building energy simulation model. Case Stud. Therm. Eng. 2024, 5735, 104335. [Google Scholar] [CrossRef]
  5. Zang, J.; Ye, S.; Xu, Z.; Wang, J.; Liu, W.; Bai, Y.; Yong, C.; Zou, X.; Zhang, W. Prediction model of carbon dioxide concentration in pig house based on deep learning. Atmosphere 2022, 13, 1130. [Google Scholar] [CrossRef]
  6. Chi, Y.; Guo, Y.J.; Feng, H.; Feng, H.; Li, H.; Zheng, Y. Environmental quality evaluation method for swine gestation barns based on multi-source information fusion. Trans. Chin. Soc. Agric. Eng. 2022, 38, 212–221. [Google Scholar]
  7. Choi, H.L.; Han, S.H.; Albright, L.D.; Chang, W.K. The correlation between thermal and noxious gas environments, pig productivity and behavioral responses of growing pigs. Int. J. Environ. Res. Public Health 2011, 8, 3514–3527. [Google Scholar] [CrossRef]
  8. Arango, T.; Besteiro, R.; Ortega, J.A.; Castro, Á.; Rodríguez, M.R.; Fernández, M.D. Linear models for the prediction of animal zone ammonia in a weaned piglet building. Agronomy 2021, 11, 1927. [Google Scholar] [CrossRef]
  9. Witt, J.; Krieter, J.; Schröder, K.; Büttner, K.; Hölzel, C.; Krugmann, K.; Czycholl, I. Comparison of three different measuring devices of ammonia and evaluation of their suitability to assess animal welfare in pigs. Livest. Sci. 2024, 279, 105372. [Google Scholar] [CrossRef]
  10. Yu, P.; Zhu, W.H. Analysis of Site Selection and Planning Layout for Large-Scale Pig Farms. Today Anim. Husb. Vet. 2022, 38, 61–64. [Google Scholar]
  11. Anthony, T.R.; Yang, A.Y.; Peters, T.M. Assessment of interventions to improve air quality in a livestock building. J. Agric. Saf. Health 2017, 23, 247–263. [Google Scholar] [CrossRef]
  12. Zhu, J.M.; Sun, B.; Pu, S.H.; Pan, X.; Xu, S.; Hu, B.; Qi, R. Prediction model of temperature and humidity in pig barn based on multi-environmental factors analysis. J. South China Agric. Univ. 2024, 45, 709–721. [Google Scholar]
  13. Shin, H.; Kwak, Y.; Jo, S.K.; Kim, S.-H.; Huh, J.-H. Applicability evaluation of a demand-controlled ventilation system in livestock. Comput. Electron. Agric. 2022, 196, 106907. [Google Scholar] [CrossRef] [PubMed]
  14. Buoio, E.; Cialini, C.; Costa, A. Air Quality Assessment in Pig Farming: The Italian Classyfarm. Animals 2023, 13, 2297. [Google Scholar] [CrossRef]
  15. Chen, C.; Liu, X.Q.; Liu, C.J.; Chang, R.M. Optimization of Evaluation and Prediction Model of Environmental Comfort in Lactating Sow House. Trans. Chin. Soc. Agric. Mach. 2020, 51, 311–319. [Google Scholar]
  16. Ruckli, A.K.; Hörtenhuber, S.J.; Ferrari, P.; Guy, J.; Helmerichs, J.; Hoste, R.; Hubbard, C.; Kasperczyk, N.; Leeb, C.; Malak-Rawlikowska, A.; et al. Integrative sustainability analysis of European pig farms: Development of a multi-criteria assessment tool. Sustainability 2022, 14, 5988. [Google Scholar] [CrossRef]
  17. Zapf, R.; Schultheiß, U.; Schubbert, A.; Daniel, G.; Kornel, C.; Solveig, M.; Jan, B.; Ute, K. Evaluation of animal welfare in on-farm self-assessments–development of a reference framework with target and alarm values based on a Delphi survey. Landtechnik 2023, 78, 125–138. [Google Scholar]
  18. Chen, C.; Liu, X.; Duan, W.; Liu, C. Assessment of the environmental comfort of lactating sows via improved analytic hierarchy process and fuzzy comprehensive evaluation. Int. J. Agric. Biol. Eng. 2022, 15, 58–67. [Google Scholar] [CrossRef]
  19. Zhou, Z.J. Risk Assessment of Harmless Treatment Projects for Dead Livestock and Poultry Based on the Analytic Hierarchy Process (AHP) Method. Master’s Thesis, Beijing University of Technology, Beijing, China, 2020. [Google Scholar]
  20. Putra, D.W.T.; Punggara, A.A. Comparison analysis of simple additive weighting (SAW) and weigthed product (WP) in decision support systems. MATEC Web Conf. EDP Sci. 2018, 215, 01003. [Google Scholar] [CrossRef]
  21. Zhu, Y.; Tian, D.; Yan, F. Effectiveness of entropy weight method in decision-making. Math. Probl. Eng. 2020, 2020, 3564835. [Google Scholar] [CrossRef]
  22. Li, Z.; Luo, Z.; Wang, Y.; Fan, G.; Zhang, J. Suitability evaluation system for the shallow geothermal energy implementation in region by Entropy Weight Method and TOPSIS method. Renew. Energ. 2022, 184, 564–576. [Google Scholar] [CrossRef]
  23. Qi, J.; Zhang, Y.; Zhang, J.; Chen, Y.; Wu, C.; Duan, C.; Cheng, Z.; Pan, Z. Research on the evaluation of geological environment carrying capacity based on the AHP-CRITIC empowerment method. Land 2022, 11, 1196. [Google Scholar] [CrossRef]
  24. Jin, C.; Shu, Y.; Han, Z.; Chen, Q.; He, J.; Wang, S. Lightning disaster risk zoning in Jiangsu province of China based on the analytic hierarchy process and entropy weight method. Front. Environ. Sci. 2022, 10, 943000. [Google Scholar] [CrossRef]
  25. Xie, J.; Liu, B.; He, L.; Zhong, W.; Zhao, H.; Yang, X.; Mai, T. Quantitative evaluation of the adaptability of the shield machine based on the analytic hierarchy process (AHP) and fuzzy analytic hierarchy process (FAHP). Adv. Civ. Eng. 2022, 2022, 3268150. [Google Scholar] [CrossRef]
  26. Chen, Z. Port logistics function evaluation model based on entropy weight TOPSIS method. Discret. Dyn. Nat. Soc. 2022, 2022, 5006900. [Google Scholar] [CrossRef]
  27. Panchal, S.; Shrivastava, A.K. Landslide hazard assessment using analytic hierarchy process (AHP): A case study of National Highway 5 in India. Ain Shams Eng. J. 2022, 13, 101626. [Google Scholar] [CrossRef]
  28. Bi, K.; Xu, Q.; Ji, Z.Q.; Zhao, X.W.; Lu, Z.H. Construction and empirical analysis of DNA storage scheme evaluation model based on analytic hierarchy process. Chin. J. Bioinform. 2024, 3–24. [Google Scholar]
  29. Saaty, T.L. Modeling unstructured decision problems—The theory of analytical hierarchies. Math. Comput. Simulat. 1978, 20, 147–158. [Google Scholar] [CrossRef]
  30. Yin, P.; Cheng, J.; Peng, M. Analyzing the passenger flow of urban rail transit stations by using entropy weight-grey correlation model: A case study of Shanghai in China. Mathematics 2022, 10, 3506. [Google Scholar] [CrossRef]
  31. Zhang, L.; Xu, X.; Guo, Y. Comprehensive Evaluation of the Implementation Effect of Commercial Street Quality Improvement Based on AHP-Entropy Weight Method—Taking Hefei Shuanggang Old Street as an Example. Land 2022, 11, 2091. [Google Scholar] [CrossRef]
  32. Wen, Z. Evaluation of Heterogeneity in Tectonically Deformed Coal Reservoirs Based on the Analytic Hierarchy Process-Entropy Weight Method Coupling Model: A Case Study. ACS Omega 2023, 8, 36700–36709. [Google Scholar] [CrossRef]
  33. Shi, D.; Guo, Y.; Gu, X.; Feng, G.; Xu, Y.; Sun, S. Evaluation of the ventilation system in an LNG cargo tank construction platform (CTCP) by the AHP-entropy weight method. In Building Simulation; Tsinghua University Press: Beijing, China, 2022; pp. 1–18. [Google Scholar]
  34. Deng, Q.Q. Comprehensive Evaluation of Ecological Environment Quality in Chongqing Based on Entropy Method and AHP. Master’s Thesis, Southwest University, Chongqing, China, 2022. [Google Scholar]
  35. Mun, H.S.; Dilawar, M.A.; Gil Jeong, M.; Rathnayake, D.; Won, J.S.; Park, K.W.; Lee, S.R.; Ryu, S.B.; Yang, C.J. Effect of a Heating system using a ground source geothermal heat pump on production performance, energy-saving and housing environment of pigs. Animals 2020, 10, 2075. [Google Scholar] [CrossRef] [PubMed]
  36. Huynh, T.T.T.; Aarnink, A.J.A.; Verstegen, M.W.A.; Gerrits, W.J.; Heetkamp, M.J.; Kemp, B.; Canh, T.T. Effects of increasing temperatures on physiological changes in pigs at different relative humidities. J. Anim. Sci. 2005, 83, 1385–1396. [Google Scholar] [CrossRef]
  37. Tang, S.; Yin, C.; Xie, J.; Jiao, J.; Chen, L.; Liu, L.; Zhang, S.; Zhang, H. Aerial ammonia exposure induces the perturbation of the interorgan ammonia disposal and branched-chain amino acid catabolism in growing pigs. Anim. Nutr. 2021, 7, 947–958. [Google Scholar] [CrossRef]
  38. Zhang, X.; Wang, A.; Chen, Y.; Bao, J.; Xing, H. Intestinal barrier dysfunction induced by ammonia exposure in pigs in vivo and in vitro: The protective role of L-selenomethionine. Ecotoxicol. Environ. Safe 2022, 248, 114325. [Google Scholar] [CrossRef] [PubMed]
  39. Hu, Z.; Yang, Q.; Tao, Y.; Shi, L.; Tu, J.; Wang, Y. A review of ventilation and cooling systems for large-scale pig farms. Sustain. Cities Soc. 2023, 89, 104372. [Google Scholar] [CrossRef]
  40. Wen, P.; Li, L.; Xue, H.; Jia, Y.; Gao, L.; Li, R.; Huo, L. Comprehensive evaluation method of the poultry house indoor environment based on gray relation analysis and analytic hierarchy process. Poult. Sci. 2022, 101, 101587. [Google Scholar] [CrossRef]
  41. Chen, C.; Shen, C.; Duan, W. Air quality monitoring of sow houses with the fuzzy comprehensive evaluation method. Agron. J. 2023, 115, 2694–2707. [Google Scholar] [CrossRef]
  42. Liang, S.T.; Hong, H. Fuzzy Comprehensive Evaluation on Surface Water Quality. Site Investig. Sci. Technol. 2019, 5, 49–53. [Google Scholar]
  43. Dong, H.; Zhang, G.; Yan, M.; Tian, Y. Soil environmental quality in Nanling commodity grain base based on equal intercept transformation radar chart. Sci. Rep. 2021, 11, 10460. [Google Scholar] [CrossRef]
  44. Yang, R.X. Application of Radar Chart Method to the Karst Tunnel in Complex Geology. Mod. Tunn. Technol. 2020, 57, 125–129. [Google Scholar]
  45. Peng, W. Improved radar chart for lighting system scheme selection. Appl. Opt. 2022, 61, 5619–5625. [Google Scholar] [CrossRef] [PubMed]
  46. Xie, Q.; Ni, J.Q.; Su, Z. Fuzzy comprehensive evaluation of multiple environmental factors for swine building assessment and control. J. Hazard. Mater 2017, 340, 463–471. [Google Scholar] [CrossRef] [PubMed]
  47. Xie, Q.; Li, J.L.; Cao, S.L.; Guo, Y.H.; Liu, H.G.; Zheng, P.; Liu, W.Y.; Yu, H.M. Comprehensive Evaluation Method of Pig House Environment Based on Time Series Sequences. Trans. Chin. Soc. Agric. Mach. 2024, 55, 430–440. [Google Scholar]
Figure 1. Measurement point distribution map.
Agriculture 15 00584 g001
Figure 2. Membership function graphs of environmental factors. (A) Temperature; (B) relative humidity; (C) air velocity; (D) carbon dioxide; (E) ammonia.
Agriculture 15 00584 g002
Figure 3. Environmental factor scoring conversion curves. (A) Temperature; (B) relative humidity; (C) air velocity; (D) carbon dioxide; (E) ammonia.
Agriculture 15 00584 g003
Figure 4. Environmental factor radar chart.
Agriculture 15 00584 g004
Figure 5. The change in the comprehensive environmental comfort index in the house.
Agriculture 15 00584 g005
Figure 6. Distribution map of environmental factor comfort levels (uncomfortable zones (red), relatively comfortable zones (blue), and comfortable zones (green)). (A) Temperature; (B) relative humidity; (C) air velocity; (D) carbon dioxide; (E) ammonia.
Agriculture 15 00584 g006
Table 1. The maintenance structural materials of the piggery.
LocationComposition
Roof40 mm × 60 mm × 4 mm square steel frame + 100 mm polystyrene board + 1 mm color steel plate
Ceiling30 mm × 30 mm × 2 mm L-shaped angle steel frame + 50 mm polystyrene board + 1 mm double-layer color steel plate
Exterior wallExternal 100 mm polystyrene board + internal 240 mm brick concrete wall
Ground150 mm thick concrete, compacted
Door1.8 m wide, 2.0 m high inward-opening double wooden door, with cotton thermal insulation curtain
WindowPlastic steel frame, double glazing
Table 2. Sensor data sheet.
NameRangeResolutionPrecision
Ambient temperature sensor−40 °C~+80 °C0.1 °C±0.4 °C
Ambient humidity sensor0~100% RH0.1%±3% RH
NH3 sensor0~100 ppm1 ppm±8%
CO2 sensor0~10,000 ppm1 ppm±(45 ppm + 5% F·S)
Air velocity sensor0~60 m/s0.01 m/s±(0.2 m/s ± 0.02·v)
(v is the air velocity)
Table 3. The 9-point scaling method.
ScaleMeaning
1Indicates that the importance of the two indicators is the same
3Indicates that one indicator is slightly more important than the other
5Indicates that one indicator is significantly more important than the other
7Indicates that one indicator is strongly more important than the other
9Indicates that one indicator is extremely more important than the other
2, 4, 6, 8The medians of the adjacent judgments mentioned above
The reciprocal of the scale.If Indicator i is compared to Indicator j and the result is aij, then, when comparing Indicator j to Indicator i, the result is 1/aij
Table 4. Judgment matrix of environmental factor indicators.
Environmental FactorsTemperatureRelative HumidityAir VelocityCO2 ConcentrationNH3 Concentration
Temperature14255
Relative Humidity1/41223
Air Velocity1/21/2133
CO2 Concentration1/51/21/312
NH3 Concentration1/51/31/31/21
Table 5. Evaluation system of piggery comfort and environmental factors.
Comment SetFactor Set
Temperature
(℃)
Relative Humidity
(%)
Air Velocity
(m/s)
CO2 Concentration
(mg/m3)
NH3 Concentration
(mg/m3)
C18~2560~700.5~1.5<1500<15
R5~18 or 25~3040~60 or 60~800.2~0.5 or 1.5~2.51500~400015~25
U>30 or <5>70 or <60>2.5 or <0.2>4000>25
Table 6. Environmental assessment status of pig house.
Sampling TimeTemperature StatusRelative Humidity StatusAir Velocity StatusCO2 Concentration StatusNH3 Concentration StatusComprehensive Status
0:00UCCRCR
1:00URCRCR
2:00UCRRCR
3:00UCRRCR
4:00UCRRCR
5:00UCRRCR
6:00UCRRCR
7:00UCRRCR
8:00UCRRCR
9:00UCRRCR
10:00RRURCR
11:00RRRRCR
12:00CRURCR
13:00RRRRCR
14:00RRRRCR
15:00CRRRCR
16:00CRRRCR
17:00CRRRCR
18:00CRRRCC
19:00CRUUCC
20:00CCUUCR
21:00CCUUCR
22:00CCUUCR
23:00CCCRCR
Disclaimer/Publisher’s Note: The statements, opinions and data contained in all publications are solely those of the individual author(s) and contributor(s) and not of MDPI and/or the editor(s). MDPI and/or the editor(s) disclaim responsibility for any injury to people or property resulting from any ideas, methods, instructions or products referred to in the content.