1. Introduction
While the amount of land used for agriculture has remained steady over the past few decades, the number of agricultural workers as a percentage of the total population has been decreasing over the same time period all over the world [
1]. An increasing world population ensures that further increases in either the agricultural workforce or productivity are necessary to keep parts of the population from falling into hunger. Innovations in technological areas, such as network infrastructure and edge devices, have led to the advancement of smart farming, in which large tracts of land can be managed by fewer farmers, with the assistance of such technologies. However, misalignment between farmers and developers, in addition to the breakneck pace of development in fields such as artificial intelligence, means that a set of defined workflows and technologies for smart farming has yet to be established.
Apples are the third most consumed fruit in the world, comprising over 10% of total fruit consumption [
2]. Fruit consumption, as a whole, has been steadily increasing in Asia, with per capita consumption more than doubling since 1990. Apple farming is a challenging task as trees larger than human laborers must be harvested and protected from natural predators and excessive heat, which, in particular, is bound to increase with increasing global warming. In addition, apple farming requires much domain-specific knowledge, which may not be accessible to beginning farmers. Thus, smart farming systems that target apple orchards would have a large impact both on individual farmers and, eventually, on the global economy. As physically demanding operations and a large body of necessary domain-specific knowledge are issues across a large swath of agriculture, such smart farming systems would also have a large demand among farmers of many high-value crops.
One branch of smart farming concerns the development of agricultural digital twins, in which physical data obtained from part or whole farms are reproduced in a virtual space. Example applications include remote monitoring and usage as an environment for robots to learn automated tasks to be performed in the field. Current challenges in the development of agricultural digital twins include how to take raw data and shape them into a format understandable and analyzable by human users. Advances in artificial intelligence in the field of machine vision offer a solution for automated data collection and curation for use in digital twins. While much research has been performed on object detection of objects with easily recognizable characteristics, such as fruits and flowers of said fruits, other objects such as trees prove more challenging. In particular, trees captured in images have several characteristics that make detection challenging, a lack of continuity of pixels of the same tree, which leads to difficulty in distinguishing trees partially occluded by other trees. Accurately detecting the number and position of orchard trees is important for extracting the state of the orchard, detecting rare events such as extreme weather events, which impact the health of the orchard, harvest management, and other applications.
In this research, we propose an object detector for detecting trees in an apple orchard as a first step in extracting data to be processed for agricultural digital twins. We produced an original dataset at an orchard and used a Single Shot MultiBox Detector (SSD) and You Only Look Once (YOLO) for apple tree detection. We evaluated the accuracy of these two methods and offered future steps in developing human-explainable agricultural digital twins.
2. Related Work
2.1. Digital Twins in Agriculture
Agricultural digital twins differ from those in other fields, such as in manufacturing, in several important ways. In manufacturing, there are several distinct stages in which the digital twin plays different roles. Grieves, an early promoter of digital twins in product lifecycle management, describes these roles as “conceptualization”, “comparison”, and “collaboration” [
3]. In other words, before a physical twin is produced, a digital twin of the proposed product is designed, and after the physical twin comes into existence, the two twins are constantly compared to check the production process and used in collaboration to optimize the product/process design.
On the other hand, while comparison between the physical and digital twins will also occur in agriculture, there is no final ending point at which the system can be determined to be “optimized”. Additionally, while manufactured products are often well-defined by meshes produced in CAD programs and well-fitted by existing sensors, similar levels of modeling accuracy for objects such as trees and weeds require much more complexity in measurement and visual representation, with corresponding increases in computational and memory resources. As a result, the first proposals for the usage of digital twins in agriculture were made several years after those in other fields such as aerospace engineering and manufacturing.
Digital twins in agriculture span a wide variety of setups and scales, from system control to disease prevention and from single crops to worldwide resource monitoring [
4]. While some proposed digital twins are vague in their problem statement, there are a number of specific digital twin systems that have been tested to some degree.
On the scale of individual crops, livestock, or machinery, there are several digital twins that have been proposed. Kampker et al. proposed several business models and systems revolving around the use of a plastic potato equipped with sensors to provide information about the damage incurred during potato harvesting [
5].
On the farm scale, there have been several systems proposed. Tsolakis et al. developed a system based on the Robot Operating System (ROS) for testing the performance of unmanned ground vehicles (UGVs) on 3D landscapes loaded from OpenStreetMaps with additional manually added static objects such as trees and rocks [
6]. This system can theoretically use the data obtained from the digital twin to automate UGVs in the physical twin. Lowe et al. proposed a system for measuring the canopy density of vineyards using a spinning LiDAR [
7]. They collected data over several vineyards over multiple seasons and additionally proposed several methods for comparing results within and across growing seasons.
2.2. Smart Farming in Apple Orchards
Williams et al. proposed a data management system for orchards that revolves around fruit quality monitoring and traceability [
8]. Costes et al. developed a computational model of an apple tree that modeled stochastic behaviors such as branching by a hidden Markov model and mechanical effects such as gravity using the finite difference method [
9]. This simplified apple tree model was used by Da Silva et al. to investigate the relationship between apple tree topological characteristics and overall light absorption [
10].
LiDAR (light detection and ranging) sensors have often been used to obtain physical characteristics such as the leaf area density (LAD) and the silhouette to total leaf area ratio (STAR) [
11,
12]. However, only bulk values can be obtained since LiDAR is a sparse sampling measurement method, and faithful 3D reconstruction requires exceedingly long sampling times or over-simplified conditions. For example, in Sanz et al., the LiDAR sensor was attached to a tractor driven at 1–2 km/h, an unwieldy value for practical applications [
11], while in Coupel-Ledru et al., LiDAR measurements were taken in October, after the end of the harvest season [
12].
Some work has been performed on the 3D reconstruction of sections of apple orchards without the use of LiDAR. For example, Dong et al. used RGB and RGB-D cameras to reconstruct portions of an apple orchard using a method based on structure from motion (SfM); however, their method takes over 40 min to reconstruct a 15 m row [
13]. The advantages and disadvantages of approaches based on LiDAR and RGB camera images are given in
Table 1.
3. Materials and Methods
3.1. Method Overview
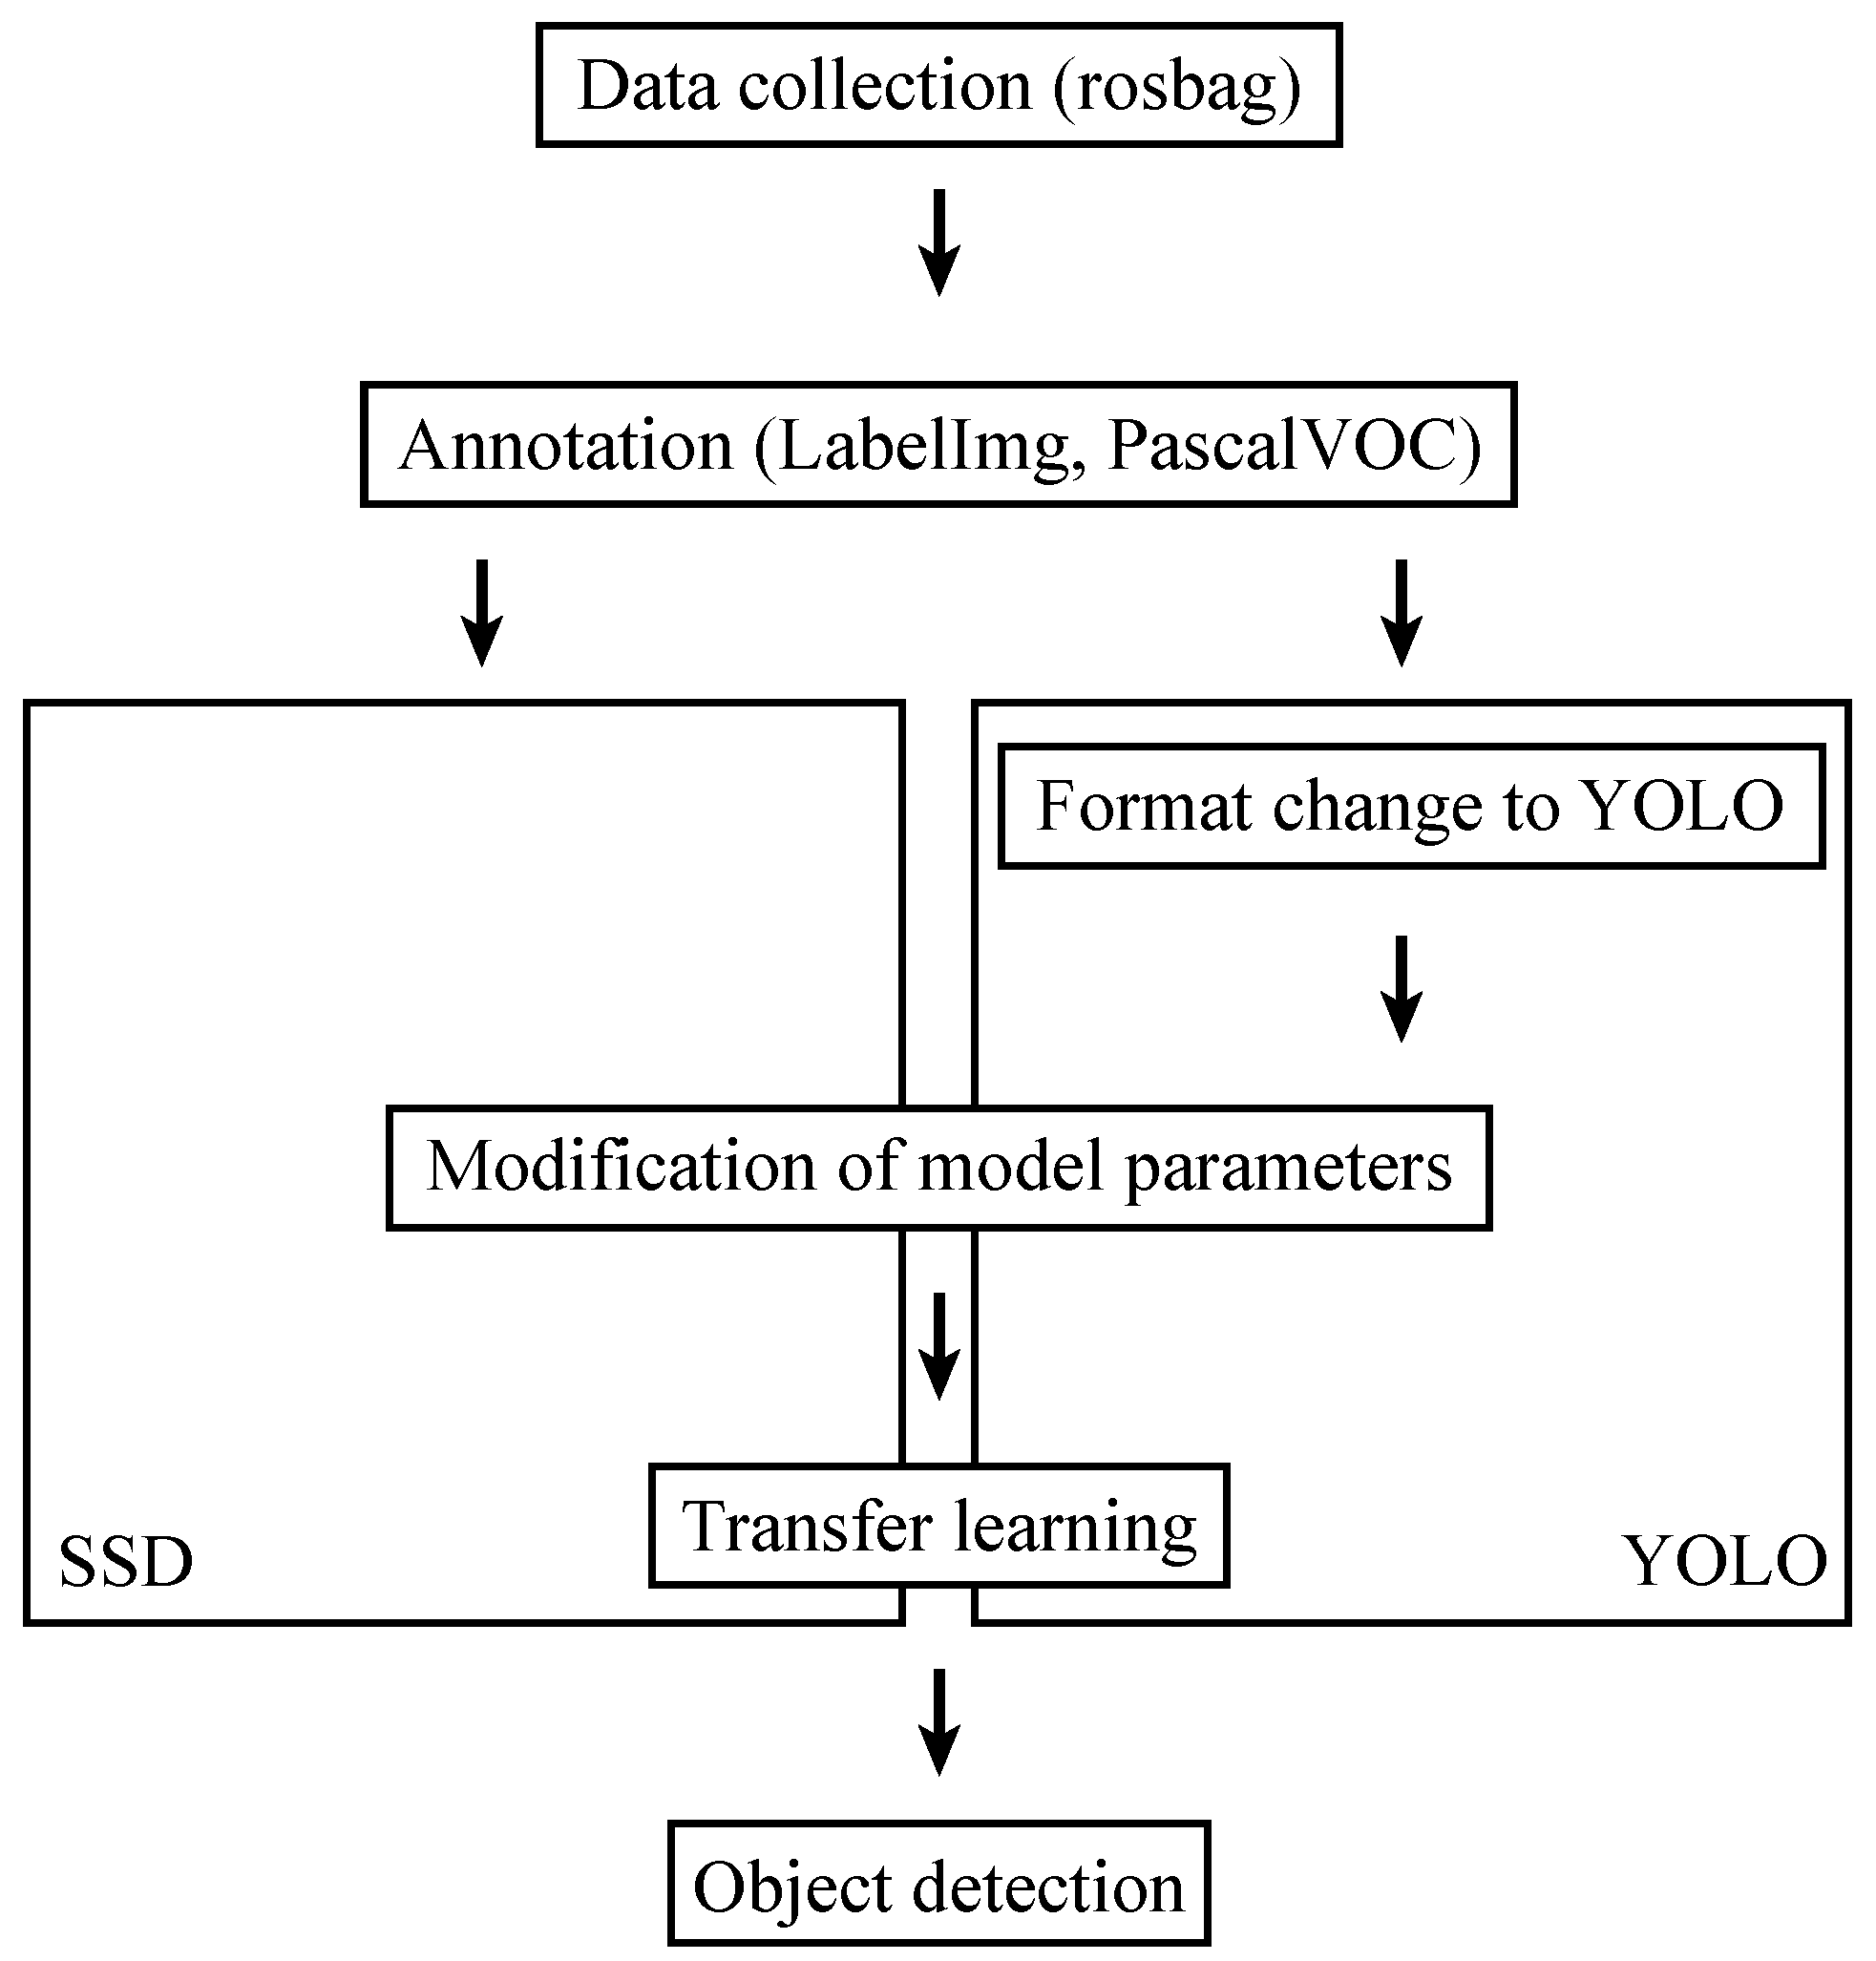
An overview of the experiments performed in this paper is given in
Figure 1. First, we collected data at an orchard dedicated to agricultural research, as explained in
Section 3.2. Then, orchard trees were annotated using LabelImg and saved to the Pascal VOC format, as explained in
Section 3.3. For data loaded into YOLO, the annotation data were additionally converted to the YOLO format. Model hyperparameters for SSD and YOLO, which are explained in more detail in
Section 3.4, were varied as explained in
Section 3.5 to optimize the model via transfer learning. Finally, object detection results were evaluated as described in
Section 3.6.
3.2. Data Collection
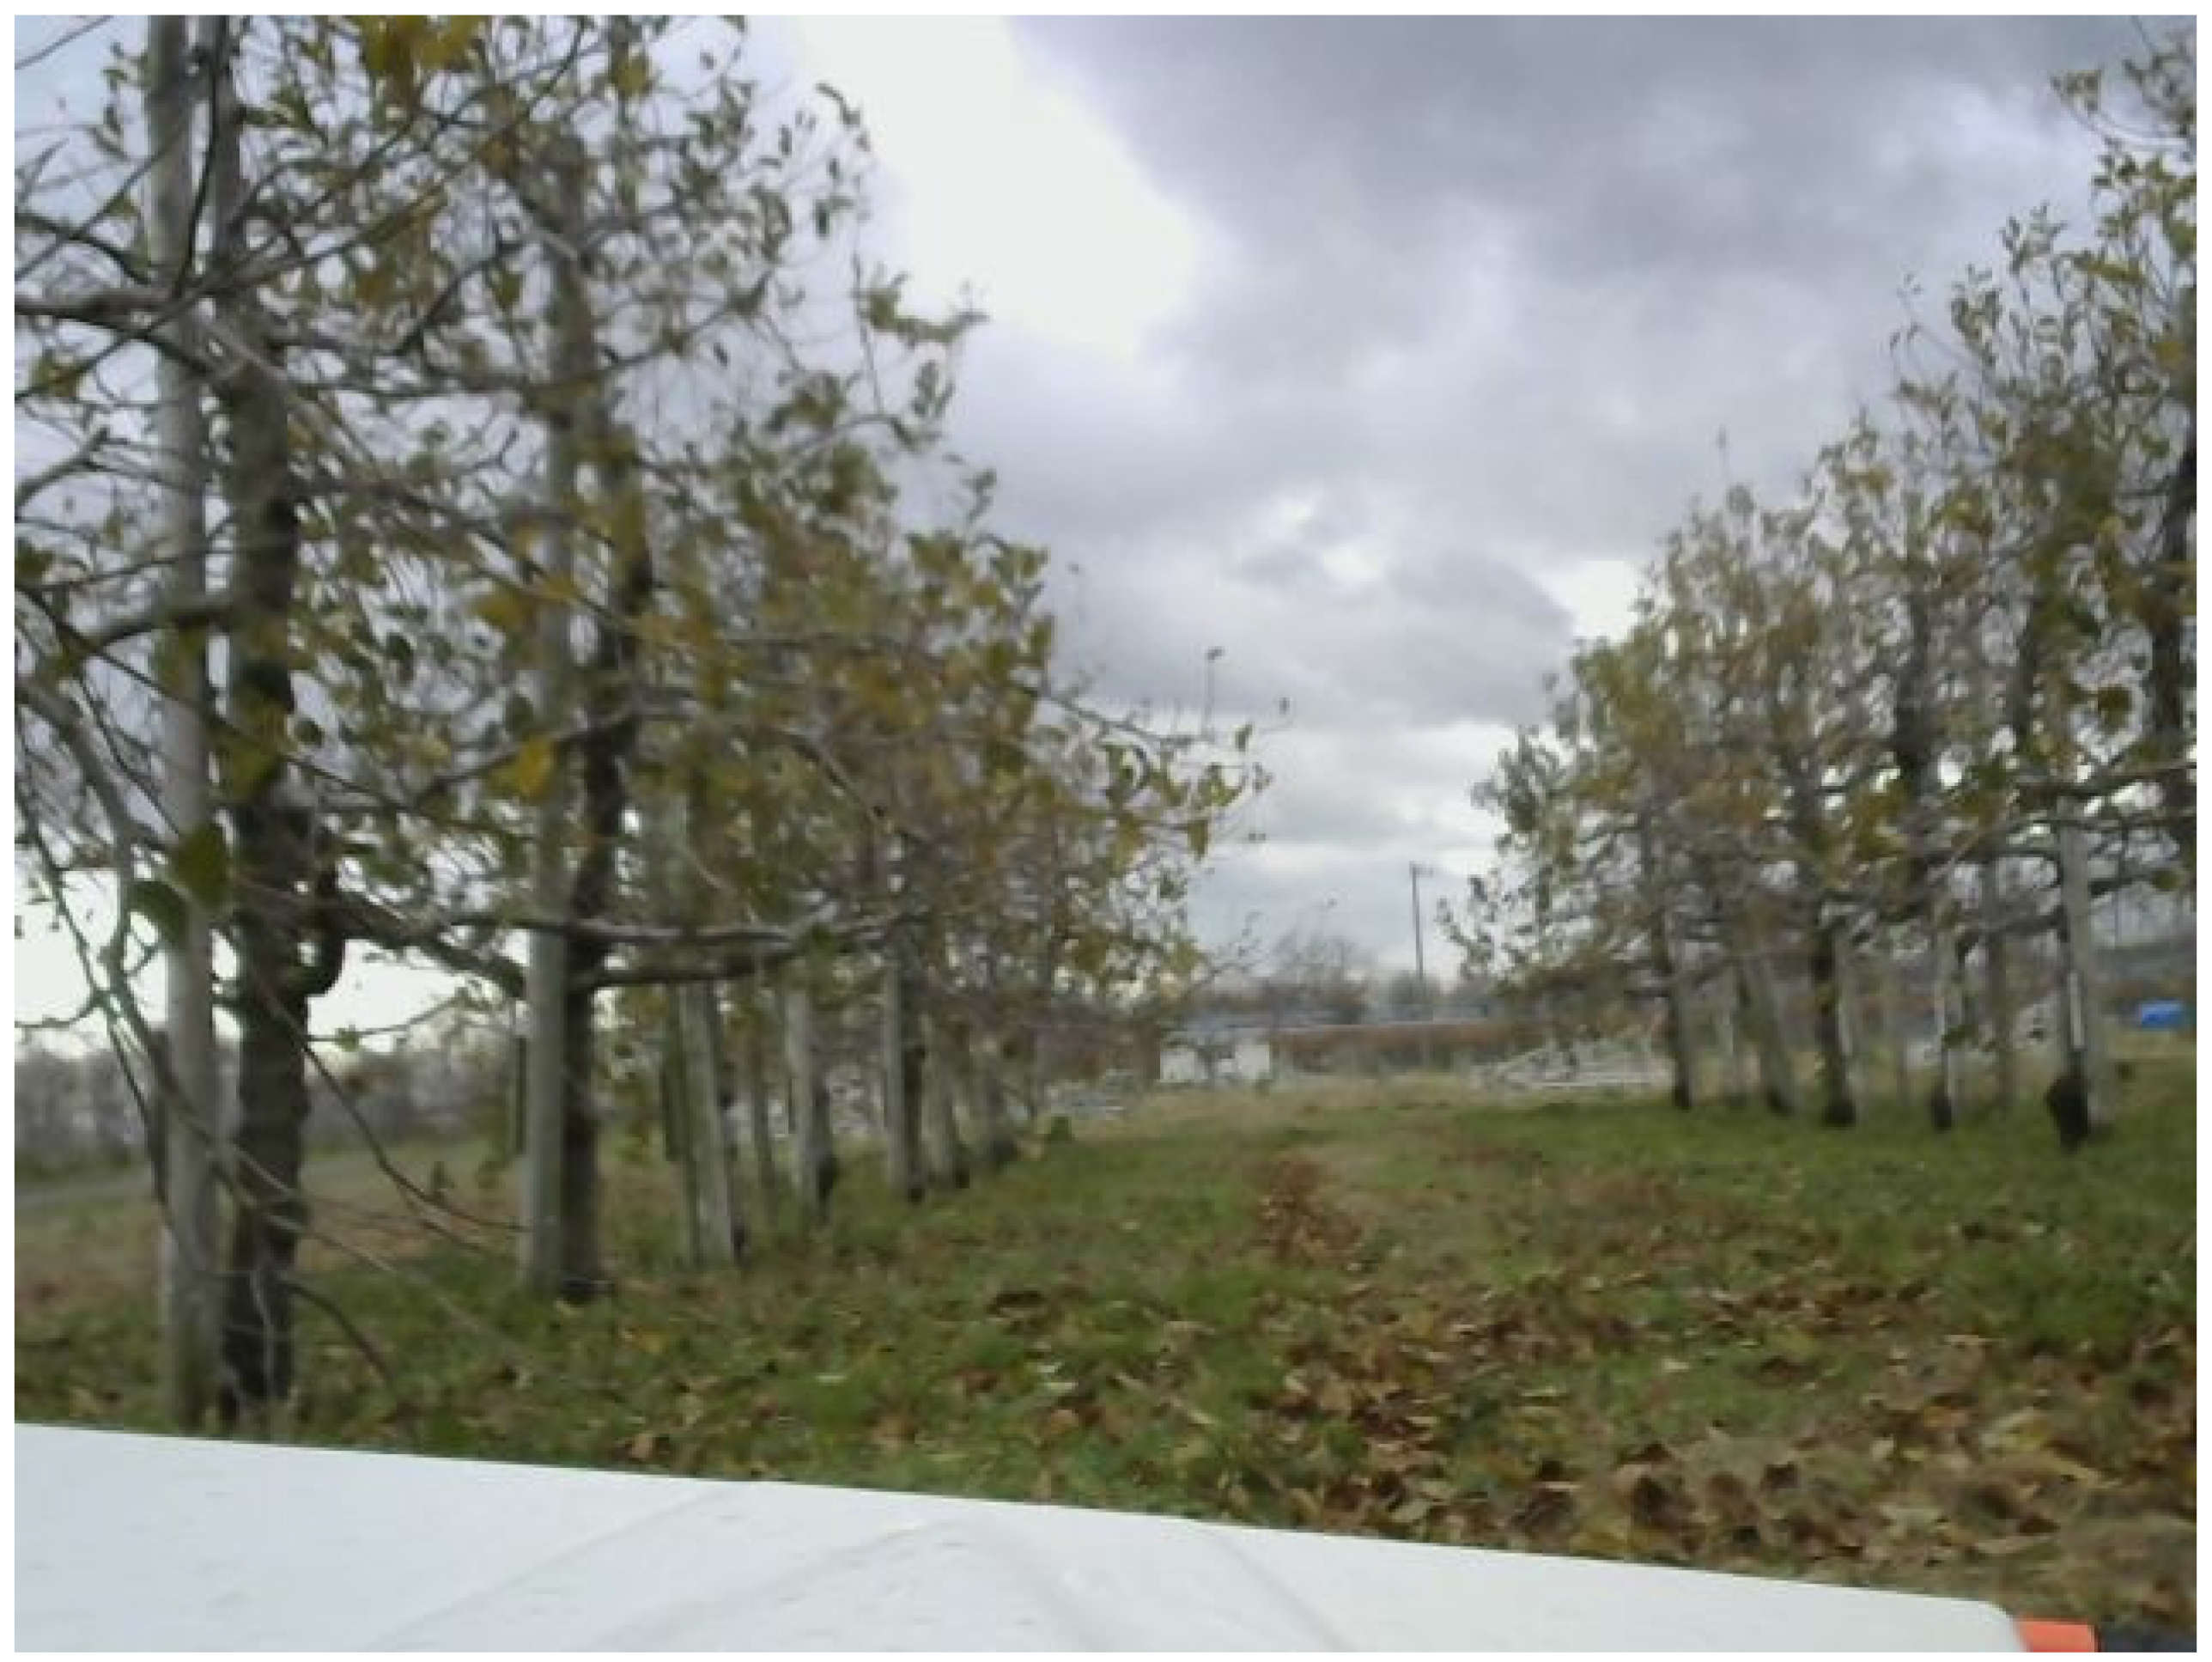
Dataset acquisition was performed at an orchard of size 60 m × 100 m located within Akita Prefectural University, Ogata Campus in December 2021. The layout of the orchard is illustrated in
Figure 2, with several parameters shown in
Table 2. This area in northern Japan has a climate of Dfa in the Köppen–Geiger climate classification system, which means that the climate is cold with hot summers and no dry season [
14]. The dataset was obtained by moving a robot along three rows of the orchard and extracting the resulting video data collected by a webcam (Logicool C310n) connected to a Raspberry Pi 3B+ from a rosbag file. The dataset consisted of 213 images of an apple orchard, divided into training and validation sets in a ratio of 9:1. An example image from our dataset is shown in
Figure 3.
3.3. Annotation
A dataset of images containing apple trees was prepared for the annotation process. LabelImg [
15], an open-source graphical image annotation tool, was configured to meet the specific requirements of the annotation task, including the definition of class labels and annotation output formats.
Images from the dataset were selected for annotation and loaded into LabelImg. The annotation process involved manually drawing bounding boxes around the fruit trees in the selected images. Each bounding box encapsulated the tree trunk to prevent overlap between trees. In addition to bounding boxes, each annotated fruit tree was assigned the tree label. Upon completion of the annotation process, the annotated data were exported to the Pascal VOC format and, in the case of YOLO training, the YOLO format.
3.4. Object Detection Methods
The major types of methods used for extracting objects in computer vision include object detection and semantic segmentation. While the use of semantic segmentation can provide more precise information about object positions and the assigned class of all the physical objects and space in the given images, a large amount of manpower is required to produce annotated images to be used in supervised learning. For this dataset in particular, it is difficult to determine which leaves belong to which trees, so annotating segmentation masks by hand would likely lead to many errors in the ground truth data. In addition, since the narrower branches of the trees are not always clearly shown in all images, attempts at instance segmentation would lead to inference results that would lack large parts of the trees due to an apparent lack of pixel continuity between these parts. Thus, we have chosen to focus on object detection models in this study. In order to focus on the objects to be explicitly extracted for representation in a digital twin as well as to minimize the work necessary to fine-tune the below models, we chose two popular object detection models to detect apple trees in our dataset.
3.4.1. SSD
The structure of the SSD network is as follows. Images are resized to 300 × 300 pixels and fed into a modified VGG-16 [
16] backbone. The results of the 10th and 16th convolutions are extracted. The output of the final convolution in the VGG network is also fed into an extra network with 4 convolutional layers, with the output of each convolution also saved. These 6 outputs are used as the input for two additional networks: one that outputs the center position as well as the width and height of bounding boxes and one that outputs the confidence for each class that is being predicted.
The benefit of using SSD is that, by extracting feature maps of different sizes at different parts of the training network and using them to predict boxes in parallel, objects of different sizes can be detected. However, as the smaller feature maps have undergone more convolutions than the larger feature maps, it is more difficult to detect objects that are relatively small in the input image.
3.4.2. YOLO
While SSD uses separate networks to predict bounding box locations and confidence scores for each class, YOLO (You Only Look Once) uses a single network to predict BBoxes, confidence scores, and class probabilities. YOLOv4 [
17] takes as input a 448 px × 448 px image and divides it into
grid cells. We chose YOLOv4 because the development of earlier versions of YOLO focused on systematically optimizing the backbone architecture and other modules in the network, while later versions often show minor updates with a development process that is not always made public.
For each cell, it predicts the location of
B bounding boxes and a confidence score for each box expressed by
. Here, the left term represents the probability that an object exists in the bounding box, and IoU (intersection of union) is the overlap of the bounding boxes of the ground truth and predicted boxes, independent of class. Additionally, class probabilities
for
C classes are calculated for each grid cell and are dependent on the condition that an object exists in the cell. The output of the network is an
matrix that gives predictions for each grid cell, a vector
that gives the center
, dimensions
, and confidence for each bounding box, and class probabilities for each class in the grid. The Darknet-53 backbone [
18] was used.
3.5. Training Conditions
Training was performed using Google Colaboratory. Conditions specific to each model are outlined below.
3.5.1. SSD
Using weights that were trained on ImageNet, transfer learning was performed as follows. For training the SSD network, the dataset was divided into a training set and a validation set in an 8:2 ratio. To introduce additional variation and enhance the robustness of the model, the training images were randomly flipped horizontally or vertically with a probability of 0.5. The optimizer used for training was Adam, a popular optimization algorithm. A base learning rate of 0.0003 was set to control the rate at which the model’s parameters were adjusted during training. The training process spanned 200 epochs, allowing the model to iteratively learn and refine its predictions over time. The backbone architecture utilized in the SSD was VGG-16, a deep convolutional neural network known for its strong feature extraction capabilities.
Additionally, the training process involved experimenting with different numbers of frozen layers, specifically 3, 4, and 5. By freezing certain layers during training, the model’s capacity to learn specific features can be controlled and fine-tuned. Furthermore, various batch sizes were explored, including 8, 16, and 32, which determine the number of samples processed in each training iteration. The selection of an appropriate batch size helps balance computational efficiency and model performance. These additional conditions were considered to optimize the training process and improve the overall performance of the SSD model.
3.5.2. YOLO
Similarly, for training the YOLO model, the backbone architecture chosen was Darknet53, a deep neural network known for its ability to extract high-level features effectively. The training process involved experimenting with different numbers of frozen layers, specifically 1, 3, 4, and 5. Freezing layers during training allows for controlling the feature learning process and fine-tuning specific parts of the model. Furthermore, different batch sizes were explored, including 8 and 16, to determine the optimal trade-off between computational efficiency and model performance. The batch size determines the number of samples processed in each training iteration, affecting the training speed and memory requirements. These additional conditions were considered to optimize the training process and enhance the overall performance of the YOLO model.
3.6. Evaluation Metrics
Here, we use the mean average precision (mAP) to evaluate the performance of these two different networks. mAP is defined as the mean of the average precision (AP) over
N classes; here, we only perform detection on a single class, trees, so mAP = AP. The average precision is calculated by calculating the precision for several thresholds of the overlap between the ground truth and inference bounding boxes, or the IoU, and averaging over these precisions. Inference results in which the IoU exceeds the threshold are classified as true positives (TP), while inference results that do not have a corresponding ground truth result, and vice versa, are treated as false positives (FP) and false negatives (FN), respectively. The precision
p and recall
r are given respectively as
On a precision–recall curve (PRC), with the precision
p on the vertical axis and the recall
r on the horizontal axis for a number of IoU thresholds, AP can also be calculated as the area under the curve. In this study, we calculate mAP, using this second method, which is expressed as follows:
4. Results
4.1. Training Results
Here, we show some examples in
Figure 4 of the loss when training using SSD and YOLO. Training runs were allowed to run until convergence could be confirmed. In the case of the SSD, this was 200 epochs, while for YOLO, this was for 4000 iterations, or 500 and 250 epochs for batch sizes of 8 and 16, respectively. In the test data given for the SSD training, overfitting was not observed. Loss graphs for other conditions exhibited similar behavior in terms of amplitude and convergence with respect to epoch number.
The dependence of confidence score with respect to batch size and quality of tree detection is shown in
Figure 5. In the case of the SSD, the number of BBoxes is very sensitive to the confidence score in the range 0.5–0.6. The number of BBoxes increases by an order of magnitude for a confidence score of 0.6 as compared to 0.5 for a batch number of 32, and a similar number of BBoxes is observed for the other batch sizes at a confidence score of 0.5. The number of BBoxes also increases with batch size, with the number of overlapping BBoxes increasing with batch size.
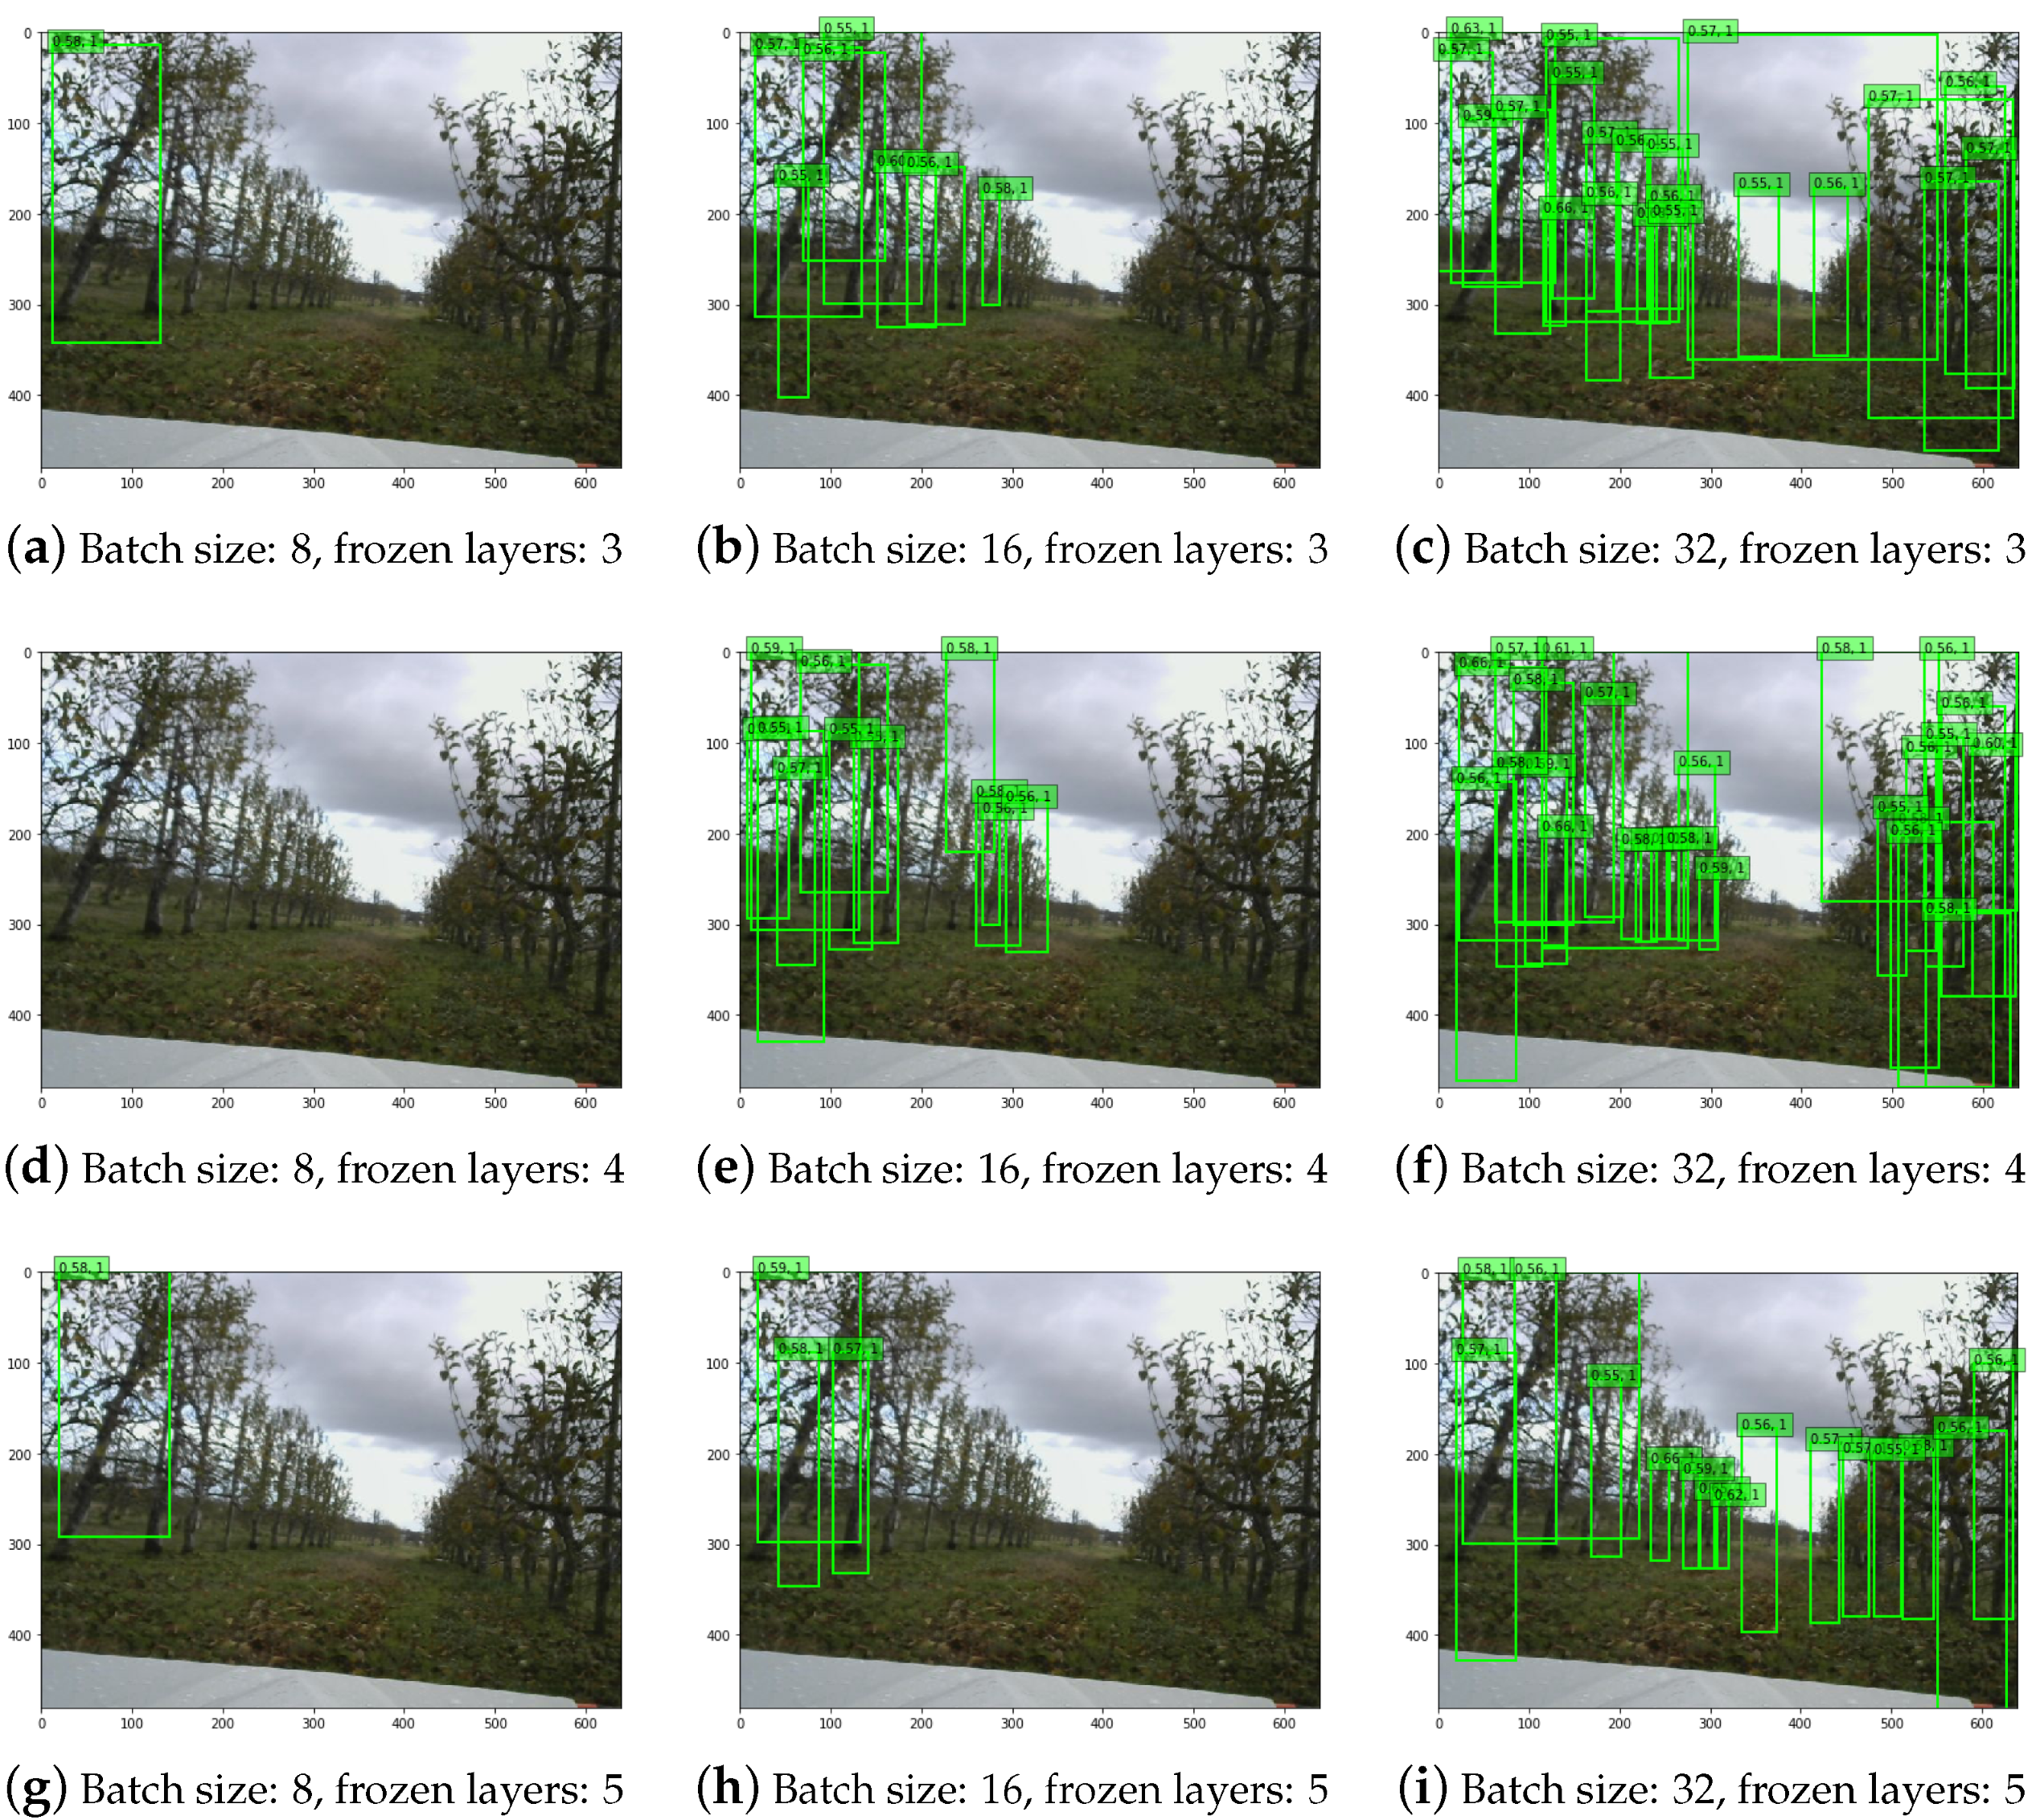
Next, we examine the effect of changes in the number of frozen layers and batch size with constant confidence threshold in
Figure 6. Since the BBoxes are concentrated on the left hand side, they must be easier to detect. As the batch size is increased, the number of BBoxes also increases, but the accuracy of the BBoxes is nearly the same. When the batch size is set to 8, trees are not detected, but at batch sizes of 16 and 32, the number of BBoxes increases more than the increase in the number of frozen layers. At batch sizes of 16 and 32, changing the number of frozen layers does not change the BBox confidence. At a batch size of 32, there are many BBoxes with high confidence. In general, the small number of BBoxes and low confidence are likely due to the size of the dataset.
Here, we consider the effect of batch size and the number of frozen layers on YOLO results.
Figure 7 shows an example of the output produced by YOLO. Unlike the SSD, both rows of trees are being detected and at further distances from the camera. The results are not strongly dependent on changing batch size and number of frozen layers; however, when the number of frozen layers is increased, trees start to be doubly detected.
4.2. Quantitative Results
Using the evaluation metric mAP introduced in
Section 2, we compare SSD and YOLO. Values of mAP for SSD and YOLO are shown in
Figure 8. Large variations in the SSD mAP are observed, with changes in the batch size and number of frozen layers tending to lead to decreases in performance. In all cases, the mAP for YOLO is larger than that of the SSD, with a large batch size and a small number of frozen layers leading to the best performance. This suggests that, while pretrained weights provide a good starting point for training, the task of detecting trees relative to the background is distinctly different from a multi-class object detection task.
Another work that uses object detection in agricultural applications is Li et al., in which object detection in an agricultural greenhouse was performed using SSD and YOLOv3 [
19]. We compare the average values of mAP they obtained with our results in
Table 3. Our mAP for the SSD is around 30% smaller than their value, which is likely due to the size of our dataset. We obtained a higher mAP for YOLOv4 at 91.3%. Since the VGG-16 backbone is used for the SSD, it may experience more difficulty in detecting complex objects, such as apple trees, compared to aerial views of greenhouses that appear distinct relative to the background. Darknet-53, the backbone used in YOLOv3 and v4, is more capable of extracting more diverse and complex features, which leads to this increase in detection accuracy.
Sapkota et al. used the instance segmentation heads of YOLOv8 and Mask R-CNN to detect apple fruit, as well as the trunks and branches of apple trees [
20]. While their YOLO model shows competitive results to ours for the single-class problem of fruit detection, when they expanded the number of classes for tree detection, they experienced a decrease in the mAP (
Table 3). In some cases of tree monitoring, the instance segmentation approach of Sapkota et al. will have advantages in some cases. However, as a single tree may not necessarily be observed as connected in a single image, an object detection approach may be more useful for detecting whole trees in images.
5. Discussion
In this study, we performed a visual inspection and numerical comparison of two deep learning algorithms for the detection of apple trees in an orchard. We found that YOLO performed nearly twice as well as SSD when an original dataset was used in transfer learning. These results were independent with respect to parameters such as the batch size, confidence threshold, and number of frozen layers.
Limitations of this study include a small dataset that may not reflect the wide variety of meteorological conditions that orchards experience, such as snowfall, rain, and more extreme events. In order to incorporate these changes into our model, long-term observational studies of the orchard environment using systems that can record in extreme environments should be implemented. The development of a diverse dataset could also be assisted by the use of style transfer methods that use generative deep learning models, such as diffusion models.
Future work will explore methods in which to incorporate orchard data into an agricultural digital twin. The explosion in research on three-dimensional reconstruction suggests that an orchard digital twin could be constructed directly from images. However, the complexity of tree shapes leaves much room for improvement in areas from automated annotation to three-dimensional object reconstruction. Thus, an object detection algorithm that projects two-dimensional predictions onto a three-dimensional space could be proposed. Then, by combining visual orchard data with other types of IoT devices, such as temperature and humidity sensors, an automated multi-modal approach to orchard reconstruction that reduces the workload of farmers can be imagined. By incorporating deep learning methods into this digital twin, extensions such as the optimization of agricultural operations such as irrigation, as well as the detection of rare events such as natural disasters, could also be implemented.
Author Contributions
Conceptualization, H.M., S.N. and S.Y.; methodology, H.M., S.N. and A.S.; software, A.S.; validation, H.M., S.N. and A.S.; formal analysis, S.N. and A.S.; investigation, A.S.; resources, Y.N. and S.Y.; data curation, A.S.; writing—original draft preparation, S.N.; writing—review and editing, S.N.; visualization, S.N. and A.S.; supervision, Y.N. and K.S.; project administration, S.N.; funding acquisition, S.Y. All authors have read and agreed to the published version of the manuscript.
Funding
This research received no external funding.
Institutional Review Board Statement
Not applicable.
Data Availability Statement
The raw data supporting the conclusions of this article will be made available by the authors on request.
Acknowledgments
We gratefully acknowledge the work of Masashi Satoh and the contributions of past and present horticultural officers of the Agri-Innovation Education and Research Center at Akita Prefectural University, as well as the support of Naoko Kitamoto with regards to orchard cultivation and data management.
Conflicts of Interest
The authors declare no conflicts of interest.
Abbreviations
The following abbreviations are used in this manuscript:
| BBox | bounding box |
| IoU | intersection of union |
| LiDAR | light detection and ranging |
| ROS | Robot Operating System |
| SSD | Single Shot MultiBox Detector |
| UGV | unmanned ground vehicle |
| YOLO | You Only Look Once |
References
- FAOSTAT. Available online: https://www.fao.org/faostat/en/#data/RL/visualize (accessed on 15 January 2025).
- Fruit Consumption by Fruit Type. Available online: https://ourworldindata.org/grapher/fruit-consumption-by-fruit-type (accessed on 15 January 2025).
- Grieves, M. Digital Twin: Manufacturing Excellence Through Virtual Factory Replication; Technical Report. 2015. Available online: https://www.3ds.com/fileadmin/PRODUCTS-SERVICES/DELMIA/PDF/Whitepaper/DELMIA-APRISO-Digital-Twin-Whitepaper.pdf (accessed on 15 January 2025).
- Pylianidis, C.; Osinga, S.; Athanasiadis, I.N. Introducing digital twins to agriculture. Comput. Electron. Agric. 2021, 184, 105942. [Google Scholar] [CrossRef]
- Kampker, A.; Stich, V.; Jussen, P.; Moser, B.; Kuntz, J. Business Models for Industrial Smart Services—The Example of a Digital Twin for a Product-Service-System for Potato Harvesting. Procedia CIRP 2019, 83, 534–540. [Google Scholar] [CrossRef]
- Tsolakis, N.; Bechtsis, D.; Bochtis, D. AgROS: A Robot Operating System Based Emulation Tool for Agricultural Robotics. Agronomy 2019, 9, 403. [Google Scholar] [CrossRef]
- Lowe, T.; Moghadam, P.; Edwards, E.; Williams, J. Canopy Density Estimation in Perennial Horticulture Crops Using 3D Spinning Lidar SLAM. J. Field Robot. 2021, 38, 598–618. [Google Scholar] [CrossRef]
- Williams, S.R.; Agrahari Baniya, A.; Islam, M.S.; Murphy, K. A Data Ecosystem for Orchard Research and Early Fruit Traceability. Horticulturae 2023, 9, 1013. [Google Scholar] [CrossRef]
- Costes, E.; Smith, C.; Renton, M.; Guédon, Y.; Prusinkiewicz, P.; Godin, C. MAppleT: Simulation of apple tree development using mixed stochastic and biomechanical models. Funct. Plant Biol. 2008, 35, 936. [Google Scholar] [CrossRef] [PubMed]
- Da Silva, D.; Han, L.; Faivre, R.; Costes, E. Influence of the variation of geometrical and topological traits on light interception efficiency of apple trees: Sensitivity analysis and metamodelling for ideotype definition. Ann. Bot. 2014, 114, 739–752. [Google Scholar] [CrossRef] [PubMed]
- Sanz, R.; Rosell, J.; Llorens, J.; Gil, E.; Planas, S. Relationship between tree row LIDAR-volume and leaf area density for fruit orchards and vineyards obtained with a LIDAR 3D Dynamic Measurement System. Agric. For. Meteorol. 2013, 171–172, 153–162. [Google Scholar] [CrossRef]
- Coupel-Ledru, A.; Pallas, B.; Delalande, M.; Boudon, F.; Carrié, E.; Martinez, S.; Regnard, J.L.; Costes, E. Multi-scale high-throughput phenotyping of apple architectural and functional traits in orchard reveals genotypic variability under contrasted watering regimes. Hortic. Res. 2019, 6, 52. [Google Scholar] [CrossRef] [PubMed]
- Dong, W.; Roy, P.; Isler, V. Semantic Mapping for Orchard Environments by Merging Two-Sides Reconstructions of Tree Rows. J. Field Robot. 2020, 37, 97–121. [Google Scholar] [CrossRef]
- Beck, H.E.; McVicar, T.R.; Vergopolan, N.; Berg, A.; Lutsko, N.J.; Dufour, A.; Zeng, Z.; Jiang, X.; van Dijk, A.I.J.M.; Miralles, D.G. High-resolution (1 km) Köppen-Geiger maps for 1901–2099 based on constrained CMIP6 projections. Sci. Data 2023, 10, 724. [Google Scholar] [CrossRef] [PubMed]
- Heartexlabs/labelImg. 2022. Available online: https://github.com/heartexlabs/labelImg (accessed on 15 January 2025).
- Simonyan, K.; Zisserman, A. Very Deep Convolutional Networks for Large-Scale Image Recognition. arXiv 2015, arXiv:1409.1556. [Google Scholar] [CrossRef]
- Bochkovskiy, A.; Wang, C.Y.; Liao, H.Y.M. YOLOv4: Optimal Speed and Accuracy of Object Detection. arXiv 2020, arXiv:2004.10934. [Google Scholar] [CrossRef]
- Redmon, J.; Farhadi, A. YOLOv3: An Incremental Improvement. arXiv 2018, arXiv:1804.02767. [Google Scholar] [CrossRef]
- Li, M.; Zhang, Z.; Lei, L.; Wang, X.; Guo, X. Agricultural Greenhouses Detection in High-Resolution Satellite Images Based on Convolutional Neural Networks: Comparison of Faster R-CNN, YOLO v3 and SSD. Sensors 2020, 20, 4938. [Google Scholar] [CrossRef] [PubMed]
- Sapkota, R.; Ahmed, D.; Karkee, M. Comparing YOLOv8 and Mask RCNN for object segmentation in complex orchard environments. Qeios 2023. [Google Scholar] [CrossRef]
| Disclaimer/Publisher’s Note: The statements, opinions and data contained in all publications are solely those of the individual author(s) and contributor(s) and not of MDPI and/or the editor(s). MDPI and/or the editor(s) disclaim responsibility for any injury to people or property resulting from any ideas, methods, instructions or products referred to in the content. |
© 2025 by the authors. Licensee MDPI, Basel, Switzerland. This article is an open access article distributed under the terms and conditions of the Creative Commons Attribution (CC BY) license (https://creativecommons.org/licenses/by/4.0/).


 ,
, 


