
Corn Seed Quality Detection Based on Spectroscopy and Its Imaging Technology: A Review

 ,
,
Abstract
1. Introduction
2. Introduction of NIRS and HSI Technologies
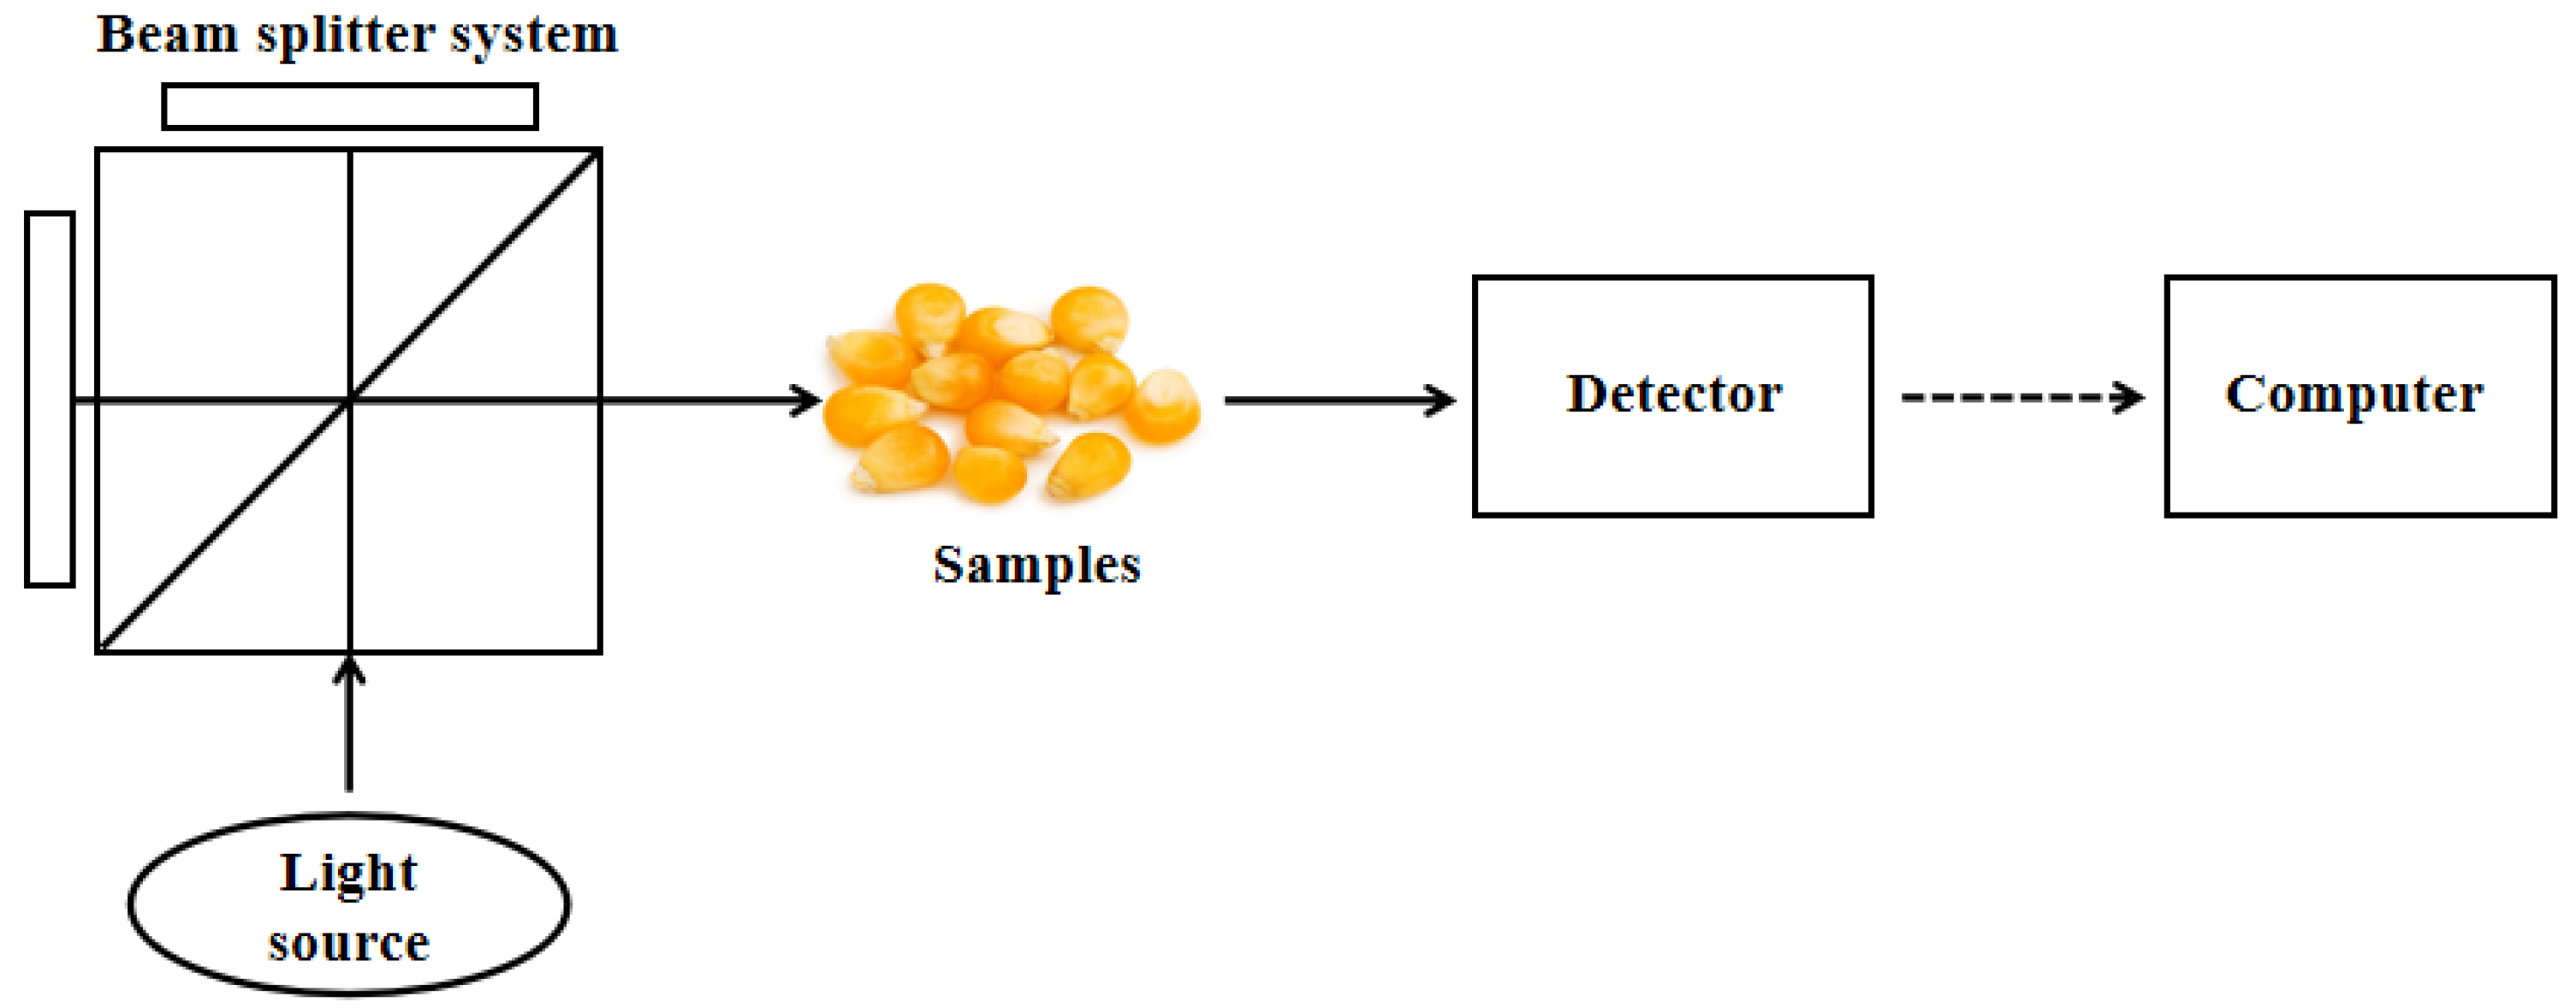
2.1. Basic Principles and Characteristics of NIRS
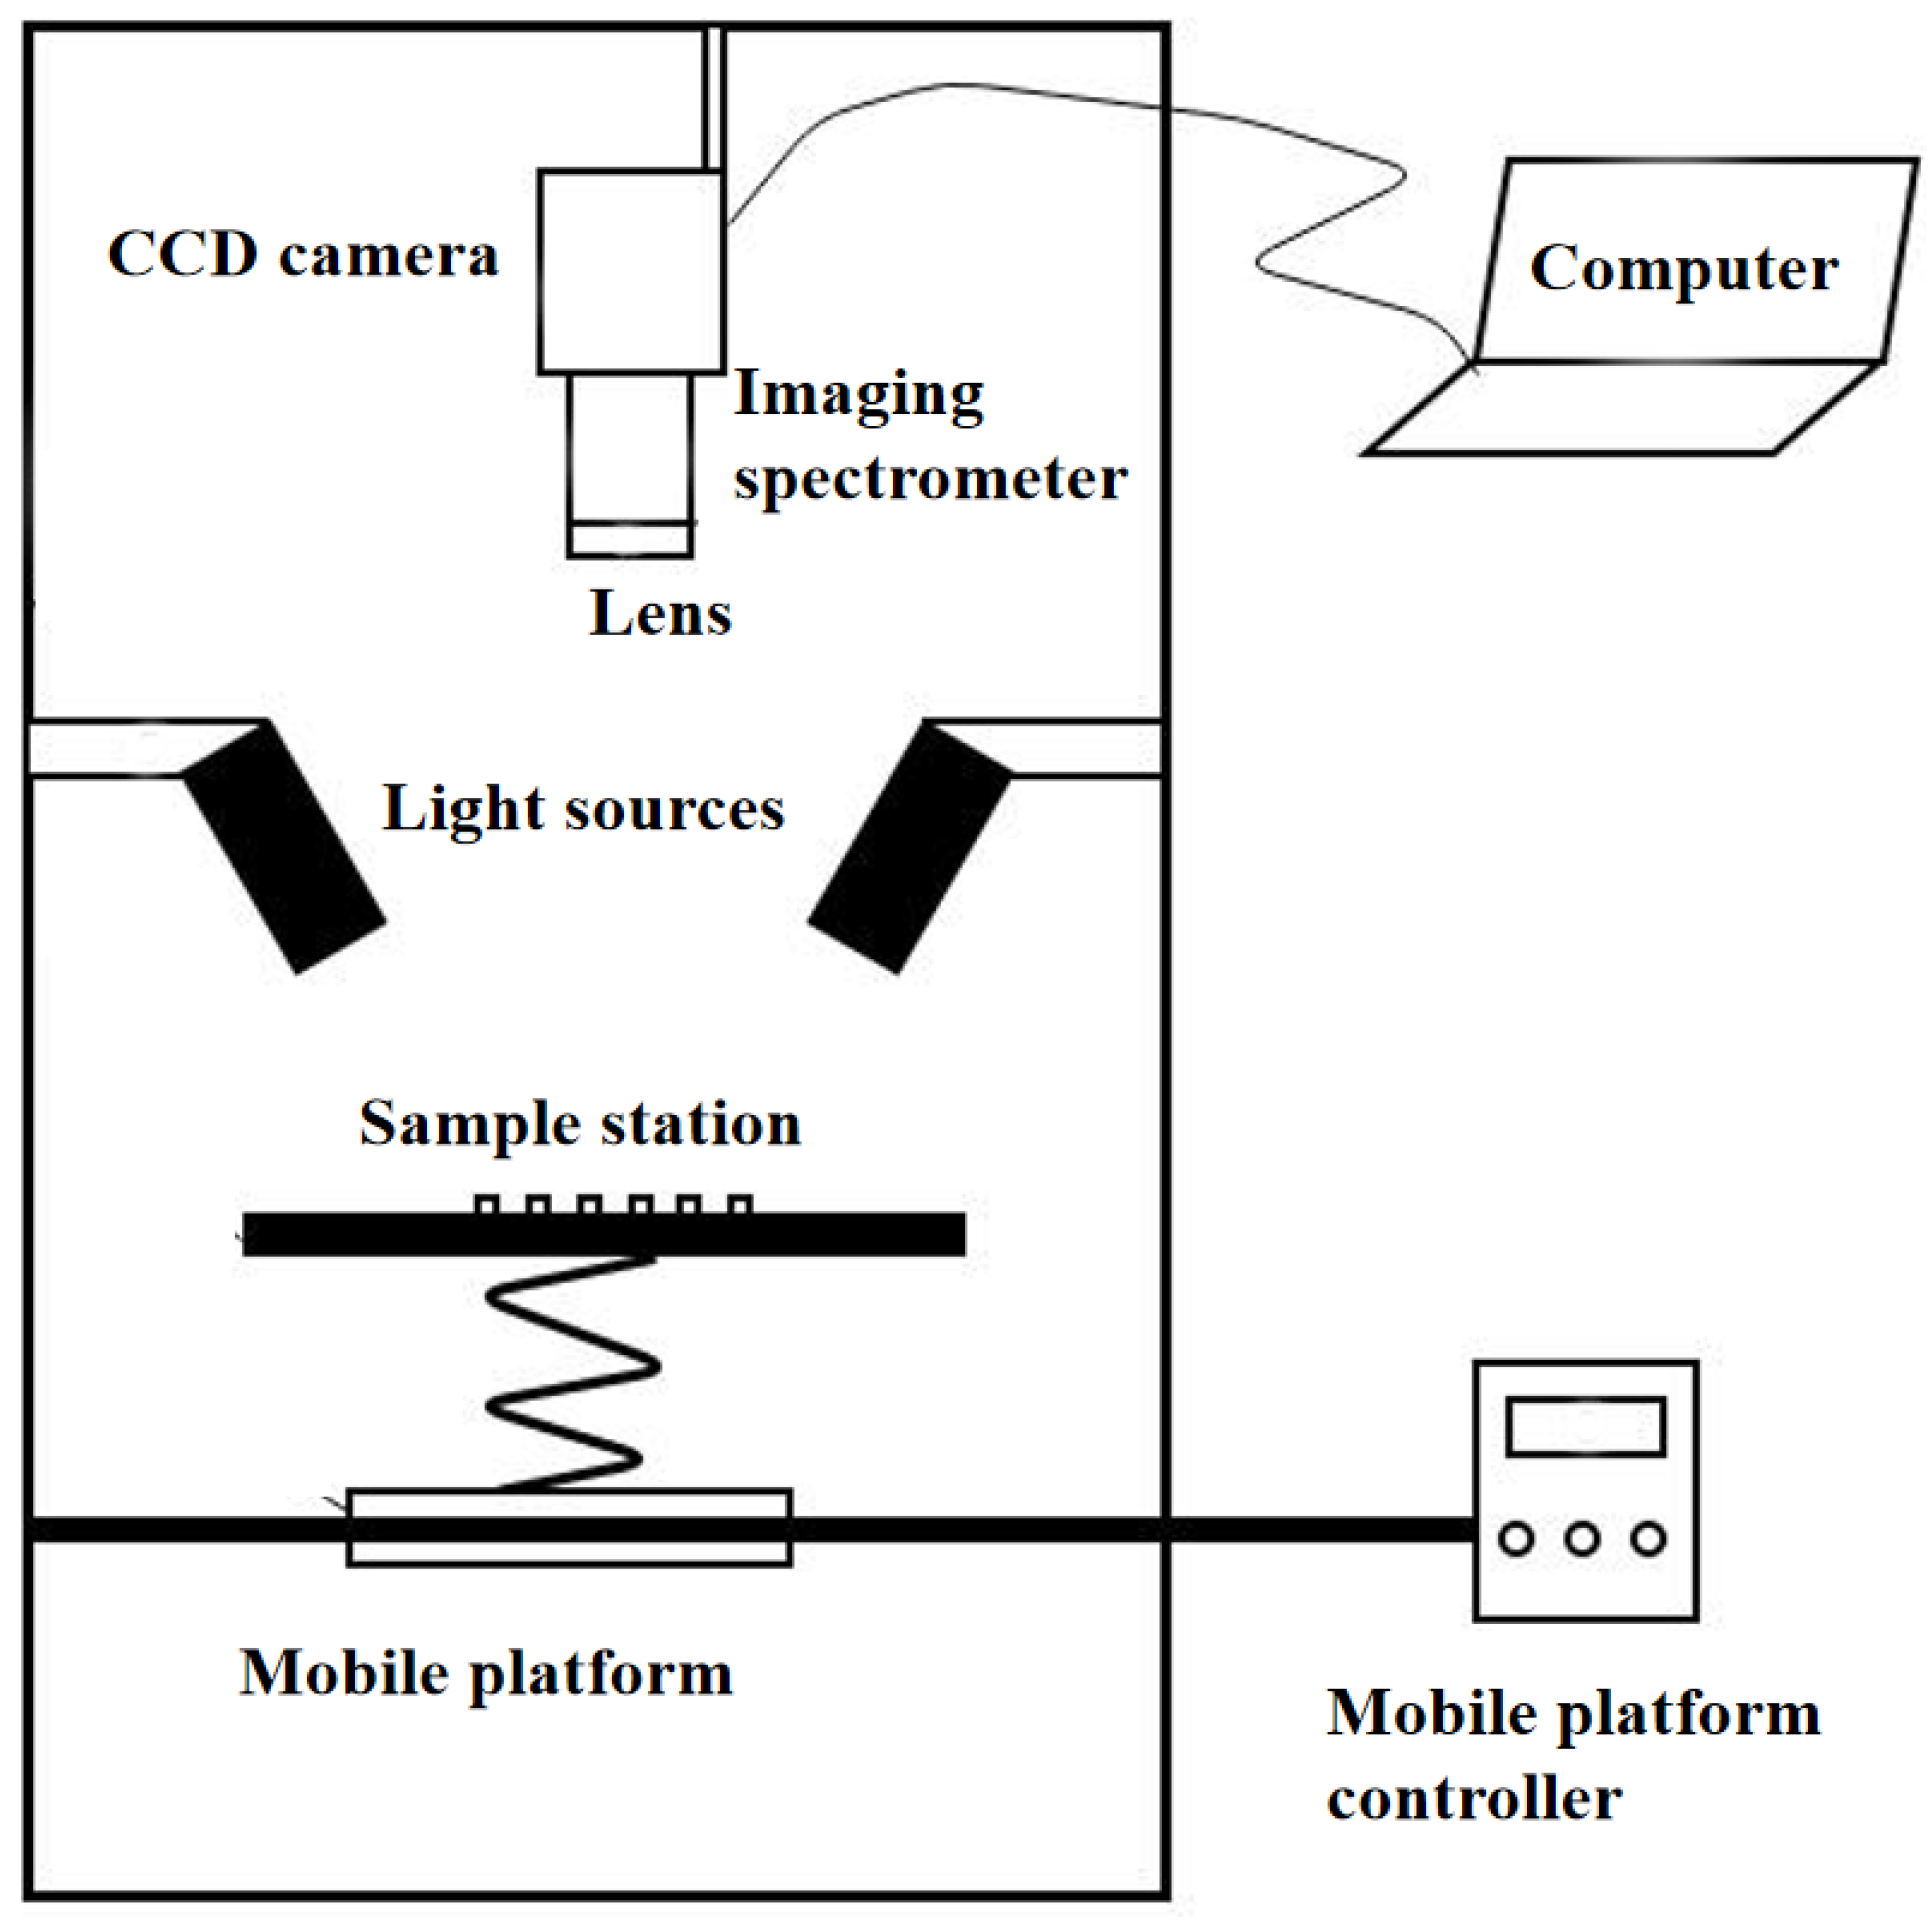
2.2. Basic Principles and Characteristics of HSI
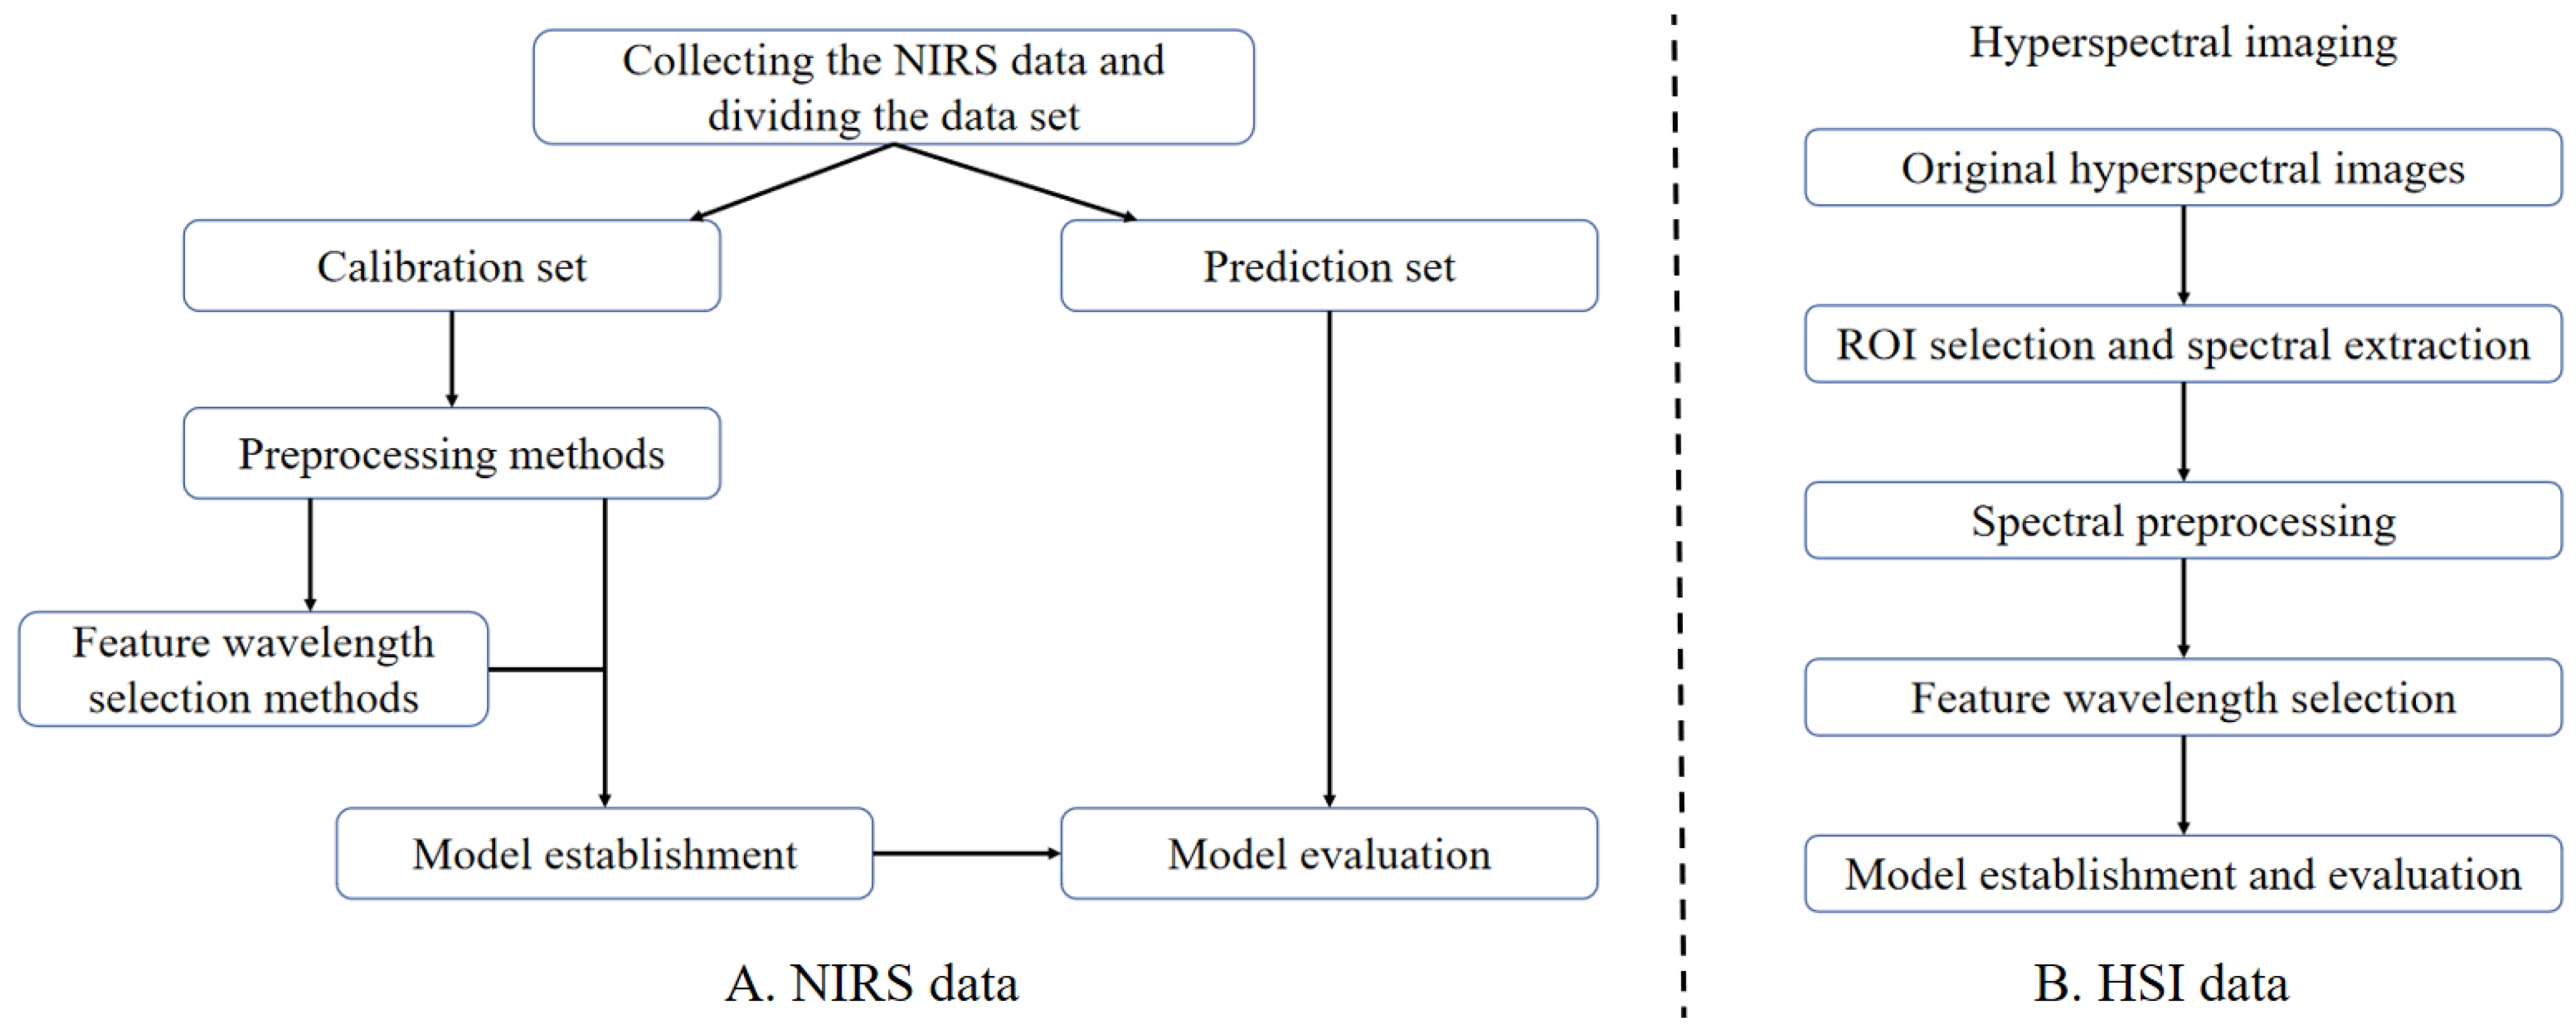
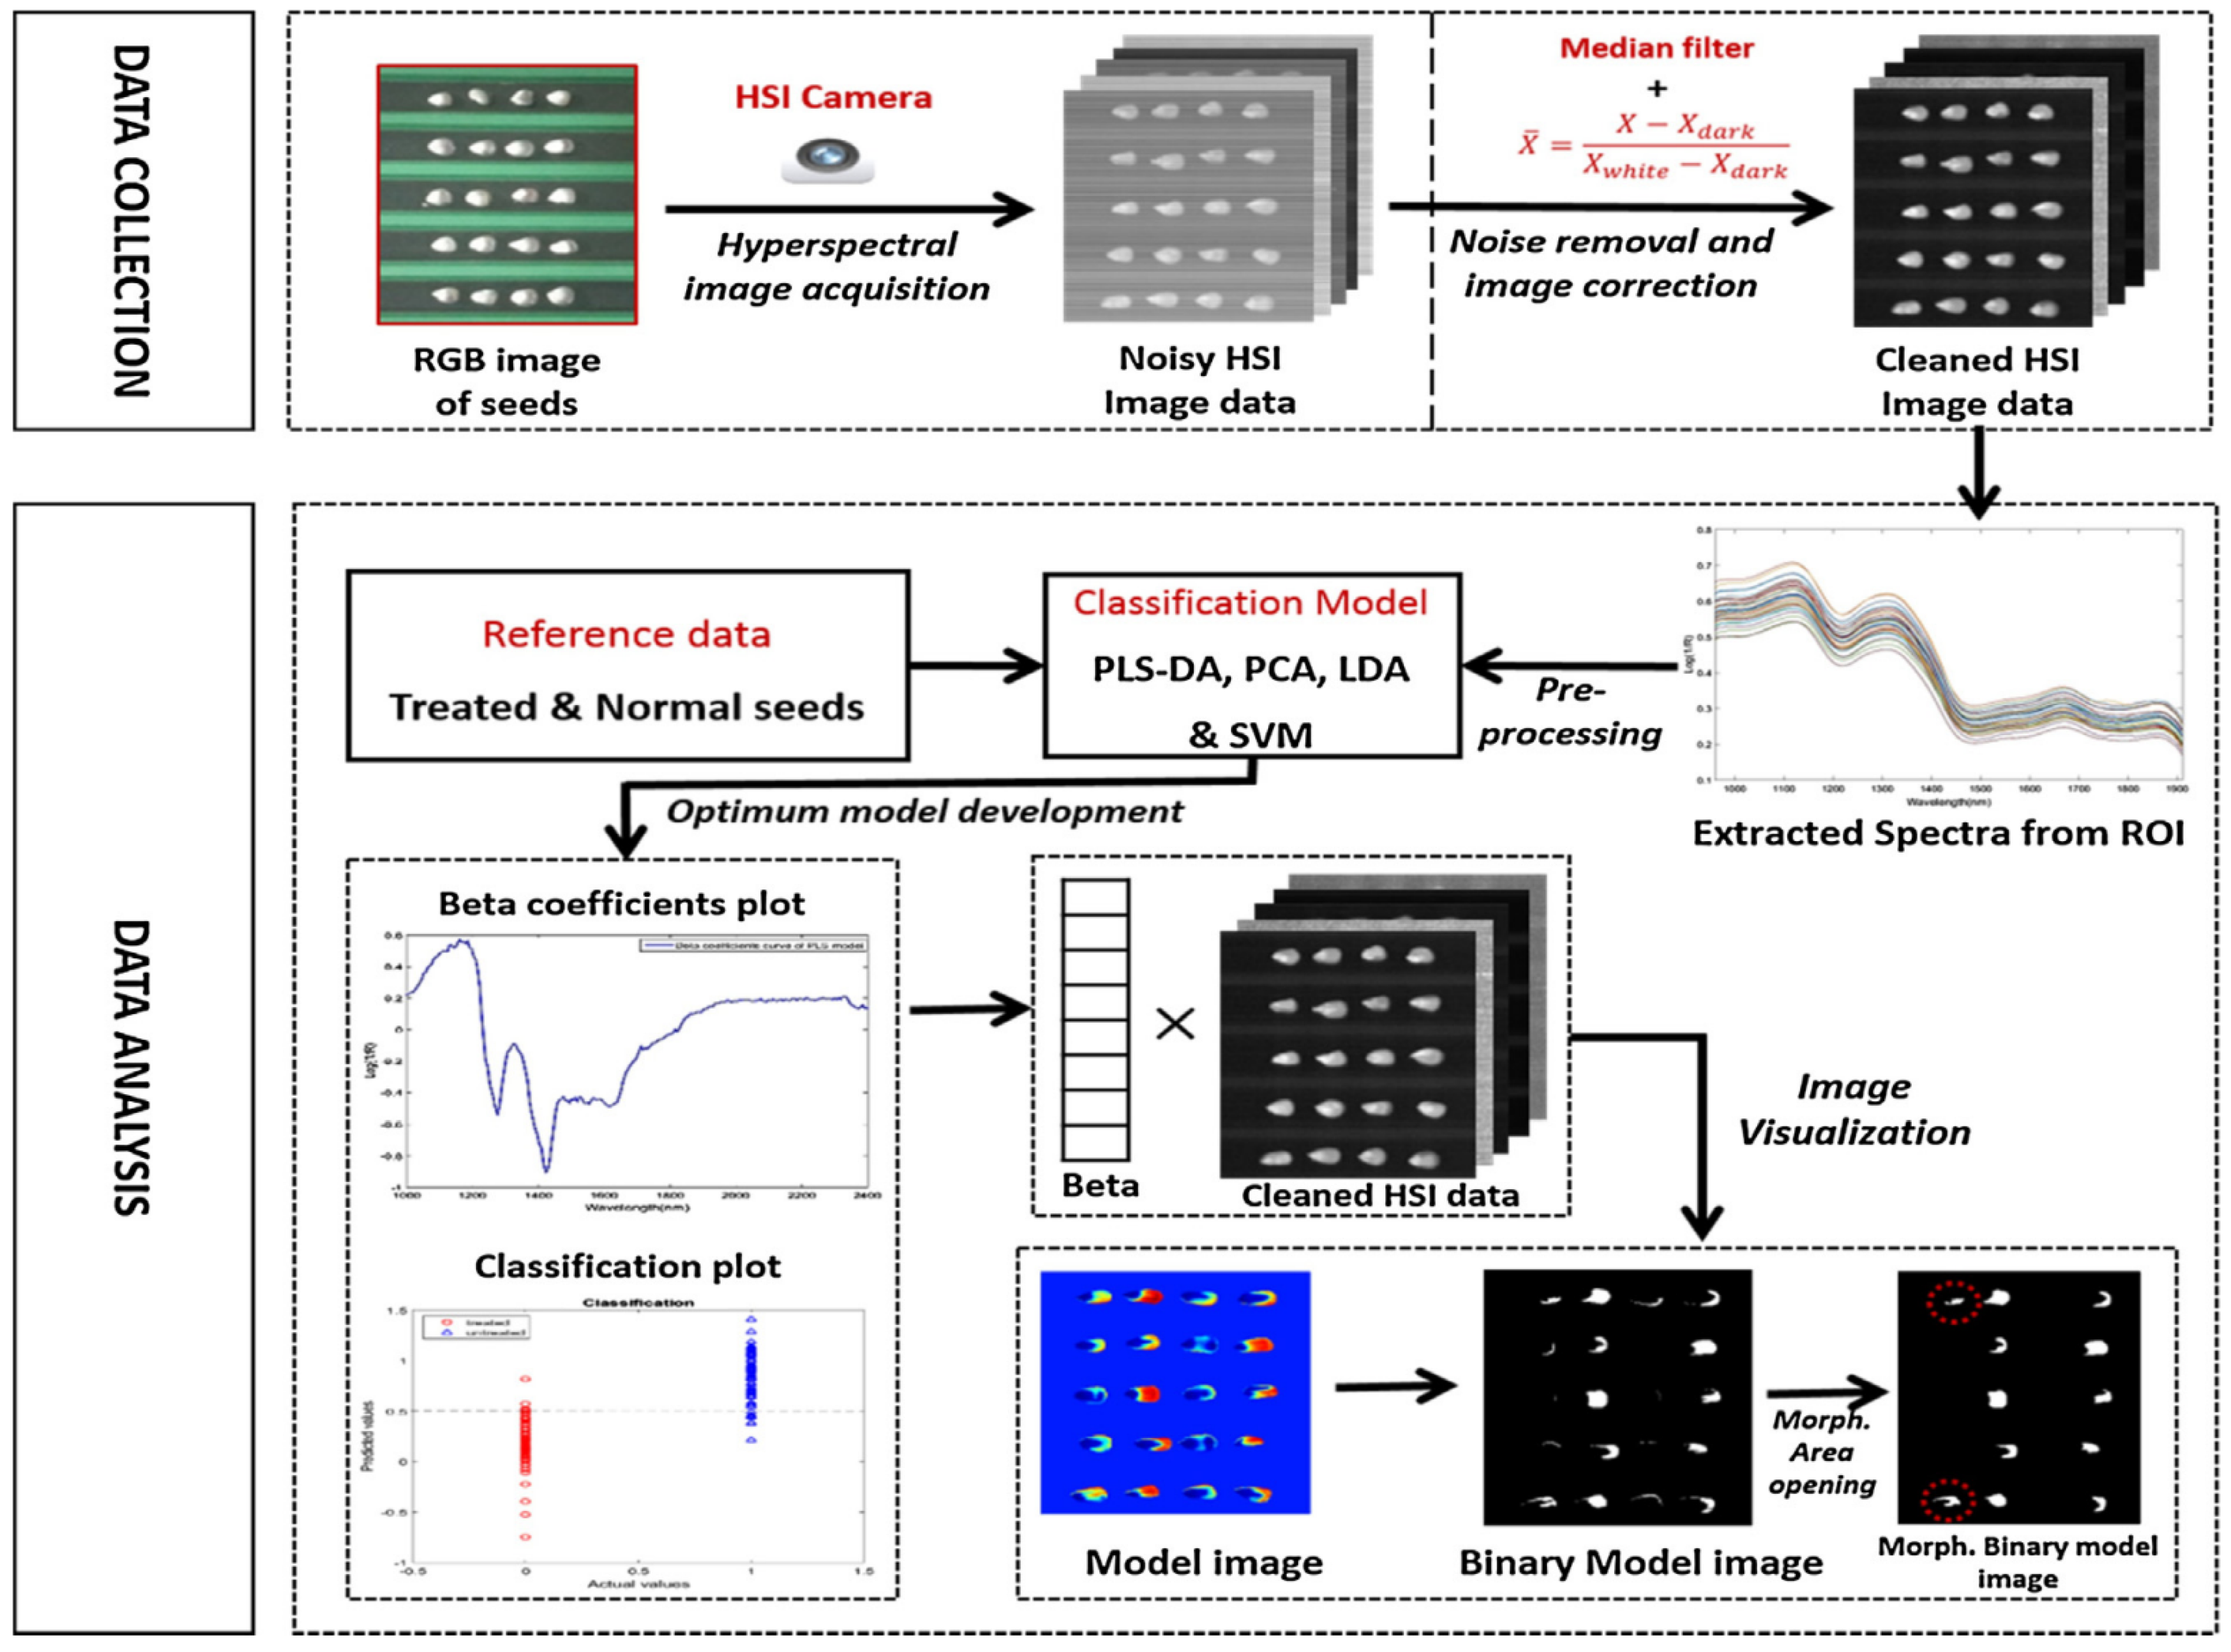
2.3. The Data Processing Methods
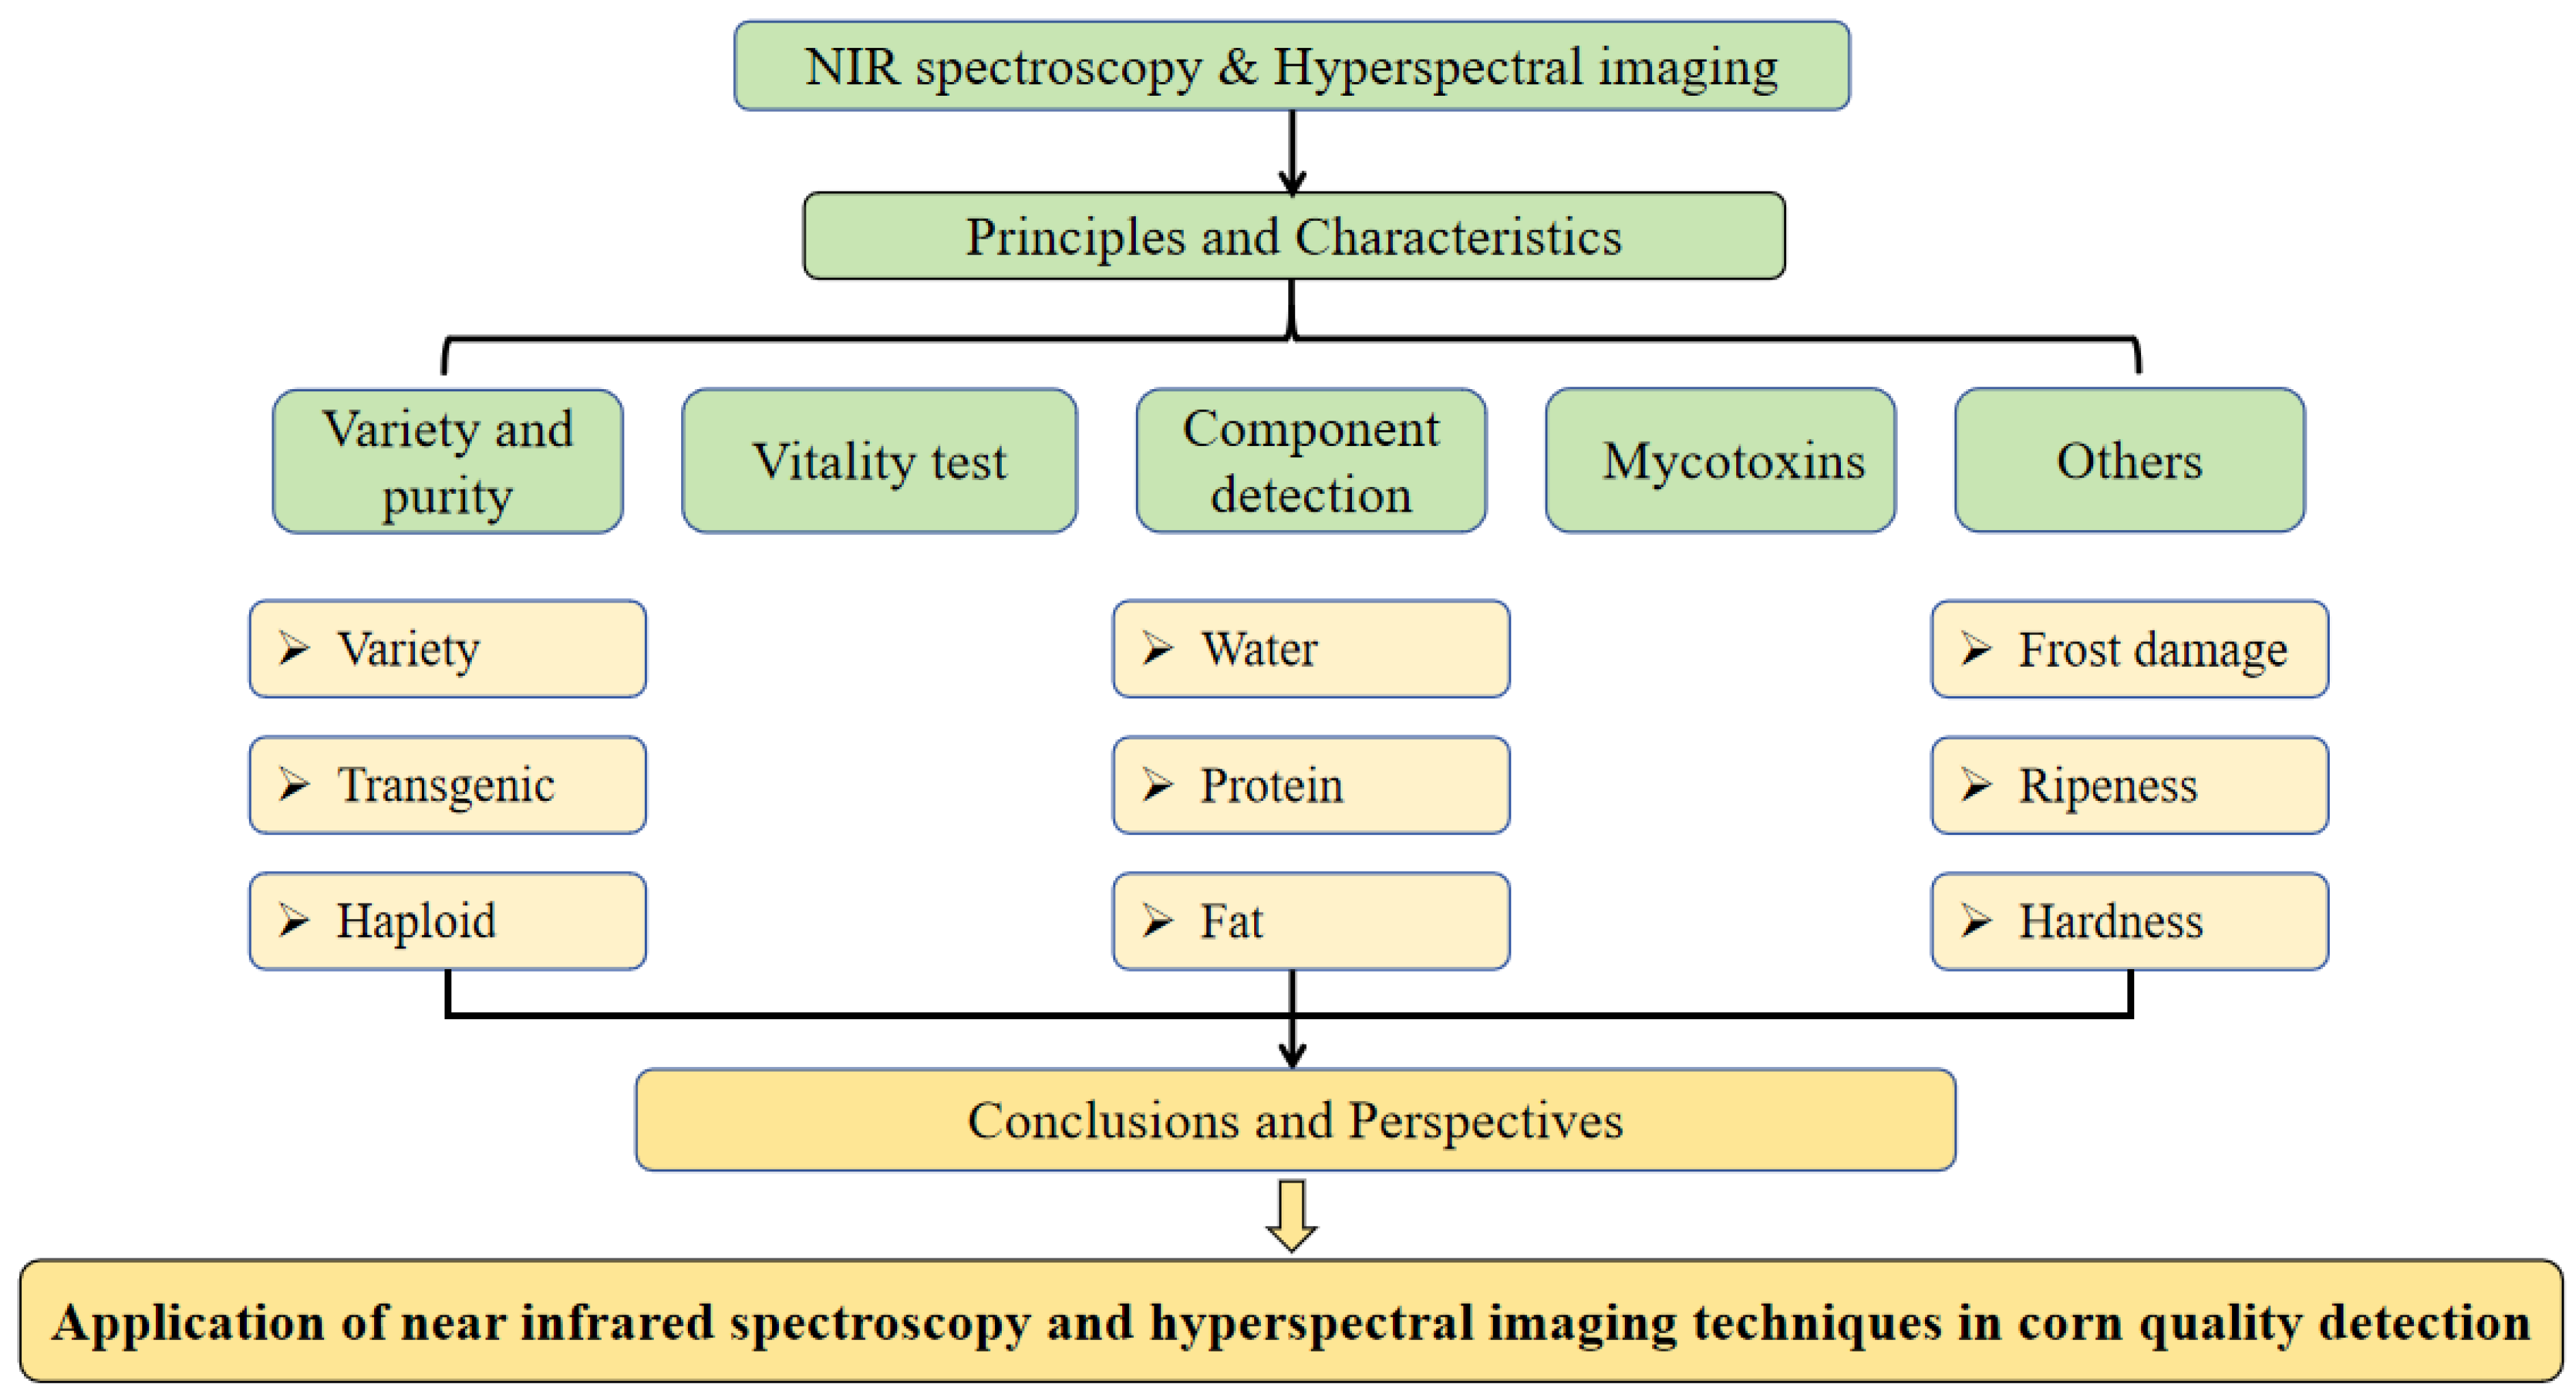
3. Specific Applications
3.1. Variety and Purity Detection
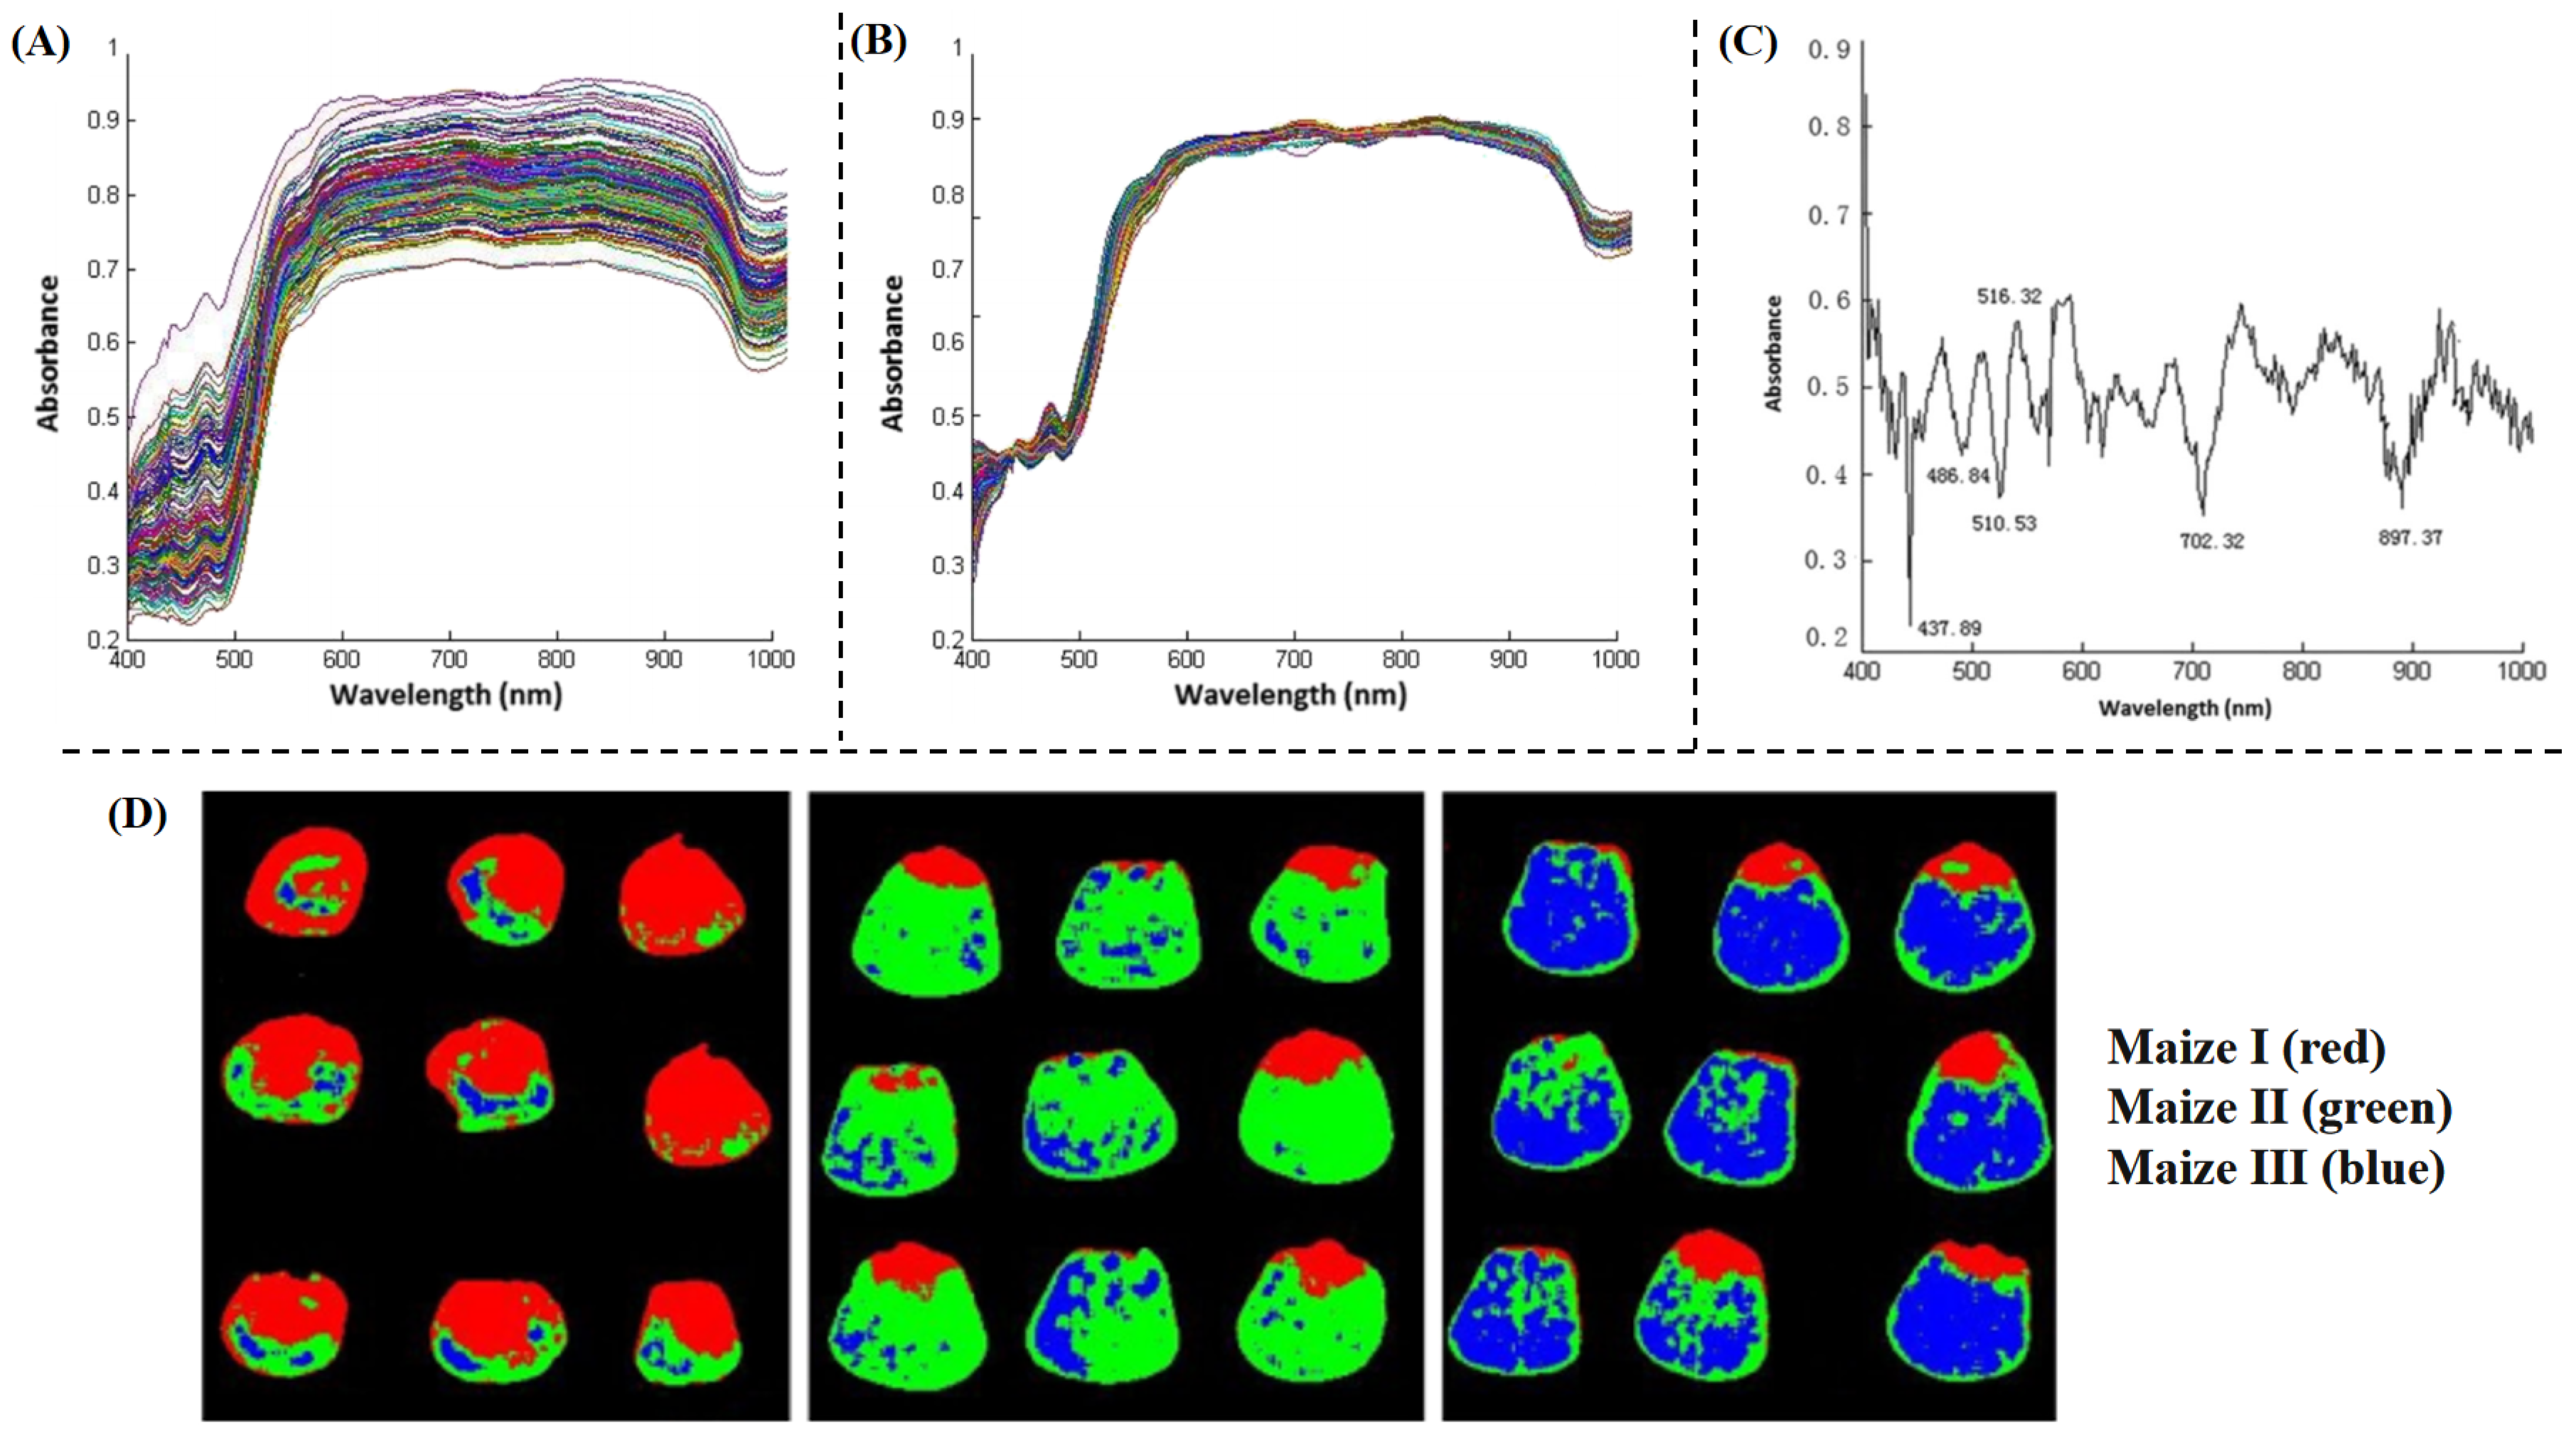
3.1.1. Variety Identification
3.1.2. Transgenic Detection
3.1.3. Haploid Detection
3.2. Vitality Detection
3.3. Components Determination
3.3.1. Moisture Determination
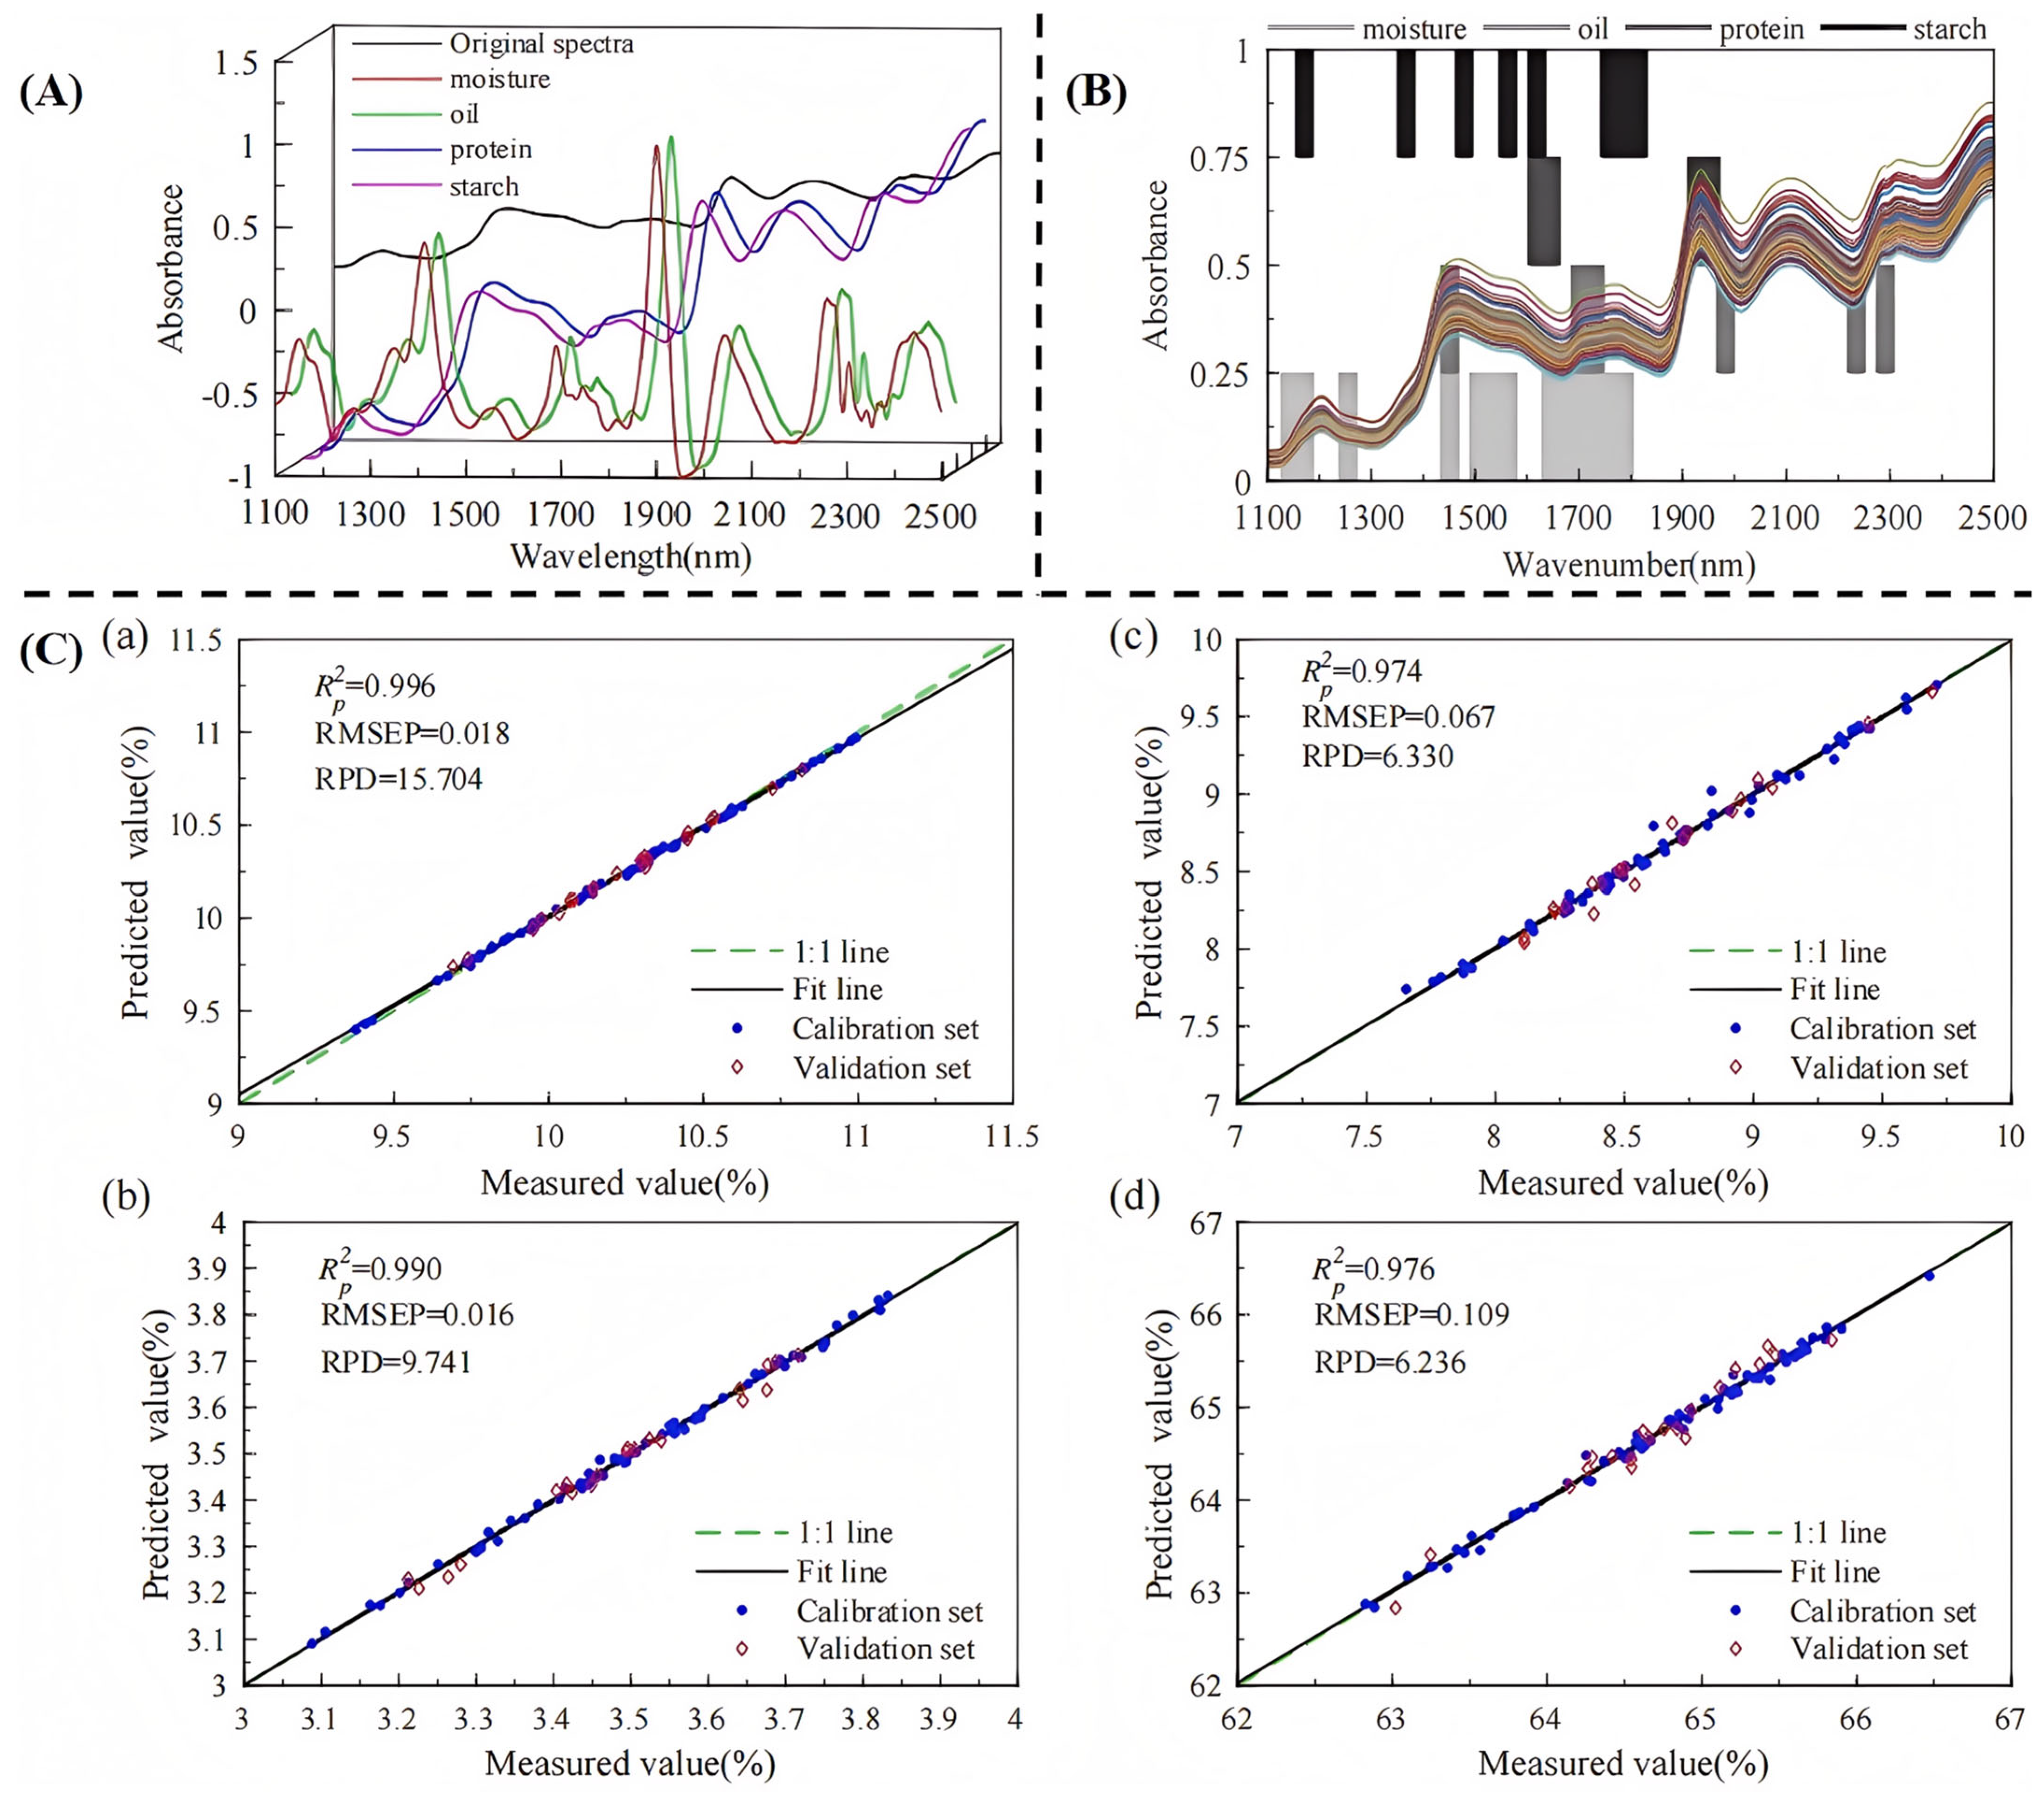
3.3.2. Determination of Other Components
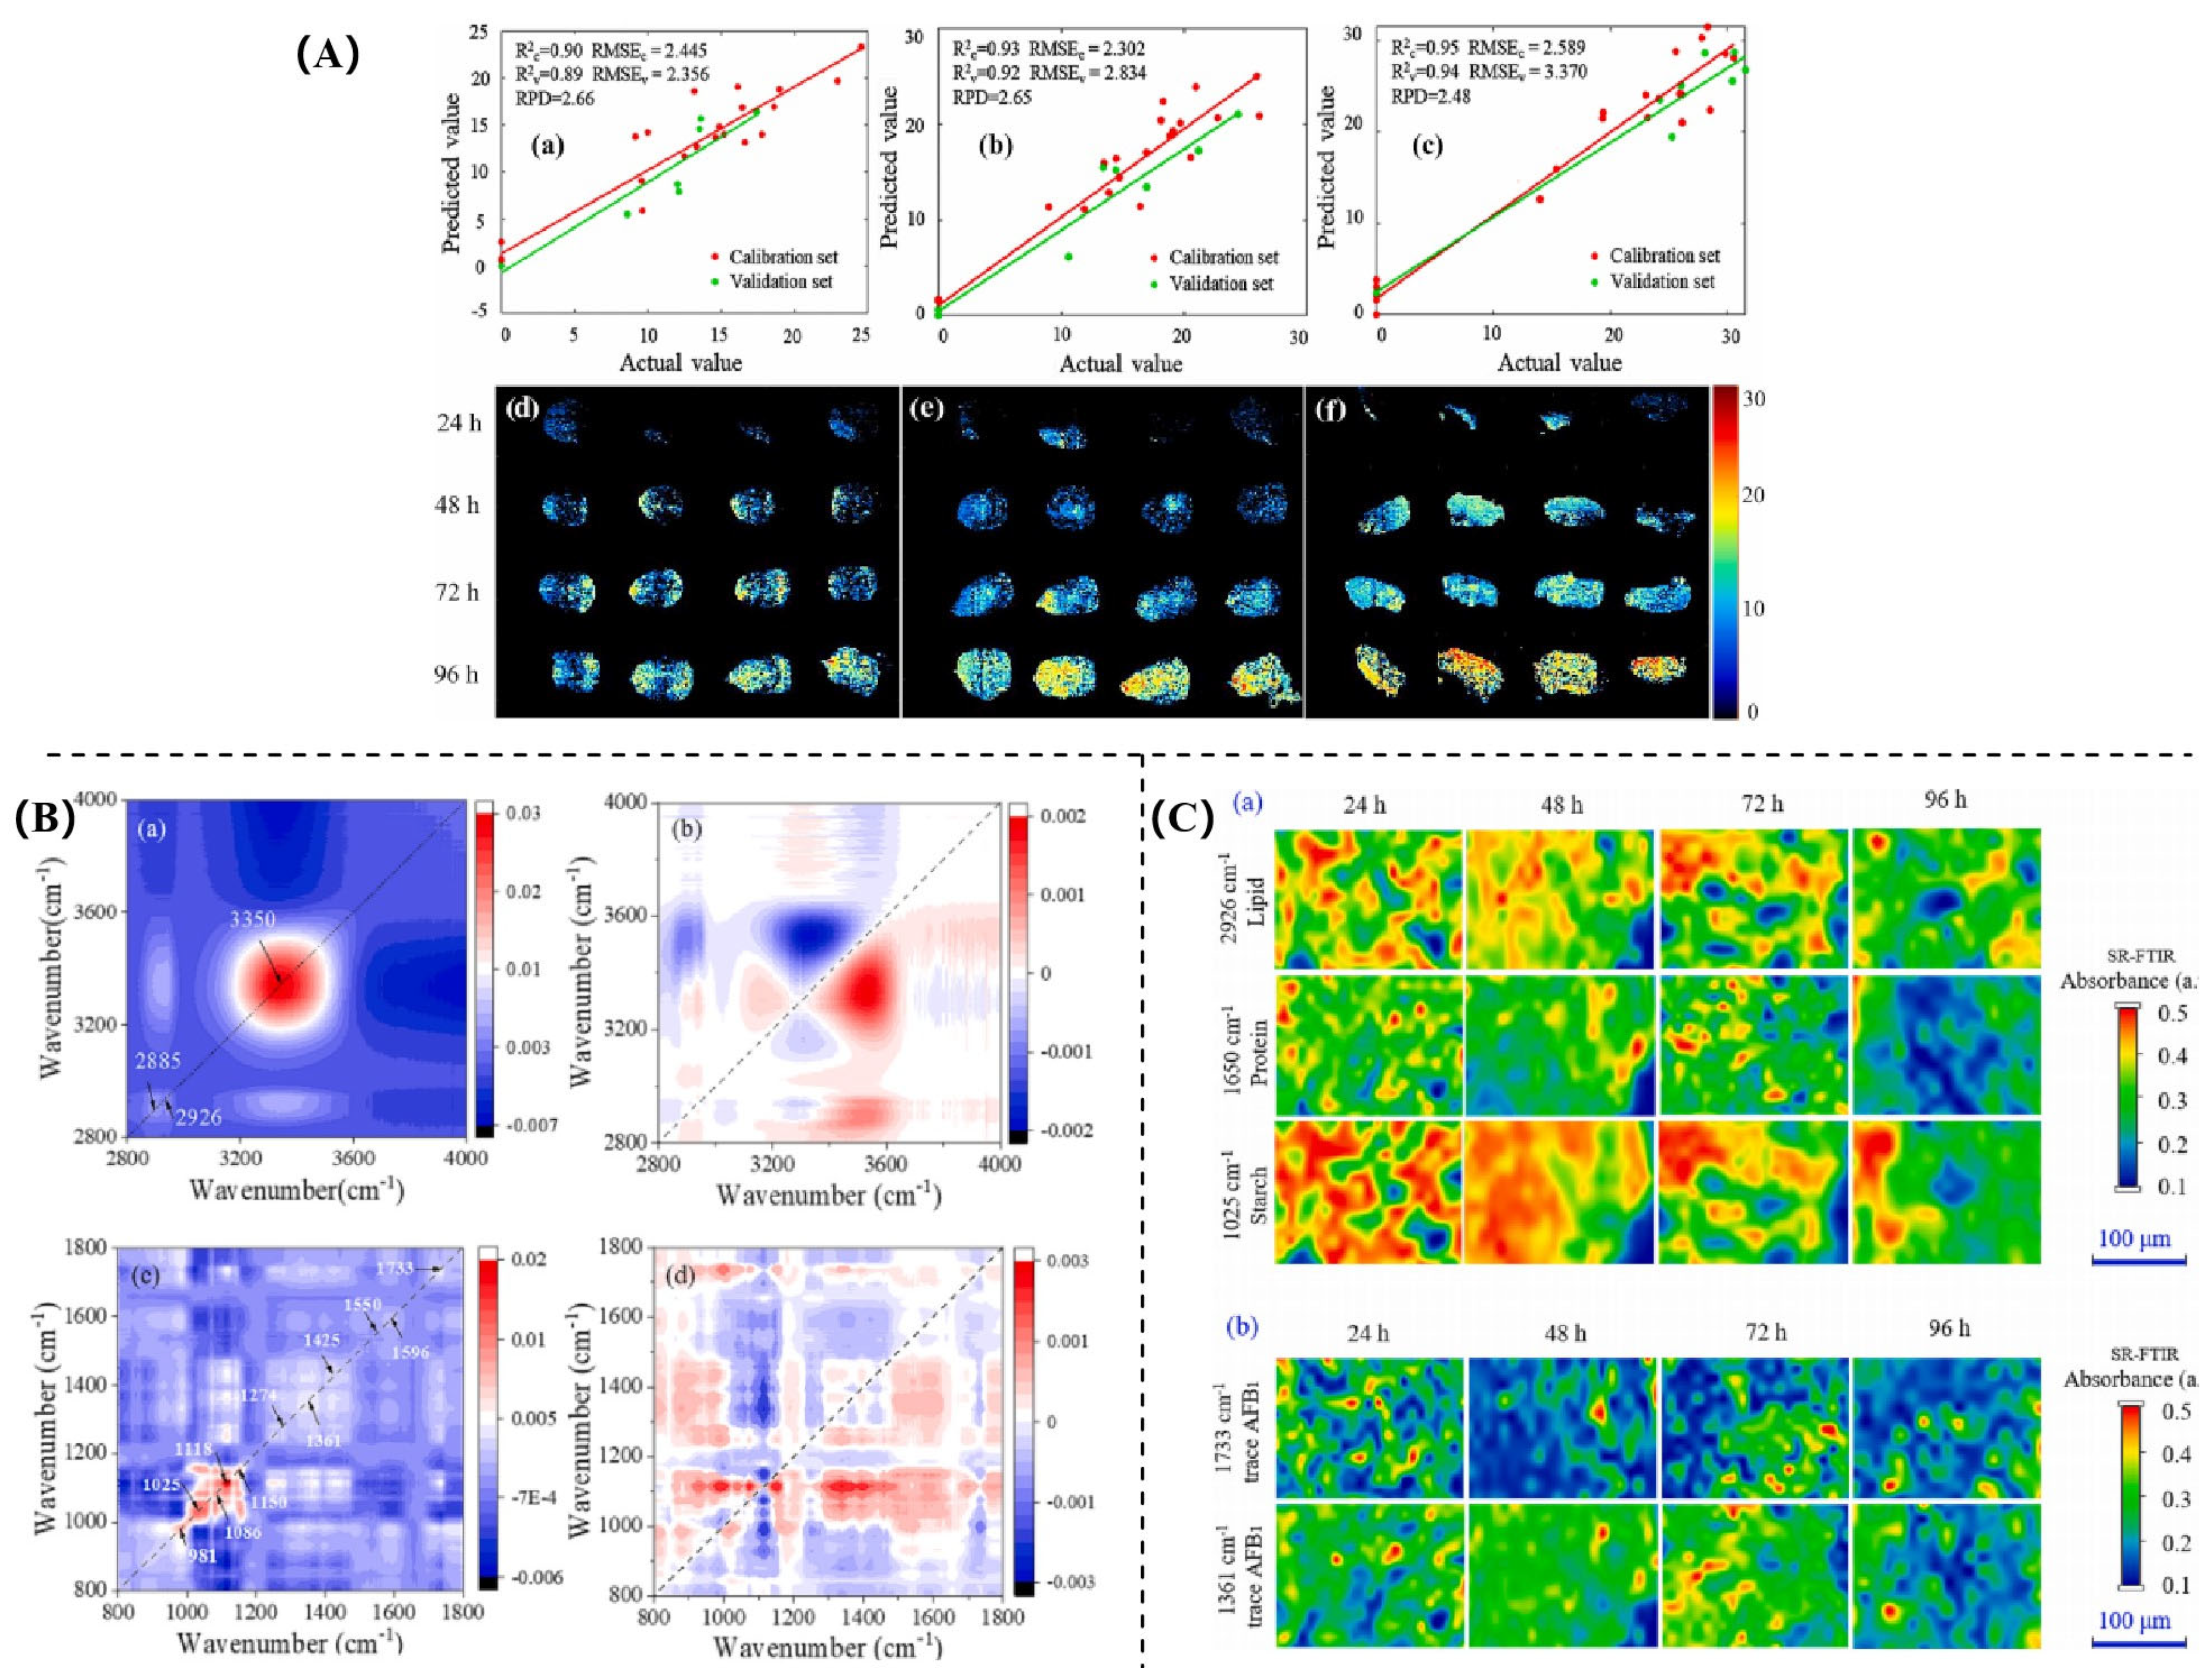
3.4. Mycotoxins Detection
3.5. Other Application Areas
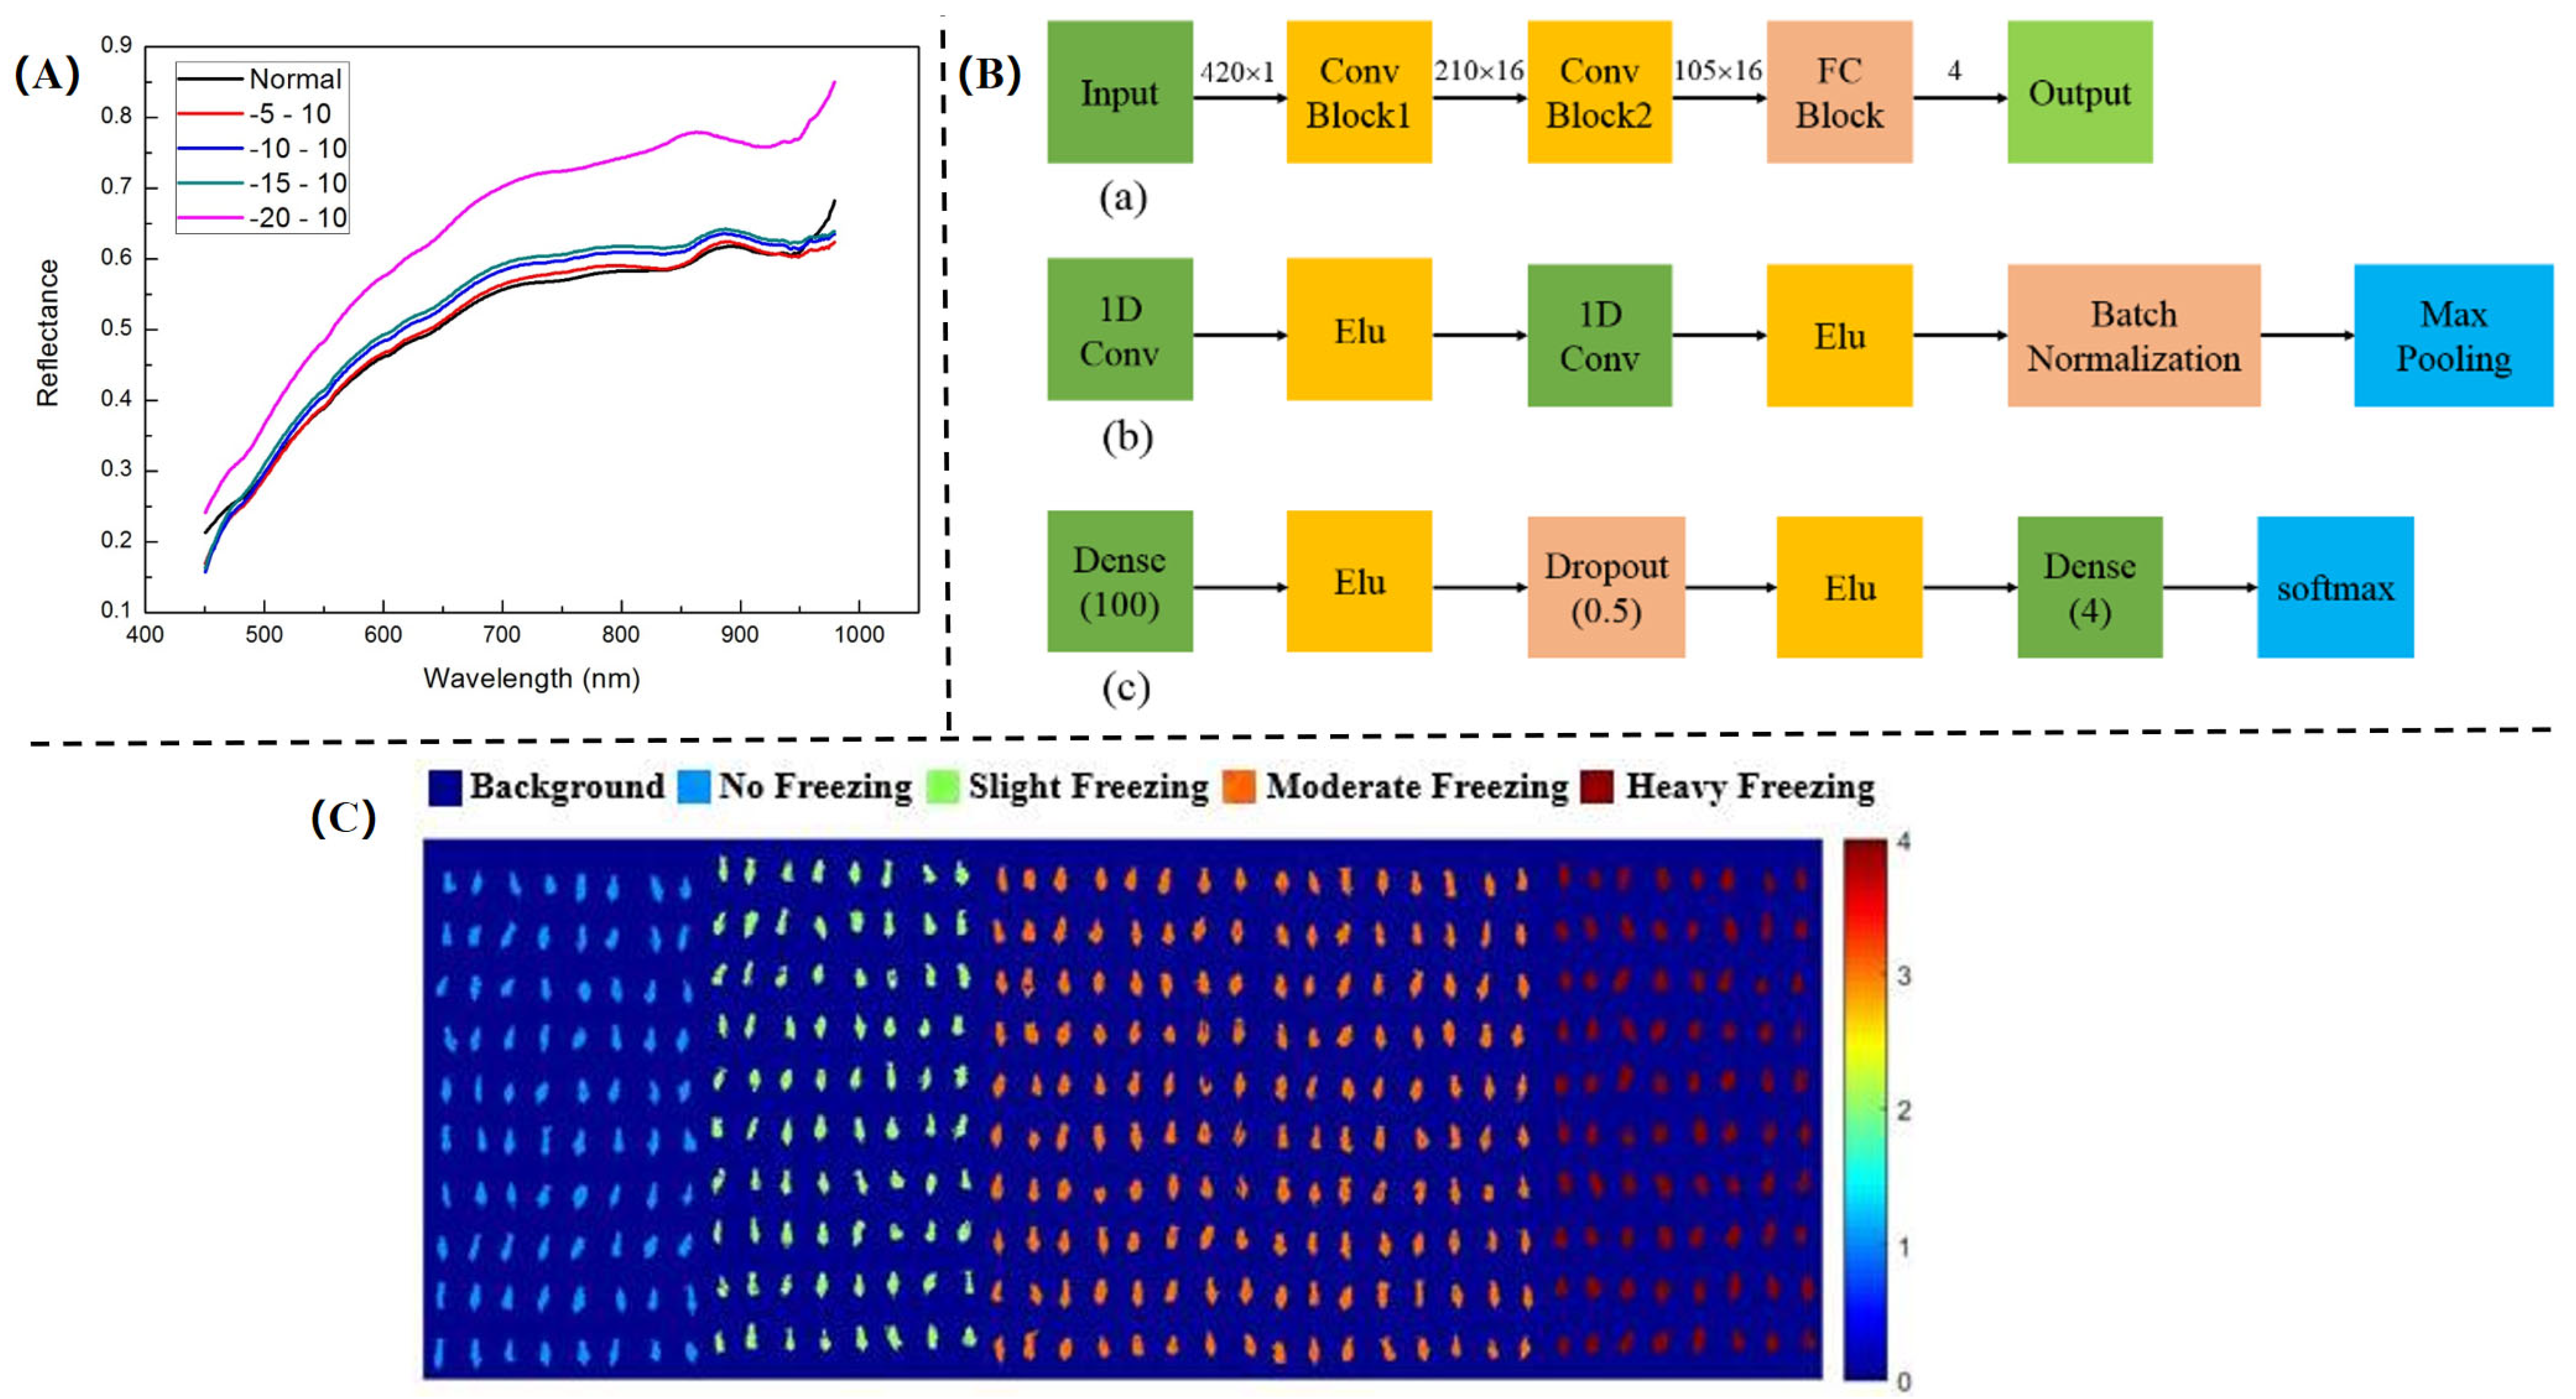
3.5.1. Frost Damage Detection
3.5.2. Hardness Detection
3.5.3. Maturity Detection
4. Challenges and Future Perspectives
4.1. Challenges
4.2. Future Perspectives
5. Conclusions
Author Contributions
Funding
Institutional Review Board Statement
Informed Consent Statement
Conflicts of Interest
Abbreviations
| 1D CAE + MLR | One-dimensional convolutional autoencoder |
| ANN | Artificial neural network |
| AU | Auto-scaling |
| BPNN | Backpropagation neural network |
| BPR | Biomimetic pattern recognition |
| CARS | Competitive adaptive reweighting |
| CNN | Convolutional neural networks |
| DCGAN | Deep convolutional generative adversarial network |
| DCNN | Deep convolutional neural networks |
| DT | Decision tree |
| ELM | Extreme learning machine |
| FD | First derivative |
| FDA | Fisher discriminant analysis |
| GA | Genetic algorithm |
| GDBT | Gradient Boosting Decision Tree |
| GLCM | Grey-level co-occurrence matrix |
| HSI | Hyperspectral imaging |
| KNN | K-nearest neighbor |
| LDA | Linear discriminant analysis |
| LPP | Locality preserving projection, |
| LSTM | Long short-term memory |
| MC | Mean center |
| MLP | Multi-layer perceptron |
| MLR | Multiple linear regression |
| MPLS | Multiple partial least square |
| MSC | Multiple scattering correction |
| NIRS | Near-infrared spectroscopy |
| OLDA | Orthogonal linear discriminant analysis |
| PA | Procrustes analysis |
| PCA | Principal component analysis |
| PLS | Partial least squares |
| PLS-DA | Partial least squares discriminant analysis |
| PLSR | Partial least squares regression |
| RBFNN | Radial basis function neural network |
| RF | Random forest |
| SIMCA | Soft independent modeling of class analogy |
| siPLS | Interval partial least squares |
| SNV | Standard normal transformation |
| SPA | Successive projection algorithm |
| STD | Standard deviation |
| SVM | Support vector machine |
| SVR | Support vector regression |
| SVSKLPP | Supervised virtual sample locality preserving projection |
| USS | Undersampling stacking |
| UVE | No-information variable elimination |
| WT | Wavelet transformation |
| XGB | XGBoost |
Appendix A

| Author | Year | Technology | Samples | Number of Spectra | Wavelength Range | Preprocessing Methods | Models | Results | Reference |
|---|---|---|---|---|---|---|---|---|---|
| Wu et al. | 2010 | NIRS | Commercial corn | 925 | 4000–12,500 cm−1 | Vector Normalization | BPR | 94.3% (37 maize varieties average correct recognition rate) | [20] |
| Wang et al. | 2011 | NIRS | Corn seeds | 925 | 4000–12,000 cm−1 | / | LDA | 99.30% (test set average correct recognition and rejection rates), | [21] |
| Huang et al. | 2011 | NIRS | Hybrid corn | 123 | 4000–12,500 cm−1 | / | PLS | 95.75% (validation set average determination coefficient), | [22] |
| Jia et al. | 2012 | NIRS | Single corn seeds | 2880 480 | 4000–12,500 cm−1 9100–12,500 cm−1 | Smoothing + FD + Vector Normalization | PLS-DA | 94.6% (this variety correct recognition rate), 96.5% (other varieties correct rejection rate) | [23] |
| Han et al. | 2014 | NIRS | Corn seeds | 48 | 12,000–4000 cm−1 | / | ANN, SVM | 90% + (6 principal components overall performance), | [24] |
| Jia et al. | 2015 | NIRS | Coated corn seeds | 240 | 1110–2500 nm | Moving Average Window Smoothing, FD, Vector Normalization | SVM, BPR, SIMCA | 97.5% (SIMCA model accuracy) | [25] |
| Cui et al. | 2018 | NIRS | Corn seeds | 2400 | 1111–2500 nm | Smoothing, FD and Vector Normalization | LDA, BPR | 90% + (mean correct discrimination rate), | [26] |
| Zhang et al. | 2012 | HSI | Corn seeds | 330 | 380–1030 nm | / | LS-SVM | 98.89% (PCA-GLCM-LS-SVM model recognition accuracy) | [27] |
| Wang et al. | 2016 | HSI | Corn seeds | 378 | 400–1000 nm | Detrending | LS-SVM | 88.889% (LS-SVM combined features classification accuracy) | [28] |
| Xia et al. | 2019 | HSI | Corn seeds | 1632 | 400–1000 nm | Normalization | LS-SVM | 99.13% (MLDA-LS-SVM test set classification accuracy) | [29] |
| Zhao et al. | 2018 | HSI | Corn seeds | 12,900 | 874–1734 nm | WT | SVM, RBFNN | 93.85% (calibration accuracy) and 91.00% (prediction accuracy) | [31] |
| Miao et al. | 2018 | HSI | Waxy corn seeds | 800 | 386.7–1016.7 nm | PA | FDA | 97.5% (t − SNE + FDA model highest classification accuracy), | [32] |
| Bai et al. | 2020 | HSI | Silage maize and common Seeds | 40,800 | 874–1734 nm | WT | SVM, RBFNN | 98% + (silage and common maize seeds classification accuracies), | [33] |
| He et al. | 2016 | HSI | Corn seeds | 2000 | 400–1000 nm | / | LS-SVM | 98.3% (clustering algorithm updated model highest classification accuracy), | [34] |
| Zhang et al. | 2021 | HSI | Corn seeds | 3200 | 400–1000 nm | / | DCNN, KNN, SVM | 100% (DCNN model training accuracy), 94.4% (testing accuracy), 93.3% (validation accuracy), | [35] |
| Zhou et al. | 2021 | HSI | Normal and sweet corn seeds | 1080 | 326.7–1098.1 nm | SG Smoothing, FD | CNN | CNN model coupled with subregional voting represents a new approach for the identification | [30] |
| Fu et al. | 2022 | HSI | Corn seeds | 400 | 956.56–1688.24 nm | SG Smoothing, SNV | SSAE-CS-SVM, CS-SVM | 99.45% (CS-SVM training set accuracy), 95.81% (CS-SVM testing set accuracy), | [37] |
| Zhang et al. | 2022 | HSI | Corn seeds | 2000 | 382.2–1026.7nm | SG Smoothing-MSC | OCSVM, BPR, RBF-BPR | 100% (CAE-RBF-BPR model CAR and CRR), | [38] |
| Wang et al. | 2023 | HSI | Sweet corn seeds | 1000 | 388–1025 nm | SG Smoothing, SNV, MSC | SVM, KNN, ELM, BP, CNN, LSTM, CNN-LSTM | 95% + (deep learning models classification accuracy) | [39] |
| Zhou et al. | 2020 | HSI | Sweet corn seeds | 810 | 480–1020 nm | SG Smoothing, FD | SVM, KNN, ANN, DT, NB, LDA, LR | 94.07% and 94.86% (germ up and down SG + FD + CARS + SVM model classification accuracies) | [36] |
| Feng et al. | 2018 | NIRS | Transgenic corn | 326 | 900–1700 nm | 2nd Derivatives | KNN, SIMCA, NBC, ELM, RBFNN | 100% (ELM full spectrum classification rate), 90.83% (ELM sensitive wavelengths classification rate) | [40] |
| Peng et al. | 2018 | NIRS | Transgenic corn | 1200 + 240 | 900–1700 nm | SG Smoothing | PLS, SVM | 90% + (SVM transgenic maize kernel accuracy), 75% + (SVM corn flour accuracy), | [41] |
| Zhang et al. | 2022 | NIRS | Transgenic corn | 66 | 400–2500 nm | Vector Normalization | ANN | 100% (ANN transgenic corn recognition), | [42] |
| Feng et al. | 2017 | HSI | Transgenic corn | 2100 | 874.41–1733.91 nm | WT, SNV, MSC | SVM, PLS-DA | almost 100% (HSI calculation and prediction accuracy) | [43] |
| Wei et al. | 2023 | HSI | GM and non—GM corn seeds | 777 | 935–1720 nm | STD | SVM, DT, BPNN, VGG | 0.961 (VGG prediction accuracy) | [44] |
| Liu et al. | 2017 | NIRS | Corn Haploid | 400 | 950–1650 nm | Smoothing, FD, Vector Normalization | SVM | 95% and 93.57% (haploid and polyploid average correct recognition rates), | [45] |
| Yu et al. | 2018 | NIRS | Corn Haploid | 200 | 908.1–1672.2 nm | Smoothing, FD, Vector Normalization | OLDA, LPP, SVSKLPP | 97.1% (SVSKLPP average accuracy), 98.8% (SVSKLPP sensitivity), 95.4% (SVSKLPP specificity), | [46] |
| Cui et al. | 2019 | NIRS | Corn Haploid | 1024 | 9403.8–4242.9 cm−1 | Smoothing, FD, Vector Normalization | PLS | 90% + (PLS average accuracy) | [47] |
| Ge et al. | 2021 | NMR + NIRS | Corn Haploid | 400 | 833–2500 nm | / | SVM, DM, KNN, AD, DADA | The effectiveness of the fusion of NMR and NIRS data for classification. | [48] |
| Ribeiro et al. | 2023 | MicroNIR | Corn Haploid | 137 | 908–1676 nm | SNV, SG FD | PLS-DA | 100% (PLS-DA classification accuracy), | [49] |
| Wang et al. | 2018 | HSI | Corn Haploid | 400 | 862.9–1704.2 nm | Moving Average Window Smoothing, FD, Vector Normalization | BPR | 99% (haploid and diploid CAR), <1% (haploid and diploid FAR) | [50] |
| He et al. | 2022 | HSI | Corn Haploid | 400 | 874–1734 nm | SG | PLSDA | 90.31% (model accuracy), | [51] |
| Zhang et al. | 2022 | HSI | Corn Haploid | 400 | 866.4–1701.0 nm | Min-Max Normalization | KNN, SVM, RF, DCGAN, CGAN | 10% + (DCGAN and CGAN average accuracy improvement), higher (CGAN accuracy improvement than DCGAN) | [52] |
| Author | Year | Technology | Samples | Number of Spectra | Wavelength Range | Preprocessing Methods | Models | Results | Reference |
|---|---|---|---|---|---|---|---|---|---|
| Agelet et al. | 2012 | NIRS | Vitality of soybean and corn seeds | 984 | 850–1650 nm | SNV | PLS-DA, SIMCA, KNN, LS-SVM | 99% (PLS-DA accuracy for heat—damaged corn kernels) | [53] |
| Yang et al. | 2013 | NIRS | Vitality of corn seeds | 240 | 833–2500 nm | SG Smoothing, MSC | BPNN | 95.0% (optimal recognition accuracy) | [54] |
| Li et al. | 2018 | NIRS | Vitality of sweet corn seeds | 200 | 908.1–1676.0 nm | AU, MC, MSC, SNV, SG Smoothing | PLSR | NIRS suitable for multi—parameter evaluation | [55] |
| Wang et al. | 2020 | NIRS | Vitality of sweet corn seeds | 1500 | 980–1700 nm | / | PLS-DA | >98% (classification accuracy) | [56] |
| Zhao et al. | 2022 | NIRS | Vitality of sweet corn seeds | 532 | 4000–10,000 cm−1 | Detrend, MSC, SNV, MC, SG Smoothing | PLS | Transmission spectroscopy better for vigor prediction. | [57] |
| Ambrose et al. | 2016 | HSI | Vitality of corn seeds | 900 | 400–1000 nm, 1000–2500 nm | Normalization, 1st and 2nd Derivative, SNV, MSC | PLS-DA | 97.6% (calibration accuracy), 95.6% (prediction accuracy in SWIR) | [58] |
| Wakholi et al. | 2018 | HSI | Vitality of corn seeds | 600 | 1000–2500 nm | Normalization, SNV, MSC, Derivatives, Smoothing | PLS-DA, SVM, LDA | 100% (white seeds SVM accuracy), 100% (purple seeds SVM accuracy), 98% (yellow seeds SVM accuracy) | [60] |
| Feng et al. | 2018 | HSI | Vitality of corn seeds | 9597 | 874–1734 nm | 2nd derivatives | SVM | ~10% lower (optimal wavelengths vs. full spectra SVM models) | [59] |
| Xu et al. | 2022 | HSI | Vitality of corn seeds | 1680 | 959.3–1697.9 nm | SG-2, SNV, MSC, FD, 2nd derivatives | DT, SVM, LDA, KNN, RF, ANN | >85.71% (LDA accuracy with UVE), >89.76% (ANN accuracy with UVE) | [64] |
| Cui et al. | 2022 | HSI | Vitality of corn seeds | 84 | 386.7–1016.7 nm | Savitzky—Golay Smoothing, MSC, SNV | PCR, PLS, SVR | 0.8319 (determination coefficient for root length prediction) | [63] |
| Zhao et al. | 2022 | HSI | Vitality of waxy corn seeds | 768 | 378–1042 nm | / | DCNN, SVM, KNN, RF | 98.83% (DCNN + full band accuracy, highest) | [62] |
| Pang et al. | 2020 | HSI | Vitality of corn seeds | 576 | 370.2–1042.3 nm | MSC | SVM, CNN, ELM | 90.11% (1DCNN recognition accuracy), 99.96% (2DCNN accurate recognition) | [61] |
| Author | Year | Technology | Samples | Number of Spectra | Wavelength Range | Preprocessing Methods | Models | Results | Reference |
|---|---|---|---|---|---|---|---|---|---|
| Fassio et al. | 2015 | NIRS | Oil content | 256 | 400–2500 nm | 2nd Derivative, SNV | PLS | Qualitative oil determination possible | [75] |
| Lyu et al. | 2016 | NIRS | Protein, moisture, fat | 156 | 3996–9997 cm−1 | / | EC-PLS | Wavenumber selection method provided valuable reference for designing small dedicated spectrometer | [76] |
| Alamu et al. | 2022 | NIRS | Amino acids | 83 | 400–2498 nm | SNV, De-trending | MPLS | These models would serve as tools to rapidly screen their QPM germplasm for amino acids. | [77] |
| Xu et al. | 2023 | NIRS | Moisture, oil, protein, starch content | 80 | 1100–2498 nm | S-G Smoothing, MSC, SNV, FD and 2nd Derivatives | BiPLS-PCA-ELM | Higher robustness and accuracy (NIRS model) | [80] |
| Cataltas et al. | 2023 | NIRS | Protein, starch, oil, moisture content | 80 | 1100–2498 nm | MSC, SNV, SG, MC | 1D CAE + MLR, PLSR, PCR | Superior performance (1D CAE + MLR) | [78] |
| Wu et al. | 2023 | NIRS | Protein content | 80 | 1100–2498 nm | / | PLS, MWPLS, siPLS, GA-PLS, Random Frog—PLS, CARS- PLS, A-CARS-PLS | Great application potential (A-CARS-PLS) | [79] |
| Liu et al. | 2020 | HSI | Starch content | 180 | 930–2500 nm | S-G Smoothing | PLSR, ANN | Rp = 0.96 and RMSEP = 0.98 (ANN for starch) | [81] |
| Zhang et al. | 2022 | HSI | Oil content | 400 | 866.4–1701.0 nm | Maximum and Minimum Normalization | PLSR, SVR | Feasible (oil content method) | [82] |
| Zhang et al. | 2022 | HSI | Oil content | 400 | 866.4–1701.0 nm | SG Smoothing, SNV, SG1, SG2 | CNNR, ACCNR | Prediction R2 = 0.9198 (ACCNR for oil in single kernel) | [83] |
| Wang et al. | 2019 | NIRS | Moisture Content | 100 | 4000–10,000 cm−1 | Savitzky—Golay | Bootstrap—SPXY-PLS | Effective for small sample moisture monitoring | [66] |
| Yang et al. | 2022 | NIRS | Moisture Content | 320 | 1100–2400 nm | SG Smoothing, MSC, Normalization, MC, SNV | RF, GDBT, XGB, Staking | R2P = 0.9391 and RPD = 2.91 (stacking model) | [67] |
| Huang et al. | 2015 | HSI | Moisture Content | 3600 | 400–1000 nm | / | PLSR | better direct method (RP = 0.848 and RMSEP = 2.73) | [68] |
| Zhang et al. | 2020 | HSI | Moisture Content | 1888 | 375.18–1017.88 nm 865.121–1711.71 nm | SG, MSC, SNV, First Derivative | PLSR | The models built with NIR spectra had more potential in determining moisture content | [70] |
| Wang et al. | 2020 | HSI | Moisture Content | 289 | 930–2548 nm | SG, SNV, MSC, D1 | PLSR, LS-SVM | Rpre = 0.9325 and RMSEP = 1.2109 (UVE-SPA-LS-SVM) | [69] |
| Wang et al. | 2021 | HSI | Moisture Content | 292 | 930–2548 nm | SG, SNV | PLSR | Rpre = 0.9311 ± 0.0094 and RMSEP = 1.2131 ± 0.0702 (CARS-SPA-LS-SVM) | [71] |
| Wang et al. | 2023 | HSI | Moisture Content | 289 | 930–2548 nm | SG, SNV, MSC, 1D | PLS, LS-SVM | Rpre = 0.91 and RMSEP = 1.32% (S1 + S2 − UVE-SPA-LS-SVM), | [74] |
| Wu et al. | 2022 | HSI | Moisture Content | 8000 | 968.05–2575..05 nm | MSC | RF, AdaBoost | High accuracy and good robustness (hyperspectral with integrated learning) | [72] |
| Zhang et al. | 2022 | HSI | Moisture Content | 8000 | 968.05–2575.05 nm | PCA | CNN, LSTM, PLS, CNN-LSTM | Promising tool (hyperspectral with deep learning) | [73] |
| Author | Year | Technology | Samples | Number of Spectra | Wavelength Range | Preprocessing Methods | Models | Results | Reference |
|---|---|---|---|---|---|---|---|---|---|
| Fernández et al. | 2009 | NIRS | AFB1 | 152 | 400–2500 nm 1112–2500 nm | SNV, Detrending | PLS | Potential for 20 ppb AFB1 detection | [84] |
| Tallada et al. | 2011 | NIRS | Infected by eight fungus species | 3600 | 904–1685 nm | MC, SNV | LDA, MLP | Better classification models (LDA and mean centering) | [85] |
| Tao et al. | 2019 | NIRS | AFB1 | 210 | 400–2500 nm | SNV, 1st and 2nd Derivatives | PCA-LDA, PLS-DA | 98.6% (3-class), 91.4% and 97.1% (7-class) | [86] |
| Wang et al. | 2022 | NIRS | AFB1 | 600 | 901.78–1661.24 nm | / | 1D-CNN, 2D-MTF-CNN | 2D-MTF-CNN more stable and better | [90] |
| Deng et al. | 2022 | NIRS | AFB1 | 120 | 901.78–1661.24 nm | MSC | SVM, PLS | High precision on-site testing (NIRS and SVM) | [88] |
| Shen et al. | 2022 | NIRS | Fumonisin B1 and B2 | 173 | 900–1700 nm | SNV, DT, MSC, SG Smoothing, FD | PLS-DA, SVM-DA | >86.0% (PLS-DA and SVM-DA), | [89] |
| Zhu et al. | 2016 | Fluorescence and V/NIR HSI | Aflatoxins | 300 | 398.77–700.82 nm 460.87 to 876.99 nm | / | LS-SVM, KNN | 95.33% (LS-SVM) | [92] |
| Kimuli et al. | 2018 | HSI | AFB1 | 600 | 1000–2500 nm | SNV, First and Second Derivatives | PLSDA, FDA | 100% (FDA for some varieties), | [102] |
| Kimuli et al. | 2018 | HSI | AFB1 | 600 | 400–1000 nm | SNV, SGS | FDA | >96% and 98% (FDA) | [101] |
| Tao et al. | 2022 | HSI | Aflatoxins | 900 | 900–2500 nm | SNV, FD, SD | PLS-DA | NIR-HSI has advantage for identification | [91] |
| Conceição et al. | 2021 | HSI | mycotoxicogenic fusarium species | / | 1000–2500 nm | SNV, FD, SNV + FD | PLS-DA | 100% accuracy (PLS-DA for fungi), | [93] |
| Zhang et al. | 2022 | HSI | AFB1 | 400 | 430–995 nm | MSC, SNV, 5-3 Smoothing | KNN, LDA, SVM | 84.1% and 87.3% (training), 77.8% and 83.0% (testing), | [94] |
| Zhou et al. | 2021 | HSI | AFB1 | 450 | 1100–2000 nm | SG, FD / SD | LDA, KNN, NB, DT | 95.56% (average), 88.67% (independent) | [95] |
| Zhou et al. | 2022 | HSI | AFB1 | 350 | 500–1000 nm 1000–2000 nm | SG, FD | SVM, NB, KNN, DT, LDA | The ideal result with an accuracy of 94.46% and 91.11% | [109] |
| Zhou et al. | 2022 | HSI | AFB | 288 | 430–1000 nm 1000–2400 nm | SG, MSC, FD | SVM, KNN, DT | 96.18% (SVM), | [96] |
| Wang et al. | 2014 | HSI | AFB1 | 150 | 1000–2500 nm | SNV | FDA | >88% | [99] |
| Wang et al. | 2015 | HSI | AFB1 | 120 | 1000–2500 nm | PCA | SAM | Three varieties reached 96.15%, 80%, and 82.61% | [98] |
| Wang et al. | 2015 | HSI | AFB1 | 150 | 400–1000 nm | SNV | FDA | An overall classification accuracy of 98% was achieved. | [97] |
| Chu et al. | 2017 | HSI | AFB1 | 120 | 1000–2500 nm | Normalization | SVM | 83.75% and 82.50% for calibration and validation set | [100] |
| Chu et al. | 2020 | HSI | Infected by Fungi | 892 | 900–1700 nm | / | SVM | Two methods can be used for classification | [103] |
| Guo et al. | 2023 | HSI | AFB1, Aspergillus flavus | 36 | 400–1000 nm | FD, SNV | SVM, PLSR | Optimal regression (SNV and PLSR) | [104] |
| Mansuri et al. | 2022 | HSI | Fungal contamination | 15,000+ | 398–1003 nm | SNV, Savitzky—Golay | PLS-DA, ANN, CNN | 1D-CNN better performance | [105] |
| Lu et al. | 2022 | HSI and FTIR Microspectroscopy | Aspergillus flavus Infection and AFB1 Biosynthesis | 240 | 1000–2500 nm 400–4000 cm−1 | SNV, FD | PLSR, SVR | Potential for estimation | [106] |
| Gao et al. | 2020 | HSI | Aflatoxin | 2144 | 292–865 nm | MSC | RF, KNN | 99.38% (RF), 98.77% (KNN) | [107] |
| Wang et al. | 2023 | Fluorescence HSI | AFB1 | 8720 | 327–1097 nm | SNV | SVR-Boosting, AdaBoost, Extra—Trees—Boosting, KNN | Potential for estimation | [108] |
| Author | Year | Technology | Samples | Number of Spectra | Wavelength Range | Preprocessing Methods | Models | Results | Reference |
|---|---|---|---|---|---|---|---|---|---|
| Agelet et al. | 2012 | NIRS | Frozen Seeds | 984 | 850–1650 nm | SNV | PLS-DA, SIMCA, KNN, LS-SVM | 63.4% (highest recognition, NIRS unable to distinguish) | [53] |
| Jia et al. | 2016 | NIRS | Frozen Seeds | 800 | 1110–2500 nm | / | PLS, OLDA, SVM, BPR, MD | 97% (BPR average accuracy) | [110] |
| Zhang et al. | 2022 | NIRS | Frozen Seeds | 270 | 4000–10,000 cm−1 | SNV, 5-3 Smoothing | KNN, SVM | 99.4% (KNN training), 100% (KNN testing) | [111] |
| Zhang et al. | 2019 | HSI | Frozen Seeds | 504 | 400–1000 nm | SNV, MSC, 5-3 Smoothing | PLS-DA, KNN, SVM | >90% (HSI with 5-3 smoothing and SPA) | [112] |
| Zhang et al. | 2021 | HSI | Frozen Seeds | 1920 | 400–1000 nm | / | ELM, SVM, KNN, DCNN | 97.5% (DCNN testing, 5—category), 100% (DCNN testing, 4—category) | [113] |
| Williams et al. | 2009 | HSI | Hardness | 36 | 960–1662 nm 1000–2498 nm | MSC, SNV, Derivatives | PLS-DA | Reproducible results (potential for future use) | [114] |
| Williams et al. | 2016 | HSI | Hardness | / | 975–2570 nm | SNV | PLS-DA | 0.93/0.97 (sensitivity/ specificity for hard kernels), 0.95/0.93 (sensitivity/specificity for medium kernels) | [115] |
| Qiao et al. | 2022 | HSI | Hardness | 231 | 374.98–1038.79 nm | MSC, SG-Smoothing, FD | PLSR | R2 = 0.912, RMSE = 17.76, RPD = 3.41, RER = 14 | [116] |
| Wang et al. | 2015 | HSI | Maturity | 255 | 400–1000 nm | OSC | PLSR | The OSC-SPA-PLSR models were used for visualization of the values of textural properties | [117] |
| Huang et al. | 2016 | HSI | Maturity | 2000 | 400–1000 nm | / | LSSVM, SVDD | 94.4% (LSSVM with updating, 10.3% higher) | [118] |
| Wang et al. | 2022 | HSI | Maturity | 360 | 930–2548 nm | / | SVM | effective detection (combining wavelengths and texture) | [119] |
| Yang et al. | 2016 | HSI | Maturity | 934 | 400–1000 nm | / | PLSR | 93.9% (average correct recognition) | [120] |
| Wang et al. | 2021 | HSI | Maturity | 400 | 930–2548 nm | SG-SNV, SG-D1 | DT, PLS-DA, AdaBoost | 98.7%/100% (classification accuracy with T1/T2) | [121] |
References
- Zhang, F.; Zhang, Z.; Chen, Z.; Teng, S.; Xu, R. Application of spectral testing technology in seed quality testing. J. Chin. Agric. Mech. 2021, 42, 109–114. (In Chinese) [Google Scholar] [CrossRef]
- Wang, D.; Wang, K.; Wu, J.; Han, P. Progress in Research on Rapid and Non-Destructive Detection of Seed Quality Based on Spectroscopy and Imaging Technology. Spectrosc. Spectr. Anal. 2021, 41, 52–59. (In Chinese) [Google Scholar]
- Jia, W.; Mao, P. Review on the Near Infrared Spectroscopy in Seed Quality Testing Research. Seed 2013, 32, 46–51. (In Chinese) [Google Scholar] [CrossRef]
- Wang, M.; Zhang, Q. Application of Near Infrared Technology in the Detection of Corn Quality. Food Ind. 2020, 41, 221–226. (In Chinese) [Google Scholar]
- Sun, Q.; Wang, Q.; Xue, W.; Ma, H.; Sun, B.; Xie, Z. Advances in nondestructive detection of seed quality. J. China Agric. Univ. 2012, 17, 1–6. (In Chinese) [Google Scholar]
- Zhang, J.; Liu, Z.; Pu, Y.; Wang, J.; Tang, B.; Dai, L.; Yu, S.; Chen, R. Identification of Transgenic Agricultural Products and Foods Using NIR Spectroscopy and Hyperspectral Imaging: A Review. Processes 2023, 11, 651. [Google Scholar] [CrossRef]
- Ye, W.; Xu, W.; Yan, T.; Yan, J.; Gao, P.; Zhang, C. Application of Near-Infrared Spectroscopy and Hyperspectral Imaging Combined with Machine Learning Algorithms for Quality Inspection of Grape: A Review. Foods 2023, 12, 132. [Google Scholar] [CrossRef] [PubMed]
- Candolfi, A.; De Maesschalck, R.; Jouan-Rimbaud, D.; Hailey, P.A.; Massart, D.L. The influence of data pre-processing in the pattern recognition of excipientsnear-infrared spectra. Pharm. Biomed. Anal. 1999, 21, 115–132. [Google Scholar] [CrossRef]
- Lee, L.C.; Liong, C.; Jemain, A.A. A contemporary review on Data Preprocessing (DP) practice strategy in ATR-FTIR spectrum. Chemom. Intell. Lab. Syst. 2017, 163, 64–75. [Google Scholar] [CrossRef]
- Jiao, Y.; Li, Z.; Chen, X.; Fei, S. Preprocessing methods for near-infrared spectrum calibration. J. Chemom. 2020, 34, e3306. [Google Scholar] [CrossRef]
- Rinnan, Å.; Berg, F.V.D.; Engelsen, S.B. Review of the most common pre-processing techniques for near-infrared spectra. TrAC Trends Anal. Chem. 2009, 28, 1201–1222. [Google Scholar] [CrossRef]
- Dai, Q.; Cheng, J.H.; Sun, D.W.; Zeng, X.A. Advances in feature selection methods for hyperspectral image processing in food industry applications: A review. Crit. Rev. Food Sci. Nutr. 2015, 55, 1368–1382. [Google Scholar] [CrossRef]
- Li, H.; Liang, Y.; Xu, Q.; Cao, D. Model population analysis for variable selection. J. Chemom. 2010, 24, 418–423. [Google Scholar] [CrossRef]
- Liu, D.; Sun, D.; Zeng, X. Recent Advances in Wavelength Selection Techniques for Hyperspectral Image Processing in the Food Industry. Food Bioprocess. Technol. 2014, 7, 307–323. [Google Scholar] [CrossRef]
- Ramirez, C.A.M.; Greenop, M.; Ashton, L.; Rehman, I.U. Applications of machine learning in spectroscopy. Appl. Spectrosc. Rev. 2021, 8, 733–763. [Google Scholar] [CrossRef]
- Yang, J.; Xu, J.; Zhang, X.; Wu, C.; Lin, T.; Ying, Y. Deep learning for vibrational spectral analysis: Recent progress and a practical guide. Anal. Chim. Acta 2019, 1081, 6–17. [Google Scholar] [CrossRef] [PubMed]
- Zhang, X.; Lin, T.; Xu, J.; Luo, X.; Ying, Y. DeepSpectra: An end-to-end deep learning approach for quantitative spectral analysis. Anal. Chim. Acta 2019, 1058, 48–57. [Google Scholar] [CrossRef] [PubMed]
- Zhang, X.; Yang, J.; Lin, T.; Ying, Y. Food and agro-product quality evaluation based on spectroscopy and deep learning: A review. Trends Food Sci. Technol. 2021, 112, 431–441. [Google Scholar] [CrossRef]
- Tong, P. China’s corn seed market in 2021. Seed Sci. Technol. 2021, 11, 1–2. (In Chinese) [Google Scholar] [CrossRef]
- Wu, W.; Wang, H.; Chen, S.; Guo, T.; Wang, S.; Su, Q.; Sun, M.; An, D. Fast Discrimination of Commercial Corn Varieties Based on Near Infrared Spectra. Spectrosc. Spectr. Anal. 2010, 30, 1248–1251. (In Chinese) [Google Scholar] [CrossRef]
- Wang, H.; Li, W.; Liu, Y.; Chen, X.; Lai, J. Study on Discrimination of Varieties of Corn Using Near-Infrared Spectroscopy Based on GA and LDA. Spectrosc. Spectr. Anal. 2011, 31, 669–672. (In Chinese) [Google Scholar] [CrossRef]
- Huang, Y.; Zhu, L.; Ma, H.; Li, J.; Sun, B.; Sun, Q. Quantitative Analysis of Hybrid Maize Seed Purity Using Near Infrared Spectroscopy. Spectrosc. Spectr. Anal. 2011, 31, 2706–2710. (In Chinese) [Google Scholar] [CrossRef]
- Jia, S.; Guo, T.; Tang, X.; Si, G.; Yang, Y.; An, D. Studyon Spectral Measurement Methods in Identification of Maize Variety Authenticity Based on Near Infrared Spectra of Single Kernels. Spectrosc. Spectr. Anal. 2012, 32, 103–107. (In Chinese) [Google Scholar] [CrossRef]
- Han, Z.; Wang, J.; Zhang, H.; Deng, L.; Du, H.; Yang, J. Variety and Origin Identification of Maize Based on Near Infrared Spectrum. J. Chin. Cereals Oils Assoc. 2014, 29, 21–25. (In Chinese) [Google Scholar]
- Jia, S.; An, D.; Liu, Z.; Gu, J.; Li, S.; Zhang, X.; Zhu, D.; Guo, T.; Yan, Y. Variety identification method of coated maize seeds based on near-infrared spectroscopy and chemometrics. J. Cereal Sci. 2015, 63, 21–26. [Google Scholar] [CrossRef]
- Cui, Y.; Xu, L.; An, D.; Liu, Z.; Gu, J.; Li, S.; Zhang, X.; Zhu, D. Identification of maize seed varieties based on near infrared reflectance spectroscopy and chemometrics. Int. J. Agric. Biol. Eng. 2018, 11, 177–183. [Google Scholar] [CrossRef]
- Zhang, X.; Liu, F.; He, Y.; Li, X. Application of Hyperspectral Imaging and Chemometric Calibrations for Variety Discrimination of Maize Seeds. Sensors 2012, 12, 17234–17246. [Google Scholar] [CrossRef] [PubMed]
- Wang, L.; Sun, D.; Pu, H.; Zhu, Z. Application of Hyperspectral Imaging to Discriminate the Variety of Maize Seeds. Food Anal. Method 2016, 9, 225–234. [Google Scholar] [CrossRef]
- Xia, C.; Yang, S.; Huang, M.; Zhu, Q.; Guo, Y.; Qin, J. Maize seed classification using hyperspectral image coupled with multi-linear discriminant analysis. Infrared Phys. Technol. 2019, 103, 103077. [Google Scholar] [CrossRef]
- Zhou, Q.; Huang, W.; Tian, X.; Yang, Y.; Liang, D. Identification of the variety of maize seeds based on hyperspectral imagescoupled with convolutional neural networks and subregional voting. J. Sci. Food Agric. 2021, 101, 4532–4542. [Google Scholar] [CrossRef]
- Zhao, Y.; Zhu, S.; Zhang, C.; Feng, X.; Feng, L.; He, Y. Application of hyperspectral imaging and chemometrics for variety classification of maize seeds. RSC Adv. 2018, 8, 1337–1345. [Google Scholar] [CrossRef] [PubMed]
- Miao, A.; Zhuang, J.; Tang, Y.; He, Y.; Chu, X.; Luo, S. Hyperspectral Image-Based Variety Classification of Waxy Maize Seeds by the t-SNE Model and Procrustes Analysis. Sensors 2018, 18, 4391. [Google Scholar] [CrossRef]
- Bai, X.; Zhang, C.; Xiao, Q.; He, Y.; Bao, Y. Application of near-infrared hyperspectral imaging to identify a variety of silage maize seeds and common maize seeds. RSC Adv. 2020, 1, 1177–11715. [Google Scholar] [CrossRef]
- He, C.; Zhu, Q.; Huang, M.; Mendoza, F. Model Updating of Hyperspectral Imaging Data for Variety Discrimination of Maize Seeds Harvested in Different Years by Clustering Algorithm. Trans. ASABE 2016, 59, 1529–1537. [Google Scholar] [CrossRef]
- Zhang, J.; Dai, L.; Cheng, F. Corn seed variety classification based on hyperspectral reflectance imaging and deep convolutional neural network. J. Food Meas. Charact. 2021, 15, 484–494. [Google Scholar] [CrossRef]
- Zhou, Q.; Huang, W.; Fan, S.; Zhao, F.; Liang, D.; Tian, X. Non-destructive discrimination of the variety of sweet maize seeds based on hyperspectral image coupled with wavelength selection algorithm. Infrared Phys. Technol. 2020, 109, 103418. [Google Scholar] [CrossRef]
- Fu, L.; Sun, J.; Wang, S.; Xu, M.; Yao, K.; Cao, Y.; Tang, N. Identification of maize seed varieties based on stacked sparse autoencoder and near-infrared hyperspectral imaging technology. J. Food Process. Eng. 2022, 45, e14120. [Google Scholar] [CrossRef]
- Zhang, L.; Wang, D.; Liu, J.; An, D. Vis-NIR hyperspectral imaging combined with incremental learning for open world maize seed varieties identification. Comput. Electron. Agric. 2022, 199, 107153. [Google Scholar] [CrossRef]
- Wang, Y.; Song, S. Variety identification of sweet maize seeds based on hyperspectral imaging combined with deep learning. Infrared Phys. Technol. 2023, 130, 104611. [Google Scholar] [CrossRef]
- Feng, X.; Yin, H.; Zhang, C.; Peng, C.; He, Y. Screening of transgenic maize using near infrared spectroscopy and chemometric techniques. Span. J. Agric. Res. 2018, 16, e0203. [Google Scholar] [CrossRef]
- Peng, C.; Feng, X.; He, Y.; Zhang, C.; Zhao, Y.; Xu, J. Discrimination of Transgenic Maize Containing the Cry1Ab/Cry2Aj and G10evo Genes Usin gNear Infrared Spectroscopy (NIR). Spectrosc. Spectr. Anal. 2018, 38, 1095–1100. (In Chinese) [Google Scholar]
- Zhang, Y.; Wang, J. Application of Near Infrared Spectroscopy in Detection and Identification of Transgenic Maize. J. Agric. Mech. Res. 2022, 44, 177–180+192. (In Chinese) [Google Scholar]
- Feng, X.; Zhao, Y.; Zhang, C.; Cheng, P.; He, Y. Discrimination of Transgenic Maize Kernel Using NIR Hyperspectral Imaging and Multivariate Data Analysis. Sensors 2017, 17, 1894. [Google Scholar] [CrossRef] [PubMed]
- Wei, Y.; Yang, C.; He, L.; Wu, F.; Yu, Q.; Hu, W. Classification for GM and Non-GM Maize Kernels Based on NIR Spectra and Deep Learning. Processes 2023, 11, 486. [Google Scholar] [CrossRef]
- Liu, W.; Li, W.; Li, H.; Qin, H.; Ning, X. Research on the Method of Identifying Maize Haploid Based on KPCA and Near Infrared Spectrum. Spectrosc. Spectr. Anal. 2017, 37, 2024–2027. (In Chinese) [Google Scholar]
- Yu, L.; Liu, W.; Li, W.; Qin, H.; Xu, J.; Zuo, M. Non-destructive identification of maize haploid seeds using nonlinear analysis method based on their near-infrared spectra. Biosyst. Eng. 2018, 172, 144–153. [Google Scholar] [CrossRef]
- Cui, Y.; Ge, W.; Li, J.; Zhang, J.; An, D.; Wei, Y. Screening of maize haploid kernels based on near infrared spectroscopy quantitative analysis. Comput. Electron. Agric. 2019, 158, 358–368. [Google Scholar] [CrossRef]
- Ge, W.; Zhang, L.; Li, X.; Zhang, C.; Sun, M.; An, D.; Wu, J. Applying multimodal data fusion based on manifold learning with nuclear magnetic resonance (NMR) and near infrared spectroscopy (NIRS) to maize haploid identification. Biosyst. Eng. 2021, 210, 299–309. [Google Scholar] [CrossRef]
- Ribeiro, M.R.; Simeone, M.L.F.; Trindade, R.d.S.; Dias, L.A.d.S.; Guimarães, L.J.M.; Tibola, C.S.; de Azevedo, T.C. Near infrared spectroscopy (NIR) and chemometrics methods to identification of haploids in maize. Microchem. J. 2023, 190, 108604. [Google Scholar] [CrossRef]
- Wang, Y.; Lv, Y.; Liu, H.; Wei, Y.; Zhang, J.; An, D.; Wu, J. Identification of maize haploid kernels based on hyperspectral imaging technology. Comput. Electron. Agric. 2018, 153, 188–195. [Google Scholar] [CrossRef]
- He, X.; Liu, L.; Liu, C.; Li, W.; Sun, J.; Li, H.; He, Y.; Yang, L.; Zhang, D.; Cui, T.; et al. Discriminant analysis of maize haploid seeds using near-infrared hyperspectral imaging integrated with multivariate methods. Biosyst. Eng. 2022, 222, 142–155. [Google Scholar] [CrossRef]
- Zhang, L.; Nie, Q.; Ji, H.; Wang, Y.; Wei, Y.; An, D. Hyperspectral imaging combined with generative adversarial network (GAN)-based data augmentation to identify haploid maize kernels. J. Food Compos. Anal. 2022, 106, 104346. [Google Scholar] [CrossRef]
- Esteve Agelet, L.; Ellis, D.D.; Duvick, S.; Goggi, A.S.; Hurburgh, C.R.; Gardner, C.A. Feasibility of near infrared spectroscopy for analyzing corn kernel damage and viability of soybean and corn kernels. J. Cereal Sci. 2012, 55, 160–165. [Google Scholar] [CrossRef]
- Yang, D.; Yin, S.; Jiang, L.; Gao, S. Research on Maize Vigor Intelligent Detection Based On Near Infrared Spectroscopy. J. Nucl. Agric. Sci. 2013, 27, 957–961. (In Chinese) [Google Scholar]
- Li, W.; Li, Y.; Li, G.; Gao, L.; Chen, M.; Lu, J.; Hu, J.; Liu, J. Seed Vigor Detection of Sweet Corn by Near Infrared Spectroscopy Under High Temperature Stress. J. Nucl. Agric. Sci. 2018, 32, 1611–1618. (In Chinese) [Google Scholar]
- Wang, Y.; Peng, Y.; Zhuang, Q.; Zhao, X. Feasibility analysis of NIR for detecting sweet corn seeds vigor. J. Cereal Sci. 2020, 93, 102977. [Google Scholar] [CrossRef]
- Zhao, B.; Wang, A.; Zhao, H. Determination of sweet corn seed vigor by near infraredspectra and chemometrics. J. South. Agric. 2022, 53, 1875–1882. (In Chinese) [Google Scholar]
- Ambrose, A.; Kandpal, L.M.; Kim, M.S.; Lee, W.; Cho, B. High speed measurement of corn seed viability using hyperspectral imaging. Infrared Phys. Technol. 2016, 75, 173–179. [Google Scholar] [CrossRef]
- Feng, L.; Zhu, S.; Zhang, C.; Bao, Y.; Feng, X.; He, Y. Identification of Maize Kernel Vigor under Different Accelerated Aging Times Using Hyperspectral Imaging. Molecules 2018, 23, 3078. [Google Scholar] [CrossRef]
- Wakholi, C.; Kandpal, L.M.; Lee, H.; Bae, H.; Park, E.; Kim, M.S.; Mo, C.; Lee, W.; Cho, B. Rapid assessment of corn seed viability using short wave infrared line-scan hyperspectral imaging and chemometrics. Sens. Actuators B Chem. 2018, 255, 498–507. [Google Scholar] [CrossRef]
- Pang, L.; Men, S.; Yan, L.; Xiao, J. Rapid Vitality Estimation and Prediction of Corn Seeds Based on Spectra and Images Using Deep Learning and Hyperspectral Imaging Techniques. IEEE Access 2020, 8, 123026–123036. [Google Scholar] [CrossRef]
- Zhao, X.; Pang, L.; Wang, L.; Men, S.; Yan, L. Deep Convolutional Neural Network for Detection and Prediction of Waxy Corn Seed Viability Using Hyperspectral Reflectance Imaging. Math. Comput. Appl. 2022, 27, 109. [Google Scholar] [CrossRef]
- Cui, H.; Bing, Y.; Zhang, X.; Wang, Z.; Li, L.; Miao, A. Prediction of Maize Seed Vigor Based on First-Order Difference Characteristics of Hyperspectral Data. Agronomy 2022, 12, 1899. [Google Scholar] [CrossRef]
- Xu, P.; Zhang, Y.; Tan, Q.; Xu, K.; Sun, W.; Xing, J.; Yang, R. Vigor identification of maize seeds by using hyperspectral imaging combined with multivariate data analysis. Infrared Phys. Technol. 2022, 126, 104361. [Google Scholar] [CrossRef]
- Fassio, A.; Fernández, E.G.; Restaino, E.A.; La Manna, A.; Cozzolino, D. Predicting the nutritive value of high moisture grain corn by near infrared reflectance spectroscopy. Comput. Electron. Agric. 2009, 67, 59–63. [Google Scholar] [CrossRef]
- Wang, X.; Ma, T.; Yang, T.; Song, P.; Chen, Z.; Xie, H. Monitoring model for predicting maize grain moisture at the filling stage using NIRS and a small sample size. Int. J. Agric. Biol. Eng. 2019, 12, 132–140. [Google Scholar] [CrossRef]
- Yang, L.; Zhang, L.; Ye, Z. Content in Maize Seeds Based on Ensemble Learning and Near Infrared Spectroscopy. Acta Agric. Boreali-Occident. Sin. 2022, 31, 1025–1034. (In Chinese) [Google Scholar] [CrossRef]
- Huang, M.; Zhao, W.; Wang, Q.; Zhang, M.; Zhu, Q. Prediction of moisture content uniformity using hyperspectral imaging technology during the drying of maize kernel. Int. Agrophys 2015, 29, 39–46. [Google Scholar] [CrossRef]
- Wang, Z.; Zhang, Y.; Fan, S.; Jiang, Y.; Li, J. Determination of Moisture Content of Single Maize Seed by Using Long-Wave Near-Infrared Hyperspectral Imaging (LWNIR) Coupled With UVE-SPA Combination Variable Selection Method. IEEE Access 2020, 8, 195229–195239. [Google Scholar] [CrossRef]
- Zhang, Y.; Guo, W. Moisture content detection of maize seed based on visible/near-infrared and near-infrared hyperspectral imaging technology. Int. J. Food Sci. Technol. 2020, 55, 631–640. [Google Scholar] [CrossRef]
- Wang, Z.; Fan, S.; Wu, J.; Zhang, C.; Xu, F.; Yang, X.; Li, J. Application of long-wave near infrared hyperspectral imaging for determination of moisture content of single maize seed. Spectrochim. Acta Part A Mol. Biomol. Spectrosc. 2021, 254, 119666. [Google Scholar] [CrossRef] [PubMed]
- Wu, J.; Zhang, L.; Li, J.; Liu, C.; Sun, X.; Yu, L. Detection Model of Moisture Content of Single Maize Seed Based on Hyperspectral Image and Ensemble Learning. Trans. Chin. Soc. Agric. Mach. 2022, 53, 302–308. (In Chinese) [Google Scholar] [CrossRef]
- Zhang, L.; Zhang, Q.; Wu, J.; Liu, Y.; Yu, L.; Chen, Y. Moisture detection of single corn seed based on hyperspectral imaging and deep learning. Infrared Phys Technol. 2022, 125, 104279. [Google Scholar] [CrossRef]
- Wang, Z.; Li, J.; Zhang, C.; Fan, S. Development of a General Prediction Model of Moisture Content in Maize Seeds Based on LW-NIR Hyperspectral Imaging. Agriculture 2023, 13, 359. [Google Scholar] [CrossRef]
- Fassio, A.S.; Restaino, E.A.; Cozzolino, D. Determination of oil content in whole corn (Zea mays L.) seeds by means of near infrared reflectance spectroscopy. Comput. Electron. Agric. 2015, 110, 171–175. [Google Scholar] [CrossRef]
- Lyu, N.; Chen, J.; Pan, T.; Yao, L.; Han, Y.; Yu, J. Near-infrared spectroscopy combined with equidistant combination partial least squares applied to multi-index analysis of corn. Infrared Phys. Technol. 2016, 76, 648–654. [Google Scholar] [CrossRef]
- Alamu, E.O.; Menkir, A.; Adesokan, M.; Fawole, S.; Maziya-Dixon, B. Near-Infrared Reflectance Spectrophotometry (NIRS) Application in the Amino Acid Profiling of Quality Protein Maize (QPM). Foods 2022, 11, 2779. [Google Scholar] [CrossRef]
- Cataltas, O.; Tutuncu, K. Detection of protein, starch, oil, and moisture content of corn kernels usingone-dimensional convolutional autoencoder and near-infrared spectroscopy. PeerJ Comput. Sci. 2023, 9, e1266. [Google Scholar] [CrossRef] [PubMed]
- Wu, X.; Zeng, S.; Fu, H.; Wu, B.; Zhou, H.; Dai, C. Determination of corn protein content using near-infrared spectroscopy combined with A-CARS-PLS. Food Chem. X 2023, 18, 100666. [Google Scholar] [CrossRef]
- Xu, L.; Liu, J.; Wang, C.; Li, Z.; Zhang, D. Rapid determination of the main components of corn based on near-infrared spectroscopy and a BiPLS-PCA-ELM model. Appl. Opt. 2023, 62, 2756–2765. [Google Scholar] [CrossRef]
- Liu, C.; Huang, W.; Yang, G.; Wang, Q.; Li, J.; Chen, L. Determination of starch content in single kernel using near-infrared hyperspectral images from two sides of corn seeds. Infrared Phys. Technol. 2020, 110, 103462. [Google Scholar] [CrossRef]
- Zhang, L.; Wang, Y.; Wei, Y.; An, D. Near-infrared hyperspectral imaging technology combined with deep convolutional generative adversarial network to predict oil content of single maize kernel. Food Chem. 2022, 370, 131047. [Google Scholar] [CrossRef] [PubMed]
- Zhang, L.; An, D.; Wei, Y.; Liu, J.; Wu, J. Prediction of oil content in single maize kernel based on hyperspectral imaging and attention convolution neural network. Food Chem. 2022, 395, 133563. [Google Scholar] [CrossRef] [PubMed]
- Fernández-Ibañez, V.; Soldado, A.; Martínez-Fernández, A.; de la Roza-Delgado, B. Application of near infrared spectroscopy for rapid detection of aflatoxin B1 in maize and barley as analytical quality assessment. Food Chem. 2009, 113, 629–634. [Google Scholar] [CrossRef]
- Tallada, J.G.; Wicklow, D.T.; Pearson, T.C.; Armstrong, P.R. Detection of fungus-infected corn kernels using near-infrared reflectance spectroscopy and color imaging. Trans. ASABE 2011, 54, 1151–1158. [Google Scholar] [CrossRef]
- Tao, F.; Yao, H.; Hruska, Z.; Liu, Y.; Rajasekaran, K.; Bhatnagar, D. Detection of aflatoxin B1 on corn kernel surfaces using visible-near infrared spectroscopy. J. Near Infrared Spectrosc. 2020, 28, 59–69. [Google Scholar] [CrossRef]
- Liu, T.; He, J.; Yao, W.; Jiang, H.; Chen, Q. Determination of aflatoxin B1 value in corn based on Fourier transform near-infrared spectroscopy: Comparison of optimization effect of characteristic wavelengths. LWT 2022, 164, 113657. [Google Scholar] [CrossRef]
- Deng, J.; Jiang, H.; Chen, Q. Characteristic wavelengths optimization improved the predictive performance of near-infrared spectroscopy models for determination of aflatoxin B1 in maize. J. Cereal Sci. 2022, 105, 103474. [Google Scholar] [CrossRef]
- Shen, G.; Kang, X.; Su, J.; Qiu, J.; Liu, X.; Xu, J.; Shi, J.; Mohamed, S.R. Rapid detection of fumonisin B1 and B2 in ground corn samples using smartphone-controlled portable near-infrared spectrometry and chemometrics. Food Chem. 2022, 384, 132487. [Google Scholar] [CrossRef]
- Wang, B.; Deng, J.; Jiang, H. Markov Transition Field Combined with Convolutional Neural Network Improved the Predictive Performance of Near-Infrared Spectroscopy Models for Determination of Aflatoxin B1 in Maize. Foods 2022, 11, 2210. [Google Scholar] [CrossRef]
- Tao, F.; Yao, H.; Hruska, Z.; Kincaid, R.; Rajasekaran, K. Near-infrared hyperspectral imaging for evaluation of aflatoxin contamination in corn kernels. Biosyst. Eng. 2022, 221, 181–194. [Google Scholar] [CrossRef]
- Zhu, F.; Yao, H.; Hruska, Z.; Kincaid, R.; Brown, R.; Bhatnagar, D.; Cleveland, T. Integration of Fluorescence and Reflectance Visible Near-Infrared (VNIR) Hyperspectral Images for Detection of Aflatoxins in Corn Kernels. Trans. ASABE 2016, 59, 785–794. [Google Scholar] [CrossRef]
- Da Conceição, R.R.P.; Simeone, M.L.F.; Queiroz, V.A.V.; de Medeiros, E.P.; de Araújo, J.B.; Coutinho, W.M.; Da Silva, D.D.; de Araújo Miguel, R.; de Paula Lana, U.G.; de Resende Stoianoff, M.A. Application of near-infrared hyperspectral (NIR) images combined with multivariate image analysis in the differentiation of two mycotoxicogenic Fusarium species associated with maize. Food Chem. 2021, 344, 128615. [Google Scholar] [CrossRef] [PubMed]
- Zhang, J.; Xu, B.; Wang, Z.; Cheng, F. Application of hyperspectral imaging in the detection of aflatoxin B1 on corn seed. J. Food Meas. Charact. 2022, 16, 448–460. [Google Scholar] [CrossRef]
- Zhou, Q.; Huang, W.; Liang, D.; Tian, X. Classification of Aflatoxin B1 Concentration of Single Maize Kernel Based on Near-Infrared Hyperspectral Imaging and Feature Selection. Sensors 2021, 21, 4257. [Google Scholar] [CrossRef] [PubMed]
- Zhou, Q.; Liang, D.; Fan, S.; Huang, W.; Pang, Q.; Tian, X. Application of hyperspectral characteristic wavelength selection based on weighted between-class to within-class variance ratio (WBWVR) in aflatoxin B concentration classification of maize flour. Infrared Phys. Technol. 2022, 122, 104095. [Google Scholar] [CrossRef]
- Wang, W.; Heitschmidt, G.W.; Windham, W.R.; Feldner, P.; Ni, X.; Chu, X. Feasibility of Detecting Aflatoxin B1 on Inoculated Maize Kernels Surface using Vis/NIR Hyperspectral Imaging. J. Food Sci. 2015, 80, M116–M122. [Google Scholar] [CrossRef] [PubMed]
- Wang, W.; Ni, X.; Lawrence, K.C.; Yoon, S.; Heitschmidt, G.W.; Feldner, P. Feasibility of detecting Aflatoxin B1 in single maize kernels using hyperspectral imaging. J. Food Eng. 2015, 166, 182–192. [Google Scholar] [CrossRef]
- Wang, W.; Heitschmidt, G.W.; Ni, X.; Windham, W.R.; Hawkins, S.; Chu, X. Identification of aflatoxin B1 on maize kernel surfaces using hyperspectral imaging. Food Control 2014, 42, 78–86. [Google Scholar] [CrossRef]
- Chu, X.; Wang, W.; Yoon, S.; Ni, X.; Heitschmidt, G.W. Detection of aflatoxin B1 (AFB1) in individual maize kernels using short wave infrared (SWIR) hyperspectral imaging. Biosyst. Eng. 2017, 157, 13–23. [Google Scholar] [CrossRef]
- Kimuli, D.; Wang, W.; Lawrence, K.C.; Yoon, S.; Ni, X.; Heitschmidt, G.W. Utilisation of visible/near-infrared hyperspectral images to classify aflatoxin B1 contaminated maize kernels. Biosyst. Eng. 2018, 166, 150–160. [Google Scholar] [CrossRef]
- Kimuli, D.; Wang, W.; Wang, W.; Jiang, H.; Zhao, X.; Chu, X. Application of SWIR hyperspectral imaging and chemometrics for identification of aflatoxin B1 contaminated maize kernels. Infrared Phys. Technol. 2018, 89, 351–362. [Google Scholar] [CrossRef]
- Chu, X.; Wang, W.; Ni, X.; Li, C.; Li, Y. Classifying maize kernels naturally infected by fungi using near-infrared hyperspectral imaging. Infrared Phys. Technol. 2020, 105, 103242. [Google Scholar] [CrossRef]
- Guo, X.; Jia, B.; Zhang, H.; Ni, X.; Zhuang, H.; Lu, Y.; Wang, W. Evaluation of Aspergillus flavus Growth and Detection of Aflatoxin B1 Content on Maize Agar Culture Medium Using Vis/NIR Hyperspectral Imaging. Agriculture 2023, 13, 237. [Google Scholar] [CrossRef]
- Mansuri, S.M.; Chakraborty, S.K.; Mahanti, N.K.; Pandiselvam, R. Effect of germ orientation during Vis-NIR hyperspectral imaging for the detection of fungal contamination in maize kernel using PLS-DA, ANN and 1D-CNN modelling. Food Control 2022, 139, 109077. [Google Scholar] [CrossRef]
- Lu, Y.; Jia, B.; Yoon, S.; Zhuang, H.; Ni, X.; Guo, B.; Gold, S.E.; Fountain, J.C.; Glenn, A.E.; Lawrence, K.C.; et al. Spatio-temporal patterns of Aspergillus flavus infection and aflatoxin B1 biosynthesis on maize kernels probed by SWIR hyperspectral imaging and synchrotron FTIR microspectroscopy. Food Chem. 2022, 382, 132340. [Google Scholar] [CrossRef] [PubMed]
- Gao, J.; Ni, J.; Wang, D.; Deng, L.; Li, J.; Han, Z. Pixel-level aflatoxin detecting in maize based on feature selection and hyperspectral imaging. Spectrochim. Acta Part A Mol. Biomol. Spectrosc. 2020, 234, 118269. [Google Scholar] [CrossRef]
- Wang, Z.; An, T.; Wang, W.; Fan, S.; Chen, L.; Tian, X. Qualitative and quantitative detection of aflatoxins B1 in maize kernels with fluorescence hyperspectral imaging based on the combination method of boosting and stacking. Spectrochim. Acta Part A Mol. Biomol. Spectrosc. 2023, 296, 122679. [Google Scholar] [CrossRef] [PubMed]
- Zhou, Q.; Huang, W.; Tian, X. Feature Wavelength Selection Based on the Combination of Image and Spectrum for Aflatoxin B1 Concentration Classification in Single Maize Kernels. Agriculture 2022, 12, 385. [Google Scholar] [CrossRef]
- Jia, S.; Yang, L.; An, D.; Liu, Z.; Yan, Y.; Li, S.; Zhang, X.; Zhu, D.; Gu, J. Feasibility of analyzing frost-damaged and non-viable maize kernels based on near infrared spectroscopy and chemometrics. J. Cereal Sci. 2016, 69, 145–150. [Google Scholar] [CrossRef]
- Zhang, J.; Wang, Z.; Qu, M.; Cheng, F. Research on physicochemical properties, microscopic characterization and detection of different freezing-damaged corn seeds. Food Chem. X 2022, 14, 100338. [Google Scholar] [CrossRef] [PubMed]
- Zhang, J.; Dai, L.; Cheng, F. Classification of Frozen Corn Seeds Using Hyperspectral VIS/NIR Reflectance Imaging. Molecules 2019, 24, 149. [Google Scholar] [CrossRef]
- Zhang, J.; Dai, L.; Cheng, F. Identification of Corn Seeds with Different Freezing Damage Degree Based on Hyperspectral Reflectance Imaging and Deep Learning Method. Food Anal. Method 2021, 14, 389–400. [Google Scholar] [CrossRef]
- Williams, P.; Geladi, P.; Fox, G.; Manley, M. Maize kernel hardness classification by near infrared (NIR) hyperspectral imaging and multivariate data analysis. Anal. Chim. Acta 2009, 653, 121–130. [Google Scholar] [CrossRef] [PubMed]
- Williams, P.J.; Kucheryavskiy, S. Classification of maize kernels using NIR hyperspectral imaging. Food Chem. 2016, 209, 131–138. [Google Scholar] [CrossRef] [PubMed]
- Qiao, M.; Xu, Y.; Xia, G.; Su, Y.; Lu, B.; Gao, X.; Fan, H. Determination of hardness for maize kernels based on hyperspectral imaging. Food Chem. 2022, 366, 130559. [Google Scholar] [CrossRef] [PubMed]
- Wang, L.; Pu, H.; Sun, D.; Liu, D.; Wang, Q.; Xiong, Z. Application of Hyperspectral Imaging for Prediction of Textural Properties of Maize Seeds with Different Storage Periods. Food Anal. Method 2015, 8, 1535–1545. [Google Scholar] [CrossRef]
- Huang, M.; Tang, J.; Yang, B.; Zhu, Q. Classification of maize seeds of different years based on hyperspectral imaging and model updating. Comput. Electron. Agric. 2016, 122, 139–145. [Google Scholar] [CrossRef]
- Wang, Z.; Huang, W.; Tian, X.; Long, Y.; Li, L.; Fan, S. Rapid and Non-destructive Classification of New and Aged Maize Seeds Using Hyperspectral Image and Chemometric Methods. Front. Plant Sci. 2022, 13, 849495. [Google Scholar] [CrossRef] [PubMed]
- Yang, X.; You, Z.; Cheng, F. Study on Identification of Immature Corn Seed Using Hyperspectral Imaging. Spectrosc. Spectr. Anal. 2016, 36, 4028–4033. (In Chinese) [Google Scholar]
- Wang, Z.; Tian, X.; Fan, S.; Zhang, C.; Li, J. Maturity determination of single maize seed by using near-infrared hyperspectral imaging coupled with comparative analysis of multiple classification models. Infrared Phys. Technol. 2021, 112, 103596. [Google Scholar] [CrossRef]
| Indicators | Application Scenario | Traditional Detection Methods | Advantages | Disadvantages |
|---|---|---|---|---|
| Variety and purity | To avoid losses caused by shoddy and mixed seeds. | Manual, protein electrophoresis, DNA analysis, etc. | High accuracy | Destructive, time-consuming |
| Vigor | To improve seed survival and yield. | Germination rate, electrical conductivity, artificial accelerated aging measurement, etc. | Simple, easy to operate | Time-consuming, destructive, large sample size |
| Component | To provide a basis for rational use and processing. | DNA molecular markers, Kjeldahl nitrogen determination, acid hydrolysis, thermogravimetric analysis, etc. | High accuracy | Time-consuming, destructive |
| Moisture | To provide a basis for storage and processing | Drying, microwave heating, resistance method, etc. | High accuracy | Time-consuming, destructive |
| Mycotoxins | To prevent harm to humans and animals. | HPLC, LC-MS/MS method, etc. | High accuracy | Expensive, Complicated operation, destructive |
| Freezing damage | To provide a basis for seed selection and use. | Observation, germination, electrical conductivity method, chemical analysis | Simple, easy to operate | Destructive, time-consuming |
| Maturity | To determine the quality and yield potential | Germination determination, nuclear magnetic resonance method | Simple, easy to operate | Time-consuming, destructive |
| Hardness | To provide a basis for processing and packaging. | Hardness meter measurement, grinding method | Easy to operate | Destructive, time-consuming |
| Technology | Data | Components of the Equipment | Price | Portability or Not |
|---|---|---|---|---|
| NIRS | Spectral data | Light source, beam splitter system, sample stage, optical detector, and its data analysis system | Lower cost | Yes |
| HSI | Combination of spectral and spatial data | CCD camera, imaging spectrometer, lens, light source controller, sample station, mobile platform and its controller, data acquisition software, and mobile platform of mobile control software | Higher cost | No |
| Spectral Preprocessing Method | Description | Formula |
|---|---|---|
| Mean Centering | Shifts the spectrum so that the mean of the spectral values is zero. | xnew = x – x0, where x is the original spectral value and x0 is the mean of all spectral values. |
| SNV | Normalizes the spectra to have a mean of zero and a standard deviation of one. | , where x0 is the mean and is the standard deviation of the spectral values. |
| MSC | Corrects for scatter effects in the spectra. | , where b0 and b1 are regression coefficients obtained from a linear regression between the sample spectrum and the mean spectrum. |
| First—Derivative | Calculates the first—order derivative of the spectral data to enhance spectral features. | , where is the wavelength. |
| Second—Derivative | Calculates the second—order derivative of the spectral data to further enhance spectral features. | , where is the wavelength. |
| Feature Wavelength Selection Method | Modeling Methods | Evaluation Indicators |
|---|---|---|
| PCA, CARS, GA, SPA, UVE, etc. | Traditional methods such as BPR, KNN, LDA, PLS-DA, ELM, SVM, BPNN, PLSR, RBFNN, etc. Deep learning methods such as CNN, etc. | Accuracy, sensitivity, specificity, correlation coefficient, and the standard deviation. |
| Contributions and Gaps | Details |
|---|---|
| Contributions in previous surveys |
|
| Gaps in previous surveys |
|
| Gaps filled by this review paper |
|
Disclaimer/Publisher’s Note: The statements, opinions and data contained in all publications are solely those of the individual author(s) and contributor(s) and not of MDPI and/or the editor(s). MDPI and/or the editor(s) disclaim responsibility for any injury to people or property resulting from any ideas, methods, instructions or products referred to in the content. |
© 2025 by the authors. Licensee MDPI, Basel, Switzerland. This article is an open access article distributed under the terms and conditions of the Creative Commons Attribution (CC BY) license (https://creativecommons.org/licenses/by/4.0/).
Share and Cite
Zhang, J.; Dai, L.; Huang, Z.; Gong, C.; Chen, J.; Xie, J.; Qu, M. Corn Seed Quality Detection Based on Spectroscopy and Its Imaging Technology: A Review. Agriculture 2025, 15, 390. https://doi.org/10.3390/agriculture15040390
Zhang J, Dai L, Huang Z, Gong C, Chen J, Xie J, Qu M. Corn Seed Quality Detection Based on Spectroscopy and Its Imaging Technology: A Review. Agriculture. 2025; 15(4):390. https://doi.org/10.3390/agriculture15040390
Chicago/Turabian StyleZhang, Jun, Limin Dai, Zhiwen Huang, Caidie Gong, Junjie Chen, Jiashuo Xie, and Maozhen Qu. 2025. "Corn Seed Quality Detection Based on Spectroscopy and Its Imaging Technology: A Review" Agriculture 15, no. 4: 390. https://doi.org/10.3390/agriculture15040390
APA StyleZhang, J., Dai, L., Huang, Z., Gong, C., Chen, J., Xie, J., & Qu, M. (2025). Corn Seed Quality Detection Based on Spectroscopy and Its Imaging Technology: A Review. Agriculture, 15(4), 390. https://doi.org/10.3390/agriculture15040390