Article

The Effects of Sowing Density and Timing on Spike Characteristics of Durum Winter Wheat

1
Faculty of Food Technology, University of Agriculture in Kraków, 30-149 Krakow, Poland
2
Faculty of Agriculture and Economics, University of Agriculture in Kraków, 31-120 Kraków, Poland
*
Author to whom correspondence should be addressed.
Agriculture 2025, 15(4), 359; https://doi.org/10.3390/agriculture15040359
Submission received: 20 December 2024 / Revised: 5 February 2025 / Accepted: 6 February 2025 / Published: 7 February 2025
(This article belongs to the Special Issue Effect of Cultivation Practices on Crop Yield and Quality)

Abstract

:
Durum wheat (Triticum durum Desf.) is the second most cultivated species of wheat after common wheat. In this study, the physical properties of ears and kernels of durum winter wheat were evaluated, focusing on the effects of sowing date and density. Understanding these properties is crucial for assessing the quality and technological utility of wheat. Three winter varieties of wheat, Komnata, Pentadur, and Auradur, were cultivated in the Małopolska Voivodeship of Poland. Two sowing dates (optimal and delayed) and three sowing densities (400, 500, and 600 kernels/m2) were employed. Significant variations in morphological traits—including plumpness, uniformity, density, and kernel dimensions—were analyzed. The results indicated that while the sowing date significantly influenced spike characteristics and grain yields, the sowing density had minimal effects. For example, plants sown earlier produced longer spike rachis and higher grain yield, reflecting the correlation between sowing time and spike development. This study highlights that grain plumpness varied significantly due to sowing dates, with delayed sowing yielding higher plumpness percentages. However, the overall volumetric weight of the grains was lower than the standard, indicating suboptimal growing conditions in Małopolska. Ultimately, this research underscores the importance of selecting appropriate sowing dates for optimal developmental outcomes in durum wheat, particularly under atypical growing conditions. Moreover, the results obtained partially indicate that worse physical spike biometry parameters can, to some extent, play a role in determining better quality of grain yield.

1. Introduction

Generally, all types of wheat are primary staple foods produced worldwide [1]. World production of durum wheat (Triticum durum Desf.) is only 5–8% of bread wheat production, although durum is better adapted to more diverse environments than common wheat and could be a better solution to current climate change. Today, durum wheat is mostly grown in arid and semi-arid regions around the world. Most of these crops are located in North America and in Europe in the Mediterranean, where conditions are optimal for the cultivation of this cereal. This species has a tetraploid genome, unlike the hexaploid genome of common wheat (T. aestivum) [2,3].
The concept of physical properties is commonly used to describe the characteristics of a material that physical measurement methods can determine without damaging its structure. The properties of materials such as cereal grains can be divided into mechanical properties, shape and dimensions, density and porosity, friction, aerodynamic and rheological properties, thermal properties, electromagnetic and electrostatic properties, and diffusion properties. Knowledge of the physical properties of cereal grains is important during harvest, storage, and processing. Also, these features influence the quality and technological application of this raw material. Data in the literature indicate that the physical properties of soft wheat influence its milling and the quality of products obtained from the flour, which is of fundamental importance for the way it is used. For example, in the milling process, the physical properties of kernels determine the final ash content, endosperm separation index, and friability [4]. Haddad et al. [5] pointed out that a physical property such as hardness is an important factor in wheat milling due to the possible differences in the yields of the different fractions. The production ratio between the break and reduction flours can vary considerably depending on the hardness of the wheat and the agronomic conditions of its cultivation. Milling soft wheat produces approximately the same percentage of break flour and reduction fractions, whereas in the case of hard wheat, the break flour is only about a quarter of the yield of the reduction flour. In fact, durum wheat kernels tend to be broken into coarser particles called semolina, while soft wheat varieties yield flour particles directly. Despite the global economic importance of wheat technological processes, scientific work on the physical properties of kernels is still extremely fragmentary and mostly focuses on mechanical properties influencing the milling performance. The problem is that wheat kernels are one of the raw materials for which it is most difficult to determine physical properties due to their small size and relatively complicated shape. Another difficulty is the high variability of these properties, even within the same variety.
The properties of durum wheat, as with all wheat species, are strongly dependent on the environmental conditions, nitrogen fertilization, and other agricultural technology used [6,7,8]. Due to its high protein content with specific properties, durum is a raw material for the production of couscous, bulgur, freekeh, and pasta or bakery products. Currently, due to the value of this raw material and the huge popularity of pasta in the human diet, attempts are being made to grow durum wheat under conditions atypical for this species [5]. Varieties registered in countries not specific to durum wheat cultivation, from Central and northeastern Europe, have characteristics enabling profitable cultivation, e.g., increased winter hardiness. Numerous studies have been carried out on the optimization of the agrotechnical conditions for new durum varieties. One important agrotechnical factor other than nitrogen fertilization in cereal cultivation is the date and density of sowing [2]. These factors determine the quantity and quality of the crop. In the literature, we did not find many reports on the physical properties of durum wheat grain grown outside the regions specific to this species and the impact of the agricultural technique applied, such as the sowing date and density.
The study aimed to determine the morphological characteristics of ears and kernels (plumpness, uniformity, density, and kernel dimensions) of three winter varieties of durum wheat grown in the Małopolska Voivodeship (Poland), which were sown on two dates using three sowing densities.

2. Materials and Methods

The research material was the grain of three varieties of winter durum wheat: Komnata (Polish variety), Pentadur (Slovak variety), and Auradur (Austrian variety). The kernels came from a strict field experiment carried out in Prusy near Kraków (Southern Poland, 50°06′52″ N; 20°04′23″ E) in the 2022/2023 growing season in a randomized block design, plots of 10 m2 each, with three replications. In the experiment, two sowing dates (optimum September 30 and delayed October 20, marked as I and II) and three sowing densities (400, 500, and 600 kernels/m2, marked as 400, 500, and 600, respectively) were employed. The pre-crop was oilseed rape. After harvesting the pre-crop, full soil tillage was performed. A chemical protection was applied according to monitoring and recommendations, and it consisted of seed treatment, herbicide (triasulfuron and dicamba), fungicides at tillering and the heading phase (propiconasol, fenpropidin, and azoxystrobin), and a growth regulator (trinexapac-ethyl). Optimal mineral fertilization was used, i.e., before sowing granular triple superphosphate 40% P2O5 80 kg ha−1 and potassium salt 60% K2O 150 kg ha−1 and three doses of nitrogen fertilization during vegetation as ammonium nitrate 34% N (first dose 80 kg ha−1 at tillering, second 40 kg ha−1 at stem elongation, and third 40 kg ha−1 at the heading phase). Meteorological data, i.e., average monthly temperatures and total rainfall for the area where the field experiment was carried out, are shown in Figure 1. The meteorological conditions during the field experiment season differed significantly from those observed over the 31-year reference period—the average monthly temperature was higher by 1°, and the annual rainfall was lower by 50 mm. This is consistent with the global trend of climate change.

2.1. Spike Evaluation

The following characteristics of the spike were evaluated: length of the spike rachis, number of spikelets in the spike, spike compactness, number of spikelets per 1 dm of spike rachis (compactness), and number of kernels per 1 spikelet [9].
Spike compactness was determined by the following formula:
D = (n − 1) × 100/l,
where D is the spike compactness, n is the number of spikelets in the ear, and l is the length of the spike rachis measured in mm.

2.2. Determination of Grain Plumpness and Uniformity

For the sieve analysis, a Sortimat vibrating screen from Pfeuffer (Kitzinger, Germany) with sieves with the following mesh dimensions were used: 2.8 × 25 mm, 2.5 × 25 mm, and 2.2 × 25 mm.

2.3. Determination of Bulk Density

The determination of the bulk density of the grain was performed using the routine method specified in the PN-ISO 7971-3:2010 (2010) [10] standard in two repetitions.

2.4. Assessment of the Physical Dimensions of the Kernels

The images analyzed were taken with a Plustek OpticPro S12 flatbed scanner with an A4 working surface (Plustek Technology GmbH, Ahrensburg, Germany). The grain was placed on the surface of the scanner, and then the image was captured at 300 DPI and saved in JPEG format. For each grain sample, 15 scans were performed. Image analysis was performed using the ImageJ program v. 1.53e [11].

2.5. Data Analysis

All analyses were performed in two replications. Statistical evaluation was performed using the Stastistica software Package (Statsoft, Krakow, Poland). ANOVA and the Tukey HSD test were applied to evaluate differences between the samples. The relationships between observations were determined by a principal component analysis (PCA) using the centralization of the results for each trait according to the following formula: ((result − mean)/standard deviation). Lengths between variables were computed by principal coordinate analysis (PCoA) using transformed data (according to the above formula). The results were processed statistically and interpreted graphically in OriginPro 2020 (OriginLab Corporation, Northampton, MA, USA) data analysis software.

3. Results and Discussion

3.1. Parameters of Durum Wheat Ears

The results and statistical parameters were presented in Table 1, Table 2 and Table 3. The length of the spike rachis (length of main shoot) (Table 1) of the tested cultivars varied within the range of 4.42–5.18 cm, with both extreme results observed in the Pentadur cultivar. As can be seen, neither the varietal factor nor the sowing density had an impact on these characteristics, only the time of sowing—plants sown earlier produced a longer spike rachis. Data from the literature indicate the value of this feature for durum wheat to be within the range of 3.6–6.9 cm [12], 4.8–6.1 cm [13], and 6.62–7.15 cm, with an average of 7.01 cm [14] or 5.24 cm [8]. The last value is an average value from 2015 to 2017. In the case of common wheat, the length of the spike rachis is longer and can be 8.74–12.25 cm [15].
The number of spikelets per spike in the studied material ranged from 11.10 (Komnata) to 13.87 (Auradur and Pentadur) (Table 1). The genetic factor (cultivar) and the sowing time significantly impacted the number of spikelets in the spike, but the sowing density did not. Later sowing resulted in a significant reduction in the number of spikelets in the ear, which can indicate that the spike rachis was not fully formed in a shorter period, seeming to confirm the highly significant correlation between these features (Pearson’s correlation coefficient (PCC), r = 0.852, p = 0.000007) (Table 3). This correlation is confirmed in the literature for spring durum wheat genotypes, where the correlation coefficients of these features were 0.473 and 0.799 [12] and 0.650 [13] at p = 0.01. The number of spikelets in the ear of durum wheat growing in Spain is much higher than that observed in the cold climate of Poland [7], and ranges between 25.1 and 32.3 [16]. These studies also indicate an increase in this value when grown in warmer environments and in the case of irrigation. Lower figures than those quoted above were reported by Gaju et al. [15] (20.1–26.5) and Álvaro et al. [17] (16.0–17.4). The results of national surveys indicate this value to be within the range of 13.1–19.1, with an average of 15.7 [13] or 11.5–18.6 [12].
Spike density (the number of spikelets per 10 mm of the spike rachis) is a parameter that considers the number of spikelets in the spike and the length of the spikelet. Its value was in the range of 2.17–2.57 (Table 1), depending on the variety and sowing date. The lowest values were recorded for the Komnata cultivar, and no significant differences were observed between the other cultivars studied. The value of this parameter determined for durum wheat grown locally ranged from 1.89 to 3.45 [12] and from 2.08 to 3.43 [13].
The spike density is highly correlated with the number of spikelets in the ear (r = 0.837 p = 0.00001, Table 3). This is not confirmed in the literature. Studies of 20 lines selected from several combinations of durum wheat crosses but in spring cultivation indicated a negative and statistically insignificant correlation coefficient between spike density and the number of spikelets in the spike. In this study, spike density was significantly and negatively correlated only with the length of the spike rachis [13].
The number of grains per spike (kernels for ear) was in the range of 12.50 (Komnata)–21.23 (Auradur) (Table 1). This feature was only dependent on the origin (variety), while other factors (sowing date and density) did not affect it. This was confirmed in the literature [16]. The values observed in this study are very low, as national studies indicate an average of 24.45 [8] and for common wheat (T. aestivum) of 37.0 (27.0–42.9) [13] or 31.2–32.1 [12]. Similar reports from other countries reported an average above 30 [18] or values within ranges of 43.8–53.5 [15], 29.1–37.9 [17], and 21.6–46.7, with an average of 33.4 [19]. In the case of the authors mentioned above [18], it was not only the varietal factor that had an impact on the number of grains in the ear but also the sowing density, as it was lower. This parameter is also influenced by irrigation and temperature [16]; in extremely adverse conditions, this value could be as low as 2.5, and in the most favorable as high as 32.3. In this study (Table 3), this trait was highly significantly correlated with ear fertility (r = 0.801) and kernel weight per spikelet (r = 0.713) and negatively correlated with single kernel weight (r = −0.785), plumpness (r = −0.773), and kernel dimensions (length: r = −0.850; width: r = −0.546; KDR: r = −0.823). This is again confirmed in the literature [12,13].
The weight of grains per spike (kernel weight) ranged from 0.41 to 0.61 g (Table 1), with the lowest value recorded for the Komnata cultivar, which differed significantly from the other two cultivars. In the literature, one can find higher values of this trait, on average about 1.17 g [8], 1.4 g [12], or 1.79 g (1.29–2.24 g) [13].
Single kernel weight (Table 1) varied quite strongly, ranging from 23.82 mg to 32.87 mg (Table 1). In the case of this trait, varietal differentiation is very clear, and the sowing date also plays a role. The values reported by other authors are higher: 42.7–55.0 [16], 35.0–41.6 mg [15], or 48.2–57.2 mg [17].
A highly significant correlation of this feature was observed with grain plumpness (r = 0.909, p = 0.00000002) and with the length (r = 0.672, p = 0.002) and width (r = 0.605, p = 0.008) of individual kernels (Table 3).
In the literature, the effects of applied research factors on individual yield components, including parameters of durum wheat ears, are highly diversified. However, in some publications, modeling was used to show that yield components are more dependent on agricultural factors than on the physiological state of plants at critical stages of growth and development, which is influenced by weather conditions [8]. Of the two agronomic factors used in our study, only the sowing date proved to be a significant factor for the ear parameters of durum wheat, with the ear biometry being higher at the optimal sowing date and the grain parameters in the ear being better for delayed sowing.

3.2. Physical Properties of Kernels

The thousand kernel weight (TKW) (Table 2) of the tested varieties of durum wheat is an important feature that determines the technological usefulness of the material, as well as its agrotechnical properties. The value of TKW ranged between 31.45 (Auradur) and 43.66 (Pentadur) and depended on both the sowing date and the variety, while the sowing density did not affect this trait. The results of the TKW determination are in a fairly wide range of 37.9–60.5 (average 48.7 g) [13], 20.7–54.5 [12], and 30.8–36.9 [18]. The results of this study indicate a clear effect of cultivars and sowing dates on the TKW value. The effect of sowing density on TKW was reported earlier [18], but the study used up to 400 kernels/m2 and did not confirm the effect of the cultivar. Perhaps in the case of using lower sowing densities, mutual competition between individual plants has less impact on the development of kernels. This feature was quite poorly correlated with the grain weight in the spikelet (r = 0.582) and with the KDR (kernel dimension ratio) (r = −0.491). However, the results of national studies indicate a significant correlation between TKW and spikelet fertility and the number of kernels in the spikelet [12]. The latter correlation is also confirmed by the results of other work [13]. However, no such relationships were observed in this study (Table 3). In addition, the literature provides information about significant correlations of TKW with the spikelet’s fertility and the weight of grains per spike [12,13], since all these traits reflect grain development.
The physical properties of cereal grains are important features in the assessment of suitability for processing, as they determine the milling efficiency and the quality of the flour obtained [20]. Grain size and uniformity play a role in the processes of sieving, dehulling, or grinding and are important distinguishing features in determining the quality of grain [21].
Another important indicator in determining grain quality is its bulk density (test weight). It determines the milling value of grain, as it reflects the degree of development of the kernels, their maturity, or the thickness of the seed coat, which are decisive for technological value. In addition, it can be used to calculate, for example, the amount of warehouse space necessary to store a specific weight of grain. It does, however, depend on many environmental and atmospheric factors, and thus is not always a good indicator of grain quality [20]. The analysis of variance revealed that all factors and their interactions (except for the sowing time × density) had an impact on the value of this parameter. Wheat cultivars were characterized by a volumetric weight within the range of 63.30–70.50 kg/hl (Table 2). Both extreme values were recorded for wheat of the Komnata variety, with the lowest value recorded for kernels from the first sowing date. The standard value of this indicator [10] in the case of wheat should not be lower than 73 kg/hl, which shows that the tested durum wheat grown under atypical conditions did not meet this requirement. According to Budzyński [22], the test weight of durum wheat should be within the range of 76–79 kg/hl. In the tested material, a significantly higher grain bulk density was observed in the case of the second sowing date (Table 2). This allows us to assume that delaying the sowing date beyond the optimum can contribute to an increase in grain quality. In the case of sowing density, the highest test weight (68.27 kg/hl) was found for crops with a sowing density of 400 kernels/m2 and 67.83 kg/hl for 500 kernels/m2, and the lowest, 67.54 kg/hl, was found when it was 600 kernels/m2. With increasing sowing density, the competition for nutrients among plants increases, which reduces the maturity of the grain. This allows us to assume that it will not be advisable to increase the sowing density. Regardless of the sowing density, the highest density in the bulk state was observed for the Pentadur variety.
In all the analyzed cases, grain plumpness was equivalent to grain uniformity (=grain fraction > 2.8 mm + > 2.5 mm). The average plumpness of the tested grain ranged from 67.1 to 89.3% (Table 2). The highest average grain plumpness was recorded in the case of the Komnata variety (86.7%). The average plumpness of the Pentadur and Auradur varieties was 80.0 and 70.3%, respectively. The grain of all the tested cultivars sown at the time specified as delayed (II) was characterized by significantly higher plumpness as compared to the one sown at the optimal date (I). The agrotechnical factor that did not affect the grain plumpness of the tested cultivars was the employed sowing density. The value of this parameter was higher in comparison to earlier reports (93–97%) [23], which can be explained by the worse climatic and soil conditions characteristic of Małopolska. According to the authors cited above, the diversity of the results is mainly due to the varietal factor, but, to a lesser extent, also to other factors such as sowing date or density, which is also partially confirmed by the results of this study.
Taking into account the influence of two factors (sowing date and variety), differences were not observed only in the case of wheat grains of the Pentadur and Komnata varieties harvested on the first date. Only in the case of the Pentadur variety, the plumpness decreased on the second harvest date. In the case of the combination of date * density, no significant changes were observed. In the case of the combination of variety * density, the only factor determining diversity was the variety.
Despite their relatively low volumetric weight, the kernels were characterized by quite large physical dimensions (Table 2). Kernels of the Komnata cultivar were characterized by the largest length (L) and width (W), and these characteristics were the smallest for Auradur.
As reported by Jurga [24], the length of the wheat kernel is within the range of 4.2–8.6 mm, and its width is 1.6–4.0 mm, although larger values can also be found [25]. According to Wiwart et al. [26], the length of kernels of three varieties of common wheat (T. aestivum) was within the range of 5.80–6.06 mm (with an average of 5.94 mm), and their width was 3.23–3.34 mm (average 3.28 mm). Kernel length of the parent forms of Chinese wheat [27] ranged between 5.75 mm and 7.10 mm (for crosses 4.50 and 8.05 mm), and width varied between 2.81 and 3.63 mm (2.40 and 4.90 mm for crosses). For Iranian wheat varieties [28], the length of wheat grains was within the range of 6.55–7.75 mm, and their width was 2.88–3.43 mm. As can be seen, the kernels of the Auradur and Pentadur cultivars were poorly developed, as they were characterized by a kernel length and width similar to the lower range of values reported by Wiwart et al. [26]. However, the geometric sizes of the kernels of the Komnata cultivar were above the range indicated in the cited paper, suggesting that the growing conditions in Małopolska are not conducive to the development of durum wheat.
The performed ANOVA indicates that each of the analyzed factors (variety, date, and sowing density) and their interactions (except variety × * density in the case of width) had an impact on the physical dimensions of the kernels. It should be noted, however, that in the case of the variety–density combination for the Pentadur variety, a significant difference in the width of the kernels was observed between those originating from a sowing density of 600 and the others.
For the KDR (kernel diameter ratio; KDR = L/W), only the variety (and its interactions) turned out to be important.
Highly significant relationships (α = 0.001) were observed between the plumpness of the grain and the physical dimensions of its kernels and between the length and width and the KDR parameter. Relatively insignificant negative correlations (α = 0.05) were observed between volume weight and length and the KDR parameter (Table 3).

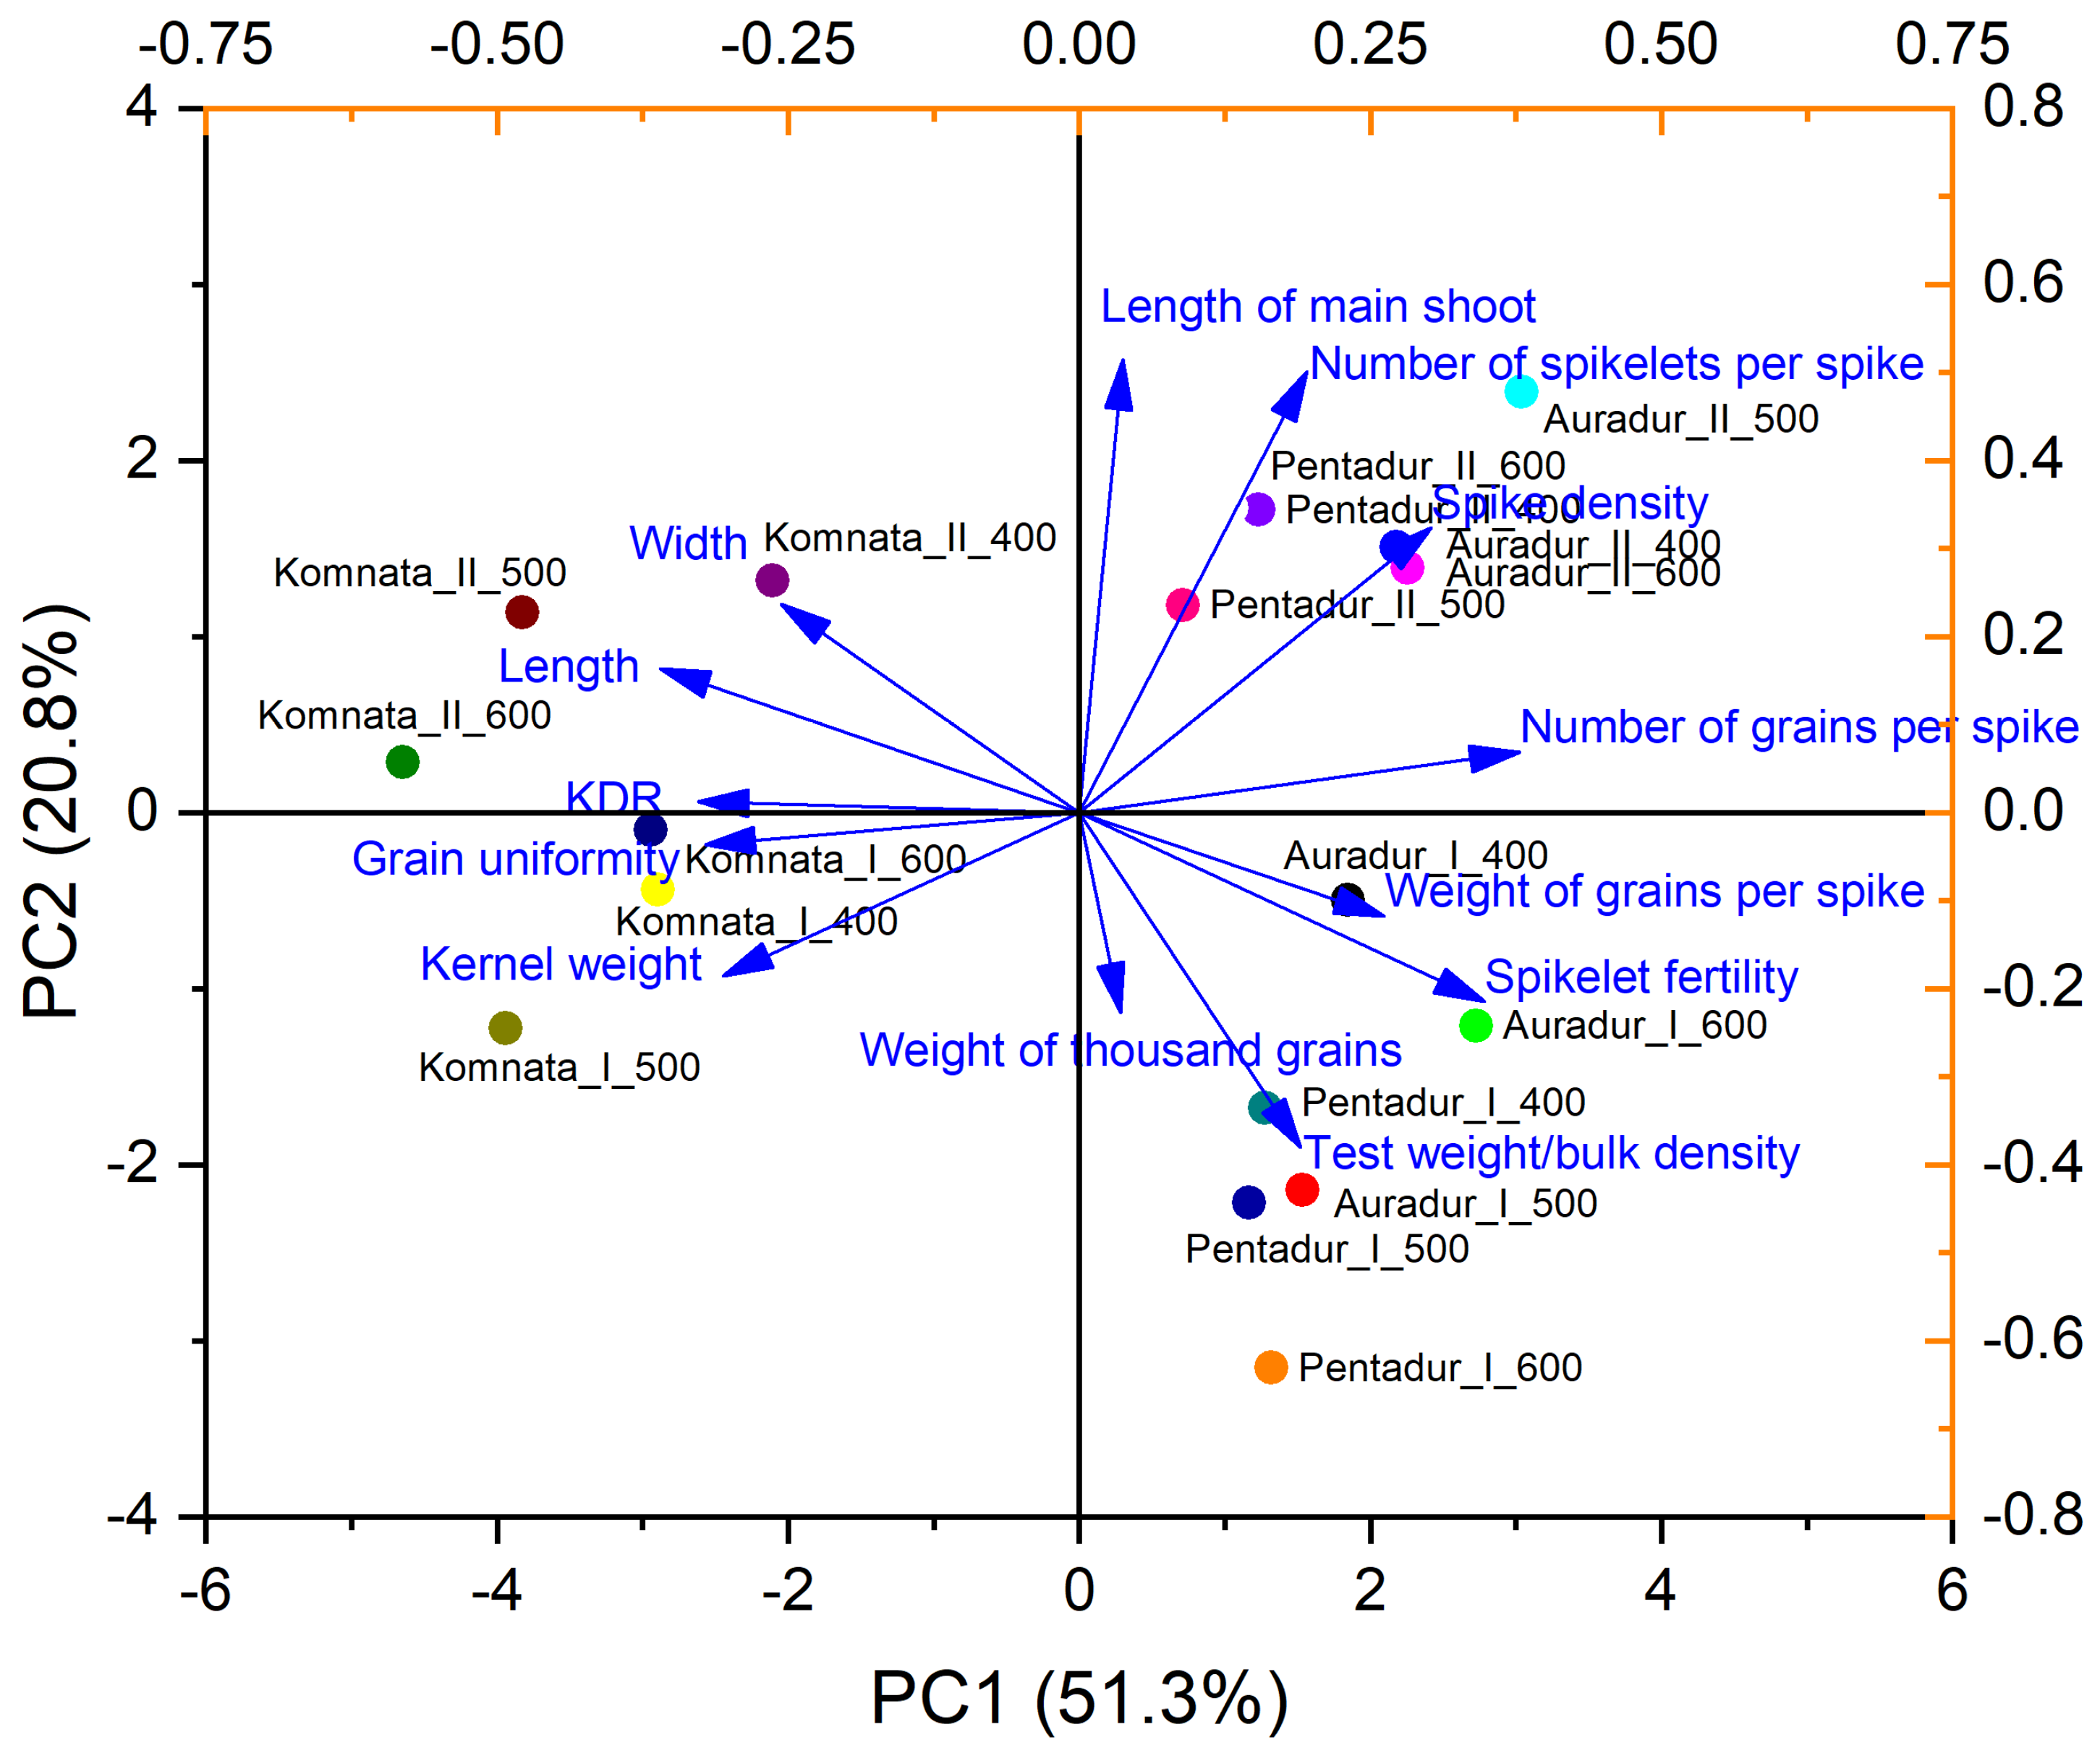
3.3. Exploratory Factor Analysis

Holistic variability in the parameters of durum wheat ears and kernels for the tested experimental factors was examined by the PCA (Figure 2). The first two factors (PC1 and PC2) show high values of initial data variability, i.e., 72.1%. There are differences between the parameters of ears and kernels that were observed in the case of the experimental factors. The parameters of kernels were closest to the Komnata variety in all experimental factors. The sowing density factor had no significance for the grain biometry of the Komnata variety, but the sowing dates grouped the parameters; delayed sowing date correlated with larger grain dimensions, and the optimal sowing date correlated with grain weight in the Komnata variety. The opposite group of analyzed variants consisted of Auradur and Pentadur varieties correlated with the parameters of ears and test weight (bulk density). Detailed results of the PCA showed that the Pentadur variety, earlier sown at the highest density, was a variant unrelated to the others. No high correlation was found between the experimental factors used and the weight of a thousand grains and length of the main shoot. High values of the test weight were associated with the Pentadur variety at the optimum sowing time for lower sowing densities, as well as Auradur at the optimum time for a sowing density of 500 kernels/m2, but there was no correlation with higher single kernel weight and size. For the Auradur and Pentadur varieties, the lack of interaction between the variety factor and sowing density was again found, but the sowing date used affected certain spike parameters. The spike density was interdependent with the delayed sowing date in the Auradur and Pentadur varieties and the bulk density with the optimal sowing date but was strong only in the medium sowing density used.
The presented analysis indicates a strong influence and possible different responses of varieties to the applied sowing date, reflected in the differentiation of the physical parameters of spikes and kernels, and a low dependence of these parameters on the applied sowing density.
The data collected allow us to conclude that, under the conditions in Małopolska, it was not possible to grow durum wheat that met the requirements, as evidenced by insufficient volumetric weight. It can also be stated that the sowing density did not affect individual aspects related to the characteristics of the ear, as well as the weight of a single kernel and the weight of a thousand kernels, as well as plumpness. In addition, it can be noted that among the analyzed varieties, CV Komnata was characterized by worse technological performance (TKW or test weight), while it was characterized by the highest grain uniformity compared to the other two cultivars.

4. Conclusions

There was significant differentiation in the analyzed features of spike biometry, such as the length of the spike rachis, the number of spikelets per spike, and spikelet density, in relation to the sowing date of durum wheat cultivated in the climatic and soil conditions of southeastern Poland (50°06′52″ N; 20°04′23″ E). The delayed sowing date (20 October) resulted in worse spike biometry compared to the optimal one (30 September). However, the physical parameters of the grain, i.e., individual and thousand grain weight, as well as bulk density, were significantly better in the case of the delayed date. Similar results were obtained in the case of the variety factor; Komnata was characterized by worse spike biometry parameters than Auradur and Pentadur but turned out to be the best in terms of grain weight and size. However, from the point of view of technological value, the important parameter—bulk density (test weight)—was significantly lower in Komnata compared to the other varieties used in this study. The factor that had no effect on spike biometry, single kernel weight, and TKW was the employed sowing density (400, 500, and 600 kernels/m2), but the lowest of the employed sowing densities had a significant influence on the improvement in bulk density. The sowing density employed also led to differentiation in grain size parameters. The obtained research results partially indicate that worse physical spike biometry parameters can, to some extent, play a determining role in the better quality of grain yield.

Author Contributions

Conceptualization, W.B., A.G. and A.O.; methodology, W.B., A.G. and A.O.; validation, W.B., A.G. and A.O.; investigation, A.O., A.G. and W.B.; resources, A.G. and A.O.; data curation, W.B. and R.Z.; writing—original draft preparation, W.B. and R.Z.; writing—review and editing, A.G., W.B. and R.Z. All authors have read and agreed to the published version of the manuscript.

Funding

This research received no external funding.

Institutional Review Board Statement

Not applicable.

Data Availability Statement

The data presented in this study are available in the article.

Conflicts of Interest

The authors declare no conflicts of interest.

References

  1. Shiferaw, B.; Smale, M.; Braun, H.-J.; Duveiller, E.; Reynolds, M.; Muricho, G. Crops that feed the world 10. Past successes and future challenges to the role played by wheat in global food security. Food Secur. 2013, 5, 291–317. [Google Scholar] [CrossRef]
  2. Grosse-Heilmann, M.; Cristiano, E.; Deidda, R.; Viola, F. Durum wheat productivity today and tomorrow: A review of influencing factors and climate change effects. Resour. Environ. Sustain. 2024, 17, 100170. [Google Scholar] [CrossRef]
  3. Semenov, M.A.; Stratonovitch, P.; Alghabari, F.; Gooding, M.J. Adapting wheat in Europe for climate change. J. Cereal Sci. 2014, 59, 245–256. [Google Scholar] [CrossRef] [PubMed]
  4. Gaines, C.S.; Finney, P.L.; Andrews, L.C. Influence of Kernel Size and Shriveling on Soft Wheat Milling and Baking Quality. Cereal Chem. 1997, 74, 700–704. [Google Scholar] [CrossRef]
  5. Haddad, Y.; Mabille, F.; Mermet, A.; Abecassis, J.; Benet, J.C. Rheological properties of wheat endosperm with a view on grinding behaviour. Powder Technol. 1999, 105, 89–94. [Google Scholar] [CrossRef]
  6. Garrido-Lestache, E.; López-Bellido, R.J.; López-Bellido, L. Durum wheat quality under Mediterranean conditions as affected by N rate, timing and splitting, N form and S fertilization. Eur. J. Agron. 2005, 23, 265–278. [Google Scholar] [CrossRef]
  7. Mohammadi, R.; Haghparast, R. Durum wheat: Production, nutritional value and economic importance. Cereal Biotechnol. Biochem. 2022, 1, 414–445. [Google Scholar] [CrossRef]
  8. Bożek, K.S.; Żuk-Gołaszewska, K.; Bochenek, A.; Gołaszewski, J.; Kalaji, H.M. Modelling the growth, development and yield of Triticum durum Desf under the changes of climatic conditions in north-eastern Europe. Sci. Rep. 2021, 11, 21753. [Google Scholar] [CrossRef]
  9. Prażak, R. Zmienność i współzależność niektórych cech w mieszańcach Aegilops kotschyi Boiss. × Triticum aestivum L. Cv. Rusałka. Biul. IHAR 2009, 252, 43–59. [Google Scholar] [CrossRef]
  10. ISO 7971-3:2010; Cereals—Determination of Bulk Density, Called Mass per Hectolitre. Part 3: Routine Method. International Organization for Standardization: Geneva, Switzerland, 2010.
  11. Abramoff, M.D.; Magalhães, P.J.; Ram, S.J. Image Processing with ImageJ. Biophotonics Int. 2004, 11, 36–42. [Google Scholar]
  12. Kociuba, W.; Wieremczuk, M. Zbiory kolekcyjne pszenicy twardej w polskim banku genów jako źródło materiałów wyjściowych w pracach hodowlano-badawczych. Ann. Univ. Mariae Curie-Skłodowska Sect. E Agric. 2013, 68, 42–50. [Google Scholar] [CrossRef]
  13. Segit, Z.; Szwed-Urbaś, K. Zróżnicowanie genetyczne cech użytkowych pszenicy twardej. Biul. IHAR 2008, 250, 117–124. [Google Scholar] [CrossRef]
  14. Troccoli, A.; Borrelli, G.M.; De Vita, P.; Fares, C.; Di Fonzo, N. Mini Review: Durum Wheat Quality: A Multidisciplinary Concept. J. Cereal Sci. 2000, 32, 99–113. [Google Scholar] [CrossRef]
  15. Gaju, O.; Reynolds, M.P.; Sparkes, D.L.; Foulkes, M.J. Relationships between Large-Spike Phenotype, Grain Number, and Yield Potential in Spring Wheat. Crop Sci. 2009, 49, 961–973. [Google Scholar] [CrossRef]
  16. García del Moral, L.F.; Rharrabti, Y.; Villegas, D.; Royo, C. Evaluation of Grain Yield and Its Components in Durum Wheat under Mediterranean Conditions. An Ontogenic Approach. Agron. J. 2003, 95, 266–274. [Google Scholar] [CrossRef]
  17. Álvaro, F.; Isidro, J.; Villegas, D.; García del Moral, L.F.; Royo, C. Old and modern durum wheat varieties from Italy and Spain differ in main spike components. Field Crop. Res. 2008, 106, 86–93. [Google Scholar] [CrossRef]
  18. Naseri, R.; Khoshkhabar, H.; Fard, A.S.; Nazaralizadeh, K. Effect of plant density on grain yield, yield components and associated traits of three durum wheat cultivars in Western Iran. Int. J. Agric. Crop Sci. 2012, 4, 79–85. [Google Scholar]
  19. Marza, F.; Bai, G.-H.; Carver, B.F.; Zhou, W.-C. Quantitative trait loci for yield and related traits in the wheat population Ning7840 × Clark. Theor. Appl. Genet. 2006, 112, 688–698. [Google Scholar] [CrossRef]
  20. Kasprzak, M.; Wirkijowska, A. Charakterystyka wybranych wskaźników technologicznych ziarna pszenicy zwyczajnej. Acta Agrophys. 2013, 20, 77–89. [Google Scholar]
  21. Dziki, D.; Grundas, S.; Różyło, R.; Laskowski, J. Ocena właściwości fizycznych ziarna pszenicy przy wykorzystaniu analizatora pojedynczych ziarniaków. Inż. Rol. 2011, 15, 39–46. [Google Scholar]
  22. Budzyński, W. Pszenice—Zwyczajna, Orkisz, Twarda. Uprawa i Zastosowanie; Powszechne Wydawnictwa Rolnicze i Leśne: Warsaw, Poland, 2012. [Google Scholar]
  23. Spychaj, R.; Gil, Z.; Chrzanowska-Drożdż, B. Wartość technologiczna ziarna ozimej pszenicy twardej odmiany Komnata w zależności od sposobu chemicznej ochrony roślin. Biul. Inst. Hod. I Aklim. Roślin 2011, 262, 25–38. [Google Scholar] [CrossRef]
  24. Jurga, R. Przetwórstwo Zbóz. Część I.; WSiP: Warsaw, Poland, 1994. [Google Scholar]
  25. Giura, A.; Saulescu, N.N. Chromosomal location of genes controlling grain size in a large grained selection of wheat (Triticum aestivum L.). Euphytica 1996, 89, 77–80. [Google Scholar] [CrossRef]
  26. Wiwart, M.; Suchowilska, E.; Lajszner, W.; Graban, Ł. Identification of hybrids of spelt and wheat and their parental forms using shape and color descriptors. Comput. Electron. Agric. 2012, 83, 68–76. [Google Scholar] [CrossRef]
  27. Cui, F.; Ding, A.; Li, J.; Zhao, C.; Li, X.; Feng, D.; Wang, X.; Wang, L.; Gao, J.; Wang, H. Wheat kernel dimensions: How do they contribute to kernel weight at an individual QTL level? J. Genet. 2011, 90, 409–425. [Google Scholar] [CrossRef]
  28. Kasraei, M.; Nejadi, J.; Shafiei, S. Relationships between Grain Physicochemical and Mechanical Properties of Some Iranian Wheat Cultivars. J. Agric. Sci. Technol. 2015, 17, 635–647. [Google Scholar]
Figure 1. Weather conditions of the field experiment area in the 2022/2023 growing season and multi-year data (1990–2021) shown in the background.
Agriculture 15 00359 g001
Figure 2. PCA showing the overall relationships between experimental factors used (varieties: Auradur, Komnata, and Pentadur × sowing time; I = optimum and II = delayed × sowing densities; 400, 500, and 600 kernels/m2, marked as 400, 500, and 600) and variables (weight of thousand grains; test weight/bulk density; grain uniformity; length, width, and KDR ratio of kernels; length of main shoot; number of spikelets per spike; spike density; number of grains per spike; spikelet fertility; weight of grains per spike; and kernel weight).
Agriculture 15 00359 g002
Table 1. Selected parameters of durum wheat ears.
Variety 1Sowing TimeSowing DensityLength of Main ShootNumber of Spikelets per SpikeSpike DensityNumber of Grains per SpikeSpikelet FertilityWeight of Grains per SpikeKernel Weight
Kernels/m2[cm][-][-][-][-][g][mg]
AuradurI4004.97 abc13.23 bcde2.46 bcdef19.67 de1.48 cd0.49 a24.35 ab
5005.02 abc13.87 e2.5721.23 e1.50 cd0.50 a23.82 a
6004.88 abc13.30 bcde2.52 ef19.83 de1.46 bcd0.49 a25.10 abc
II4004.55 abc12.40 abcde2.50 def19.10 bcde1.53 cd0.50 a27.54 abcd
5004.48 ab11.57 ab2.35 abcdef18.07 abcde1.51 cd0.50 a27.41 abcd
6004.75 abc12.30 abcde2.38 bcdef21.53 e1.73 d0.61 a28.39 abcd
KomnataI4005.00 abc12.70 abcde2.34 abcdef16.20 abcde1.26 abc0.48 a30.48 bcd
5004.87 abc12.27 abcde2.31 abc13.70 abc1.09 ab0.44 a32.87 d
6004.60 abc11.50 ab2.28 abc12.50 a1.06 a0.41 a32.81 d
II4004.80 abc11.97 abcd2.28 abg14.40 abcd1.19 abc0.47 a32.06 d
5004.67 abc11.10 a2.17 ag13.37 ab1.20 abc0.44 a32.06 d
6004.83 abc11.97 abcd2.28 abg15.2 abcd1.26 abc0.52 a32.73 d
PentadurI4005.08 abc13.87 e2.53 fg19.00 bcde1.36 abcd0.56 a29.92 abcd
5005.18 c13.50 cde2.42 bcdefg18.50 bcde1.35 abcd0.57 a30.13 abcd
6005.15 bc13.70 de2.47 cdefg19.27 cde1.40 abcd0.58 a29.87 abcd
II4004.83 abc12.27 abcde2.34 abcdeg17.97 abcde1.47 bcd0.57 a31.40 cd
5004.52 abc11.87 abc2.40 bcdefg18.17 abcde1.51 cd0.54 a30.55 bcd
6004.42 a11.23 a2.32 abcdg18.67 bcde1.65 d0.57 a30.14 abcd
Auradur 4.78 a12.78 b2.46 b19.91 b1.53 b0.51 ab26.10 a
Komnata 4.79 a11.92 a2.28 a14.23 a1.18 a0.46 a32.17 c
Pentadur 4.86 a12.74 b2.41 b18.59 b1.46 b0.56 b30.34 b
I 4.97 b13.10 b2.43 b17.77 a1.33 a0.50 a28.82 a
II 4.65 a11.85 a2.34 a17.39 a1.45 b0.52 a30.25 b
4004.87 a12.74 a2.41 a17.72 a1.38 a0.51 a29.29 a
5004.79 a12.36 a2.37 a17.17 a1.36 a0.50 a29.47 a
6004.77 a12.33 a2.38 a17.83 a1.43 a0.53 a29.84 a
1 All values in a column within the table section marked with different superscripts are statistically different (α = 0.05) according to the Tukey HSD test.
Table 2. Physical properties of kernels.
Variety 1Sowing TimeSowing DensityWeight of Thousand GrainsTest Weight/Bulk DensityGrain UniformityLengthWidthKDR
Kernels/m2gkg/hl%mmmm-
AuradurI40031.45 a66.90 cd67.3 a5.59 b3.22 b1.752 de
50032.14 a67.36 cd67.1 a5.56 b3.27 b1.721 bcd
60032.21 a67.30 cd67.9 a5.60 b3.22 ab1.755 de
II40032.31 a68.60 defgh71.3 ab5.53 ab3.18 ab1.756 de
50033.01 a70.20 hi73.0 abc5.40 a3.12 a1.743 cde
60033.5 a69.60 fghi75.4 bcd5.52 ab3.21 ab1.733 bcd
KomnataI40033.98 a65.80 bc85.8 fg6.15 d3.40 cd1.825 fg
50034.35 a64.30 ab85.0 fg6.27 def3.43 cde1.841 g
60034.46 a63.30 a84.6 fg6.26 def3.40 cd1.856 g
II40034.90 a70.50 i88.4 g6.30 ef3.54 e1.786 ef
50035.20 a67.70 cde89.3 g6.16 de3.39 cd1.83 fg
60035.51 a68.10 defg87.2 g6.38 f3.54 e1.817 fg
PentadurI40039.76 b67.70 def80.5 def5.77 c3.42 cd1.699 ab
50040.70 b68.10 defg84.3 fg5.73 c3.37 c1.71 bc
60040.80 b67.20 cd83.3 efg5.80 c3.49 de1.673 a
II40042.69 b70.10 hi77.6 cde5.51 ab3.23 b1.713 bc
50042.89 b69.50 efghi77.2 bcde5.53 b3.20 ab1.739 cd
60043.66 b69.90 ghi77.2 bcde5.55 b3.26 b1.71 bc
Auradur 32.67 a68.29 b70.3 a5.55 a3.21 a1.75 b
Komnata 34.50 b66.61 a86.7 c6.23 c3.44 c1.83 c
Pentadur 41.75 c68.74 b80.0 b5.65 b3.33 b1.71 a
I 35.80 a66.42 a78.4 a5.83 b3.37 b1.74 a
II 36.81 b69.34 b79.6 b5.67 a3.27 a1.74 a
40036.09 a68.27 b78.5 a5.78 b3.32 b1.75 b
50036.27 a67.83 ab79.3 a5.72 a3.29 a1.75 b
60036.56 a67.54 a79.3 a5.78 b3.36 c1.73 a
1 All values in a column within the table section marked with different superscripts are statistically different (α = 0.05) according to Tukey HSD test; KDR—kernel dimension ratio (KDR = L/W).
Table 3. Correlation matrix.
Length of Main Shoot 1Number of Spikelets per SpikeSpike DensityNumber of Grains per SpikeSpikelet FertilityWeight of Grains per SpikeKernel WeightTKWTest
Weight
Grain
Uniformity
LengthWidth
Number of spikelets per spike0.852 ***1.000
Spike
density
0.4280.837 ***1.000
Number of grains per spike0.2170.588 *0.801 ***1.000
Spikelet fertility−0.2140.1410.482 *0.881 ***1.000
Weight of grains per spike0.1970.3210.3670.713 ***0.725 ***1.000
Kernel weight−0.152−0.531 *−0.760 ***−0.785 ***−0.617 **−0.1481.000
TKW−0.014−0.068−0.0960.0460.1510.582 *0.4411.000
Test weight−0.307−0.1840.0130.4200.642 **0.594 **−0.1330.3351.000
Grain
uniformity
0.108−0.347−0.716 ***−0.773 ***−0.714 ***−0.1990.909 ***0.296−0.1981.000
Length0.168−0.235−0.590 **−0.850 ***−0.900 ***−0.605 **0.672 **−0.191−0.534 *0.793 ***1.000
Width0.4510.092−0.316−0.546 **−0.694 **−0.1790.605 **0.162−0.3620.804 ***0.816 ***1.000
KDR−0.247−0.520 *−0.645 **−0.823 ***−0.728 ***−0.836 ***0.455−0.491 *−0.560 *0.4650.770 ***0.294
1 Correlation valid for α: * = 0.05; ** = 0.01; *** = 0.001.
Disclaimer/Publisher’s Note: The statements, opinions and data contained in all publications are solely those of the individual author(s) and contributor(s) and not of MDPI and/or the editor(s). MDPI and/or the editor(s) disclaim responsibility for any injury to people or property resulting from any ideas, methods, instructions or products referred to in the content.

