Abstract
Rice yield and quality decline due to excessive fertiliser use is problematic in China. To increase rice grain filling and improve rice yield and quality, a nitrogen reduction and density increase study in 2023 and 2024 was imposed on a long-term experimental field. The four treatments adopted for the study were normal nitrogen and normal density (CK), normal nitrogen and increased density (NN+ID), reduced nitrogen in panicle fertiliser and increased density (RPN+ID), and reduced nitrogen in basal fertiliser and increased density (RBN+ID). RPN+ID and RBN+ID, respectively, produced a 3.0% and 5.1% higher yield than CK in both years. The mean grain filling rate (Va) of superior grains in RBN+ID increased by 12.5%, while the mean grain filling rate (Va) of inferior grains in the RPN+ID treatment increased by 4.2% with respect to CK. RPN+ID caused 0.4%, 9.6%, and 13.3% decline in the brown rice rate, chalkiness degree, and chalkiness rate, respectively, while RBN+ID triggered 0.4%, 7.2%, and 11.0% decline in the brown rice rate, chalkiness degree, and chalkiness rate, respectively. RPN+ID stimulated 4.2% and 3.1% increases in flavour and straight-chain amylose values, respectively. Whereas a 20% reduction in basal nitrogen fertiliser and a 32% increase in density improved the yield and appearance quality of rice, a 20% reduction in nitrogen fertiliser at the panicle stage and a 32% increase in density promoted a higher steaming flavour quality. Therefore, an appropriate reduction in nitrogen fertiliser while simultaneously increasing rice density has a significant impact on rice quality, fertiliser pollution reduction, and is a theoretical basis for rice yield and quality improvement in Northeast China.
1. Introduction
Rice (Oryza sativa L.) is a significant staple globally and a major food crop in China [1]. Although China’s per capita area of arable land is low, its northeastern region, which is the main rice-producing area, plays an important role in ensuring food security [2,3]. In recent years, the optimisation of cultivation measures and varietal improvement have contributed significantly to guaranteeing food security [4]. Fertiliser inputs such as nitrogen (N) are important elements in the growth process of rice and, at their recommended application rates, stimulate rice yield increases. However, yield maximisation has resulted in the over-application of fertiliser [5]. The resulting effects are a loss of fertiliser and pollution of the environment. Therefore, the adoption of recommended planting densities is key in minimising fertiliser loss and environmental pollution. Studies suggest the option of thinning in order to reduce up-front costs [6]. A combinatory approach of N reduction and an increased planting density offers pollution reduction while increasing the uptake of N by plants. This strategy is being adopted as a sustainable practice and option over high N input and low-density cultivation [7].
With the assurance of a higher yield in recent times, rice quality is receiving more attention due to the changing preferences of consumers [8]. Though the determination of rice quality varies from country to country, the following four main aspects are widely used [9]: processing quality, appearance quality, cooking flavour quality, and nutritional quality [10]. While processing quality is mainly analysed by the three parameters of brown rice rate, milled rice rate, and head milled rice rate, appearance quality is mainly composed of chalkiness degree and chalkiness rate [11]. Though a lower chalkiness degree and chalkiness rate increase rice grain value, cooking flavour quality is the most widely accepted quality characteristic of rice. This consists of farina content and flavour value, while protein and other chemistry contents constitute nutritional quality.
Studies on the effect of N fertiliser and density on rice yield and quality have previously been reported. Gong et al. [12] noted yield increases and ensuing declines with increasing N application. Experiential studies by Huang et al. [8] reported rice yield increases with appropriate density planting. Xie et al. [13] found significant differences in the effects of N application and planting density interactions on yield and yield components. High N fertiliser application studies have reported an increased protein content, pasting temperature, enthalpy of pasting, and decline in the cooking taste quality of rice [14]. Similarly, increased brown rice, refined rice, and head rice rates, degree of chalkiness, and chalkiness rate have been attributed to increased N fertiliser application [15]. He et al. [16], therefore, suggested that an appropriate N fertiliser rate can not only increase yield, but also impact rice quality. Zhou et al. [17] recognised that an increased planting density triggered processing and appearance quality declines while amplifying the chalkiness rate and chalkiness degree.
For yield and quality assurance in rice production, the grain filling stage is of importance. At this stage, light and matter in the stem are converted to the seed (sink) through the leaf (source), while amylum is synthesised in the grain [18]. Grains with good grain filling and a high grain weight in the upper part of the spike are called superior grains, while those with poor grain filling and a low grain weight in the lower part of the spike are called inferior grains [19]. Studies show that the process of filling directly affects the grain weight of rice kernels and, thus, the yield [20]. Jiang et al. [21] found that an appropriate level of N application could lead to a more appropriate filling rate for weak grains and, thus, increase the yield of rice. Xiong et al. [18] noted that increasing N fertiliser increased the grain filling rate and protein content, though high N conditions were not conducive to farina synthesis in the grain. Bian et al. [22] reported that seed filling fullness was inversely related to chalkiness degree and chalkiness rate, while Dou et al. [23] found that an increase in N fertiliser did not have a significant effect on seed filling rate. Li et al. [24] asserted that the cooking and appearance qualities of superior grains were stronger than those of inferior grains.
There have been many studies on the effects of different rice varieties on yield and traits such as the gel consistency, appearance quality, and pasting temperature of rice [25,26]. Therefore, optimising cultivation measures is an important step in rice quality determination. The impacts of N reduction strategies and an increased density on rice yield have widely been reported, with few studies investigating their effects on rice quality in Northeast China [27]. This study explored the effects of different periods of reduced N fertiliser application and an increased density on yield, grain filling, and rice quality. This was aimed at determining the relationship between different N fertiliser reduction periods and an increased planting density established in a long-term field experiment, while providing a theoretical basis for improving rice yield and rice quality in Northeast China.
2. Materials and Methods
2.1. Experimental Site and Design
The study was set up in 2023 and 2024 as a long-term field experiment under full straw return, N reduction, and an increased density in Northeast China. The experimental site is located at the paddy field of the experimental base of the Heilongjiang Academy of Agricultural Sciences, Minzhu Township, Daowai District, Harbin, Heilongjiang Province, China (45°49′ N, 126°48′ E, 117 m above sea level). The experimental location is dominated by a northern temperate climatic condition with a mean annual precipitation of 508–583 mm, annual sunshine time of 2668 h, and frostless period of 131–146 days. The soil type of the experimental site is chernozem, with its physico-chemical properties characterised as 1.0 g kg−1 total nitrogen, 0.6 g kg−1 total phosphorus, 20.4 g kg−1 total potassium, 96.4 mg kg−1 alkali-hydrolysable nitrogen, 24.5 mg kg−1 available phosphorus, 142.9 mg kg−1 available potassium, 27.4 g kg−1 soil organic matter, and a pH of 8.1. The experimental setup was a randomised block design with 3 replicates and plot sizes of 48 m2. Rice straw from the previous rice growing season was harvested, chopped, and returned to the field. Four treatments, namely normal nitrogen and normal density (CK), normal nitrogen and increased density (NN+ID), reduced nitrogen at the panicle stage and increased density (RPN+ID), and reduced nitrogen in basal fertiliser and increased density (RBN+ID), were set up. The N fertilisers used were urea and diammonium phosphate. The N application rates at different growth stages and planting densities are shown in Table 1.

Table 1.
Experimental design and treatments.
The fields were managed using plough tillage at a depth of (18–20 cm depth) in the first year and rotary tillage (10–15 cm depth) in the second year, with subsequent shallow soaking of the straw in spring with no power churning and burying straw to the ground level. All the treatments received a one-time application of 70 kg P2O5 ha−1 and 60 kg K2O ha−1 as a basal fertiliser. All the plots were exposed to the same water management regime of shallow water (1–3 cm) in the early stage, then drainage in the middle stage, and alternate wet and dry conditions in the late stage. In both years of the experiment, local japonica rice (Longdao 21, a rice variety developed from a cross between Dongnong 423 and Songjing 6) seedlings were transplanted on 19 May, with 4–6 plants per hole. Routine phytosanitary measures were implemented to control weeds, leaf miners, sheath blight, and rice blast diseases.
2.2. Measurements and Methods
2.2.1. Filling Dynamics
For the sampling method, 50 spikes per plot of tasselling and flowering rice plants with a good growth at the tasselling stage were selected and tagged on the same day as in Zhu et al. [28]. Subsequently, every 5 days, samples were collected until reaching full rice maturity. The samples were further divided into superior grains (the top of the upper three branches of the primary peduncle and its inverted 1–2 grains and the top of the secondary peduncle grains) and inferior grains (the lower three branches of the top of the primary peduncle’s 3–4 grains and the base of the secondary peduncle’s inverted 2–3 grains, excluding the top of the grains) and oven dried at 105 °C for 30 min to kill the green grain. Subsequently, the oven temperature was adjusted to 80 °C for the grains to dry to a normal weight, and they were then weighed.
Regarding the growth model and parameter significance, rice grain filling was simulated using Curve Expert 1.3 software and the Richards equation, with the variation in seed weight (W) according to days after flowering (t) being expressed according to the Richards Equation (1). The Richards equation was used to simulate the temporal variation in grain weight in the rice during grain filling.
where a is the ultimate growth, b is the parameter of the initial value of filling, c is the parameter of the filling rate, and d is the parameter of the shape of the filling curve. Equation (1) is the Logistics equation when d = 1. When d > 1, the initial value of growth and development is large, and seed weight gain increases smoothly in the first and middle periods; when d < 1, the initial value of growth and development is small, growth is slow in the early period, and then compensates for exceeding it after the first and middle periods. These characteristics can be illustrated by Equations (2) and (3).
Filling rate GR is solved by Equation (3), as follows:
when t = 0, the starting filling rate GR0 and the initial relative filling rate, i.e., the starting potential, can be calculated as follows:
GR = W × c × d [1 − (W/a)d]
RGR0 = GR0/W0
Taking the second-order derivative of the Richards equation gives the rate of change of the filling rate GR0 = 0.
At this time, the peak of the filling rate, but also the inflection points of the filling material accumulation curve, the filling rate and fast to slow down the turning point, and the time (days after flowering tpoi), can be expressed as follows:
2.2.2. Yield and Yield Components
At maturity, 5 representative rice plants were taken from each replicate and air-dried to assess the number of effective spikes, the fruiting rate, and 1000-grain weight. A 1 m2 of each replicate plot was harvested for yield measurements while the grain yield moisture content was adjusted to 14.5%.
2.2.3. Rice Processing Quality and Appearance Quality
The brown rice rate was determined by an Otake experimental rice huller FC2R/FC2K (Yamamoto Corporation, Otake, Japan), the milling rice rate was determined using a VP-32-Japan (Yamamoto Corporation, Otake, Japan) experimental rice milling machine, while the head refined rice rate, chalkiness degree, and chalkiness rate were assessed by a Wanshen SC-E (Wan Sen Corporation, Hangzhou, China) Rice Appearance Quality Tester.
2.2.4. Steam Cooking Flavour Quality and Nutritional Quality
The straight-chain starch content, flavour value, and protein content of the samples were determined using a SATAKE rice taste meter manufactured by Satake Corporation, Hiroshima, Japan.
2.3. Data Analysis
The experimental data were processed using Excel 2020, correlation heatmaps were plotted using Origin 2024, and data variability was tested for significant differences using SPSS 27 LSD (p < 0.05).
3. Results
3.1. Effect of Nitrogen Reduction and Density Increase on Grain Filling Dynamics
3.1.1. N Reduction and Density Increase on Grain Weight Change at Grain Filling Stage
The dynamics of grain filling of both superior and inferior grains under N reduction and density increase are shown in Figure 1, Figure 2, Figure 3 and Figure 4. In both years, the superior grains were in the rapid filling stage from 5 to 20 days. After 20 days, the grain filling declined gradually until it attained stability, whereas inferior grains exhibited a slow increase. In 2023, the superior grains of the CK, NN+ID, RPN+ID, and RBN+ID treatments peaked at thirty-five days after flowering, while in 2024, the superior grains of all treatments peaked at the thirtieth day after flowering. The inferior grains of the CK treatment showed the fastest growth during the two-year study period.
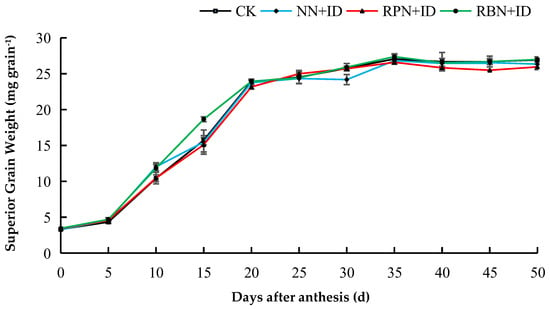
Figure 1.
Effect of N reduction and density increase on changes in superior grain weight in 2023. Data are averages of replicates of the same treatment, and the vertical bars represent the standard error. CK: normal nitrogen and normal density, NN+ID: normal nitrogen and increased density, RPN+ID: reduced nitrogen in panicle fertiliser and increased density, and RBN+ID: reduced nitrogen in basal fertiliser and increased density.
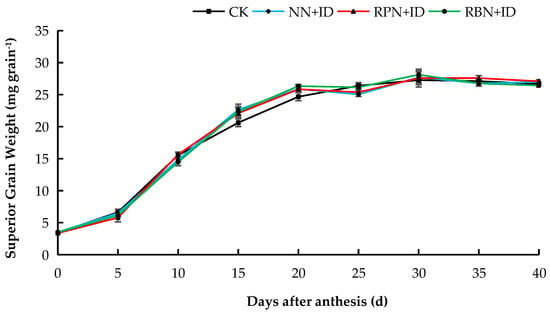
Figure 2.
Effect of N reduction and density increase on changes in superior grain weight in 2024. Data are averages of replicates of the same treatment, and the vertical bars represent the standard error. CK: normal nitrogen and normal density, NN+ID: normal nitrogen and increased density, RPN+ID: reduced nitrogen in panicle fertiliser and increased density, and RBN+ID: reduced nitrogen in basal fertiliser and increased density.
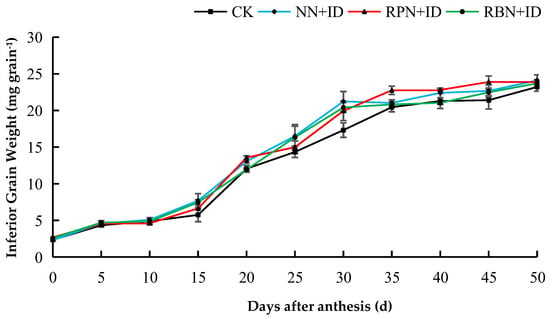
Figure 3.
Effect of N reduction and density increase on changes in inferior grain weight in 2023. Data are averages of replicates of the same treatment, and the vertical bars represent the standard error. CK: normal nitrogen and normal density, NN+ID: normal nitrogen and increased density, RPN+ID: reduced nitrogen in panicle fertiliser and increased density, and RBN+ID: reduced nitrogen in basal fertiliser and increased density.
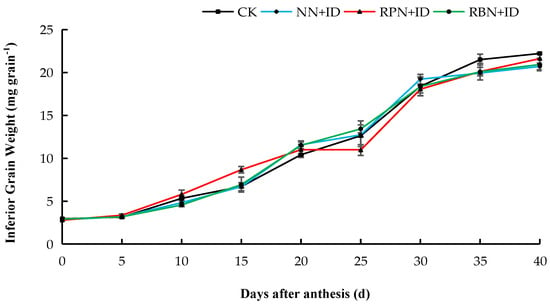
Figure 4.
Effect of N reduction and density increase on changes in inferior grain weight in 2024. Data are averages of replicates of the same treatment, and the vertical bars represent the standard error. CK: normal nitrogen and normal density, NN+ID: normal nitrogen and increased density, RPN+ID: reduced nitrogen in panicle fertiliser and increased density, and RBN+ID: reduced nitrogen in basal fertiliser and increased density.
3.1.2. Effect of N Reduction and Density Increase on Grain Filling Rate of Superior and Inferior Grains
The grain filling rate of superior grains in all treatments in both years were faster from day 5 to day 20 after flowering, while the rate gradually decreased from the 20th day onwards. The inferior grain filling rate of 2023 was fastest on the 5th day. However, after day 5, it began to decline and remained stable. In both years, the grain filling rate ranged from 0.4 to 0.8 mg d−1 (Figure 5, Figure 6, Figure 7 and Figure 8).
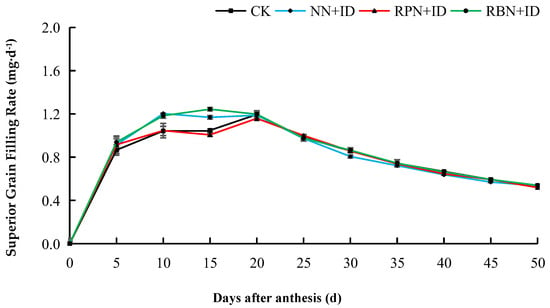
Figure 5.
Effect of N reduction and density increase on filling rate of superior grains in 2023. Data are averages of replicates of the same treatment, and the vertical bars represent the standard error. CK: normal nitrogen and normal density, NN+ID: normal nitrogen and increased density, RPN+ID: reduced nitrogen in panicle fertiliser and increased density, and RBN+ID: reduced nitrogen in basal fertiliser and increased density.
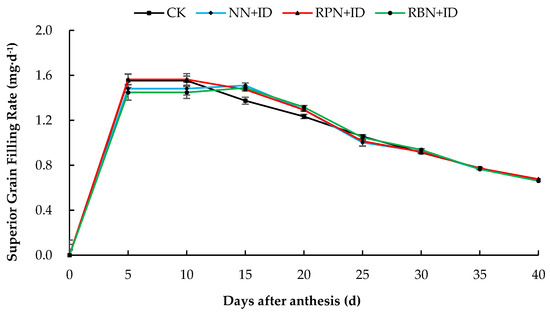
Figure 6.
Effect of nitrogen reduction and density increase on filling rate of superior grains in 2024. Data are averages of replicates of the same treatment, and the vertical bars represent the standard error. CK: normal nitrogen and normal density, NN+ID: normal nitrogen and increased density, RPN+ID: reduced nitrogen in panicle fertiliser and increased density, and RBN+ID: reduced nitrogen in basal fertiliser and increased density.
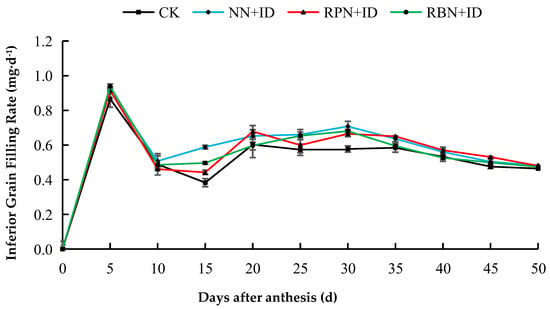
Figure 7.
Effect of N reduction and density increase on filling rate of inferior grains in 2023. Data are averages of replicates of the same treatment, and the vertical bars represent the standard error. CK: normal nitrogen and normal density, NN+ID: normal nitrogen and increased density, RPN+ID: reduced nitrogen in panicle fertiliser and increased density, and RBN+ID: reduced nitrogen in basal fertiliser and increased density.
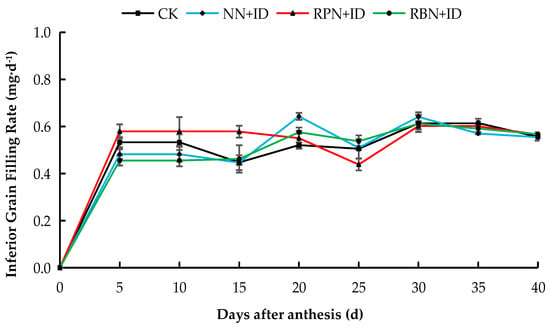
Figure 8.
Effect of N reduction and density increase on filling rate of inferior grains in 2024. Data are averages of replicates of the same treatment, and the vertical bars represent the standard error. CK: normal nitrogen and normal density, NN+ID: normal nitrogen and increased density, RPN+ID: reduced nitrogen in panicle fertiliser and increased density, and RBN+ID: reduced nitrogen in basal fertiliser and increased density.
3.1.3. Effect of N Reduction and Density Increase on Coefficients of Richards Equation for Superior and Inferior Grains
The dynamics of post-flowering irrigation at different locations were fitted with the Richards equation to obtain the coefficients of determination. The coefficients of fit r2 for all treatments under the N reduction and density increase treatments were all above 0.97 (Table 2). The final grain weight (a) of each grain position in each treatment in comparison with the Richards equation fitted with the different N densities and the CK showed average decreases in superior grains of 1.5%, 1.1%, and 0.6%, in the NN+ID, RPN+ID, and RBN+ID treatments, respectively, compared to CK. The average increases in inferior grains in the RPN+ID and RBN+ID treatments compared to CK were 0.6% and 2.9%, respectively, while the inferior grains in the NN+ID treatment decreased by 1.6%. Each treatment showed no significant difference (p < 0.05) in the thousand-grain weight of superior grains in 2023, while the thousand-grain weight of superior grains in the NN+ID and RPN+ID treatments was significantly higher (p < 0.05) than that in the RBN+ID treatment in 2024. The thousand grain-weights of inferior grains in each treatment in both years were not significantly different.

Table 2.
Estimation of Richards coefficient for N reduction and density increase effects on grain filling.
3.1.4. Effect of N Reduction and Density Increase on Characteristic Parameters of the Filling of Superior and Inferior Grains
Table 3 shows the characteristic parameters fitted by the Richards equation for the grain filling processes among treatments. With the exception of CK, the GR0, GR0/W0, GRm, and T99 of superior grains in all treatments decreased in both years, while Tpoi, Wpoi, and Va increased. The initiation potential of inferior grains in all treatments was higher, while the maximum filling rate was lower, except that of CK. The GR0/W0 and T99 values of RPN+ID were lower, whereas the Tpoi, Wpoi, and Va values of RPN+ID were higher relative to CK.

Table 3.
Effect of N reduction and density increase on rice grain filling characteristics.
3.2. Effect of N Reduction and Density Increase on Rice Yield and Yield Components
Table 4 shows that the NN+ID, RPN+ID, and RBN+ID treatments recorded average yield increases of 2.8%, 3.0%, and 5.1%, respectively, over CK in both years. RBN+ID exhibited the highest and a significantly higher grain yield than CK and NN+ID in 2023, whereas RPN+ID was significantly higher (p < 0.05) than the other treatments in 2024. Relative to CK in 2023, the effective number of spikes increased significantly (p < 0.05) in the NN+ID, RPN+ID, and RBN+ID treatments by 7.9%, 4.1%, and 8.3%, respectively. The number of grains per spike and fruiting percentage among treatments showed no significant effect between the two years. The thousand-grain weight of RPN+ID and RBN+ID appreciated by averages of 0.2% and 0.4%, respectively, relative to CK in both years. The thousand-grain weight of the NN+ID treatment in 2023 decreased by 1.3% and was significantly higher in CK, RPN+ID, and RBN+ID.

Table 4.
Effect of N reduction and density increase on yield and yield components.
3.3. Effect of N Reduction and Density Increase on Rice Quality
3.3.1. Processing Quality
Figure 9, Figure 10 and Figure 11 show the effect of N reduction and density increase on processing quality. RPN+ID and RBN+ID recorded average decreases of 0.4% and 0.4%, respectively, in brown rice rate, while NN+ID produced an average increase of 0.2% over CK. All treatments exhibited similar trends in brown rice rate for both years. There was no significant difference in brown rice rate among the treatments in 2023. However, the brown rice rates of CK and NN+ID were significantly higher than those of PN+ID and RBN+ID in 2024. The milling rice rate showed no significant difference (p < 0.05) between RPN+ID and RBN+ID in both years. However, it appreciated by 0.3% over CK. Analysis of the head milling rice rate in 2023, though not significant, showed that CK was 1.7%, 7.8%, and 4.0% higher than that of NN+ID, RPN+ID, and RBN+ID, respectively. In 2024, the head milling rice rates of RPN+ID and RBN+ID were significantly higher (p < 0.05) than that of NN+ID by 2.8%.
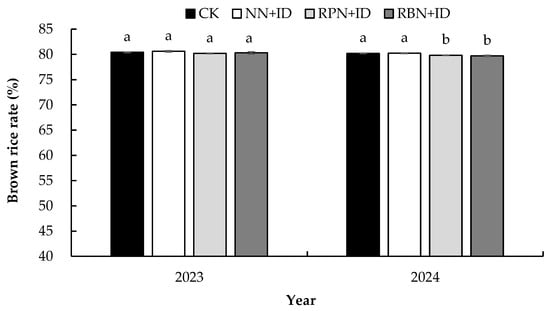
Figure 9.
Effect of nitrogen reduction and density increase on brown rice rate. Data are averages of replicates of the same treatment, and the vertical bars represent the standard error (p < 0.05). Different lowercase letters in the columns indicate significant differences between treatments (p < 0.05). CK: normal nitrogen and normal density, NN+ID: normal nitrogen and increased density, RPN+ID: reduced nitrogen in panicle fertiliser and increased density, and RBN+ID: reduced nitrogen in basal fertiliser and increased density.
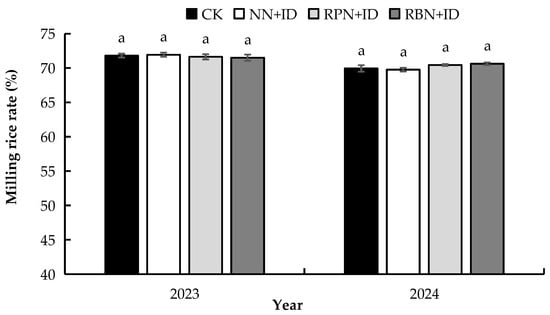
Figure 10.
Effect of N reduction and density increase on milling rice rate. Data are averages of replicates of the same treatment, and the vertical bars represent the standard error (p < 0.05). Different lowercase letters in the columns indicate significant differences between treatments (p < 0.05). CK: normal nitrogen and normal density, NN+ID: normal nitrogen and increased density, RPN+ID: reduced nitrogen in panicle fertiliser and increased density, and RBN+ID: reduced nitrogen in basal fertiliser and increased density.
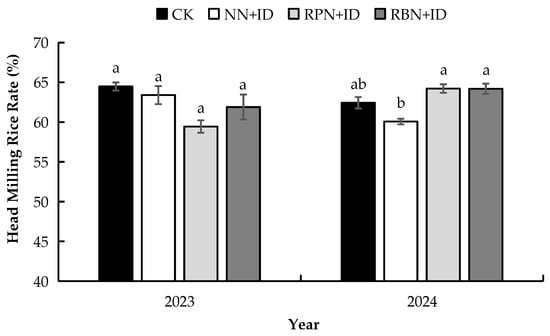
Figure 11.
Effect of N reduction and density increase on head milling rice rate. Data are averages of replicates of the same treatment, and the vertical bars represent the standard error (p < 0.05). Different lowercase letters in the columns indicate significant differences between treatments (p < 0.05). CK: normal nitrogen and normal density, NN+ID: normal nitrogen and increased density, RPN+ID: reduced nitrogen in panicle fertiliser and increased density, and RBN+ID: reduced nitrogen in basal fertiliser and increased density.
3.3.2. Appearance Quality
In comparison with CK, the degree of chalkiness in the RPN+ID and RBN+ID treatments recorded average reductions of 6.7% and 2.2%, respectively, for both years (Table 5). In 2023, the NN+ID treatment had the highest degree of chalkiness and was significantly higher than CK and RPN+ID by 43.4% and 39.7%, respectively. CK in 2024, though not significantly different (p < 0.05), recorded 6.7% and 2.2% higher degrees of chalkiness compared to RPN+ID and RBN+ID, respectively. There was no significant difference (p < 0.05) in the chalkiness rate among the treatments for both years, though the chalkiness rates of the RPN+ID and RBN+ID treatments were 5.2% and 1.8% lower than that of CK. The chalkiness rates of RPN+ID and RBN+ID in 2023 were 2.2% and 32.2%, respectively, higher than CK, whereas the RPN+ID and RBN+ID treatments were 12.6% and 35.9% lower than CK in 2024.

Table 5.
Effect of N reduction and density increase on appearance quality.
3.3.3. Cooking Flavour and Nutritional Quality
The cooking flavour was the highest and significantly higher (p < 0.05) in RPN+ID than the other treatments in both years (Table 6). Relative to CK, the average increases in flavour for RPN+ID and RBN+ID were 4.2% and 0.4%, respectively. On average, the straight-chain amylose content of RPN+ID and RBN+ID increased by 3.1% and 0.2%, respectively, compared to CK. The RPN+ID treatment had the highest and a significantly higher (p < 0.05) straight-chain amylose content than the other treatments in 2023. However no significant variations among the treatments were noted in terms of straight-chain amylose in 2024. In contrast to CK, the protein content in RPN+ID and RBN+ID recorded average increases of 3.2% and 0.2%, respectively. The protein contents of the CK, NN+ID, and RBN+ID treatments were significantly higher (p < 0.05) than that of the RPN+ID treatment in 2023, while the protein content of the NN+ID treatment was significantly higher (p < 0.05) than that of RPN+ID and RBN+ID in 2024.

Table 6.
Effect of N reduction and density increase on cooking flavour and nutritional quality.
3.3.4. Correlation Analysis of Rice Quality
Figure 12 shows the correlation analysis of the rice quality of each treatment. The flavour value was highly significant and positively correlated with straight-chain amylose (p < 0.01). The protein content was highly significant and negatively correlated with both the flavour value and straight-chain amylose content (p < 0.01). While the appearance quality of rice was negatively correlated (p < 0.05) with cooking flavour quality, it was negatively correlated with the chalkiness degree and straight-chain amylose (p < 0.05). The appearance quality, chalkiness degree, and chalkiness rate were highly significant and positively correlated (p < 0.01). In terms of processing quality, the brown rice rate showed a highly significant negative correlation (p < 0.01) with cooking flavour, while it exhibited a significant positive correlation (p < 0.01) with the protein content and chalkiness degree. The brown rice rate showed a highly significant positive correlation (p < 0.05) with the chalkiness rate.
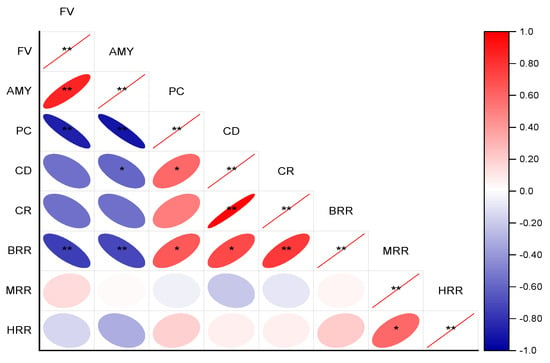
Figure 12.
Heat map for correlation analysis * and ** represent statistical significance at p < 0.05 and p < 0.01. FV: flavour values, AMY: straight-chain amylose, PC: protein content, CD: chalkiness degree, CR: chalkiness rate, BRR: brown rice rate, MRR: milling rice rate, HRR: head milling rice rate.
4. Discussion
4.1. Effect of N Reduction and Density Increase on Grain Filling and Rice Yield
A strategic pattern of N reduction and density increase during rice cultivation can minimise N fertiliser wastage and environmental pollution, though it may impact the N pool in the soil [29]. Similarly, attaining yields comparable to or higher than normal cultivation patterns is plausible through appropriate N fertiliser reduction and increased planting density strategies. Planting density can compensate for the effects of reduced tillering brought about by the reduction in N fertiliser, improve spike formation, and ensure the production of an effective number spikes and seed filling [30]. Similar to the findings of Zhu et al. [31], our study observed a 5.1% average increase in the rice yield of RBN+ID in both years, attributable to an increased effective panicle number [32]. In our study, while no significant changes were observed in the number of grains per spike, setting percentage, and 1000-grain weight, the effective panicle number of the RBN+ID treatment was increased by an average of 8.3% in both years compared to CK and was significantly higher than CK in 2023. This is an indication that reduced basal fertilisers, over time, may plausibly positively impact rice growth parameters in the long run. Under rhe N reduction and density increase treatments, the Wpoi of superior grains was 7.4% and was 2.5% higher in RPN+ID and RBN+ID, respectively, while Va was 12.4% and 12.5% higher in RPN+ID and RBN+ID, respectively. An increase in Va values aids in the reduction in rice grain chalkiness and improves quality characteristics.
The gradual release of N fertiliser over a longer period of time is of importance in promoting effective tillering during rice growth. Zheng et al. [33] explained that appropriate fertiliser application at the panicle stage may promote non-structural carbohydrate transport in the stem sheath and amylose synthesis in the grain. Our data showed that RPN+ID recorded the highest Va of inferior grains (9.4%) after reducing N fertiliser at the panicle stage, while the yield was 2.9% higher than the average of CK. We deduced that the reduction in N fertiliser in the later stage of rice growth accelerated the filling rate of inferior grains and shortened the time of filling. This obviously had an impact on promoting rice yield. This present study recorded a 2.9% higher yield in NN+ID for both years, possibly due to the continuous rainfall and low temperature during the early stage of rice growth at the experimental location.
4.2. Effects of N Reduction and Density Increase on Grain Filling and Rice Quality
The rice milling rate was 2.6% and 0.6% lower in RPN+ID and RBN+ID, respectively, than CK, consistent with the findings of Zhang et al. [34], who reported rice processing quality impacts due to increased N fertilisation. However, contrary studies have found that increased N fertiliser application has no significant impact on brown rice rate and milling rice rate, though it does decrease head milling rice rate [22]. The results from our study established that the head milling rice rate decreased by 2.7% in NN+ID compared to CK, similar to the results of Zhou et al. [17]. This arose owing to the high transplanting densities, resulting in a more closed canopy in the field, affecting rice filling, which led to a lower maturity and lower processing quality [35]. A 2.0% decline in the head milling rice rate of RPN+ID compared to RBN+ID might have been related to the decrease in the protein content of RPN+ID. Studies have shown that an increased protein content in the endosperm improves the hardness of grains, thereby reducing grain breakage and increasing the head milling rice rate [36]. It is generally accepted that a longer grain filling time results in fuller grains and improves processing quality, thus establishing a link with the rate of filling [37]. In this experiment, our results showed that the average grain filling rate of inferior grains was negatively correlated with the head milling rice rate. On the contrary, a study by Xi et al. [38] on the indica rice variety OM052 observed that the higher the average filling rate, the better the processing quality, possibly due to varietal type. The effect and mechanism of grain filling on the processing quality of rice need to be further investigated. This study noted that the relative initiation potential of superior grains was negatively correlated with the head milling rice rate, while the average grain filling rate of superior grains was positively correlated with the milling rice rate. The roles of weather conditions, rice varietal differences, and management practices may be contributing factors to these observations.
Chalkiness, an unfavourable factor for appearance quality, determines the acceptance and consumption of rice [39]. Liang et al. [40] found that high N levels help in the reduction in chalkiness and improve appearance quality, while conversely, low N levels reduce appearance quality. Zhu et al. [41], on the other hand, argued that increased N fertiliser application would increase the formation of chalkiness, leading to a reduction in appearance quality, probably due to differences in varieties, soil types, and the amount of N applied. In our work, the chalkiness degree and chalkiness rate of the RPN+ID and RBN+ID treatments were lower than those of the CK and NN+ID treatments. An increased application of N fertiliser prolongs the grain filling time and makes the straight-chain amylose arrangement looser, which increases the chalkiness rate in the rice and, therefore, lowers its appearance quality [42]. A study by Hu et al. [43] reported that the content of chalkiness in rice increases with an increasing density. Similarly, we report that the degree of chalkiness and the chalkiness rate of NN+ID increased by 19.6% and 20.2%, respectively, compared to CK. On the contrary, the effect of density on appearance quality showed otherwise in the study of Tang et al. [44]. Our study found similarity with the work of Huang et al. [45], which showed that a long filling time and smooth filling of inferior grains could effectively improve appearance quality. Additionally, our study found that the chalkiness degree and chalkiness rate were positively proportional to the maximum grain filling rate and the mean grain filling rate of superior grains, while they were inversely proportional to the time of grain filling reaching 99% to solid grout. The results of previous studies on the flavour quality of boiled rice have exhibited varying trends [46]. One study suggested that N fertiliser has less effect on the content of straight-chain amylose in rice [47]. Our study showed that the straight-chain amylose content increased by 3.7% and 0.9% in RPN+ID and RBN+ID, respectively, compared with NN+ID, consistent with the findings of Chen et al. [48]. According to these authors, the application of N fertiliser was inversely related to the content of straight-chain amylose. Chen et al. [48] reported that the content of straight-chain amylose was significantly reduced under a high density. However, our study observed that the content of straight-chain amylose was slightly reduced in NN+ID relative to CK. Plausibly, the soil type and climatic differences between the north and south of China may account for the differences noted. The straight-chain amylose content in RPN+ID and RBN+ID increased by 3.1% and 0.3%, respectively. According to Wang et al. [46], through setting different gradients of N reduction and density increase, the straight-chain amylose content showed a trend of increasing first and then subsequently decreasing. Bett-Garber et al. [49] found a significant negative correlation between straight-chain amylose and flavour value. The average straight-chain amylose content of our study ranged from 17.58% to 18.23%, consistent with Gao et al. [50]. Zhang et al. [51] showed that an increased density was positively correlated with flavour value. However, the flavour value of the NN+ID treatment in this experiment was slightly lower than that of CK, while the flavour values of the RPN+ID and RBN+ID treatments were higher than CK. The differences observed might be related to the interactive effect of density and fertiliser interactions. The flavour value of the RPN+ID treatment was 2.9% higher than that of the RBN+ID treatment, which is in line with the previous opinion that reduced panicle fertiliser can improve taste value [52]. It was found that RPN+ID had lower T99 and higher Va values than the other treatments for both superior and inferior grains. The reduction in panicle fertiliser resulted in a shortening of irrigation time, which increased straight-chain amylose to a certain extent, ultimately increasing the flavour value of the rice.
Protein content is an important indicator for determining the nutritional quality and flavour value of rice. We observed a negative correlation between straight-chain amylose content and protein content, in accordance with the study of Wei et al. [53]. The protein content of the NN+ID treatment increased by 3.2% compared to CK. It has been reported that increasing the planting density of rice reduces its ability to draw N fertiliser, which blocks protein synthesis and, thus, reduces protein content [41]. The protein content of RPN+ID and RBN+ID declined by averages of 10.4% and 2.8%, respectively, compared to NN+ID, which is consistent with the findings of Mariem et al. [54], which showed that the lower the N application, the lower the protein content.
5. Conclusions
N fertiliser reduction at different rice growth stages under increased density conditions impacted rice growth and development. Reduced basal N fertiliser and an increased density stimulated rice yield increases of 5.1% due to the increase in the number of effective spikes. Additionally, reduced basal fertiliser N and an increased density exhibited a better maximum and an average filling rate of 12.5% in superior grains during the period of the study. Furthermore, inferior grains had faster maximum filling rates, slower average grain filling rates, and increased grain weights. A reduction in basal fertiliser and an increased density impacted appearance quality while reducing chalkiness degree and chalkiness rate by 7.2% and 11.0%.
Panicle fertiliser N reduction and increased density had less effect on rice yield, nevertheless, it improved appearance quality to some degree and increased cooking taste quality while augmenting flavour value and straight-chain amylose content by 4.2% and 3.1%, respectively. The reduction in N fertiliser and increase in density exhibited influences on rice growth and quality characteristics. Nonetheless, further studies are needed to clarify the mechanism of the effect of seed amylase activity on the yield and quality of rice in Northeast China.
Author Contributions
Conceptualisation, W.D.; methodology, W.D.; software, W.D., Y.Z. and F.D.; validation, W.D., Y.Z., F.D. and J.Z.; formal analysis, W.D., Y.Z. and F.D.; investigation, W.D., Y.Z., F.D., J.Z., A.T., Y.L., K.L., Y.M. and L.W.; resources, Z.Y. and F.J.; data curation, W.D.; writing—original draft preparation, W.D., Y.Z. and F.D.; writing—review and editing, W.D., Y.Z., F.D., J.Z., A.T., Y.L., K.L. and Y.M.; visualisation, W.D., Y.Z., F.D. and J.Z.; supervision, A.T., Y.L., K.L., Y.M., L.W., Z.Y. and F.J.; project administration, L.W.; funding acquisition, W.D. All authors have read and agreed to the published version of the manuscript.
Funding
This research was funded by the Heilongjiang Province Agricultural Science and Technology Innovation Span Project (CX23GG12), the Heilongjiang Province Key Research and Development Program (Innovation Base) Project (JD2023GJ04) and the Key Program of Research Funds for the Research Institutes of Heilongjiang Province (CZKYF2021-2-B019).
Institutional Review Board Statement
Not applicable.
Data Availability Statement
The data presented in this study are available on request from the corresponding author. The data are not publicly available due to restrictions, e.g., privacy or ethical.
Conflicts of Interest
The authors declare no conflicts of interest.
References
- Yuan, L. Development of hybrid rice to ensure food security. Rice Sci. 2014, 21, 1–2. [Google Scholar] [CrossRef]
- Piao, S.; Ciais, P.; Huang, Y.; Shen, Z.; Peng, S.; Li, J.; Zhou, L.; Liu, H.; Ma, Y.; Ding, Y.; et al. The impacts of climate change on water resources and agriculture in China. Nature 2010, 467, 43–51. [Google Scholar] [CrossRef] [PubMed]
- Xiao, D.; Yang, X.; Bai, H.; Tang, J.; Tao, F. Trends and climate response in the yield of staple crops across Northeast China. Front. Sustain. Food Syst. 2024, 7, 1246347. [Google Scholar] [CrossRef]
- Fan, M.; Shen, J.; Yuan, L.; Jiang, R.; Chen, X.; Davies, W.; Zhang, F. Improving crop productivity and resource use efficiency to ensure food security and environmental quality in China. J. Exp. Bot. 2012, 63, 13–24. [Google Scholar] [CrossRef]
- Zhang, Y.; Long, H.; Wang, Y.; Li, Y.; Ma, L.; Chen, K.; Zheng, Y.; Jiang, T. The hidden mechanism of chemical fertiliser overuse in rural China. Habitat Int. 2020, 102, 102210. [Google Scholar] [CrossRef]
- Huang, M.; Yang, C.; Ji, Q.; Jiang, L.; Tan, J.; Li, Y. Tillering responses of rice to plant density and nitrogen rate in a subtropical environment of Southern China. Field Crops Res. 2013, 149, 187–192. [Google Scholar] [CrossRef]
- Chen, J.; Zhu, X.; Xie, J.; Deng, G.; Tu, T.; Guan, X.; Yang, Z.; Huang, S.; Chen, X.; Qiu, C.; et al. Reducing nitrogen application with dense planting increases nitrogen use efficiency by maintaining root growth in a double-rice cropping system. Crop J. 2021, 9, 805–815. [Google Scholar] [CrossRef]
- Huang, M.; Zou, Y. Integrating mechanization with agronomy and breeding to ensure food security in China. Field Crops Res. 2018, 224, 22–27. [Google Scholar] [CrossRef]
- Yu, T.; Jiang, W.; Ham, T.; Chu, S.; Lestari, P.; Lee, J.; Kim, M.; Xu, F.; Han, L.; Dai, L.; et al. Comparison of grain quality traits between japonica rice cultivars from Korea and Yunnan province of China. J. Crop Sci. Biotechnol. 2008, 11, 135–140. [Google Scholar]
- Bao, J. Toward understanding the genetic and molecular bases of the eating and cooking qualities of rice. Cereal Food World. 2012, 57, 148–156. [Google Scholar] [CrossRef]
- Gu, J.; Chen, J.; Chen, L.; Wang, Z.; Zhang, H.; Yang, J. Grain quality changes and responses to nitrogen fertilizer of japonica rice cultivars released in the Yangtze River Basin from the 1950s to 2000s. Crop J. 2015, 3, 285–297. [Google Scholar] [CrossRef]
- Gong, Y.; Lei, Y.; Zhang, X.; Zhang, X.; Yan, B.; Ju, X.; Cheng, X.; Zhang, J.; Sun, X.; Xu, H.; et al. Nitrogen rate and plant density interaction enhances grain yield by regulating the grain distribution of secondary branches on the panicle axis and photosynthesis in japonica rice. Photosynthetica 2022, 60, 179. [Google Scholar] [CrossRef] [PubMed]
- Xie, X.; Shan, S.; Wang, Y.; Cao, F.; Chen, J.; Huang, M.; Zou, Y. Dense planting with reducing nitrogen rate increased grain yield and nitrogen use efficiency in two hybrid rice varieties across two light conditions. Field Crops Res. 2019, 236, 24–32. [Google Scholar] [CrossRef]
- Zhou, T.; Zhou, Q.; Li, E.; Yuan, L.; Wang, W.; Zhang, H.; Liu, L.; Wang, Z.; Yang, J.; Gu, J. Effects of nitrogen fertilizer on structure and physicochemical properties of ‘super’rice starch. Carbohydr. Polym. 2020, 239, 116237. [Google Scholar] [CrossRef] [PubMed]
- Tao, W.; Zhang, Y.; Gu, J.; Zhu, K.; Wang, Z.; Yang, J. The synergistic optimization of rice yield, quality, and profit by the combined application of organic and inorganic nitrogen fertilizers. Agronomy 2024, 14, 2665. [Google Scholar] [CrossRef]
- He, X.; Zhu, H.; Shi, A.; Wang, X. Optimizing nitrogen fertilizer management enhances rice yield, dry matter, and nitrogen use efficiency. Agronomy 2024, 14, 919. [Google Scholar] [CrossRef]
- Zhou, C.; Huang, Y.; Jia, B.; Wang, Y.; Wang, Y.; Xu, Q.; Li, R.; Wang, S.; Do, F. Effects of cultivar, nitrogen rate, and planting density on rice-grain quality. Agronomy 2018, 8, 246. [Google Scholar] [CrossRef]
- Xiong, J.; Geng, C.; Ding, Y.; Wang, S. Influence of source bank structure on chalkiness of hybrid early indica rice varieties with different bank types. Chinese Agric. Sci. 2011, 44, 3970–3980. (In Chinese) [Google Scholar]
- Jiang, Y.; Chen, Y.; Zhao, C.; Liu, G.; Shi, Y.; Zhao, L.; Wang, Y.; Wang, W.; Xu, K.; Li, G.; et al. The starch physicochemical properties between superior and inferior grains of japonica rice under panicle nitrogen fertilizer determine the difference in eating quality. Foods 2022, 11, 2489. [Google Scholar] [CrossRef]
- MacMillan, K.P.; Gulden, R.H. Effect of seeding date, environment and cultivar on soybean seed yield, yield components, and seed quality in the northern great plains. Agron. J. 2020, 112, 1666–1678. [Google Scholar] [CrossRef]
- Jiang, Q.; Du, Y.; Tian, X.; Wang, Q.; Xiong, R.; Xu, G.; Yan, C.; Ding, Y. Effect of panicle nitrogen on grain filling characteristics of high-yielding rice cultivars. Eur. J. Agron. 2016, 74, 185–192. [Google Scholar] [CrossRef]
- Bian, J.; Xu, F.; Han, C.; Qiu, S.; Ge, J.; Xu, J.; Zhang, H.; Wei, H. Effects of planting methods on yield and quality of different types of japonica rice in Northern Jiangsu plain, China. J. Integr. Agric. 2018, 17, 2624–2635. [Google Scholar] [CrossRef]
- Dou, Z.; Tang, S.; Li, G.; Liu, Z.; Ding, C.; Chen, L.; Wang, S.; Ding, Y. Application of nitrogen fertilizer at heading stage improves rice quality under elevated temperature during grain-filling stage. Crop Sci. 2017, 57, 2183–2192. [Google Scholar] [CrossRef]
- Li, Q.; Deng, F.; Zeng, Y.; Li, B.; He, C.; Zhu, Y.; Zhou, X.; Zhang, Z.; Wang, L.; Tao, Y.; et al. Low light stress increases chalkiness by disturbing starch synthesis and grain filling of rice. Int. J. Mol. Sci. 2022, 23, 9153. [Google Scholar] [CrossRef]
- Zhao, D.; Li, Q.; Zhang, C.; Zhang, C.; Yang, Q.; Pan, L.; Ren, X.; Lv, J.; Gu, M.; Liu, Q. GS9 acts as a transcriptional activator to regulate rice grain shape and appearance quality. Nature 2018, 9, 1240. [Google Scholar] [CrossRef]
- Bao, J.; Sun, M.; Corke, H. Analysis of the genetic behavior of some starch properties in indica rice (Oryza sativa L.): Thermal properties, gel texture, swelling volume. Theor. Appl. Genet. 2002, 104, 408–413. [Google Scholar] [CrossRef] [PubMed]
- Wei, H.; Meng, T.; Ge, J.; Zhang, X.; Shi, T.; Ding, E.; Lu, Y.; Li, X.; Tao, Y.; Chen, Y.; et al. Reduced nitrogen application rate with dense planting improves rice grain yield and nitrogen use efficiency: A case study in East China. Crop J. 2021, 9, 954–961. [Google Scholar] [CrossRef]
- Zhu, Q.; Cao, X.; Luo, Y. Growth analysis of rice grain filling. J. Crop. Sci. 1988, 14, 182–189. (In Chinese) [Google Scholar]
- Ju, X.; Gu, B. Current situation, problems and trends of nitrogen fertilizer application in farmland in China. J. Plant. Nutr. 2014, 20, 783–795. (In Chinese) [Google Scholar]
- Xiao, X.; Li, C.; Tang, H.; Tang, W.; Cheng, K.; Guo, L.; Wang, K.; Pan, X. Effects of nitrogen reduction and density increase on soil nitrogen pooling and nitrogen utilisation in double-season rice fields under straw return. Chin. J. Eco-Agric. 2019, 27, 422–430. (In Chinese) [Google Scholar]
- Zhu, X.; Zhang, Z.; Zhang, J.; Deng, A.; Zhang, W. Effects of nitrogen reduction and density increase on yield, nitrogen fertilizer use efficiency and greenhouse effect of rice in Northeast China. J. Appl. Ecol. 2016, 27, 453–461. (In Chinese) [Google Scholar]
- Wang, Y.; Wang, X.; Zhai, L.; Sundus, Z.; Shen, C.; Zhu, S.; Chen, K.; Xu, J. A novel effective panicle number per plant 4 haplotype enhances grain yield by coordinating panicle number and grain number in rice. Crop J. 2024, 12, 202–212. [Google Scholar] [CrossRef]
- Zheng, Y.; Ding, Y.; Liu, Z.; Wang, S. Effects of panicle nitrogen fertilization on non-structural carbohydrate and grain filling in indica rice. Agric. Sci. China 2010, 9, 1630–1640. [Google Scholar] [CrossRef]
- Zhang, J.; Zhang, Y.; Song, N.; Chen, Q.; Sun, H.; Peng, T.; Huang, S.; Zhao, Q. Response of grain-filling rate and grain quality of mid-season indica rice to nitrogen application. J. Integr. Agric. 2021, 20, 1465–1473. [Google Scholar] [CrossRef]
- Qian, Y.; Zhang, H.; Wu, W.; Chen, Y.; Li, J.; Guo, Z.; Zhang, Q.; Dai, Q.; Huo, Z.; Xu, K.; et al. Effects of seedlings number per hill on grain yield and quality indifferent panicle types of mechanical transplanted japonica rice. J. Agric. 2009, 35, 1698–1707. (In Chinese) [Google Scholar]
- Del Rosario, A.R. Composition and endosperm structure of developing and mature rice kernel. Cereal Chem. 1968, 45, 225–235. [Google Scholar]
- Chen, L.; Gao, J.; Zhang, W.; Jiang, H.; Liu, Y.; Yan, B.; Wan, X. Nitrogen and potassium application effects on grain-filling and rice quality in different japonica rice cultivars. Agronomy 2024, 14, 1629. [Google Scholar] [CrossRef]
- Xi, M.; Xu, Y.; Sun, X.; Wu, W.; Zhou, Y. Effects of nitrogen panicle fertilizer on rice chalky white grain filling and its relationship with processing quality. J. Agric. Sci. Tech. 2021, 23, 144–151. (In Chinese) [Google Scholar]
- Fitzgerald, M.A.; Mccouch, S.R.; Hall, R.D. Not just a grain of rice: The quest for quality. Trends Plant Sci. 2009, 14, 133–139. [Google Scholar] [CrossRef]
- Liang, H.; Gao, S.; Ma, J.; Zhang, T.; Wang, T.; Zhang, S.; Wu, Z. Effect of nitrogen application rates on the nitrogen utilization, yield and quality of rice. Food. Nutr. Sci. 2021, 12, 13. [Google Scholar] [CrossRef]
- Zhu, D.; Zhang, H.; Guo, B.; Xu, K.; Dai, Q.; Wei, H.; Gao, H.; Hu, Y.; Cui, P.; Huo, Z. Effects of nitrogen level on yield and quality of japonica soft super rice. J. Agric. Sci. 2017, 16, 1018–1027. [Google Scholar] [CrossRef]
- Zhao, C.; Liu, G.; Chen, Y.; Jiang, Y.; Shi, Y.; Zhao, L.; Liao, P.; Wang, W.; Xu, K.; Dai, Q.; et al. Excessive nitrogen application leads to lower rice yield and grain quality by inhibiting the grain filling of inferior grains. Agriculture 2022, 12, 962. [Google Scholar] [CrossRef]
- Hu, Q.; Jiang, W.; Qiu, S.; Xing, Z.; Hu, Y.; Guo, B.; Liu, G.; Gao, H.; Zhang, H.; Wei, H. Effect of wide-narrow row arrangement in mechanical pot-seedling transplanting and plant density on yield formation and grain quality of japonica rice. J. Integr. Agric. 2020, 19, 1197–1214. [Google Scholar] [CrossRef]
- Tang, J.; Tang, C.; Guo, B.; Zhang, C.; Zhang, Z.; Wang, K.; Zhang, H.; Chen, H.; Sun, M. Effect of nitrogen application on yield and rice quality of mechanical transplanting high quality late rice. Acta Agron. Sin. 2020, 46, 117–130. [Google Scholar] [CrossRef]
- Huang, J.; Pan, Y.; Chen, H.; Zhang, Z.; Fang, C.; Shao, C.; Amjad, H.; Lin, W.; Lin, W. Physiochemical mechanisms involved in the improvement of grain-filling, rice quality mediated by related enzyme activities in the ratoon cultivation system. Field Crops Res. 2020, 258, 107962. [Google Scholar] [CrossRef]
- Wang, X.; Zhou, Y.; Xing, Y.; Chen, L. Points of cultivation technology of original ecological rice. Jilin Agric. 2018, 1, 56. (In Chinese) [Google Scholar]
- Wang, X.; Wang, K.; Yin, T.; Zhao, Y.; Liu, W.; Shen, Y.; Ding, Y.; Tang, S. Nitrogen fertilizer regulated grain storage protein synthesis and reduced chalkiness of rice under actual field warming. Front. Plant Sci. 2021, 12, 715436. [Google Scholar] [CrossRef]
- Chen, Y.; Liu, Y.; Dong, S.; Liu, J.; Wang, Y.; Hussain, S.; Wei, H.; Huo, Z.; Xu, K.; Dai, Q. Response of rice yield and grain quality to combined nitrogen application rate and planting density in saline area. Agriculture 2022, 12, 1788. [Google Scholar] [CrossRef]
- Bett-Garber, K.L.; Lea, J.M.; McClung, A.M.; Chen, M. Correlation of sensory, cooking, physical, and chemical properties of whole grain rice with diverse bran color. Cereal Chem. 2013, 90, 521–528. [Google Scholar] [CrossRef]
- Gao, H.; Ma, Q.; Li, G.; Yang, X.; Li, X.; Yin, C.; Li, M.; Zhang, Q.; Zhang, H.; Dai, Q.; et al. Effect of nitrogen application rate on cooking and eating qualities of different growth-development types of japonica rice. Sci. Agric. 2010, 43, 4543–4552. [Google Scholar]
- Zhang, K.; Chen, M.; Liu, Q. Effects of nitrogen reduction and density increase on yield and rice quality of indica-japonica hybrid rice. Henan Agric. Sci. 2023, 52, 14–21. (In Chinese) [Google Scholar]
- Ma, Y.; Wang, H.; Liu, J.; Wang, R.; Che, Z. Effects of root trace nitrogen reduction in arid areas on sucrose–starch metabolism of flag leaves and grains and yield of drip-irrigated spring wheat. Agronomy 2024, 14, 312. [Google Scholar] [CrossRef]
- Wei, H.; Chen, Z.; Xing, Z.; Zhou, L.; Liu, Q.; Zhang, Z.; Jiang, Y.; Hu, Y.; Zhu, J.; Cui, P.; et al. Effects of slow or controlled release fertilizer types and fertilization modes on yield and quality of rice. J. Integr. Agric. 2018, 17, 2222–2234. [Google Scholar] [CrossRef]
- Mariem, S.B.; Gonzalez-Torralba, J.; Collar, C.; Aranjuelo, I.; Morales, F. Durum wheat grain yield and quality under low and high nitrogen conditions: Insight into natural variation in low-and high-yielding genotypes. Plants 2020, 9, 1636. [Google Scholar] [CrossRef]
Disclaimer/Publisher’s Note: The statements, opinions and data contained in all publications are solely those of the individual author(s) and contributor(s) and not of MDPI and/or the editor(s). MDPI and/or the editor(s) disclaim responsibility for any injury to people or property resulting from any ideas, methods, instructions or products referred to in the content. |
© 2025 by the authors. Licensee MDPI, Basel, Switzerland. This article is an open access article distributed under the terms and conditions of the Creative Commons Attribution (CC BY) license (https://creativecommons.org/licenses/by/4.0/).