Article

A Monitoring Method for Agricultural Soil Moisture Using Wireless Sensors and the Biswas Model

1
College of Software, Shanxi Agricultural University, Jinzhong 030801, China
2
College of Resources and Environmental Science, Shanxi Agricultural University, Jinzhong 030801, China
3
College of Horticulture, Shanxi Agricultural University, Jinzhong 030801, China
4
Shanxi Institute of Organic Dryland Agriculture, Shanxi Agricultural University, Taiyuan 030000, China
*
Authors to whom correspondence should be addressed.
Agriculture 2025, 15(3), 344; https://doi.org/10.3390/agriculture15030344
Submission received: 21 October 2024 / Revised: 22 January 2025 / Accepted: 23 January 2025 / Published: 5 February 2025
(This article belongs to the Section Agricultural Soils)

Abstract

:
Efficient monitoring of soil moisture is crucial for optimizing water usage and ensuring crop health in agricultural fields, especially under rainfed conditions. This study proposes a high-throughput soil moisture monitoring method that integrates LoRa-based wireless sensor networks with region-specific statistical models. Wireless sensors were deployed in the top 0–0.2 m soil layer to gather real-time moisture data, which were then combined with the Biswas model to estimate soil moisture distribution down to a depth of 2.0 m. The model was calibrated using field capacity and crop wilting coefficients. Results demonstrated a strong correlation between model predictions and actual measured soil moisture storage, with a coefficient of determination (R2) exceeding 0.94. Additionally, 83% of sample points had relative errors below 18.5%, and for depths of 0–1.2 m, 90% of sample points had relative errors under 15%. The system effectively tracked daily soil moisture dynamics during maize growth, with predicted evapotranspiration relative errors under 10.25%. This method provides a cost-effective and scalable tool for soil moisture monitoring, supporting irrigation optimization and improving water use efficiency in dryland agriculture.

1. Introduction

Amid global climate change and increasing water scarcity, high-frequency, high-precision, and low-cost monitoring of soil water storage in agricultural fields is essential for efficient water resource utilization, management of crop health during growth, and ensuring food security [1,2]. Accurate soil moisture monitoring not only supports sustainable agriculture but also plays a vital role in optimizing irrigation practices, reducing water wastage, and improving crop yields, which are crucial for addressing the challenges of modern agriculture and global food security [3,4].
Several established methods exist for monitoring soil moisture, including traditional soil auger sampling and drying, neutron probe methods, TDR (Time Domain Reflectometry) moisture meters, and large-scale monitoring through remote sensing technologies, such as satellites and drones [5,6,7,8,9,10]. While the traditional sample-drying method provides accurate measurements of soil moisture content, it is time-consuming, labor-intensive, and causes significant disturbance to the soil structure [11,12,13,14]. The neutron probe method allows for continuous monitoring of soil moisture distribution with minimal soil disturbance, but the high cost of equipment maintenance and potential radiation risks are notable drawbacks [15,16]. Remote sensing technologies enable rapid coverage of large areas but are often limited by spatial resolution and are typically suitable only for surface moisture monitoring; moreover, remote sensing data can be complex to process [17,18,19,20]. Despite these advances, these methods often fall short in meeting modern agriculture’s demand for simultaneous high spatial and temporal resolution, affordability, and adaptability to varying soil conditions [21,22]. This highlights the urgent need for improved soil moisture monitoring methods that overcome these limitations.
Recent advances in low-cost, easy-to-install Internet of Things (IoT) technologies and sensor systems offer new opportunities for soil moisture monitoring. Wireless soil moisture sensors enable rapid and efficient monitoring of soil water content, significantly improving data collection accuracy and efficiency [23,24,25,26,27]. However, deploying a large number of wireless sensors, while offering high accuracy, presents challenges, such as high installation and maintenance costs [28,29]. Furthermore, studies have shown significant correlations between moisture distribution in surface and deeper soil layers, suggesting that surface data can be used to predict deeper soil moisture through models like the Biswas nonlinear model [30,31]. Additionally, long-term agricultural experience and the spatiotemporal distribution characteristics of soil profiles demonstrate a high degree of similarity in soil moisture dynamics across the same field or region, providing a solid rationale for the feasibility and validity of this study [32,33]. The integration of IoT-based sensors with statistical models offers an innovative pathway for achieving low-cost, high-throughput, and scalable solutions for soil moisture monitoring, particularly in regions with diverse and challenging soil conditions.
To address these challenges, this study aims to develop a region-specific soil moisture monitoring approach using a combination of wireless IoT sensors and the Biswas model. The primary objective is to improve the accuracy and efficiency of soil water storage monitoring across varying soil depths. Specifically, this research seeks to answer the following questions:
(1)
Can surface soil moisture data, collected using low-cost wireless sensors, accurately predict deeper soil moisture dynamics across different growth stages?
(2)
How does the developed region-specific model perform under varying soil and environmental conditions compared to traditional methods?
In this study, we conducted layered monitoring of soil moisture in the 0–2.0 m depth range using traditional soil auger sampling and drying methods before maize planting, at various growth stages, and after harvest. Remote wireless soil moisture sensors were deployed to monitor volumetric soil moisture content at depths of 0–0.1 m and 0.1–0.2 m. We developed a region-specific Biswas model to estimate soil water storage from the surface to deeper layers based on surface moisture data. The model was then used to estimate daily soil moisture dynamics and crop water consumption throughout the crop growth cycle.

2. Materials and Methods

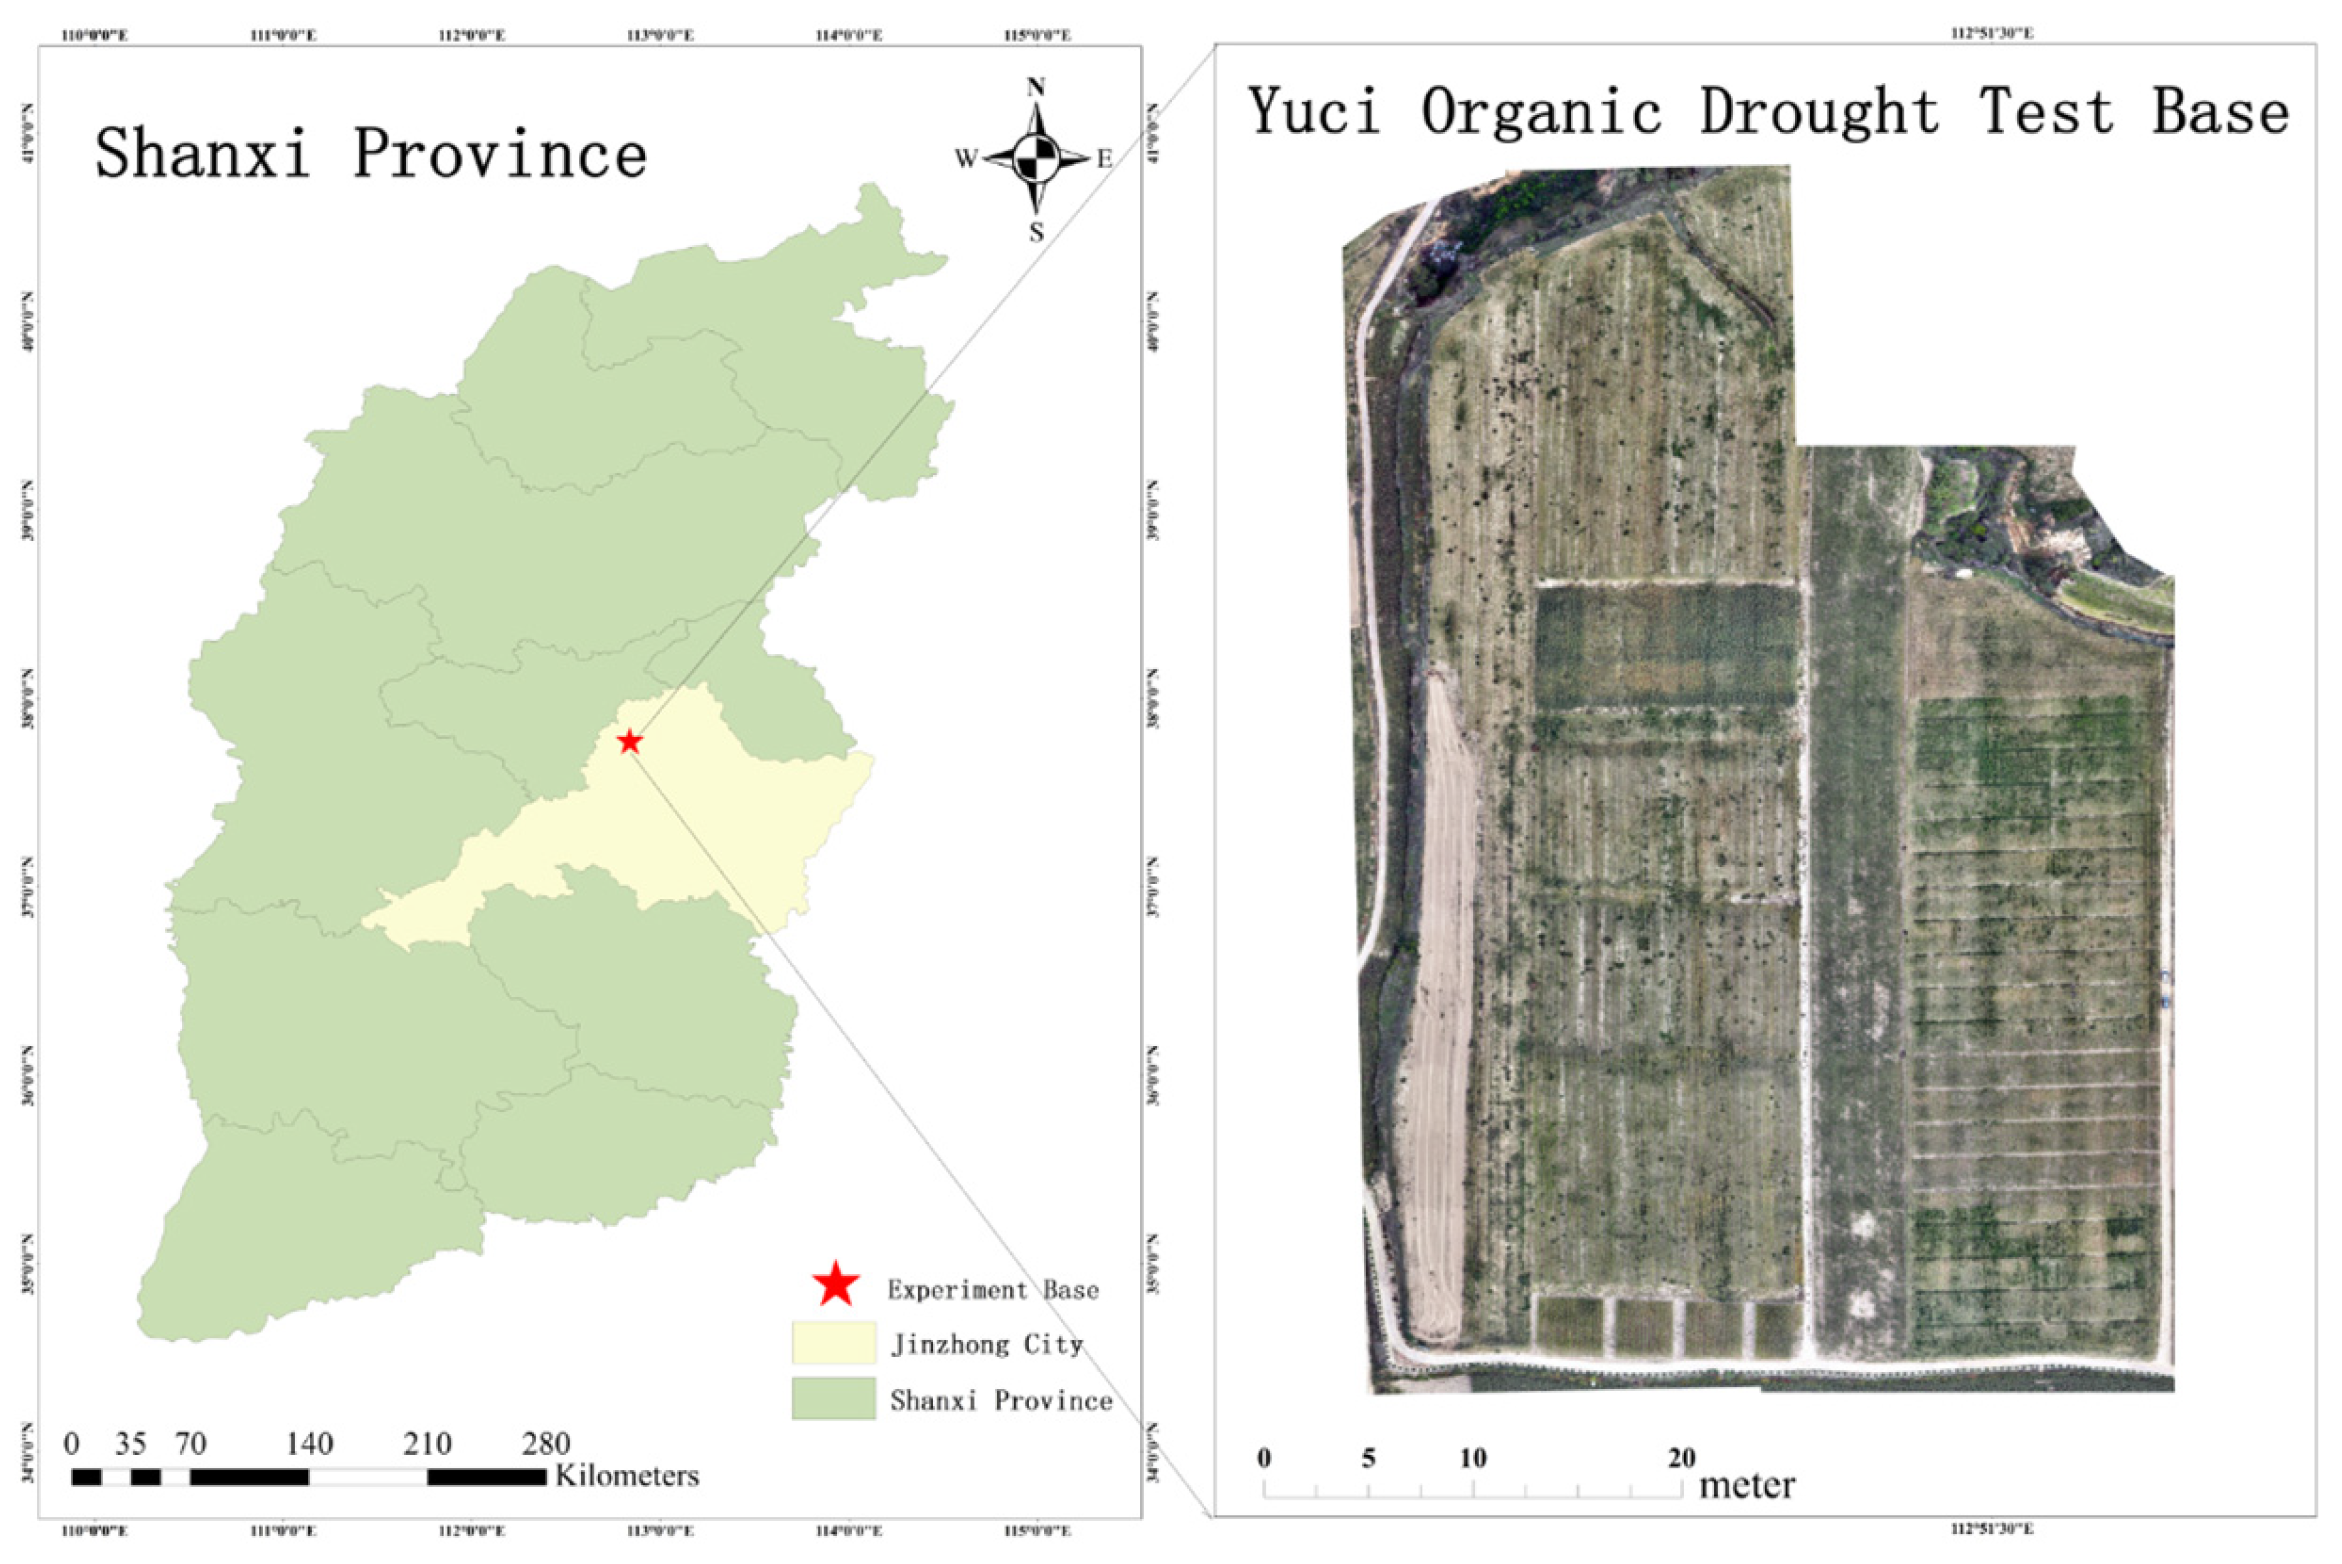
2.1. Experimental Site Overview

The study area is located in the eastern part of the Loess Plateau in China, specifically at the LiFang Organic Dryland Experimental Base in Yuci, Shanxi Province (N37°51′, E112°45′). The elevation ranges from 767 m to 1777 m (Figure 1). This region is characterized by a temperate continental climate, with an average annual temperature of 9.8 °C, an average annual precipitation of 418–483 mm, and an average annual evaporation of 1500–2300 mm. The predominant agricultural practice in this area is rainfed dryland farming.
Construction of the experimental base began in March 2022, and it currently lacks basic infrastructure for soil and crop monitoring. This situation aligns with the objectives of this study, which are to implement and evaluate a low-cost, high-throughput, continuous soil water storage monitoring solution for farmland lacking established observation facilities.

2.2. Soil Sampling and Measurement Methods

Maize was sown on 15 May 2023, with seedlings emerging between 20 May and 22 May, and harvested on 4 October. Throughout the crop growth period, a combination of manual sampling and sensor-based monitoring was employed to measure the volumetric water content of soil in the 0–2.0 m profile (Table 1). The volumetric water content of the topsoil (0–20 cm) was monitored in real time using a portable RS485 temperature and humidity sensor, with measurements taken at nine randomly distributed locations across the field. For the subsoil (20–200 cm), gravimetric water content was determined using soil drilling and sampling techniques. Soil samples were collected at 20 cm intervals from the surface down to a depth of 200 cm using aluminum boxes, and their weights were recorded. The gravimetric water content was then measured using the standard oven-drying method, and the corresponding bulk density of each soil layer was used to calculate the volumetric water content. During each monitoring event, three random locations in the field were selected to measure soil moisture across the 0–2.0 m profile.
At the end of the experiment, soil profiles were excavated at three randomly selected points. Soil samples corresponding to the moisture measurement depths were collected using 200 cm3 cutting rings to determine bulk density.

2.3. Deployment of Wireless Sensors and Continuous Surface Moisture Monitoring

A low-cost remote monitoring system based on LoRa wireless communication technology was developed to continuously monitor soil moisture in the topsoil layer (0–20 cm) of the farmland (Figure 2). The system comprises wireless soil moisture sensors (RS485-type temperature and humidity sensors) and a LoRa communication system that includes a gateway, a server layer, and a data communication layer. These components enable the control of multiple soil moisture sensors in the farmland’s topsoil and communication with the nearest 4G ground base station. The laboratory’s cloud-based platform receives real-time data, providing dynamic soil moisture information from each monitoring point.

2.3.1. Sensor Model and Deployment

Our study used RS485-type soil moisture sensors (model RS485, manufactured by Shandong Jianda Renke Electronic Technology Co., Ltd., located in Jinan, China) with the following specifications:
(1)
Measurement range: 0–100% (volumetric water content);
(2)
Accuracy: ±2% in 0–50% range, ±3% in 50–100% range;
(3)
Operating temperature range: −20 °C to 60 °C;
(4)
RS485 digital output.
Sensors were installed vertically, with the sensor head about 1 cm below the soil surface to capture 0–20 cm moisture dynamics. Each LoRa module was housed in a protective case approximately 30 cm away from the sensor probe to prevent environmental damage. A total of nine monitoring points were selected, each with one sensor. Their locations were recorded on a farm map, along with GPS coordinates for later reference.

2.3.2. LoRa Communication System Configuration

The LoRa communication system consists of three components.
The first part is the LoRa Node Module (model: E32-868T30D, manufactured by Chengdu Ebyte Electronic Technology Co., Ltd., located in Chengdu, China).
(1)
Frequency: 868 MHz;
(2)
Max range: 10 km (line-of-sight);
(3)
Data rate: 0.3–19.2 kbps;
(4)
Voltage: 3.3–5.5 V;
(5)
Output power: 30 dBm.
The second part is the LoRa Gateway (model: RAK7249, manufactured by Shenzhen RAKwireless Technology Co., Ltd., located in Shenzhen, China).
(1)
Frequency: 868 MHz;
(2)
Supports up to 500 LoRa nodes;
(3)
Data interfaces: Ethernet/Wi-Fi/4G LTE;
(4)
Operating temperature: −40 °C to 85 °C.
The third part is the 4G Communication Module (manufactured by Guangzhou Stars Wings Electronic Technology Co., Ltd., located in Guangzhou, China).
This is integrated into the gateway to upload data to the laboratory’s cloud platform.
Data collected by the LoRa node module from the RS485 sensors are aggregated in the LoRa gateway and then transmitted via the 4G module to the cloud.

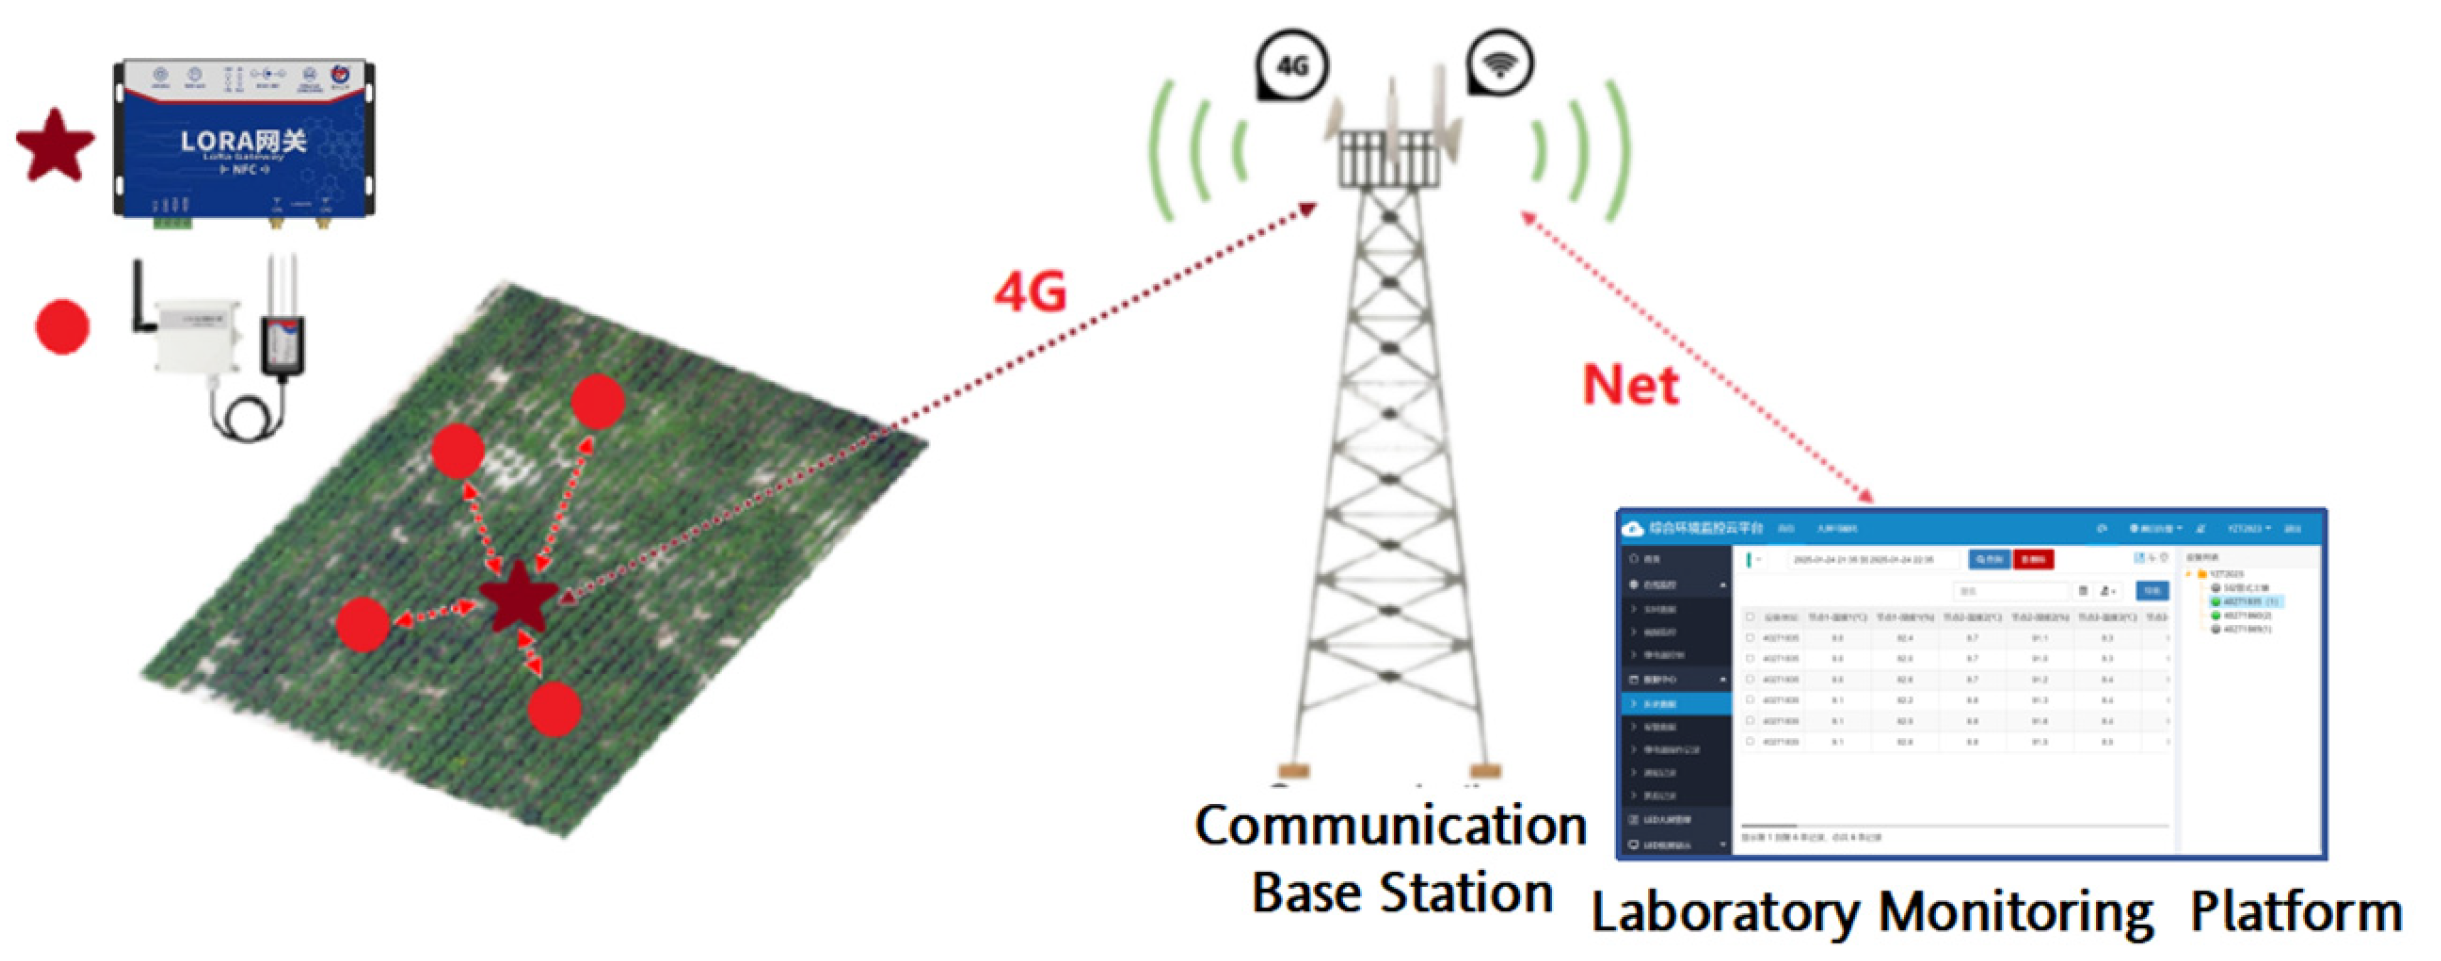
2.3.3. Data Collection and Transmission Workflow

Every 30 min (or adjusted as needed based on specific requirements), the RS485 sensors measure soil temperature and volumetric water content in the 0–20 cm layer. These data are sent to the LoRa gateway through the LoRa node module and then uploaded to the cloud platform via the 4G network. The platform classifies and stores the data, providing real-time visualization. Researchers can access and analyze this information on laboratory terminals or mobile devices and set automated alerts as needed.

2.3.4. Calibration and Quality Control

All sensors were calibrated in the laboratory using soil samples with known moisture contents to establish calibration curves. During field deployment, sensors are recalibrated every two weeks, with temperature drift corrections and outlier filtering applied to enhance data reliability. These measures ensure accurate long-term monitoring results.

2.4. Parameterization and Evaluation of the Surface and Deep Soil Moisture Model

We used the nonlinear model proposed by Biswas and Dasgupta to fit the relationship between surface soil moisture and soil water storage at various depths [30,31]. Using surface moisture content values (0–0.2 m) as input, the model predicts soil water storage at depths ranging from 0–0.4 m up to 0–2.0 m (Equation (1)).
S = A × d d 0 + S 0 × 1 + B × d d 0 2 + S c
In this equation, S represents soil water storage from 0 to depth d (m), while S0 represents surface soil moisture storage (0–d0 m). Constants A, B, and Sc define the nonlinear relationship between surface and deeper soil moisture storage.
Accurate estimation of parameters A, B, and Sc is essential for the model’s reliable application. To facilitate parameterization and practical use, we transformed Equation (1) into a multiple linear regression model through variable substitution (Equation (2)). By setting y = S − S0, x1 = d − d0, x2 = S0 × (d − d0)2, Equation (2) becomes a bivariate linear regression model (Equation (3)).
S S 0 = S c + A × d d 0 + B × S 0 × d d 0 2
y = A x 1 + B x 2 + S c
To enhance model accuracy, we used soil moisture content in the 0–0.1 m and 0.1–0.2 m layers as classification criteria and employed Euclidean cluster analysis to classify the original moisture profile data. Model performance was evaluated using the coefficient of determination (R2) and relative error (RE), enabling optimal parameter selection and accurate predictions.

2.5. Estimation of Crop Evapotranspiration and Daily Water Requirement

We calculated the reference crop evapotranspiration (ET₀) using the FAO56 Penman–Monteith equation (PM equation), as recommended by the Food and Agriculture Organization of the United Nations (FAO), which is the standard method for estimating ET₀ (Equation (4)) [34,35]. Meteorological data were obtained from the weather station at the experimental site.
E T 0 = 0.408 R n G + γ 900 T + 273 U 2 e s e a + γ 1 + 0.34 U 2
In Equation (4), ET₀ represents the reference crop evapotranspiration; Rn is net radiation; Δ is the slope of the saturation vapor pressure curve at temperature T; T is the average air temperature; U₂ is the average wind speed at 2 m height; G is the soil heat flux; γ is the psychrometric constant; and eₛ and eₐ are the saturation and actual vapor pressures (in kPa), respectively.
The daily water requirement of maize was calculated using crop coefficient (Kc) values recommended by the FAO [36]. According to FAO standards, the maize growing season was divided into four stages: initial growth (25 days, Kc = 0.3), rapid development (40 days, Kc = 1.2), mid-season (45 days, Kc = 1.2), and maturity (30 days, Kc = 0.6–0.36) [37].
Under ideal conditions, the daily crop water requirement or actual evapotranspiration equals the product of the crop coefficient and ET₀. However, actual water uptake by crops may not always match this requirement due to soil moisture levels [38]. When soil moisture is above a certain threshold, actual uptake equals the crop water requirement; when it is below, actual evapotranspiration equals the product of the crop water requirement and a soil moisture correction factor [39,40].
The soil moisture correction factor reflects the actual moisture content in the root zone and is the ratio of crop evapotranspiration under drought stress to that under full irrigation [41]. It can be approximated using Equation (5) [42].
k θ = θ θ w p θ f c θ w p
where θ is the actual root zone moisture content, θfc is the field capacity, and θwp is the wilting point of the root zone soil.

3. Results and Analysis

3.1. Correlation Analysis of Surface and Deep Soil Water Storage

Table 2 presents the correlation coefficients and significance test results for soil water content between the surface layers (0–0.2 m and 0–0.4 m) and deeper layers ranging from 0.6 m to 2.0 m (measured at 0.2 m intervals). The results indicate that water storage in the 0–0.2 m layer is significantly correlated with that in all deeper soil layers. The strongest correlation is observed with the 0–0.4 m layer (correlation coefficient = 0.89), indicating a strong positive relationship. This finding is consistent with the studies by Qu et al. and Si et al. [30,31], which highlight the critical role of shallow soil moisture in predicting surface soil dynamics. However, as depth increases, the correlation gradually decreases, reaching a coefficient of 0.56 at a depth of 2.0 m. Nevertheless, the overall correlation between the 0–0.2 m layer and the entire 0–2.0 m soil profile remains highly significant.
Similarly, water storage in the 0–0.4 m layer shows significant correlations with all deeper soil layers, with the highest correlation observed at the 0–0.6 m depth (correlation coefficient = 0.90). This trend suggests that a slightly thicker surface soil layer provides a better representation of soil moisture dynamics. As with the 0–0.2 m layer, the correlation of the 0–0.4 m layer also weakens with depth, reaching 0.68 at the 2.0 m depth, although the overall correlation remains significant.
Furthermore, Table 2 demonstrates that the correlations between the 0–0.4 m layer and deeper soil layers are stronger than those between the 0–0.2 m layer and the same deeper layers. This phenomenon is particularly evident in the correlation with the 0–1.2 m root zone, where water storage in the 0–0.4 m layer exhibits a significantly higher correlation with root zone water storage compared to the 0–0.2 m layer. These findings indicate that surface soil moisture serves as a crucial reference for predicting water storage at different soil depths.

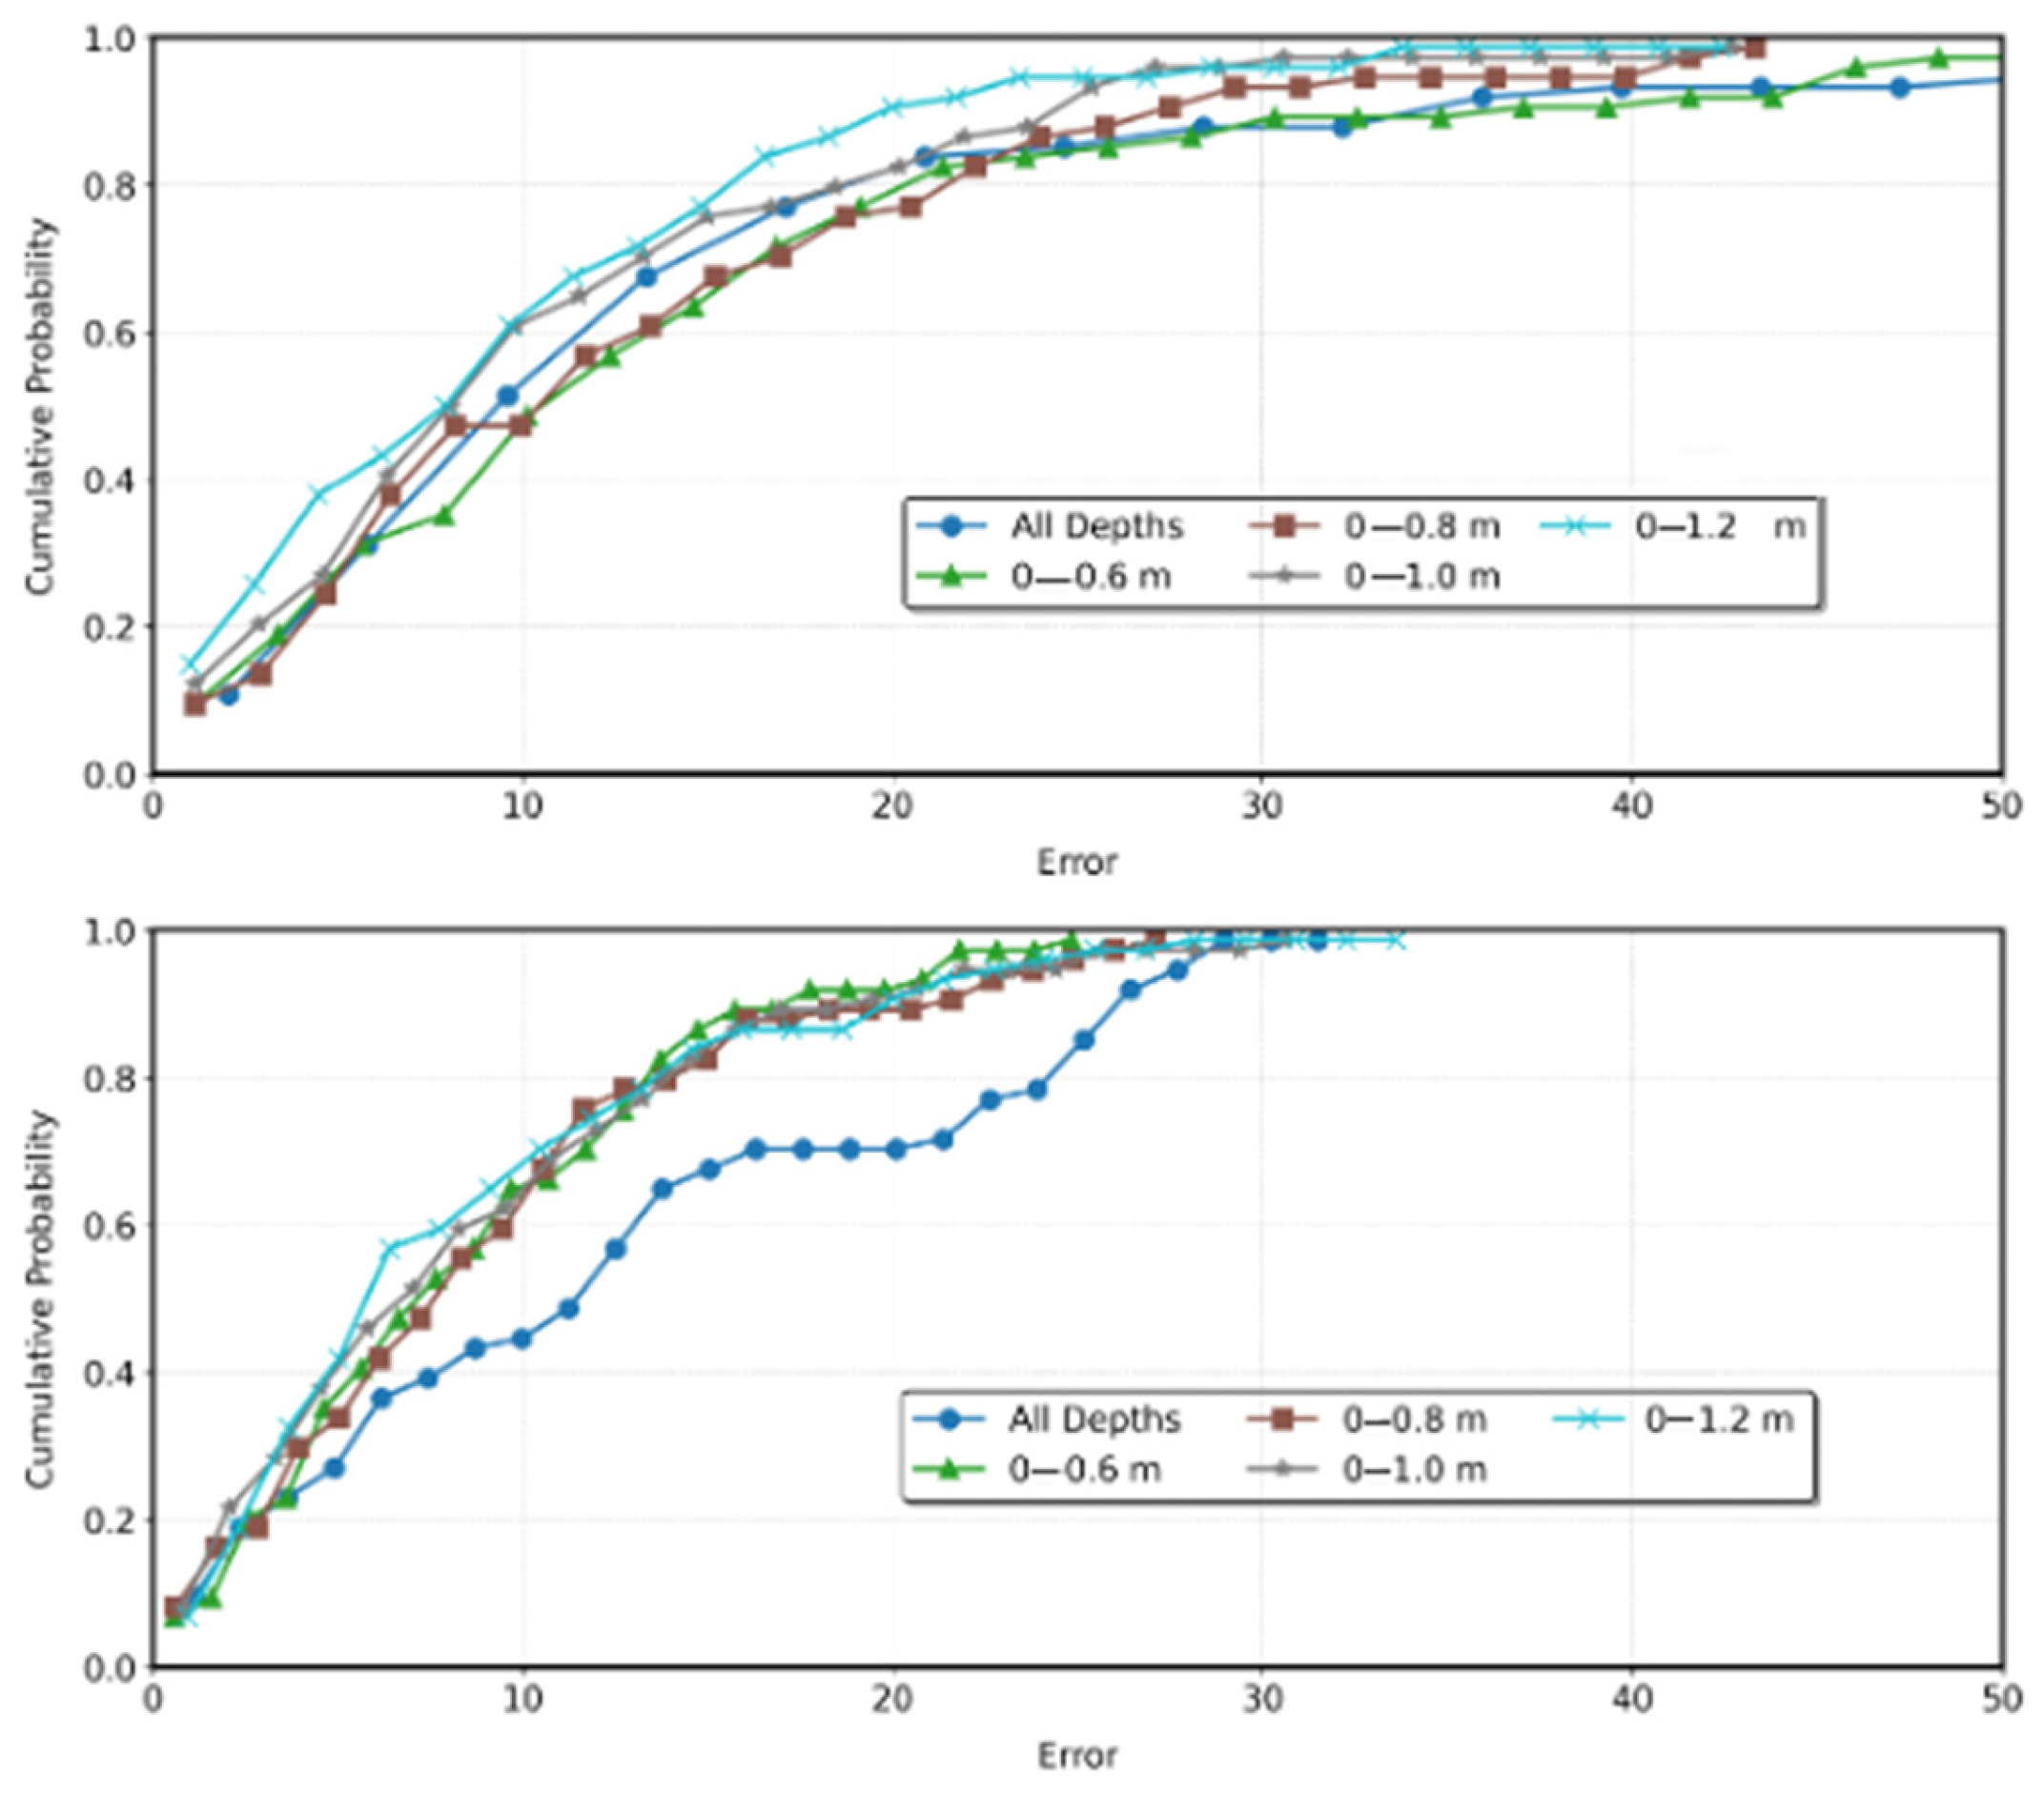
3.2. Selection of the Optimal Prediction Model

3.2.1. Classification of Soil Sampling Points

In field soil profiles, soil water movement is typically influenced by various factors, such as rainfall, irrigation, soil evaporation, and crop transpiration, resulting in complex patterns and relationships between surface and deep soil water storage. The preprocessing and analysis of experimental data revealed that the amount and distribution characteristics of surface soil moisture at different levels significantly affect the accuracy of prediction models.
To address these variations, we selected three surface soil layers (0–0.1 m, 0.1–0.2 m, and 0.2–0.4 m) as indicators to represent soil moisture characteristics for each sampling profile. A total of 75 soil profiles were classified using the Elbow Method—a heuristic clustering technique—based on the water storage values of the three surface layers (Figure 3). The profiles were divided into three distinct classes: Class 1 (22 samples), Class 2 (39 samples), and Class 3 (14 samples). All samples were also grouped together as Class 4 for comprehensive analysis.
Figure 4 illustrates the process of identifying and removing outliers from the soil moisture data to ensure accurate model fitting and evaluation. This process plays a critical role in improving the reliability of soil moisture classification and prediction. Outliers frequently occur due to uncontrollable factors, such as sensor malfunctions, environmental interference, or data transmission errors, and their removal is essential for accurate clustering and modeling.
Class 1: The average water content in the top three layers was 0.075 m3/m3, suggesting that these profiles may have experienced prolonged drought with limited rainfall or irrigation. Due to the lack of water supply and minimal evapotranspiration, moisture content was low, and water was more likely to move from deeper layers to the surface via capillary action.
Class 2: The average water content was 0.141 m3/m3, indicating an intermediate state between dry and wet conditions. In these profiles, water distribution reflected a dynamic balance between evaporation, transpiration, and deeper soil recharge, which is typical of rainfed agricultural systems.
Class 3: The average water content was 0.212 m3/m3, suggesting that these profiles were influenced by recent rainfall or irrigation events, with moisture moving downward to replenish the deeper soil layer.
These classifications highlight the variability in soil moisture conditions and the impact of water management practices on soil water storage. By segmenting the data, we aim to enhance the predictive power of the Biswas model by accounting for variations in water movement across different surface layers.

3.2.2. Fitting and Comparative Analysis of Biswas Model Parameters Across Dataset Categories

In this study, the RANSAC (Random Sample Consensus) algorithm was applied using Scikit-learn’s RANSAC Regressor module to detect and estimate outliers in the datasets. Observations deviating by more than 15 mm from the measured values were classified as outliers. This threshold was determined based on the distribution characteristics of the raw data and the practical measurement accuracy of the soil moisture sensors.
The RANSAC module was executed for 10,000 iterations, with all other parameters set to their optimal defaults to ensure stability and accuracy in outlier identification. After processing, approximately 5.6% of the initial dataset was identified as outliers and subsequently removed from the analysis. This proportion is reasonable given the unavoidable environmental noise and occasional sensor errors encountered during field data collection.
The rationale for outlier removal is as follows:
(1)
Minimizing measurement errors: Retaining significantly deviating data may severely distort the model fitting process, leading to inaccurate parameter estimation.
(2)
Improving model robustness: The removal of extreme deviations allows the Biswas model to better capture the true relationship between surface and deep soil water storage.
(3)
Consistency with field conditions: Deviations exceeding 15 mm typically arise from sensor malfunctions or data anomalies rather than actual environmental changes.
The results of Biswas model fitting after outlier removal are presented in Table 3, which summarizes the parameters (A, B, Sc) and their statistical significance.
By integrating the RANSAC algorithm with the Biswas model parameters, we effectively excluded outliers and achieved robust model fitting across the four datasets. All datasets exhibited R2 values exceeding 0.97, demonstrating the critical role of RANSAC in improving model accuracy and reliability through effective outlier detection.
The Biswas model parameters—A, B, and Sc—were all statistically significant at the 0.01 level, confirming their reliability. These parameters reveal the relationship between surface and deep soil water storage under varying moisture conditions. A represents the linear relationship between surface and deep soil water storage; B captures the nonlinear relationship; and Sc serves as the baseline relationship between surface and deep moisture content.
To further evaluate the model’s performance, we compared the relative errors between estimated and observed values using cumulative probability distributions, as shown in Figure 5.
The comparison between classified and unclassified datasets further underscores the impact of data classification on model performance. For classified datasets, the average absolute relative errors ranged from 8.91% to 9.56%, while the unclassified datasets exhibited a broader error range of 10.19% to 15.78% (Figure 5). The standard deviations of the classified datasets ranged from 7.31% to 7.59%, indicating a more consistent error distribution. In contrast, the unclassified datasets showed greater variability, with standard deviations ranging from 8.79% to 15.98%. The maximum error in the unclassified data reached 94.34%, far exceeding the 36.39% observed in the classified data, demonstrating the robustness of the classification model in handling extreme values.
These findings align with previous studies, which reported a 20–30% reduction in error through dataset classification. Our results validate these conclusions, particularly for applications involving multi-layer soil depths.
We further compared the prediction accuracy across different soil depths (0–0.6 m, 0–0.8 m, 0–1.0 m, and 0–1.2 m). The classified datasets outperformed the unclassified datasets at all depths, with over 93% of predictions exhibiting errors below 20% and more than 90% below 15%. In contrast, for unclassified data, only the 0–1.2 m depth achieved an accuracy of over 92% for errors below 20%, while the other depths showed less than 80% accuracy for errors below 20%. These results further highlight the effectiveness of classification in improving prediction accuracy across various soil depths.

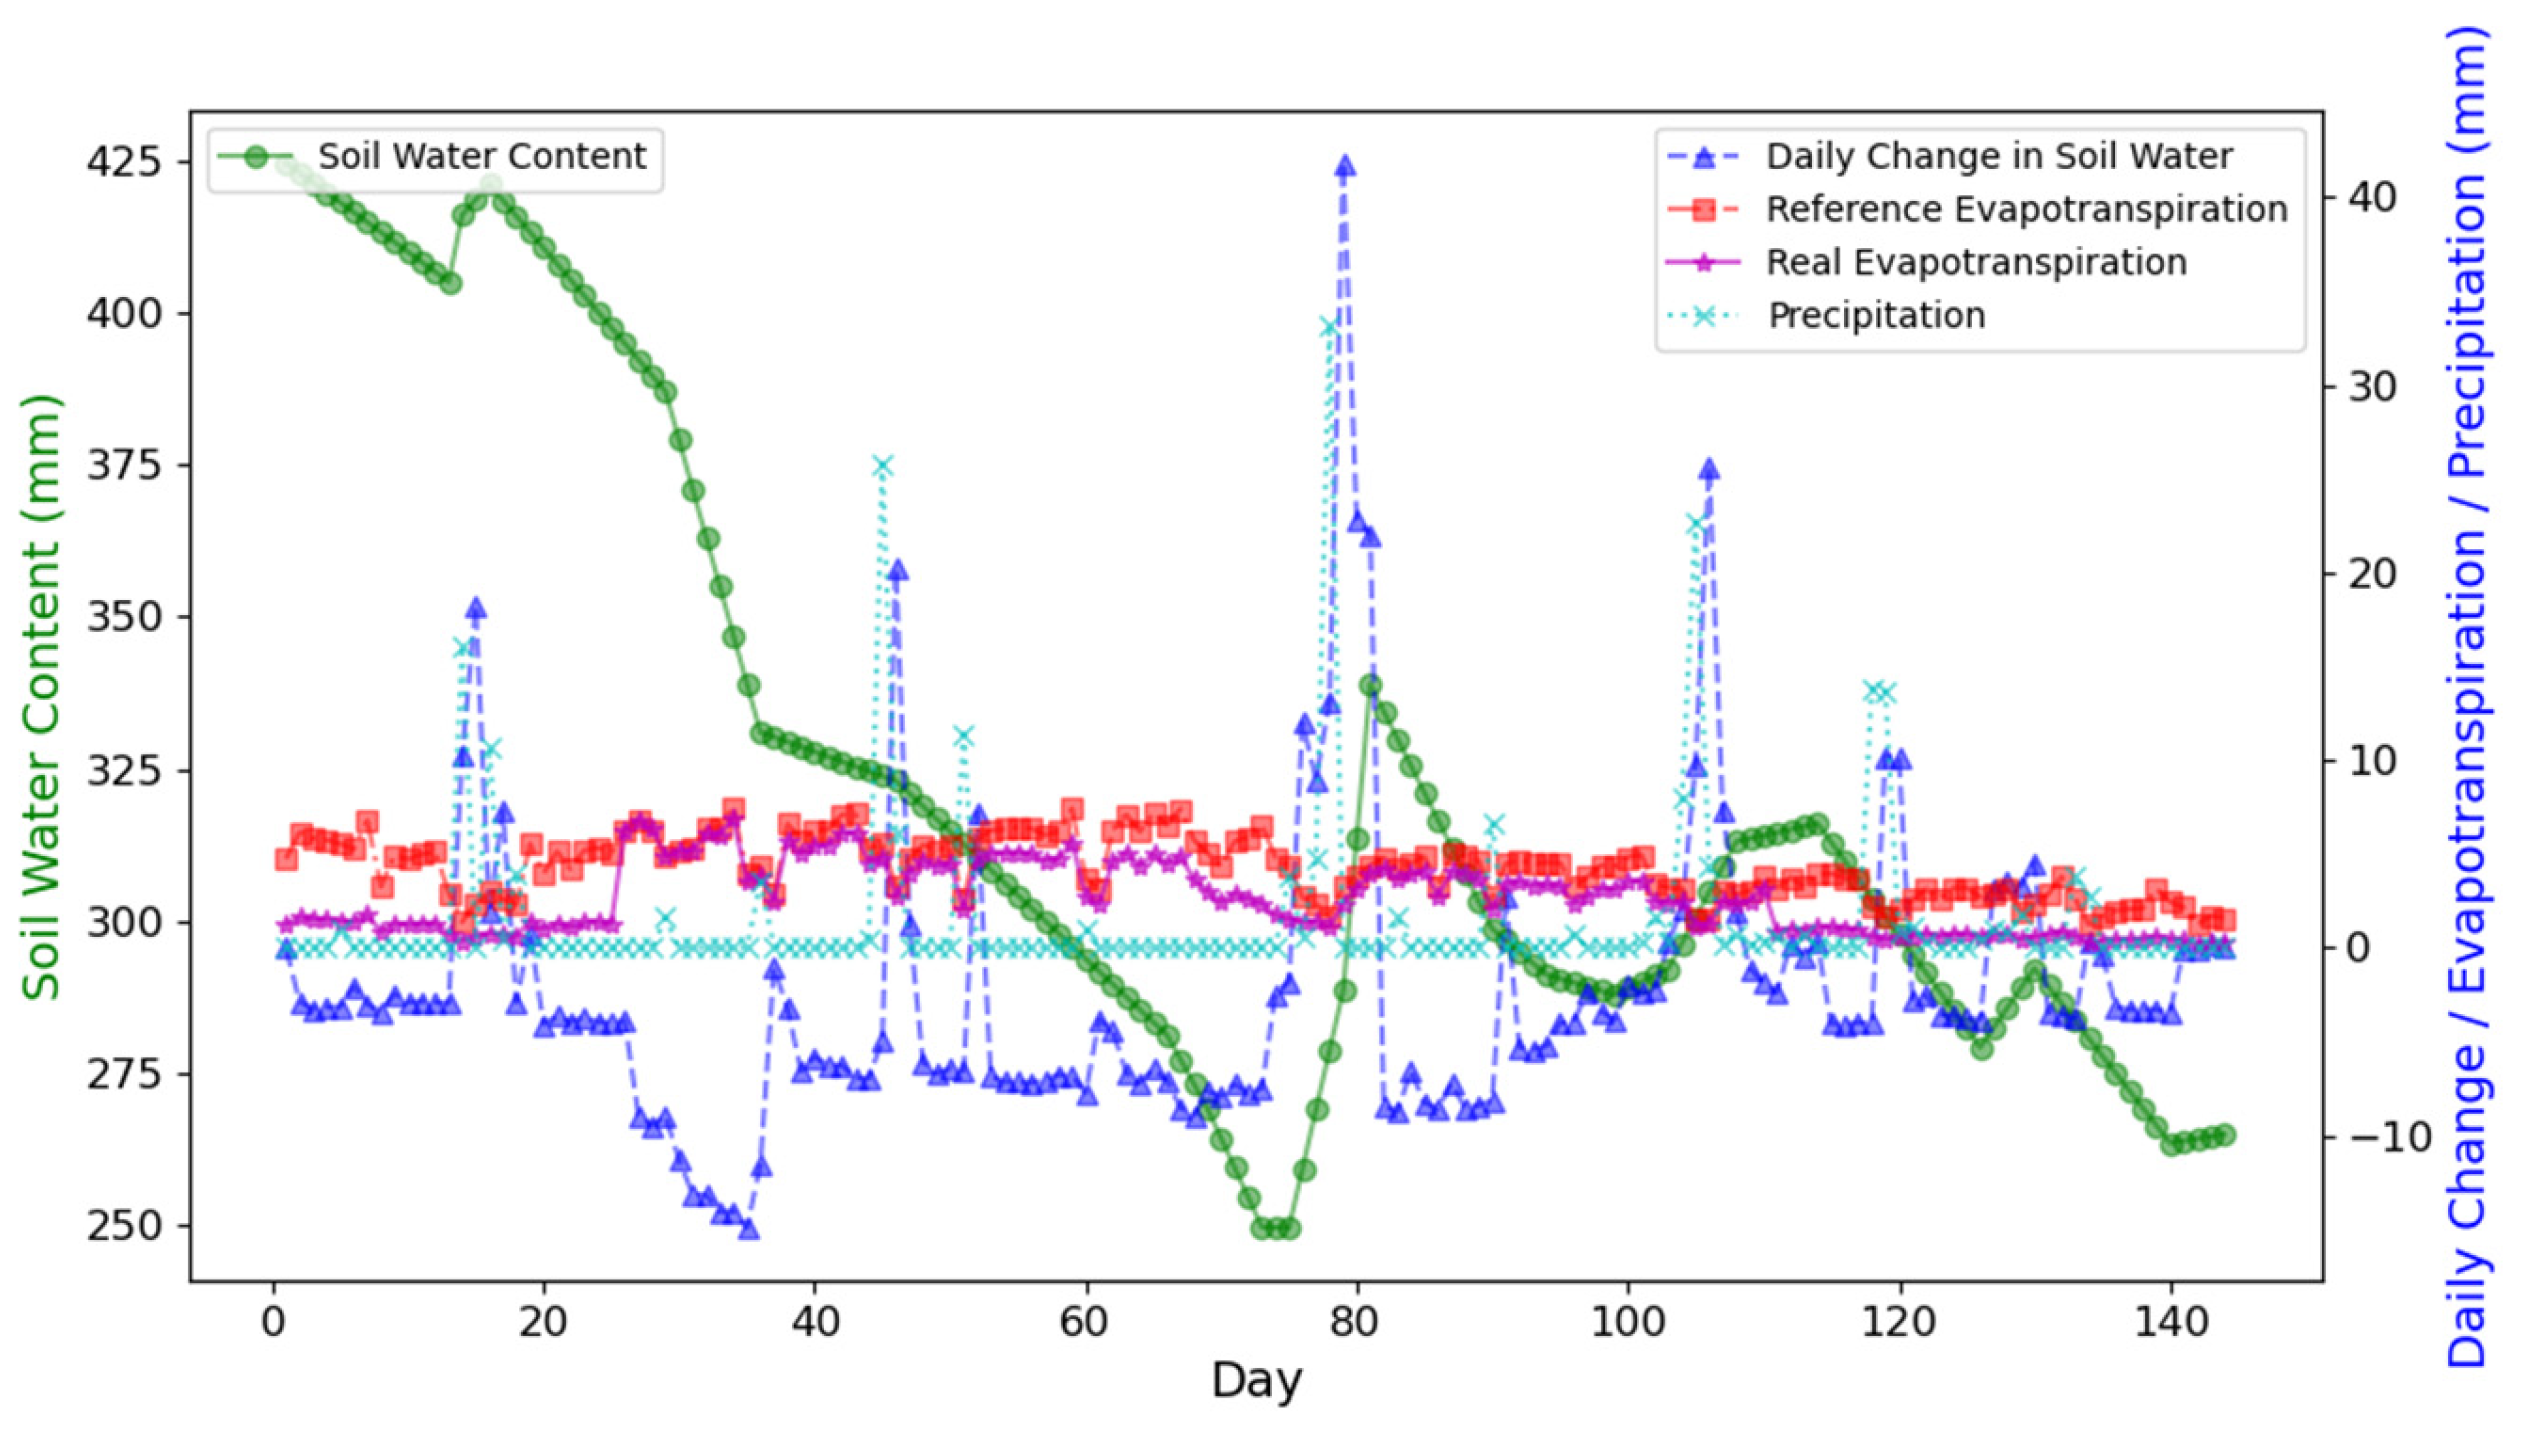
3.3. Prediction of Daily Soil Water Storage, Variables, and Crop Evapotranspiration Changes

Using daily meteorological data for the study area, the Penman–Monteith equation (Equation (4)), crop coefficients, and soil correction factors (Equation (5)), combined with the Biswas model proposed in this study and soil moisture sensors monitoring water storage in the 0–0.2 m soil layer, we analyzed the daily variations in soil water storage across the 0–2 m soil depth throughout the entire maize growing season. Our comprehensive analysis and predictions not only examined the daily depletion and replenishment of soil moisture but also quantified the reference evapotranspiration (ET₀) and actual evapotranspiration (ETₐ) for maize (Figure 6).

3.3.1. Dynamic Relationship Between Rainfall and Soil Water Storage

Between 13 May 2023 and 4 October 2023, our study identified rainfall as the primary factor influencing both soil moisture levels and crop evapotranspiration under field conditions. Rainfall varied significantly, with daily precipitation ranging from 0 mm to 33.2 mm, greatly impacting water absorption and crop growth under rainfed conditions. On days with high rainfall, soil water content increased markedly, while dry periods resulted in substantial evaporative losses. These findings align with Jaramillo (2020), who reported that rainfall intensity and frequency play a crucial role in determining soil moisture dynamics and crop health in rainfed agricultural systems [43].
Additionally, the physical and chemical properties of the soil, such as texture, porosity, and nutrient levels, affected both the retention time of soil moisture and the efficiency of water uptake by crops [44,45]. Analysis of water storage across different soil depths revealed that the 0–2 m soil layer exhibited fluctuations between 249.58 mm and 424.53 mm throughout the growing season (Figure 6). Water balance calculations indicated that soil water storage in the 0–2 m depth decreased by 174.95 mm, from 424.53 mm on May 13 to 249.58 mm on October 4, reflecting substantial variability in soil water dynamics.

3.3.2. Evaluation of Evapotranspiration and Model Accuracy

During the maize growing season, total rainfall amounted to 274.35 mm. Accounting for a 5% canopy interception, the actual evapotranspiration calculated using the water balance model was 435.58 mm [46,47]. Meanwhile, the actual evapotranspiration estimated based on measured surface soil water storage (0–0.2 m) was 390.91 mm, with a relative error of only 10.25% compared to the water balance calculation, demonstrating the high reliability of our model. Additionally, the cumulative actual evapotranspiration derived from the product of reference evapotranspiration (615.84 mm) and crop coefficients was 566.41 mm, which closely mirrored the observed field trends. These results are consistent with Kumar et al. (2023), who emphasized that combining multiparameter models with sensor-based monitoring significantly improves the precision of evapotranspiration predictions [48].

3.3.3. Soil Moisture Dynamics Across Different Depths

As shown in Figure 6, the soil water storage dynamics exhibited similar patterns across different depths. A comparison between the 0–0.6 m and 0–1.2 m layers indicated that the surface soil layers were more responsive to rainfall events, with rapid water replenishment following rain. However, these layers also experienced more pronounced moisture loss during dry spells. In contrast, soil moisture changes below 1 m were less variable, primarily influenced by crop root water uptake and soil evaporation. This observation aligns with the findings of Gebre et al. (2021), who noted that soil moisture variability depends not only on rainfall but also on root depth and water extraction efficiency [49].
Our study demonstrates that the proposed model maintains high predictive accuracy even under extreme weather events, such as consecutive rainfall or prolonged droughts, a notable improvement over traditional empirical methods. Similar studies have also shown that integrating soil moisture monitoring with advanced predictive models enhances the capacity to manage water resources effectively [50,51,52].
By dynamically monitoring and analyzing soil water storage across the 0–2 m depth, this study highlights the complex interactions between rainfall, soil physical properties, and evapotranspiration. The findings confirm that soil moisture dynamics under rainfed conditions not only affect crop growth but also significantly influence seasonal evapotranspiration patterns. Consistent with the results of Bwambale et al. (2023) and Mardani et al. (2023), our research underscores the importance of combining sensor-based monitoring with model-driven analysis to optimize water management strategies [53,54].

4. Discussion

This study proposed and validated a high-throughput method for farmland soil moisture monitoring by integrating remote soil moisture sensors with a region-specific statistical model. By leveraging the high-efficiency data collection capabilities of wireless sensor networks and the predictive power of the Biswas model, this approach achieved real-time monitoring of soil water storage across surface and deeper soil layers with excellent accuracy, cost efficiency, and scalability. This provides a robust tool for precision agriculture, supporting theoretical advancements and practical applications in water resource management.

4.1. Discussion of Surface and Deep Soil Water Storage

The study revealed a significant correlation between surface and deep soil water storage, with the strongest relationship observed at the 0–0.6 m surface depth (correlation coefficient = 0.90). This indicates that surface soil moisture can serve as a reliable predictor of deeper water dynamics. Similar findings were reported by Qu et al. (2018), who demonstrated that shallow soil moisture effectively reflects root activity and deep soil water uptake [30]. Likewise, Si et al. (2020) emphasized the crucial role of surface soil moisture in predicting subsoil water content, further validating its utility in moisture estimation [31].
The observed decline in correlation with increasing depth is consistent with findings from Liu et al. (2019), who noted that soil moisture mobility decreases with depth due to reduced hydraulic conductivity and greater dependence on soil structure and texture [55]. Additionally, Ma et al. (2020) found that root distribution significantly impacts soil moisture interactions, with shallow-rooted crops, such as maize, exhibiting tighter coupling between surface and deeper soil moisture during key growth stages [56].
The results confirm the scientific validity of using surface soil moisture as a monitoring indicator. From a practical perspective, focusing on surface layers (0–0.6 m) can reduce sensor deployment costs while maintaining prediction accuracy. Integrating root growth models with surface moisture data can further optimize predictions for different crop growth stages, improving water resource management efficiency.

4.2. Comparative Analysis of Dataset Classification

This study employed the Elbow Method to classify soil sampling points based on surface moisture characteristics, significantly enhancing the predictive performance of the Biswas model. Post-classification, prediction errors were reduced by 15–25%, and the standard deviation decreased notably. This result aligns with the findings of Nguyen et al. (2022), who demonstrated that data classification effectively improves the performance of soil moisture models, reducing errors by approximately 20% [57].
Lopez-Jimenez et al. (2022) also reported that data classification techniques can capture spatial heterogeneity in soil moisture distribution, enhancing both the stability and adaptability of predictive models [58]. This study supports these conclusions by demonstrating that dataset classification not only narrows error ranges but also stabilizes predictions across multi-layer soil depths. Furthermore, similar techniques have been explored by Salehi et al. (2021), who applied K-means clustering to group soil moisture characteristics, successfully mitigating the effects of anomalies and enhancing model accuracy [59]. In comparison, the Elbow Method used in this study is simpler, more practical, and suitable for large-scale farmland deployments, offering a balance between efficiency and performance.
Future research can integrate advanced machine learning classification methods, such as Random Forest or Support Vector Machines (SVM), to further refine classification accuracy and address the challenges posed by complex terrain and dynamic soil moisture conditions.

4.3. Application of the RANSAC Algorithm and Model Accuracy Enhancement

To address the influence of outliers on prediction accuracy, this study incorporated the RANSAC algorithm into the Biswas model. The results showed that all datasets achieved R2 values exceeding 0.97, demonstrating the algorithm’s effectiveness in identifying and excluding anomalies while ensuring accurate parameter fitting. Similar results were observed in the work of Yang et al. (2021), who applied robust regression techniques to remove noise and improve soil moisture predictions [60].
Moreover, Salehi et al. (2022) demonstrated that integrating outlier detection methods with statistical models significantly reduces prediction errors, particularly in sparse or noisy datasets [59]. This study extends their findings by combining the RANSAC algorithm with a region-specific statistical model, achieving superior accuracy and stability under complex environmental conditions.
The robustness of RANSAC under extreme weather conditions, such as continuous rainfall or prolonged drought, was further validated. For example, Jaramillo et al. (2021) highlighted the vulnerability of traditional models to anomalies during extreme weather events, emphasizing the importance of robust algorithms for maintaining prediction accuracy [43]. The findings of this study confirm that RANSAC-enhanced models can effectively address these challenges, offering reliable solutions for soil moisture monitoring in dynamic agricultural environments.

4.4. Analysis of Rainfall and Soil Moisture Dynamics

Rainfall plays a dominant role in influencing soil moisture dynamics, particularly in rainfed agricultural systems. This study found that rainfall intensity and frequency directly determine the spatial distribution and temporal dynamics of soil moisture. These findings are consistent with Nigatu et al. (2021), who demonstrated that variations in rainfall significantly affect soil moisture, particularly in shallow soil layers [61].
Nguyen et al. (2022) further emphasized the rapid response of surface soil moisture to rainfall events, noting that infiltration rates to deeper soil layers are constrained by soil texture and rainfall intensity [57]. This study observed similar trends, where surface soil moisture exhibited immediate changes following rainfall, while deeper layers responded more slowly, highlighting the importance of monitoring surface moisture for accurate water dynamics predictions.
Additionally, Yi et al. (2022) reported that during prolonged droughts, soil moisture depletion rates increase significantly, with surface layers playing a critical role in balancing soil water deficits [62]. This study confirms these observations, particularly during the maize growing season, underscoring the critical influence of rainfall on soil moisture dynamics and its implications for drought and drainage management.

4.5. Advantages and Practical Applications of the Proposed Method

The proposed method demonstrates significant advantages in accuracy, cost efficiency, and scalability compared to existing approaches. While Nguyen et al. (2022) combined remote sensing with statistical models to predict soil moisture [57], this study achieved higher accuracy (R2 > 0.97) using a simpler, sensor-based implementation, making it more practical for large-scale deployments.
By integrating dataset classification and the RANSAC algorithm, the method effectively addresses spatial heterogeneity and anomalies, reducing prediction errors by 15–25%. Similar error reductions were achieved in the work of Lopez-Jimenez et al. (2022), where classification and robust regression techniques improved model performance by 20–30% [58].
This method is particularly suitable for rainfed agriculture and water-scarce regions, enabling real-time, large-scale soil moisture monitoring to support precision irrigation and water resource management. Future research can integrate the Internet of Things (IoT) and cloud-based platforms to enable real-time data collection, processing, and decision making, further advancing intelligent water management in agriculture.

5. Conclusions and Limitations

5.1. Conclusions

This study developed an efficient and cost-effective soil moisture monitoring method that integrates wireless sensor networks with a region-specific statistical model. The proposed approach successfully achieved real-time monitoring and prediction of soil water storage from surface to deeper layers. The key findings are as follows.
(1)
Correlation Between Surface and Deep Soil Moisture
The strongest correlation was observed between the 0–0.6 m surface soil moisture and deeper soil water storage, highlighting surface moisture as a reliable indicator for predicting multi-layer water dynamics.
(2)
Effectiveness of Dataset Classification
Classifying datasets based on surface moisture characteristics significantly reduced prediction errors (by 15–25%), improving model robustness and applicability, particularly for multi-layer depth predictions.
(3)
Application of the RANSAC Algorithm
The RANSAC algorithm effectively identified and excluded outliers, improving parameter fitting and significantly enhancing prediction accuracy, with all datasets achieving R2 values exceeding 0.97.
(4)
Dominant Role of Rainfall
Rainfall intensity and frequency were identified as primary factors influencing soil moisture dynamics. The model demonstrated high stability and predictive accuracy under various weather conditions, effectively capturing soil moisture variations.
In summary, this method provides high-accuracy and low-cost technical support for farmland water monitoring, enabling effective precision irrigation and water resource management. It is particularly suited to rainfed agricultural systems and resource-limited regions, offering a scientific foundation for optimizing agricultural production and promoting sustainable development.

5.2. Limitations and Future Prospects

Despite the promising results, this study has several limitations that need to be addressed in future research.
(1)
Monitoring Frequency
Limited data were collected during the early growth stage of maize (before jointing), leaving gaps during critical periods. Future research should optimize monitoring frequency, with a focus on collecting data before and after rainfall events as well as during drought-prone stages.
(2)
Crop Applicability
This study primarily focused on maize, and the method has yet to be validated for other crops with varying root structures and water absorption characteristics. Extending the approach to different crops will help verify its generalizability and adaptability.
(3)
Spatial Scale Limitations
The study focused on soil moisture dynamics within local farmland areas. Future research should integrate remote sensing and geographic information system (GIS) technologies to expand the spatial scale, enabling soil moisture monitoring at regional or global scales.
(4)
Technological Integration
Integrating sensor networks with Internet of Things (IoT) platforms, cloud computing, and big data technologies could enhance real-time monitoring capabilities and support intelligent decision-making systems. Such advancements would improve automation and precision in water resource management.
By addressing these limitations, future research can further enhance the accuracy, adaptability, and scalability of the proposed method. This will facilitate comprehensive support for precision irrigation and water resource management across diverse crops and regions, ultimately contributing to sustainable agricultural development and efficient resource utilization.

Author Contributions

Conceptualization, Y.Z., M.H. and L.L.; methodology, Y.Z. and G.W.; software, Y.Z.; validation, Y.Z. and G.W.; formal analysis, Y.Z. and G.W.; data curation, Y.Z. and M.H.; writing—original draft preparation, Y.Z.; writing—review and editing, Y.Z.; visualization, Y.Z.; supervision, G.W.; project administration, L.L.; funding acquisition, M.H. All authors have read and agreed to the published version of the manuscript.

Funding

The research and the APC were funded by the Key Research and Development Project in Shanxi Province (No. 202202140601021) and The National Key Research and Development Program Project (No. 2021YFD1901101-5).

Institutional Review Board Statement

Not applicable.

Data Availability Statement

The original contributions presented in the study are included in the article; further inquiries can be directed to the corresponding author.

Conflicts of Interest

The authors declare no conflict of interest.

References

  1. Srivastav, A.L.; Dhyani, R.; Ranjan, M.; Madhav, S.; Sillanpää, M. Climate-resilient strategies for sustainable management of water resources and agriculture. Environ. Sci. Pollut. Res. 2021, 28, 41576–41595. [Google Scholar] [CrossRef]
  2. Nikolaou, G.; Neocleous, D.; Christou, A.; Kitta, E.; Katsoulas, N. Implementing sustainable irrigation in water-scarce regions under the impact of climate change. Agronomy 2020, 10, 1120. [Google Scholar] [CrossRef]
  3. Chen, L.; Chang, J.; Wang, Y.; Guo, A.; Liu, Y.; Wang, Q.; Zhu, Y.; Zhang, Y.; Xie, Z. Disclosing the future food security risk of China based on crop production and water scarcity under diverse socioeconomic and climate scenarios. Sci. Total Environ. 2021, 790, 148110. [Google Scholar] [CrossRef]
  4. Liu, X.; Liu, W.; Tang, Q.; Liu, B.; Wada, Y.; Yang, H. Global agricultural water scarcity assessment incorporating blue and green water availability under future climate change. Earth’s Future 2022, 10, e2021EF002567. [Google Scholar] [CrossRef]
  5. de Jong, S.M.; Heijenk, R.A.; Nijland, W.; van Der Meijde, M. Monitoring soil moisture dynamics using electrical resistivity tomography under homogeneous field conditions. Sensors 2020, 20, 5313. [Google Scholar] [CrossRef]
  6. Qin, A.; Ning, D.; Liu, Z.; Duan, A. Analysis of the accuracy of an FDR sensor in soil moisture measurement under laboratory and field conditions. J. Sens. 2021, 2021, 6665829. [Google Scholar] [CrossRef]
  7. Fang, B.; Kansara, P.; Dandridge, C.; Lakshmi, V. Drought monitoring using high spatial resolution soil moisture data over Australia in 2015–2019. J. Hydrol. 2021, 594, 125960. [Google Scholar] [CrossRef]
  8. Khellouk, R.; Barakat, A.; Boudhar, A.; Hadria, R.; Lionboui, H.; El Jazouli, A.; Rais, J.; El Baghdadi, M.; Benabdelouahab, T. Spatiotemporal monitoring of surface soil moisture using optical remote sensing data: A case study in a semi-arid area. J. Spat. Sci. 2020, 65, 481–499. [Google Scholar] [CrossRef]
  9. Zhang, Z.; Zhu, L. A review on unmanned aerial vehicle remote sensing: Platforms, sensors, data processing methods, and applications. Drones 2023, 7, 398. [Google Scholar] [CrossRef]
  10. Asadzadeh, S.; de Oliveira, W.J.; de Souza Filho, C.R. UAV-based remote sensing for the petroleum industry and environmental monitoring: State-of-the-art and perspectives. J. Pet. Sci. Eng. 2022, 208, 109633. [Google Scholar] [CrossRef]
  11. Mukhlisin, M.; Astuti, H.W.; Wardihani, E.D.; Matlan, S.J. Techniques for ground-based soil moisture measurement: A detailed overview. Arab. J. Geosci. 2021, 14, 1–34. [Google Scholar]
  12. Jabro, J.D.; Stevens, W.B.; Iversen, W.M. Comparing two methods for measuring soil bulk density and moisture content. Open J. Soil Sci. 2020, 10, 233–243. [Google Scholar] [CrossRef]
  13. Singh, A.; Gaurav, K.; Sonkar, G.K.; Lee, C.C. Strategies to measure soil moisture using traditional methods, automated sensors, remote sensing, and machine learning techniques: Review, bibliometric analysis, applications, research findings, and future directions. IEEE Access 2023, 11, 13605–13635. [Google Scholar] [CrossRef]
  14. Li, Z.L.; Leng, P.; Zhou, C.; Chen, K.S.; Zhou, F.C.; Shang, G.F. Soil moisture retrieval from remote sensing measurements: Current knowledge and directions for the future. Earth-Sci. Rev. 2021, 218, 103673. [Google Scholar]
  15. Jeong, J.; Lee, S.; Cho, S.; Kim, K.; Choi, M. Multi-scale assessment of a cosmic-ray neutron probe observation of soil moisture for surface layer applications in a mountainous forest environment. Agric. For. Meteorol. 2024, 356, 110155. [Google Scholar] [CrossRef]
  16. Rasheed, M.W.; Tang, J.; Sarwar, A.; Shah, S.; Saddique, N.; Khan, M.U.; Sultan, M. Soil moisture measuring techniques and factors affecting the moisture dynamics: A comprehensive review. Sustainability 2022, 14, 11538. [Google Scholar] [CrossRef]
  17. Li, J.; Pei, Y.; Zhao, S.; ao, R.; Sang, X.; Zhang, C. A review of remote sensing for environmental monitoring in China. Remote Sens. 2020, 12, 1130. [Google Scholar] [CrossRef]
  18. Brocca, L.; Gaona, J.; Bavera, D.; Fioravanti, G.; Puca, S.; Ciabatta, L.; Filippucci, P.; Mosaffa, H.; Esposito, G.; Roberto, N.; et al. Exploring the actual spatial resolution of 1 km satellite soil moisture products. Sci. Total Environ. 2024, 945, 174087. [Google Scholar] [CrossRef]
  19. Dari, J.; Quintana-Seguí, P.; Escorihuela, M.J.; Stefan, V.; Brocca, L.; Morbidelli, R. Detecting and mapping irrigated areas in a Mediterranean environment by using remote sensing soil moisture and a land surface model. J. Hydrol. 2021, 596, 126129. [Google Scholar] [CrossRef]
  20. Jiao, W.; Wang, L.; McCabe, M.F. Multi-sensor remote sensing for drought characterization: Current status, opportunities, and a roadmap for the future. Remote Sens. Environ. 2021, 256, 112313. [Google Scholar]
  21. Chen, J.; Chen, S.; Fu, R.; Li, D.; Jiang, H.; Wang, C.; Peng, Y.; Jia, K.; Hicks, B.J. Remote sensing big data for water environment monitoring: Current status, challenges, and future prospects. Earth’s Future 2022, 10, e2021EF002289. [Google Scholar]
  22. Acharya, B.S.; Bhandari, M.; Bandini, F.; Pizarro, A.; Perks, M.; Joshi, D.R.; Wang, S.; Dogwiler, T.; Ray, R.L.; Kharel, G.; et al. Unmanned aerial vehicles in hydrology and water management: Applications, challenges, and perspectives. Water Resour. Res. 2021, 57, e2021WR029925. [Google Scholar]
  23. Sanjeevi, P.; Prasanna, S.; Siva Kumar, B.; Gunasekaran, G.; Alagiri, I.; Vijay Anand, R. Precision agriculture and farming using Internet of Things based on wireless sensor network. Trans. Emerg. Telecommun. Technol. 2020, 31, e3978. [Google Scholar] [CrossRef]
  24. Lloret, J.; Sendra, S.; Garcia, L.; Jimenez, J.M. A wireless sensor network deployment for soil moisture monitoring in precision agriculture. Sensors 2021, 21, 7243. [Google Scholar] [CrossRef]
  25. Gsangaya, K.R.; Hajjaj, S.S.H.; Sultan, M.T.H.; Hua, L.S. Portable, wireless, and effective Internet of Things-based sensors for precision agriculture. Int. J. Environ. Sci. Technol. 2020, 17, 3901–3916. [Google Scholar]
  26. Yu, L.; Tao, S.; Ren, Y.; Gao, W.; Liu, X.; Hu, Y.; Shamshiri, R.R. Comprehensive evaluation of soil moisture sensing technology applications based on analytic hierarchy process and Delphi. Agriculture 2021, 11, 1116. [Google Scholar] [CrossRef]
  27. Placidi, P.; Morbidelli, R.; Fortunati, D.; Papini, N.; Gobbi, F.; Scorzoni, A. Monitoring soil and ambient parameters in the IoT precision agriculture scenario: An original modeling approach dedicated to low-cost soil water content sensors. Sensors 2021, 21, 5110. [Google Scholar] [CrossRef]
  28. Li, W.; Awais, M.; Ru, W.; Shi, W.; Ajmal, M.; Uddin, S.; Liu, C. Review of sensor network-based irrigation systems using IoT and remote sensing. Adv. Meteorol. 2020, 2020, 8396164. [Google Scholar]
  29. Levintal, E.; Ganot, Y.; Taylor, G.; Freer-Smith, P.; Suvocarev, K.; Dahlke, H.E. An underground, wireless, open-source, low-cost system for monitoring oxygen, temperature, and soil moisture. SOIL Discuss. 2021, 2021, 1–22. [Google Scholar]
  30. Qu, T.; Li, Y.; Zhao, Q.; Yin, Y.; Wang, Y.; Li, F.; Zhang, W. Drone-based multispectral remote sensing inversion for typical crop soil moisture under dry farming conditions. Agriculture 2024, 14, 484. [Google Scholar] [CrossRef]
  31. Si, S.; Li, D. Study on the inversion model of deep soil moisture content in the Lower Yellow River Diversion Irrigation Area. People’s Yellow River 2023, 45, 124–127+142. [Google Scholar]
  32. Wu, D.; Wang, T.; Di, C.; Wang, L.; Chen, X. Investigation of controls on the regional soil moisture spatiotemporal patterns across different climate zones. Sci. Total Environ. 2020, 726, 138214. [Google Scholar]
  33. de Queiroz, M.G.; da Silva, T.G.F.; Zolnier, S.; Jardim, A.M.D.R.F.; de Souza, C.A.A.; Júnior, G.D.N.A.; de Souza, L.S.B. Spatial and temporal dynamics of soil moisture for surfaces with a change in land use in the semi-arid region of Brazil. Catena 2020, 188, 104457. [Google Scholar]
  34. McColl, K.A. Practical and theoretical benefits of an alternative to the Penman-Monteith evapotranspiration equation. Water Resour. Res. 2020, 56, e2020WR027106. [Google Scholar]
  35. Li, Y.; Qin, Y.; Rong, P. Evolution of potential evapotranspiration and its sensitivity to climate change based on the Thornthwaite, Hargreaves, and Penman–Monteith equation in environmentally sensitive areas of China. Atmos. Res. 2022, 273, 106178. [Google Scholar]
  36. Dingre, S.K.; Gorantiwar, S.D. Determination of the water requirement and crop coefficient values of sugarcane by field water balance method in semiarid region. Agric. Water Manag. 2020, 232, 106042. [Google Scholar]
  37. Guo, H.; Li, S.; Kang, S.; Du, T.; Tong, L.; Hao, X.; Ding, R. Crop coefficient for spring maize under plastic mulch based on 12-year eddy covariance observation in the arid region of Northwest China. J. Hydrol. 2020, 588, 125108. [Google Scholar]
  38. Marwa, M.A.; El-Shafie, A.F.; Dewedar, O.M.; Molina-Martinez, J.M.; Ragab, R. Predicting the water requirement, soil moisture distribution, yield, and water productivity of peas and the impact of climate change using the SALTMED model. Plant Arch. 2020, 20, 3673–3689. [Google Scholar]
  39. Pereira, L.S.; Paredes, P.; López-Urrea, R.; Hunsaker, D.J.; Mota, M.; Shad, Z.M. Standard single and basal crop coefficients for vegetable crops: An update of the FAO56 crop water requirements approach. Agric. Water Manag. 2021, 243, 106196. [Google Scholar]
  40. Pereira, L.S.; Paredes, P.; Hunsaker, D.J.; López-Urrea, R.; Shad, Z.M. Standard single and basal crop coefficients for field crops: Updates and advances to the FAO56 crop water requirements method. Agric. Water Manag. 2021, 243, 106466. [Google Scholar]
  41. Xu, L.; Chen, N.; Zhang, X.; Moradkhani, H.; Zhang, C.; Hu, C. In-situ and triple-collocation-based evaluations of eight global root zone soil moisture products. Remote Sens. Environ. 2021, 254, 112248. [Google Scholar]
  42. Pereira, L.S.; Paredes, P.; Jovanovic, N. Soil water balance models for determining crop water and irrigation requirements and irrigation scheduling focusing on the FAO56 method and the dual Kc approach. Agric. Water Manag. 2020, 241, 106357. [Google Scholar]
  43. Jaramillo, S.; Graterol, E.; Pulver, E. Sustainable transformation of rainfed to irrigated agriculture through water harvesting and smart crop management practices. Front. Sustain. Food Syst. 2020, 4, 437086. [Google Scholar]
  44. Wang, L.; He, Z.; Zhao, W.; Wang, C.; Ma, D. Fine soil texture is conducive to crop productivity and nitrogen retention in irrigated cropland in a desert-oasis ecotone, Northwest China. Agronomy 2022, 12, 1509. [Google Scholar] [CrossRef]
  45. Kang, M.W.; Yibeltal, M.; Kim, Y.H.; Oh, S.J.; Lee, J.C.; Kwon, E.E.; Lee, S.S. Enhancement of soil physical properties and soil water retention with biochar-based soil amendments. Sci. Total Environ. 2022, 836, 155746. [Google Scholar]
  46. Zhang, Q.; Lv, X.; Yu, X.; Ni, Y.; Ma, L.; Liu, Z. Species and spatial differences in vegetation rainfall interception capacity: A synthesis and meta-analysis in China. Catena 2022, 213, 106223. [Google Scholar]
  47. Grunicke, S.; Queck, R.; Bernhofer, C. Long-term investigation of forest canopy rainfall interception for a spruce stand. Agric. For. Meteorol. 2020, 292, 108125. [Google Scholar]
  48. Kumar, P.; Udayakumar, A.; Anbarasa Kumar, A.; Senthamarai Kannan, K.; Krishnan, N. Multiparameter optimization system with DCNN in precision agriculture for advanced irrigation planning and scheduling based on soil moisture estimation. Environ. Monit. Assess. 2023, 195, 13. [Google Scholar]
  49. Gebre, M.G.; Earl, H.J. Soil water deficit and fertilizer placement effects on root biomass distribution, soil water extraction, water use, yield, and yield components of soybean [Glycine max (L.) Merr.] grown in 1-m rooting columns. Front. Plant Sci. 2021, 12, 581127. [Google Scholar] [CrossRef] [PubMed]
  50. Ahmed, S.S.; Bali, R.; Khan, H.; Mohamed, H.I.; Sharma, S.K. Improved water resource management framework for water sustainability and security. Environ. Res. 2021, 201, 111527. [Google Scholar]
  51. Gupta, A.D.; Pandey, P.; Feijóo, A.; Yaseen, Z.M.; Bokde, N.D. Smart water technology for efficient water resource management: A review. Energies 2020, 13, 6268. [Google Scholar] [CrossRef]
  52. Bwambale, E.; Abagale, F.K.; Anornu, G.K. Smart irrigation monitoring and control strategies for improving water use efficiency in precision agriculture: A review. Agric. Water Manag. 2022, 260, 107324. [Google Scholar]
  53. Bwambale, E.; Abagale, F.K.; Anornu, G.K. Data-driven model predictive control for precision irrigation management. Smart Agric. Technol. 2023, 3, 100074. [Google Scholar] [CrossRef]
  54. Mardani Korani, Z.; Moin, A.; Rodrigues da Silva, A.; Ferreira, J.C. Model-driven engineering techniques and tools for machine learning-enabled IoT applications: A scoping review. Sensors 2023, 23, 1458. [Google Scholar] [CrossRef] [PubMed]
  55. Liu, L.; Lu, Y.; Fu, Y.; Horton, R.; Ren, T. Estimating soil water suction from texture, bulk density and electrical resistivity. Geoderma 2022, 409, 115630. [Google Scholar]
  56. Ma, T.; Zeng, W.; Lei, G.; Wu, J.; Huang, J. Predicting the rooting depth, dynamic root distribution and the yield of sunflower under different soil salinity and nitrogen applications. Ind. Crops Prod. 2021, 170, 113749. [Google Scholar]
  57. Nguyen, T.T.; Ngo, H.H.; Guo, W.; Chang, S.W.; Nguyen, D.D.; Nguyen, C.T.; Hoang, N.B. A low-cost approach for soil moisture prediction using multi-sensor data and machine learning algorithm. Sci. Total Environ. 2022, 833, 155066. [Google Scholar] [PubMed]
  58. Lopez-Jimenez, J.; Vande Wouwer, A.; Quijano, N. Dynamic modeling of crop–soil systems to design monitoring and automatic irrigation processes: A review with worked examples. Water 2022, 14, 889. [Google Scholar] [CrossRef]
  59. Salehi, B.; Jarahizadeh, S.; Sarafraz, A. An improved RANSAC outlier rejection method for UAV-derived point cloud. Remote Sens. 2022, 14, 4917. [Google Scholar] [CrossRef]
  60. Yang, J.; Huang, Z.; Quan, S.; Zhang, Q.; Zhang, Y.; Cao, Z. Toward efficient and robust metrics for RANSAC hypotheses and 3D rigid registration. IEEE Trans. Circuits Syst. Video Technol. 2021, 32, 893–906. [Google Scholar]
  61. Nigatu, Z.M.; Fan, D.; You, W.; Melesse, A.M.; Pu, L.; Yang, X.; Jiang, Z. Crop production response to soil moisture and groundwater depletion in the Nile Basin based on multi-source data. Sci. Total Environ. 2022, 825, 154007. [Google Scholar] [CrossRef] [PubMed]
  62. Yi, J.; Li, H.; Zhao, Y.; Zhang, H.; Liu, M. Assessing soil water balance to optimize irrigation schedules of flood-irrigated maize fields with different cultivation histories in the arid region. Agric. Water Manag. 2022, 265, 107543. [Google Scholar] [CrossRef]
Figure 1. Geographical location and topographical characteristics of the research site, including elevation, landform features, and surrounding environmental context.
Agriculture 15 00344 g001
Figure 2. Schematic diagram of the low-cost LoRa wireless soil moisture monitoring system. The red solid spheres represent wireless moisture sensors monitoring soil moisture content in the topsoil layer (0–20 cm). The red stars indicate the LoRa gateway, the server layer, and the data communication layer, which control data collection and transmit data to the nearest 4G ground base station.
Agriculture 15 00344 g002
Figure 3. Determination of the optimal number of clusters using the Elbow Method (left) and the spatial distribution of soil moisture clusters (right) derived from K-means clustering. The units on the right plot represent soil moisture content (%) across the study area.
Agriculture 15 00344 g003
Figure 4. Process of identifying and removing outliers from soil moisture data to ensure accurate model fitting and evaluation.
Agriculture 15 00344 g004
Figure 5. Cumulative probability distribution of relative errors between predicted and measured soil moisture values across different depths (0–0.2 m, 0.2–0.4 m, and deeper layers). The figure illustrates the accuracy of the Biswas model in predicting soil moisture dynamics, with relative error (%) as the evaluation metric.
Agriculture 15 00344 g005
Figure 6. Daily variations in soil water storage, reference crop evapotranspiration, actual evapotranspiration, and soil water dynamics throughout the maize growth cycle. The figure highlights the relationships between surface soil moisture monitoring and crop water consumption, providing insights into water storage changes and evapotranspiration processes. Units: soil water storage (mm), evapotranspiration (mm/day).
Agriculture 15 00344 g006
Table 1. Soil moisture content (volumetric percentage) measured at various soil layers (0–2.0 m) during different crop growth stages.
Sampling MethodSampling TimeNumber of Sampling Points and Soil Layers
Sensor measurement5.14, 7.14, 7.18, 7.21, 7.25, 7.27, 7.31, 8.2, 8.11, 8.15, 8.20, 8.24, 8.29, 9.4, 9.16, 9.20, 9.30, 10.5Random selection of 9 points, 0–0.1 m, 0.1–0.2 m
Manual measurement5.14, 7.21, 8.11, 8.29, 9.16, 9.28, 10.6Random selection of 3 points, 0–0.1 m, 0.1–0.2 m, 0.2–0.4 m, 0.4–0.6 m, 0.6–0.8 m, 0.8–1.0 m, 1.0–1.2 m, 1.2–1.4 m, 1.4–1.6 m, 1.6–1.8 cm, 1.8–2.0 m
Table 2. Correlation coefficients between surface soil water storage (0–0.2 m and 0–0.4 m) and water storage at various deeper soil layers (0.2–2.0 m).
Soil Depth/m0–0.40–0.60–0.80–1.00–1.20–1.40–1.60–1.80–2.0
0–0.20.89 **0.83 **0.73 **0.73 **0.70 **0.71 **0.73 **0.60 **0.56 **
0–0.41.00 **0.90 **0.85 **0.85 **0.81 **0.83 **0.85 **0.71 **0.68 **
Note: ** denotes significance at the 0.01 level.
Table 3. Results of parameter fitting and evaluation of the Biswas model after outlier removal based on four distinct soil moisture datasets.
Dataset Category ABScR2
Category 1Parameter Value132.7840.0−15.7680.984
Significance Levelp < 0.01-p < 0.01p < 0.01
Category 2Parameter Value104.4780.76010.8310.983
Significance Levelp < 0.01p < 0.01p < 0.01p < 0.01
Category 3Parameter Value88.0690.57819.1210.979
Significance Levelp < 0.01p < 0.01p < 0.01p < 0.01
Category 4Parameter Value119.7760.3870.8280.977
Significance Levelp < 0.01p < 0.01p < 0.01p < 0.01
Disclaimer/Publisher’s Note: The statements, opinions and data contained in all publications are solely those of the individual author(s) and contributor(s) and not of MDPI and/or the editor(s). MDPI and/or the editor(s) disclaim responsibility for any injury to people or property resulting from any ideas, methods, instructions or products referred to in the content.

