Article

Dynamic Water and Fertilizer Management Strategy for Greenhouse Tomato Based on Morphological Characteristics

1
School of Agricultural Engineering, Jiangsu University, Zhenjiang 212013, China
2
Key Laboratory of Modern Agricultural Equipment and Technology, Ministry of Education, Jiangsu University, Zhenjiang 212013, China
*
Author to whom correspondence should be addressed.
Agriculture 2025, 15(3), 304; https://doi.org/10.3390/agriculture15030304
Submission received: 4 December 2024 / Revised: 28 January 2025 / Accepted: 28 January 2025 / Published: 30 January 2025

Abstract

:
A dynamic management strategy for water and fertilizer application based on morphological characteristics was developed to enhance water use efficiency (WUE) and fruit yield in greenhouse-cultivated tomato (Solanum lycopersicum L.). Multivariate regression analysis was employed to determine the baseline water and fertilizer requirements and to evaluate the effects of varying irrigation and fertilization regimes on fruit yield and WUE. A coupled irrigation–fertilization experiment was conducted, and regression models were established to describe the changes in stem diameter and plant height under these regimes. These models were validated experimentally. The results showed that irrigation significantly influenced both tomato fruit yield and WUE, while fertilization significantly impacted yield, but not WUE. No interactive effects between irrigation and fertilization were observed for either parameter. Stem diameter and plant height were positively correlated with the irrigation and fertilization levels. The proposed dynamic management strategy improved fruit yield by 6.9% and 14.7% under the basic and well-irrigated/fertilized conditions, respectively, compared to that of the fixed regime. Furthermore, model implementation increased WUE by 6.93% and 43.17% and improved the economic benefits by 4.9% and 20.6% under the respective conditions. This provides a practical and effective tool for optimizing water and fertilizer management in greenhouse tomato production, contributing to resource-efficient and high-yield farming practices.

1. Introduction

Irrigation and fertilization are important for the growth of greenhouse tomato (Solanum lycopersicum L.) [1,2]. With the increasing production of greenhouse tomato in China, traditional irrigation and excessive fertilization are becoming serious problems. Such phenomena not only cause the waste of resources and environmental pollution, but also decrease crop yield and quality [3,4,5]. Therefore, optimizing the irrigation and fertilization strategies is crucial for improving tomato productivity, enhancing the fruits’ quality, and maximizing water use efficiency (WUE) [6,7,8].
Recognizing the significant coupled effects of irrigation and fertilization on greenhouse tomato growth [9,10,11], it is essential to develop integrated management strategies that optimize both these inputs. Previous research has explored various approaches to address this challenge. For example, Ramachandran et al. [12] developed an intelligent automatic irrigation system based on the ThingSpeak cloud platform utilizing sensor data to inform irrigation scheduling. Sun Ya’nan et al. [1] evaluated the effects of different irrigation, fertilization, and aeration levels on tomato yield and quality employing Principal Component Analysis (PCA) and the Technique for Order Preference by Similarity to Ideal Solution (TOPSIS) to identify the optimal treatment combinations. Mingzhi et al. [13,14,15,16] investigated the relationship between water–fertilizer regimes and greenhouse tomato growth and yield using multiple regression analysis. While these studies provide valuable insights into optimizing water and fertilizer management, they often rely on indirect indicators or predefined schedules, lacking direct feedback from the real-time crop growth status [17]. This can lead to either water and nutrient deficits or over-application, ultimately hindering the yield potential and reducing WUE [18].
To address this limitation, a novel dynamic water and fertilizer management strategy for greenhouse tomato production is proposed based on direct feedback from key plant growth parameters. Compared to phenotypic information, such as images [19,20] or plant electrical characteristics [21,22], plant height and stem diameter are more reliable indicators of real-time growth and reflect the overall physiological status of tomato plants more accurately [23,24,25]. In this study, plant height and stem diameter changes are used as the key indicators of tomato growth. The Penman–Monteith model, a widely accepted standard for estimating crop water requirements, is utilized to determine the baseline daily water needs, while a tailored approach is used to define the basal fertilizer application amount. The interactive effects of irrigation and fertilization on yield and WUE are then analyzed to refine these baseline inputs. Furthermore, the changes in plant height and stem diameter in response to different irrigation and fertilization regimes are quantified, and the deviation between the observed growth rate and the predefined standard growth rate is used to characterize the real-time water and nutrient status. This information is then integrated into the dynamic management strategy to adjust the water and fertilizer applications, ensuring that they are precisely tailored to meet the evolving needs of the plants throughout their growth cycle.
The primary objectives of this study are to (1) investigate the impact of different irrigation and fertilization regimes on the WUE and fruit yield of greenhouse tomatoes and (2) develop and validate a dynamic water and fertilizer application decision model based on real-time plant growth parameters, specifically plant height and stem diameter, to optimize resource use and improve tomato production in greenhouse environments.

2. Materials and Methods

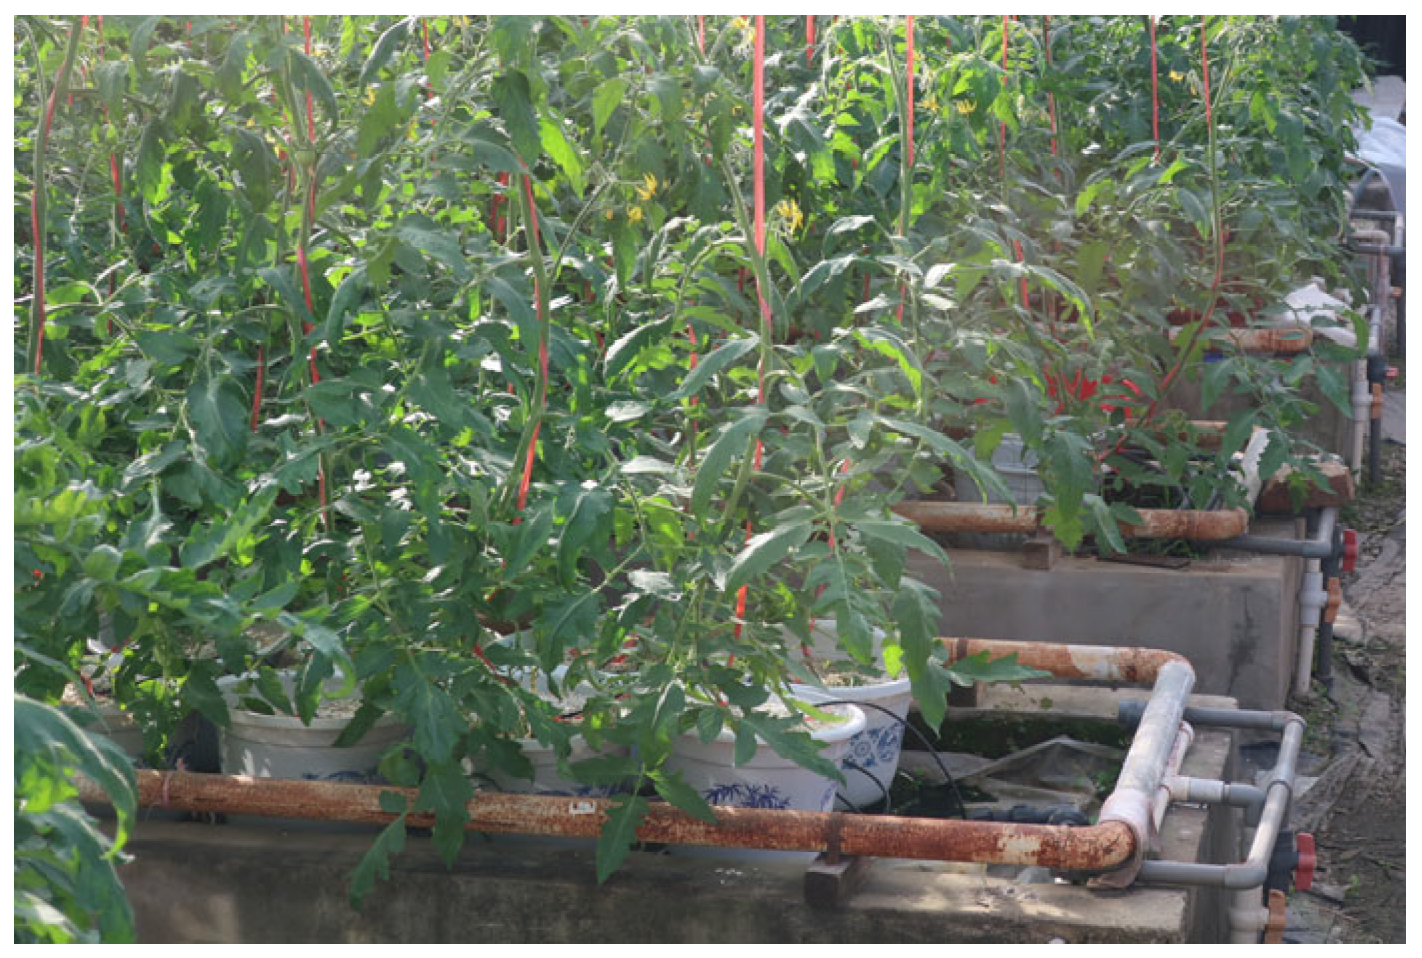
2.1. Experimental Site and Plant Material

This experiment was conducted in a Venlo-type glass greenhouse located at Jiangsu University (Figure 1) in Zhenjiang (119°10′ E, 31°56′ N, 23 m a.s.l.), China. The experimental greenhouse, a rectangular structure with a footprint of 32 m by 20 m, was oriented with its long axis running north–south to align with prevailing winds. This 3.8 m high greenhouse relied solely on passive ventilation; side panels and roof vents were opened to allow for natural air exchange. No artificial heating was employed during this study.
Tomato cultivar ‘903 Red’ (Shanghai Long Seed Tomato Seed Co., Ltd., Shanghai, China) was selected for the study. The plants were grown hydroponically using a standard Yamazaki tomato nutrient solution formulated for optimal tomato growth [26]. To ensure independent water and nutrient supplies, each tomato plant was grown in its own pot with perlite as the substrate. Excess nutrient solutions were collected in a drainage tray under each pot, preventing any exchange between the plants.

2.2. Nutrient Solution Composition

The nutrient solution was maintained at a pH of 6.5–6.8. The standard nutrient solution formulation (denoted as F0) contained the following components: 354 mg/L calcium nitrate, 404 mg/L potassium nitrate, 77 mg/L potassium dihydrogen phosphate, 246 mg/L manganese sulfate, 40 mg/L NaFeEDTA, 2.86 mg/L boric acid, 2.13 mg/L manganese sulfate, 0.22 mg/L zinc sulfate, 0.08 mg/L copper sulfate, and 0.02 mg/L ammonium molybdate.

2.3. Greenhouse Environmental Monitoring and Plant Growth Measurements

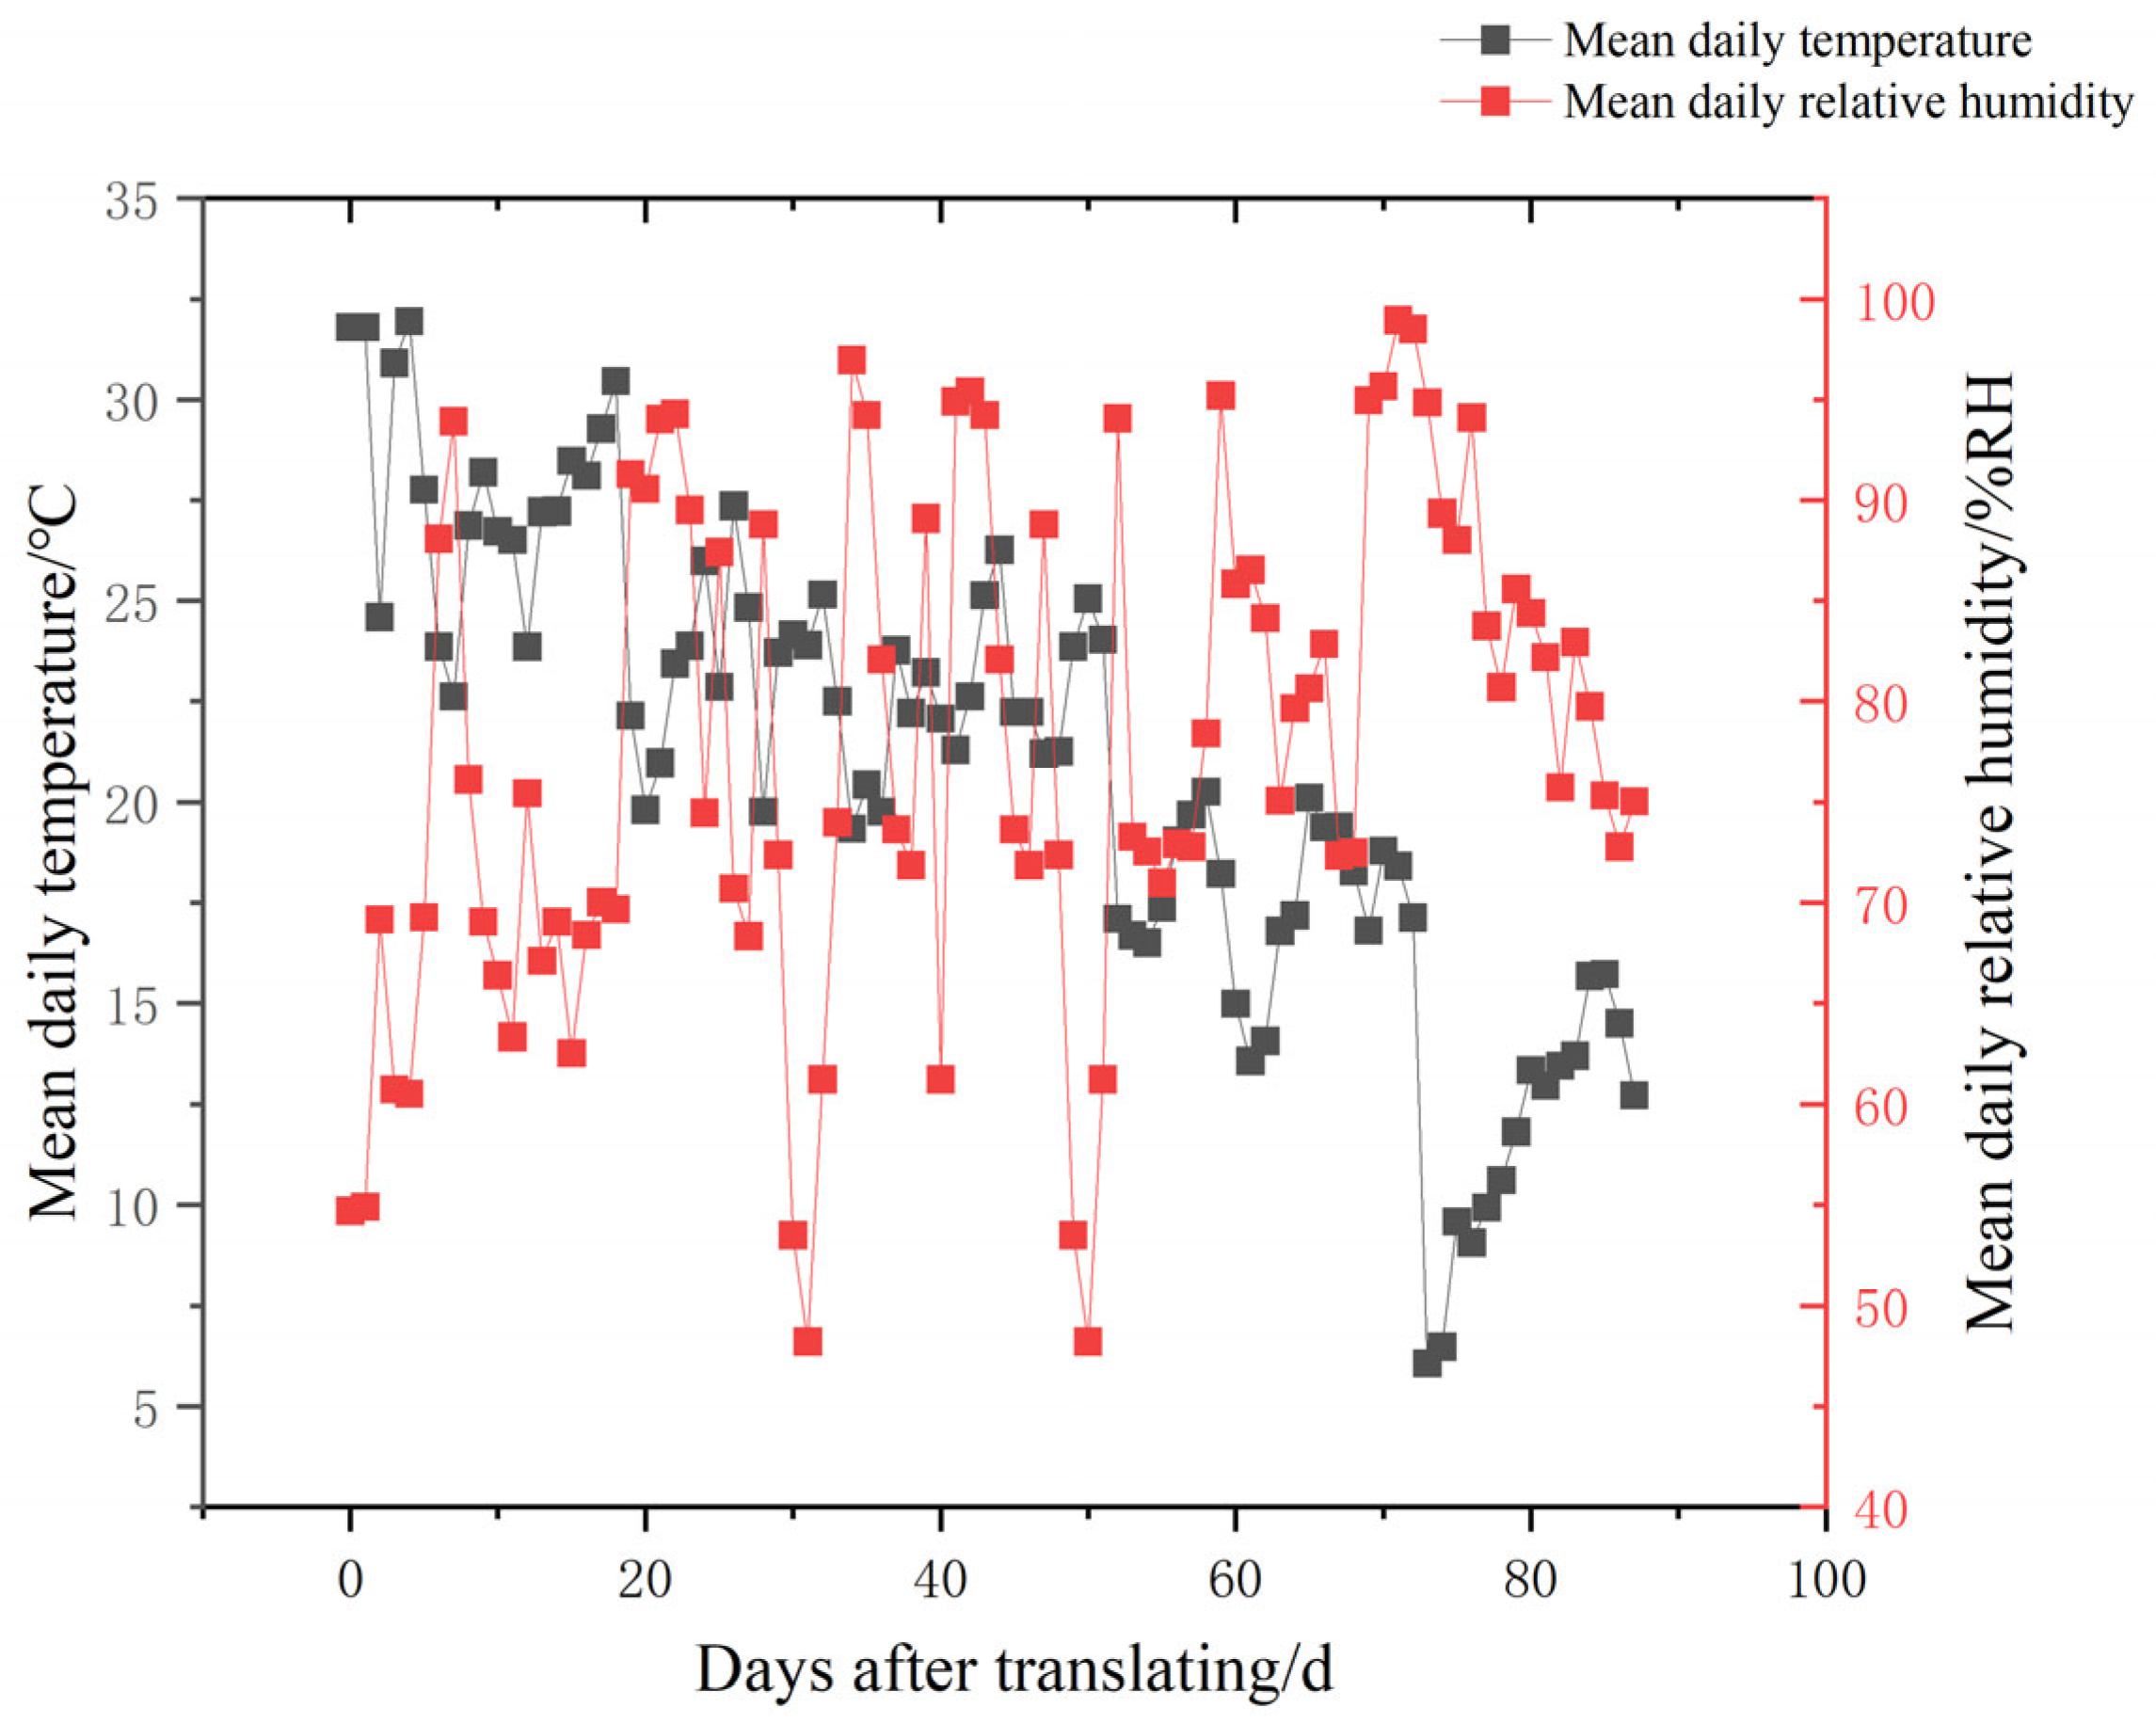
2.3.1. Environmental Data Acquisition

An automatic weather station (SP200, LSI LASTEM, Milan, Italy) was used to monitor and record environmental parameters inside the greenhouse. The data on air temperature, relative humidity, light intensity, carbon dioxide concentration, soil temperature, and soil water content were collected daily.

2.3.2. Plant Height and Stem Diameter Measurements

Plant height was manually measured daily using a tape measure (3M, Hoechstmass, Sulzbach, Germany). Measurements were taken from the base of the plant to the highest point. Tomato stem diameter was measured using a stem diameter sensor (DD-S, Ecomatik, Dachau, Germany) connected to a data logger (DL15, Ecomatik, Dachau, Germany). Sensors were positioned 10 cm above the substrate surface [27]. Stem diameter measurements were recorded automatically each day.

2.3.3. Growth Rate Calculations

The weekly variation rates of stem diameter (WVRSD, cm/7d) and plant height (WVRPH, cm/7d) were calculated as the difference in stem diameter and plant height, respectively, measured over a one-week interval.

2.4. Determination of Reference Irrigation and Fertilization Amounts

2.4.1. Reference Irrigation Evapotranspiration

Reference evapotranspiration (ET0) was calculated using Equation (1) [28].
E T 0 = 0.408 Δ R n G + γ 900 T   +   273 u 2 e a e d Δ + γ 1 + 0.34 u 2
where E T 0 is reference evapotranspiration, mm/d; Δ is the tangent slope of temperature and saturation vapor pressure curve at T, kPa/°C; Rn is net radiation, MJ/m2∙d; G is soil heat flux, MJ/m2∙d; γ is hygrometer constant, kPa/°C; T is the mean temperature, °C; u2 is wind speed at 2 m above ground, m/s; ea is saturation vapor pressure, kPa; and ed is actual vapor pressure, kPa.

2.4.2. Reference Irrigation Amount Calculation

The daily irrigation amount for each treatment was determined using Equation (2):
Q w i = E T 0 × K c a d j u s t e d
where Q w i is the amount of reference irrigation required for tomato at different growth stages, mL/plant; K c a d j u s t e d is the adjusted crop coefficient of tomato at different growth stages, mL/mm∙plant. Because the tomatoes were grown in pots within the greenhouse, rather than in an open field, the crop coefficient values were adjusted. Specifically, K c a d j u s t e d was set to 45 for the seedling stage, 90 for the flowering and fruit-setting stage, 110 for the fruit development stage, and 95 for the harvest stage.

2.4.3. Crop Coefficient Adjustment for Potted Tomato Plants

Standard crop coefficients are typically derived from field studies and may not be directly applicable to potted plants grown in greenhouses due to differences in evaporative demand and microclimatic conditions, particularly “bouquet” and “oasis” effects. The “bouquet” effect refers to increased evapotranspiration from plants in pots due to their leaves extending beyond the pot’s limits, effectively increasing the vegetation area. Conversely, the “oasis” effect describes the micro-advection of hot, dry air from surrounding areas into the wet canopy zone, further enhancing evapotranspiration. To address these discrepancies and improve the accuracy of our irrigation calculations, we adjusted the crop coefficient values based on the methodology proposed by Harel et al. [29], incorporating modifications to account for the specific conditions of our pot experiment.
The adjusted crop coefficient values were calculated using Equation (3):
K c a d j u s t e d = K c 0 × A c × C F × C c _ l
where K c 0 is the base crop coefficient for each growth stage, as proposed by Harel et al. [29]. These values are 0.3 for the seedling stage, 0.57 for the flowering and fruit-setting stage, 1.0 for the fruit development stage, and 0.95 for the harvest stage. A c is a characteristic area representing the effective area of evapotranspiration for a single potted plant. In this study, A c was calculated as the area of a circle with a radius equal to the pot’s diameter (20 cm), resulting in a value four times greater than the actual pot surface area (i.e., A c = πd2 = π(20 cm)2 = 1256.64 cm2 = 0.125664 m2). This approach was adopted to account for the “bouquet” effect of the plant canopy extending beyond the pot’s physical boundaries; CF is an empirically derived area correction factor related to tomato growth patterns and pruning practices. Preliminary experiments determined the following CF values: 1.2 for the seedling stage, 1.25 for the flowering and fruit-setting stage, 0.88 for the fruit development stage, and 0.91 for the harvest stage. C c _ l represents the conversion constant between cubic meters and liters, equal to 1000 L/m3.
Example calculation (flowering and fruit-setting stage):
For a plant in the flowering and fruit-setting stage, the adjusted crop coefficient was calculated as follows:
K c a d j u s t e d = 0.57 × 0.125664   m 2 ×   1.25 × 1000   L / m 3 = 89.54   approx .   90   mL / mm   plant .
This adjusted crop coefficient value was then used in Equation (2) to convert the reference evapotranspiration ( E T 0 , in mm) into an irrigation volume (in mL/plant) for each specific growth stage and treatment.

2.4.4. Fertilization Amount Calculation

The daily fertilization amount for each treatment was determined using Equation (4):
Q f i = F 0 × K c
where Q f i is the amount of reference fertilization required for tomato at the different growth and development stages, g/plant.

2.5. Prediction of Plant Height and Stem Diameter

2.5.1. Plant Height Prediction

Daily predicted plant height was calculated using a logistic growth model based on cumulative effective accumulated temperature (Equations (5) and (6)) [30].
  H C = 198.9775 1 + exp 3.493 0.0035 P T ( 0 < P T < R T T + 110 )
H C = 198.9775 1 + exp 3.493 0.0035 R T T + 110 ( P T > R T T + 110 )
where H C is the predicted value of plant height, cm; P T is the cumulative effective accumulated temperature for the whole growth stage, °C; and R T T is the cumulative effective accumulated temperature until topping, °C.

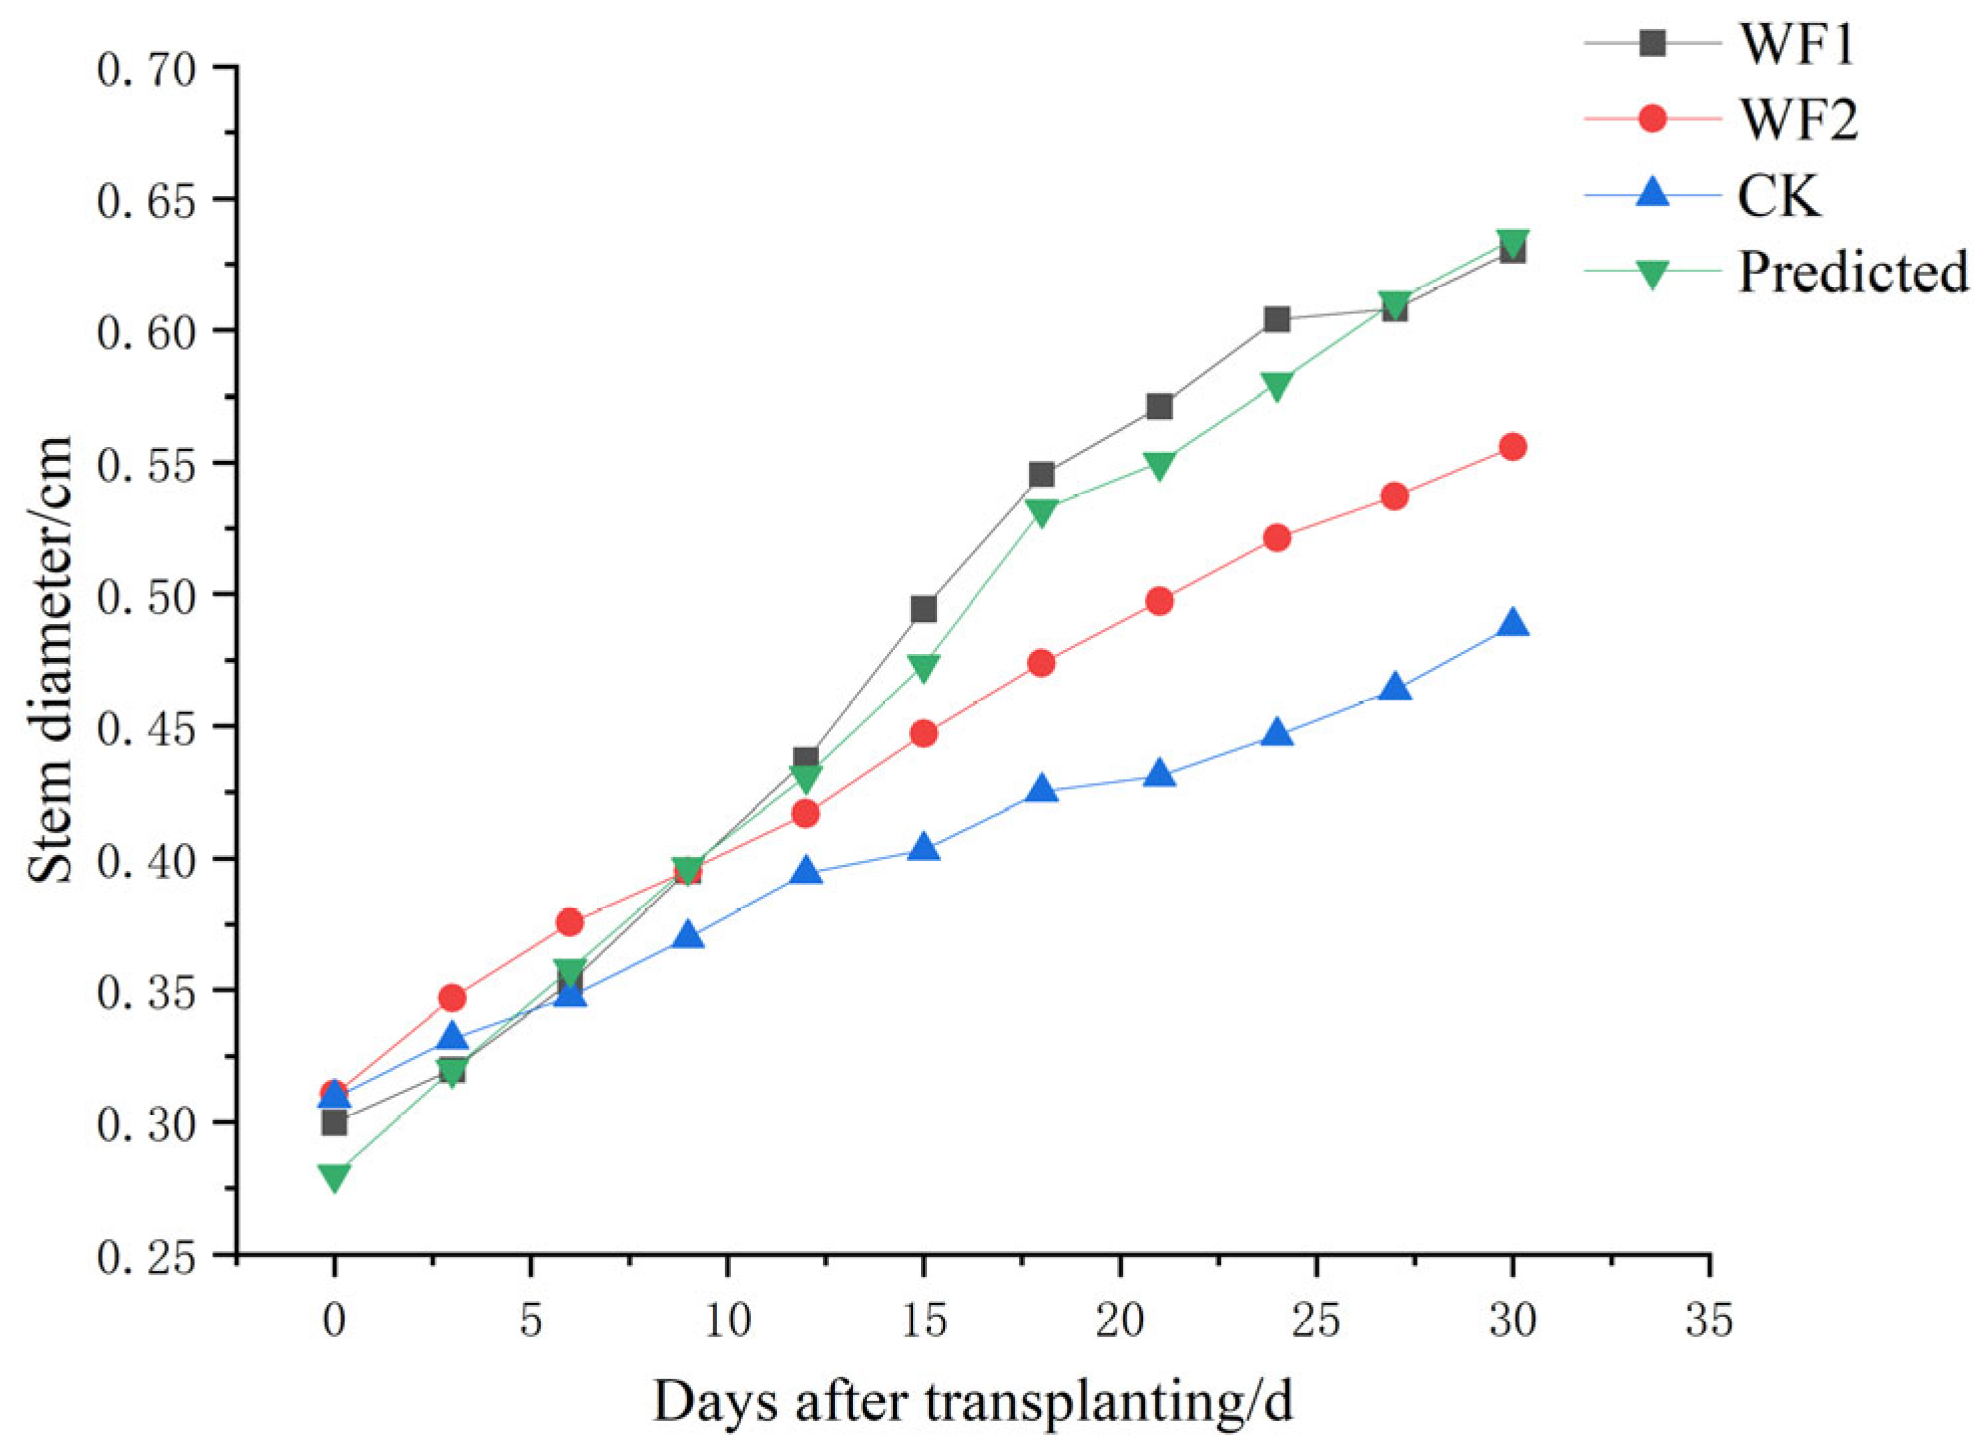
2.5.2. Stem Diameter Prediction

A change in plant diameter can reflect a change in water content in tomato, and it has a good correlation with environmental factors [31]. The daily stem diameter of tomato can be calculated using Equation (7):
D C = i = 1 n D M i + D O
where D C is the tomato standard stem diameter prediction value, mm;   n is planting days, d; D M i is the tomato standard stem diameter diurnal variable prediction value on day i , mm; and D O is the initial stem diameter measurement value during tomato colonization, mm.
According to the dynamic prediction model of tomato stem diameter proposed in this document [27], the daily variation in daily diameter of stem diameter was calculated using Equation (8):
D M i = 0.156 x S W C + 15.0067 e d 0.0003 x P A R 0.0117 T + 0.0034 x R H 14.6793
where x S W C is soil moisture content, m 3 / m 3 ; x P A R is photosynthetically active radiation, W / m 2 ; and x R H is daily mean air relative humidity, %.

2.6. Experimental Design and Treatments

2.6.1. Transplanting and Crop Management

The tomato seedlings were transplanted at the BBCH 14 growth stage (four true leaves unfolded) into pots filled with perlite. Eighty plants were arranged in two rows, with 40 cm spacing between the plants within each row. No pesticides or herbicides were applied during the growing season. Standard horticultural practices for greenhouse tomato production were followed. Excess nutrient solutions were drained daily to prevent nutrient accumulation.

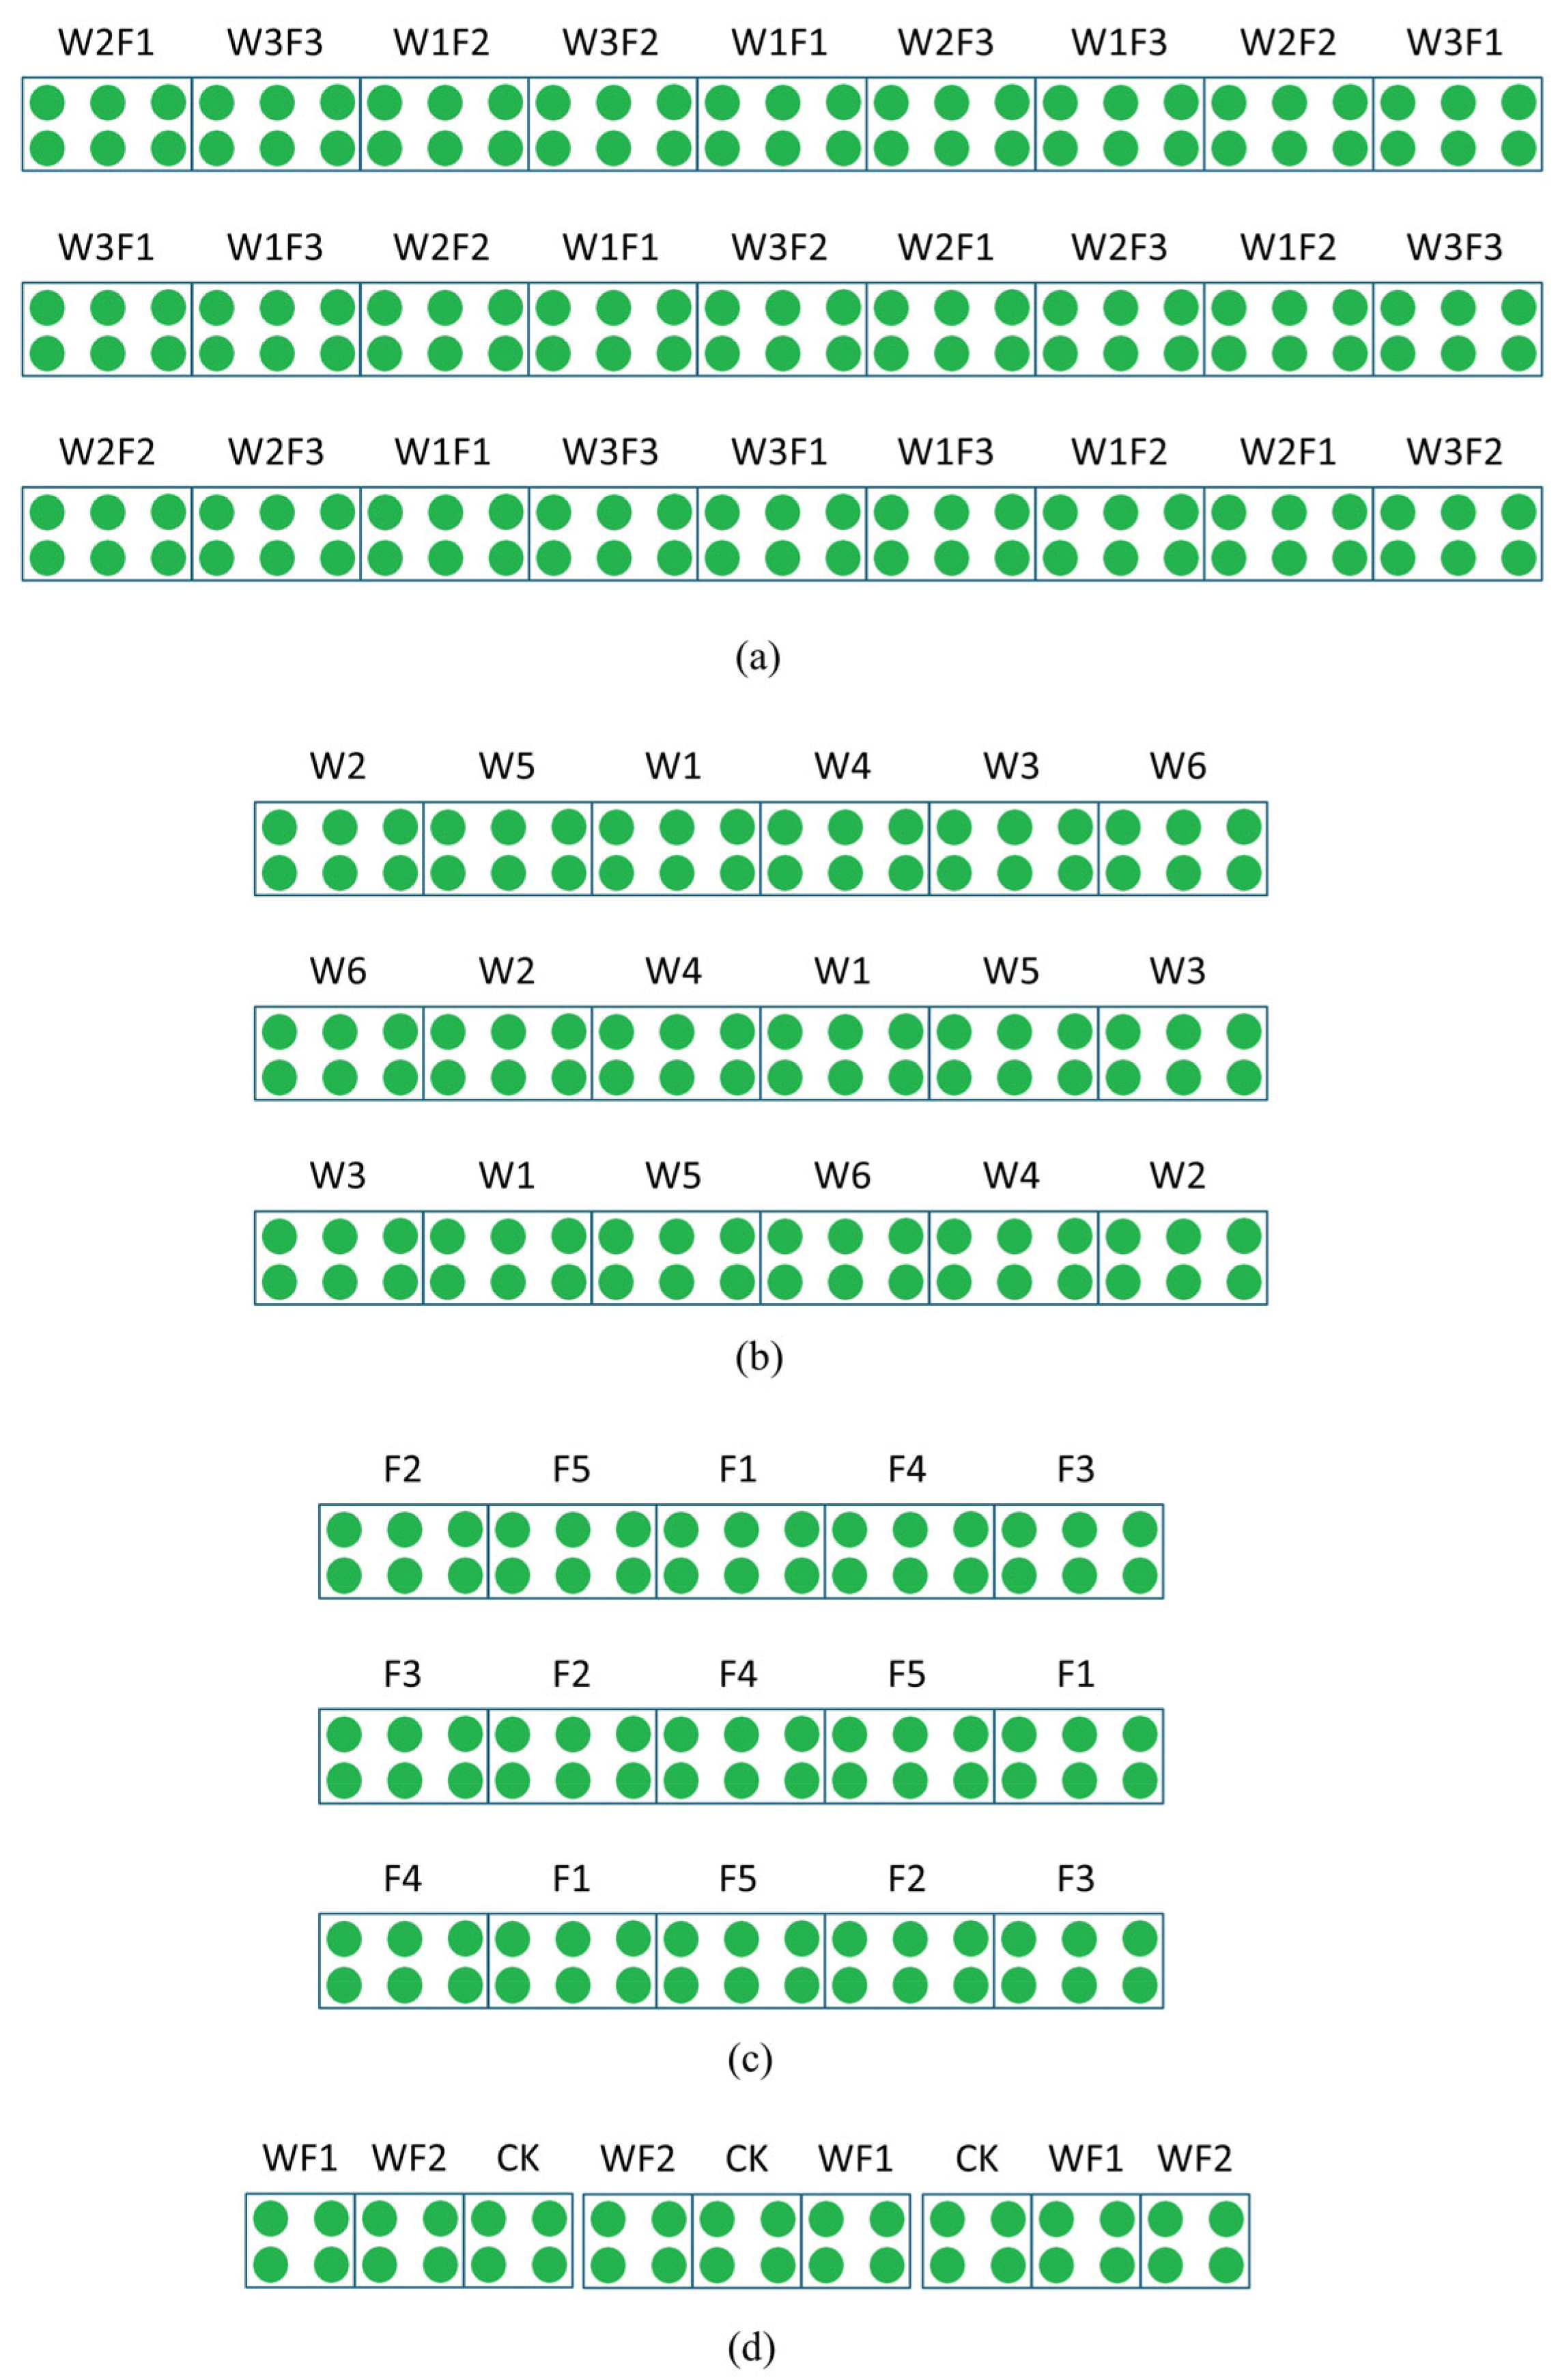
2.6.2. Water–Fertilizer Interaction Experiment

A two-factor experiment was conducted to investigate the interactive effects of irrigation and fertilization on tomato yield and WUE. The experiment included three irrigation levels (W1: 100% Q w i ; W2: 80% Q w i ; W3: 60% Q w i ) and three fertilization levels (F1: 100% Q f i ; F2: 80% Q f i ; F3: 60% Q f i ), resulting in nine treatment combinations (W1F1, W1F2, W1F3, W2F1, W2F2, W2F3, W3F1, W3F2, and W3F3). Each treatment combination was applied to 6 tomato plants, and the experiment was replicated 3 times, resulting in a total of 162 plants (9 treatment combinations × 6 plants × 3 replicates). The experimental layout followed a randomized complete block design, as illustrated in Figure 2a.

2.6.3. Irrigation and Fertilization Response Experiment

Separate experiments were conducted to investigate the changes in plant height and stem diameter in response to varying irrigation and fertilization levels:
  • Irrigation response
Six irrigation levels were tested (W1: 100% Q w i ; W2: 80% Q w i ; W3: 60% Q w i ; W4: 40% Q w i ; W5: 20% Q w i ; W6: 10% Q w i ), while maintaining a constant fertilization level of F1 (100% Q f i ). Each irrigation treatment was applied to 6 tomato plants, and the experiment was replicated 3 times, resulting in a total of 108 plants (6 treatments × 6 plants × 3 replicates) for this specific experiment. The experimental layout followed a randomized complete block design, as illustrated in Figure 2b.
  • Fertilization response
Five fertilization levels were tested (F1: 100% Q f i ; F2: 80% Q f i ; F3: 60% Q f i ; F4: 40% Q f i ; F5: 20% Q f i ), while maintaining a constant irrigation level of W1 (100% Q w i ). Each fertilization treatment was applied to 6 tomato plants, and the experiment was replicated 3 times, resulting in a total of 90 plants (5 treatments × 6 plants × 3 replicates) for this specific experiment. The experimental layout followed a randomized complete block design, as illustrated in Figure 2c.
Three plants were randomly selected for each treatment in both the irrigation and fertilization response experiments. The EC and pH of the nutrient solution were adjusted to be the same across all the treatments within each experiment.

2.6.4. Model Validation Experiment

Three treatments were used to assess the effectiveness of the dynamic water and fertilizer management strategy:
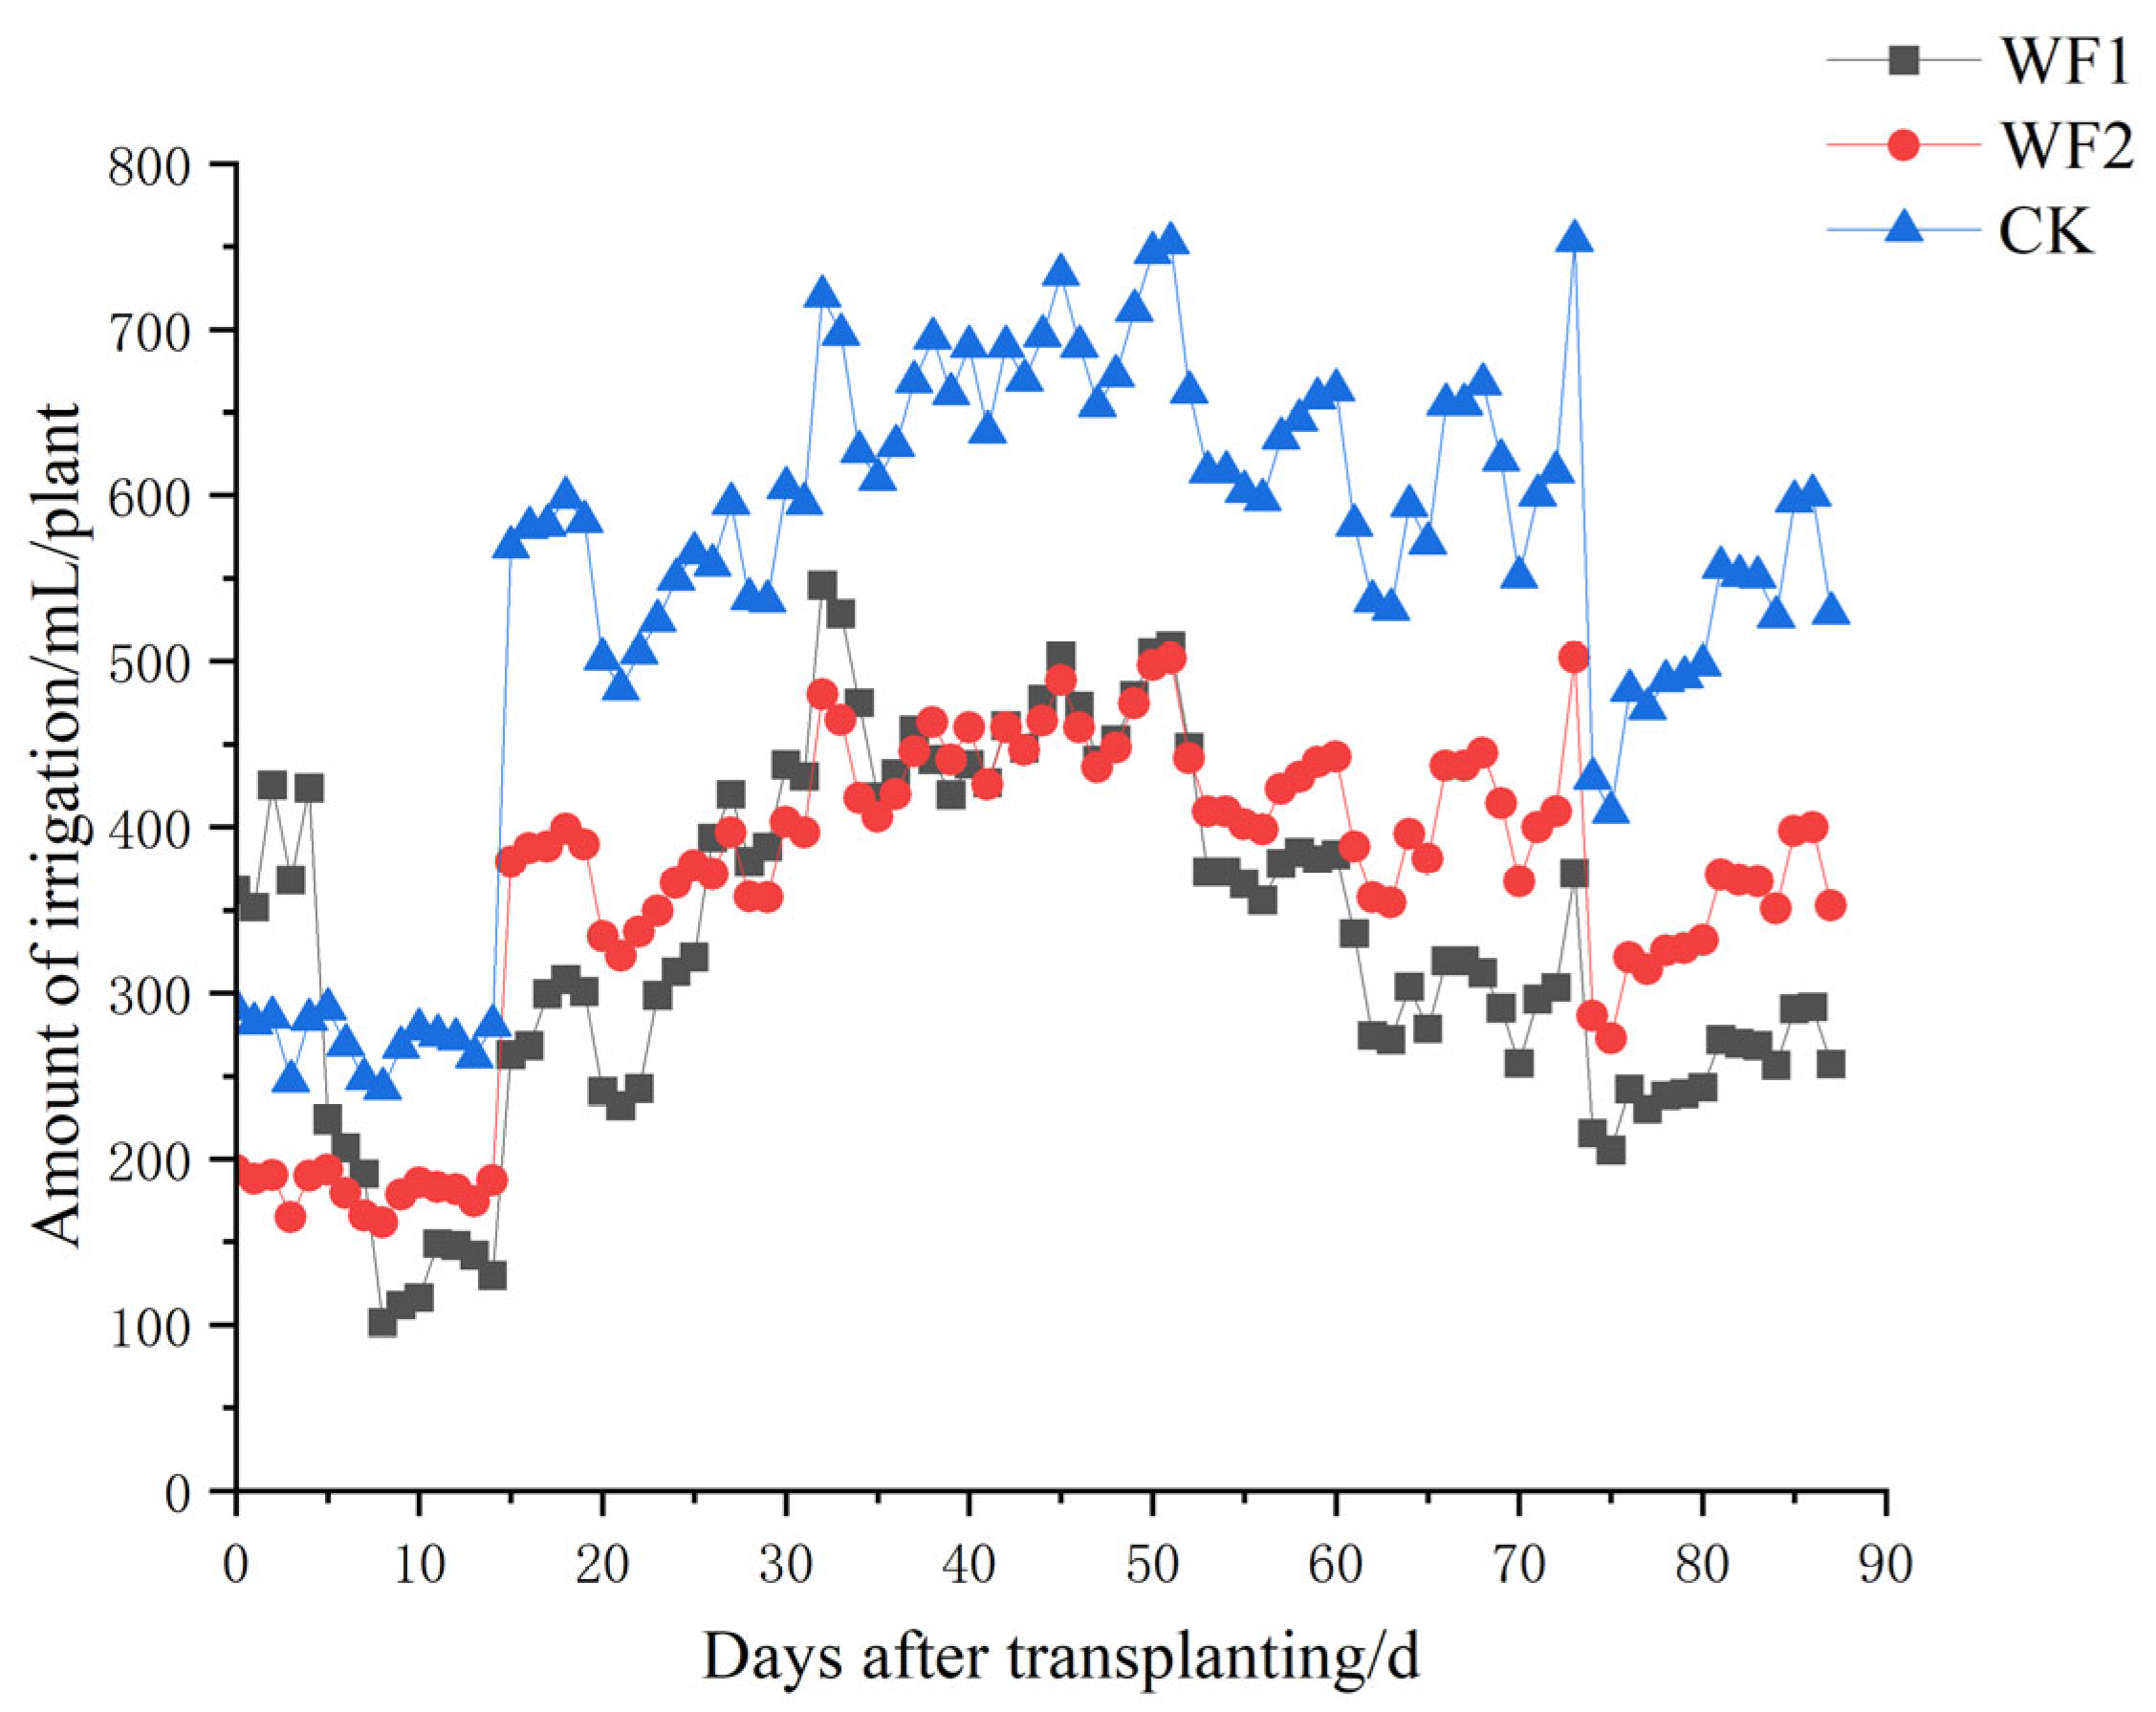
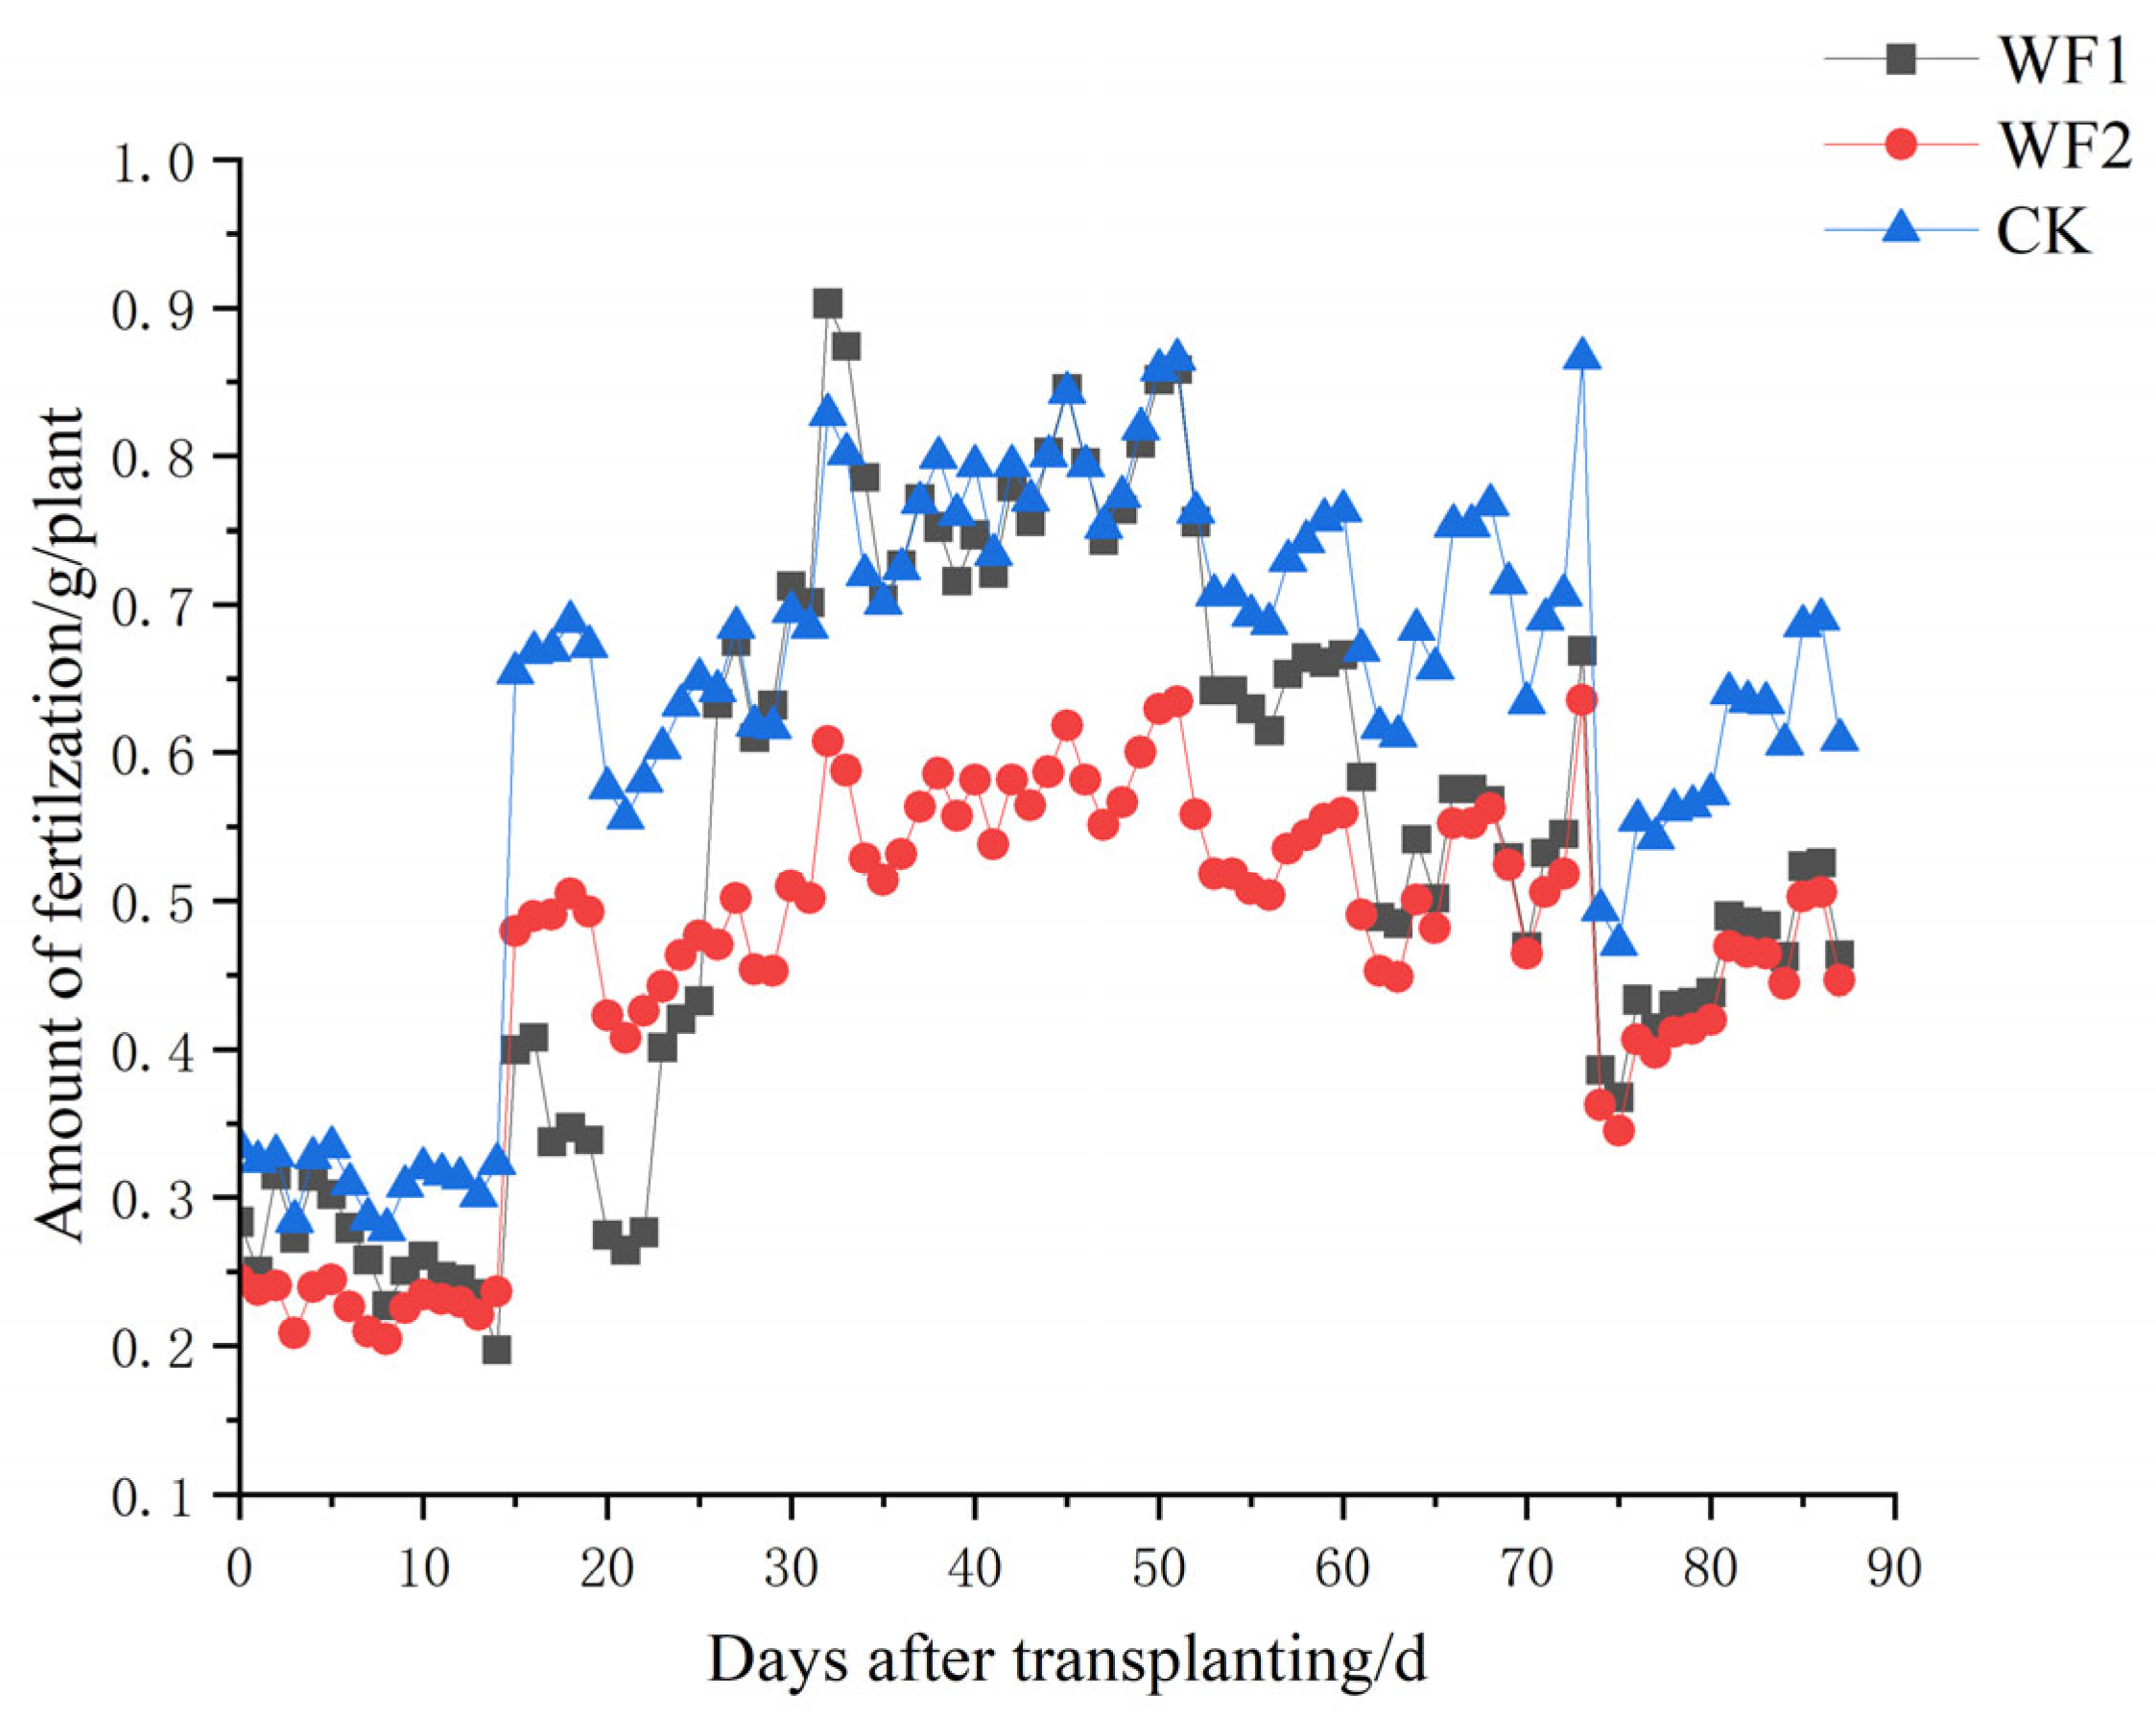
  • WF1 (dynamic model): The irrigation and fertilization amounts were dynamically determined using Equations (23)–(26) based on real-time measurements of plant height and stem diameter.
  • WF2 (fixed regime): This treatment involved a fixed irrigation and fertilization regime based on the optimal combination determined in Section 3.1. Specifically, the irrigation amount was fixed at 80% Q w i throughout the experiment, and the fertilization amount was fixed at 110% Q f i . Water was applied via a drip irrigation system, with one emitter per plant.
  • CK (control): These plants were grown under a fertigation regime designed to represent conventional practices for greenhouse tomato production in the region, characterized by ample water and nutrient supply. Specifically, the irrigation amount for the CK treatment was set to 120% Q w i , and the fertilization amount was set to 120% Q f i . Water was applied via a drip irrigation system, with one emitter per plant.
Each treatment group included 4 tomato plants, and each treatment was replicated 3 times, resulting in a total of 36 plants (3 treatments × 4 plants × 3 replicates) for this validation experiment. The experimental layout followed a randomized complete block design, as illustrated in Figure 2d. Plant height and stem diameter were measured every three days to monitor growth and to provide input data for the WF1 treatment.

2.7. Irrigation and Fertigation System Details

2.7.1. Water Source and Quality

Irrigation water used in this study was sourced from the municipal water supply of Zhenjiang City. Prior to use, the water was analyzed for its key chemical properties. The pH ranged from 6.95 to 7.05, and electrical conductivity (EC) ranged from 345 to 360 µS/cm. The calcium (Ca2+) concentration in the source water was considered when formulating the nutrient solutions. Specifically, the calcium content of the source water was subtracted from the target calcium concentration in the standard Yamazaki tomato nutrient solution to avoid excess calcium supply.

2.7.2. Fertigation System

A PWM-controlled Venturi injector system was used to deliver the nutrient solution to the plants. The system consisted of 2 stock solution tanks with a capacity of 100 L each. The nutrient solutions were prepared using the standard Yamazaki tomato formulation (F1 concentration, detailed in Section 2.1) and adjusted according to the specific treatment requirements (F2–F5, WF1, WF2, and CK). The fertigation system was calibrated to ensure the accurate delivery of the desired nutrient concentrations.

2.7.3. Irrigation System

A drip irrigation system employing dripper arrows was used to deliver the water and nutrient solutions to the plants. The system consisted of a main line constructed of 32 mm diameter polyethylene (PE) pipe and lateral lines made of 20 mm diameter PE pipe. Dripper arrows (Model 1811L, Shanghai Agrist Corp., Ltd., Shanghai, China) were installed at each plant, delivering a flow rate of 1.0 L/h per dripper arrow at an operating pressure of 100 kPa. The dripper arrows were spaced 40 cm apart along the lateral lines, corresponding to spacing between the plants, with one dripper arrow allocated per plant. Based on the dripper arrow flow rate and spacing, the system’s application intensity was calculated to be 6.7 mm/h. The uniformity coefficient of the irrigation system was above 90%.

2.8. Data Analysis

Data calculations were performed with Microsoft Excel 2023; plots were made with Origin 2025.

3. Results

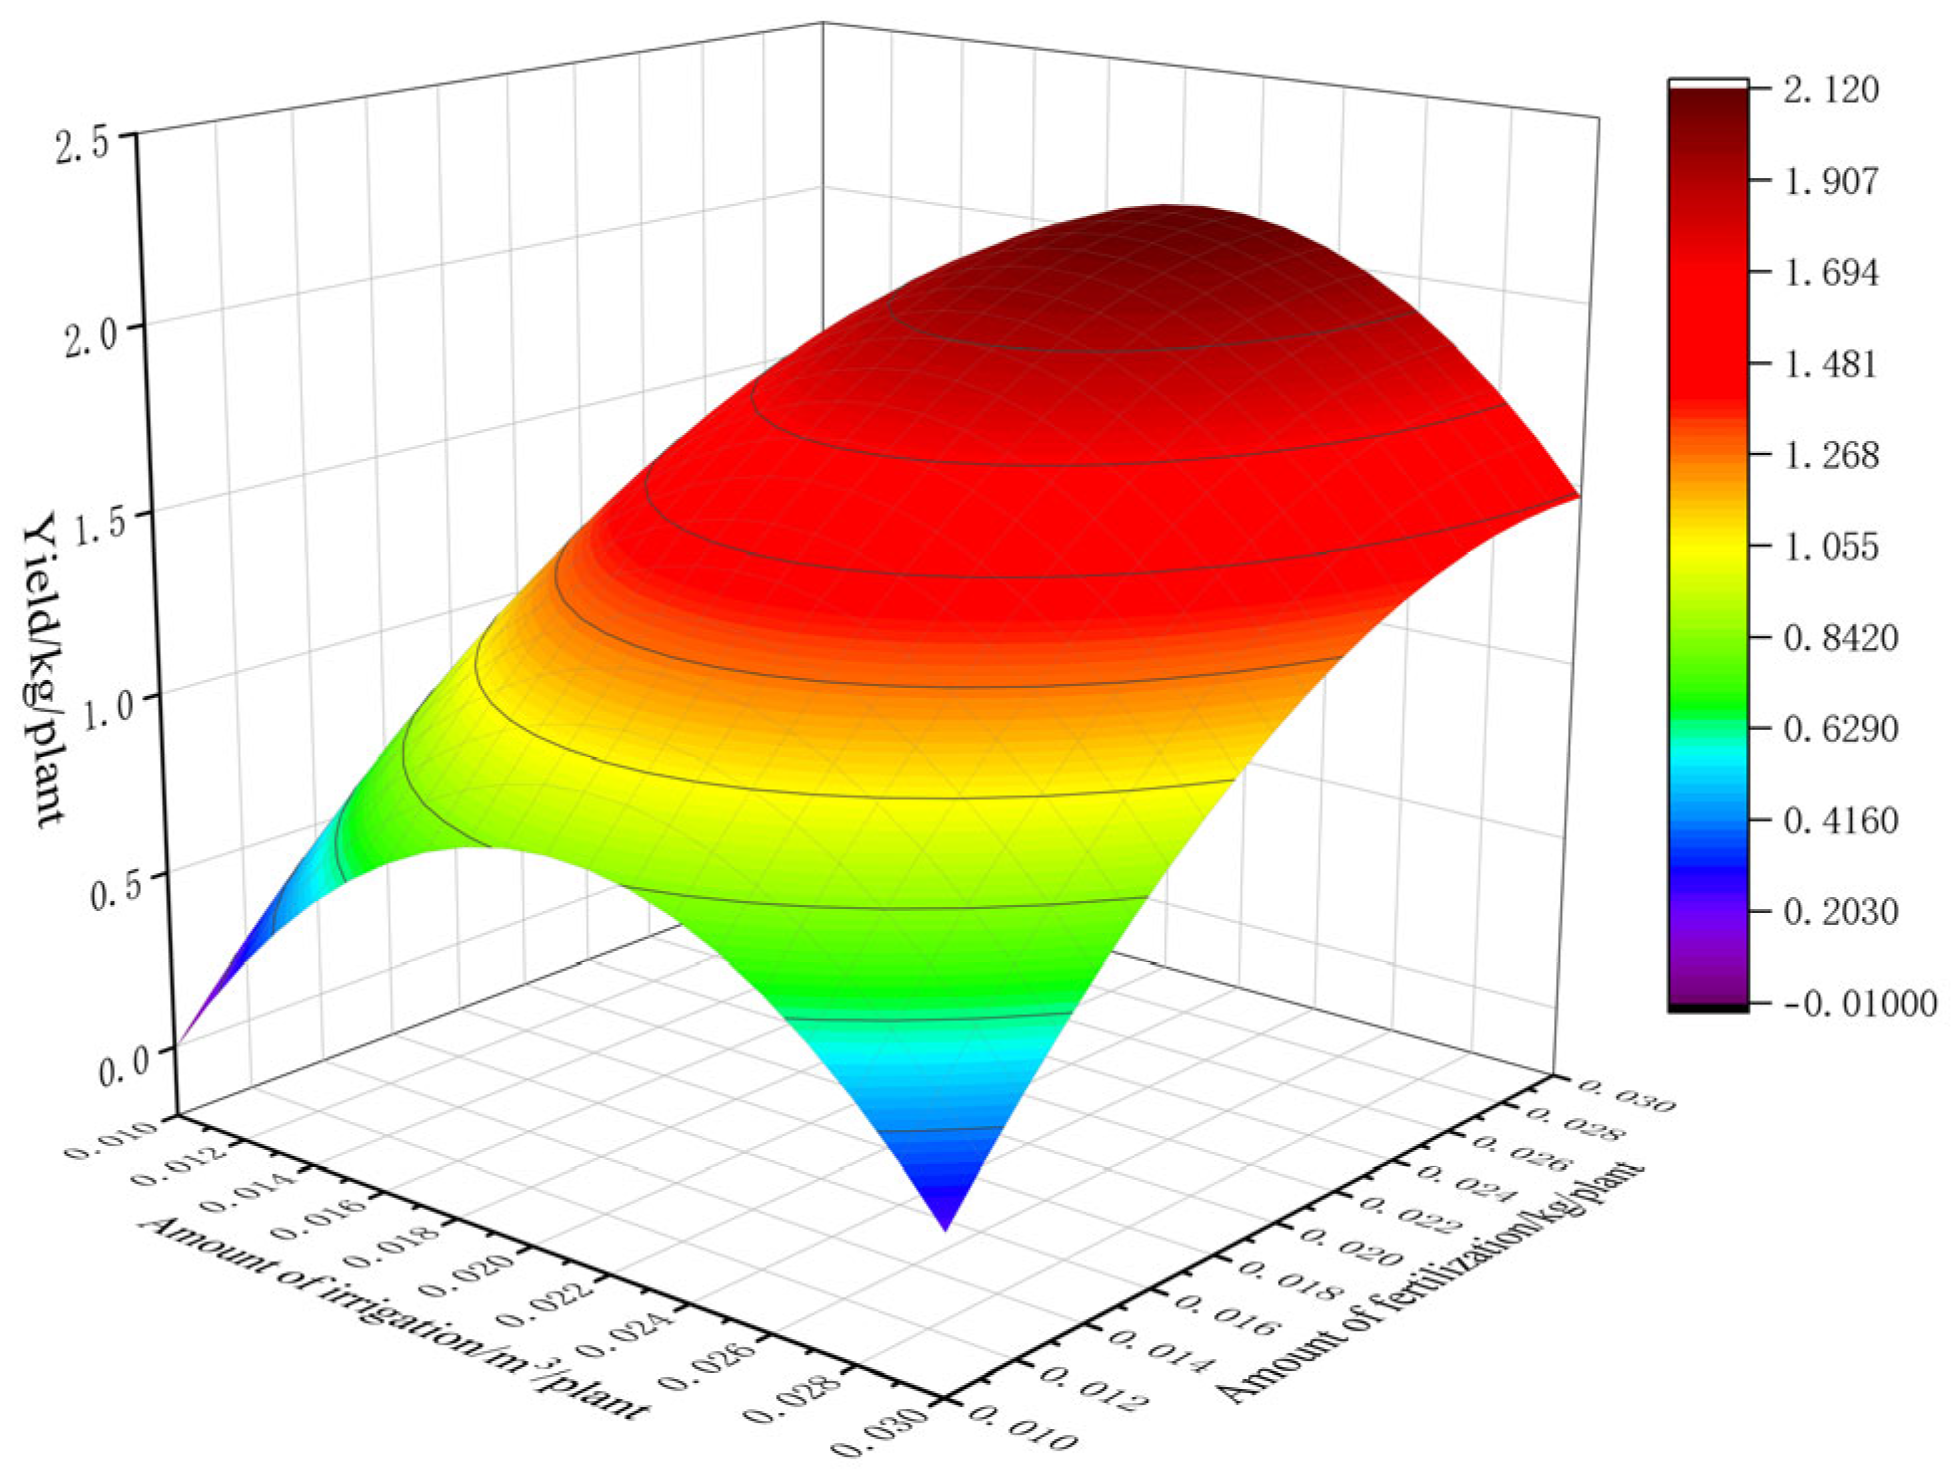
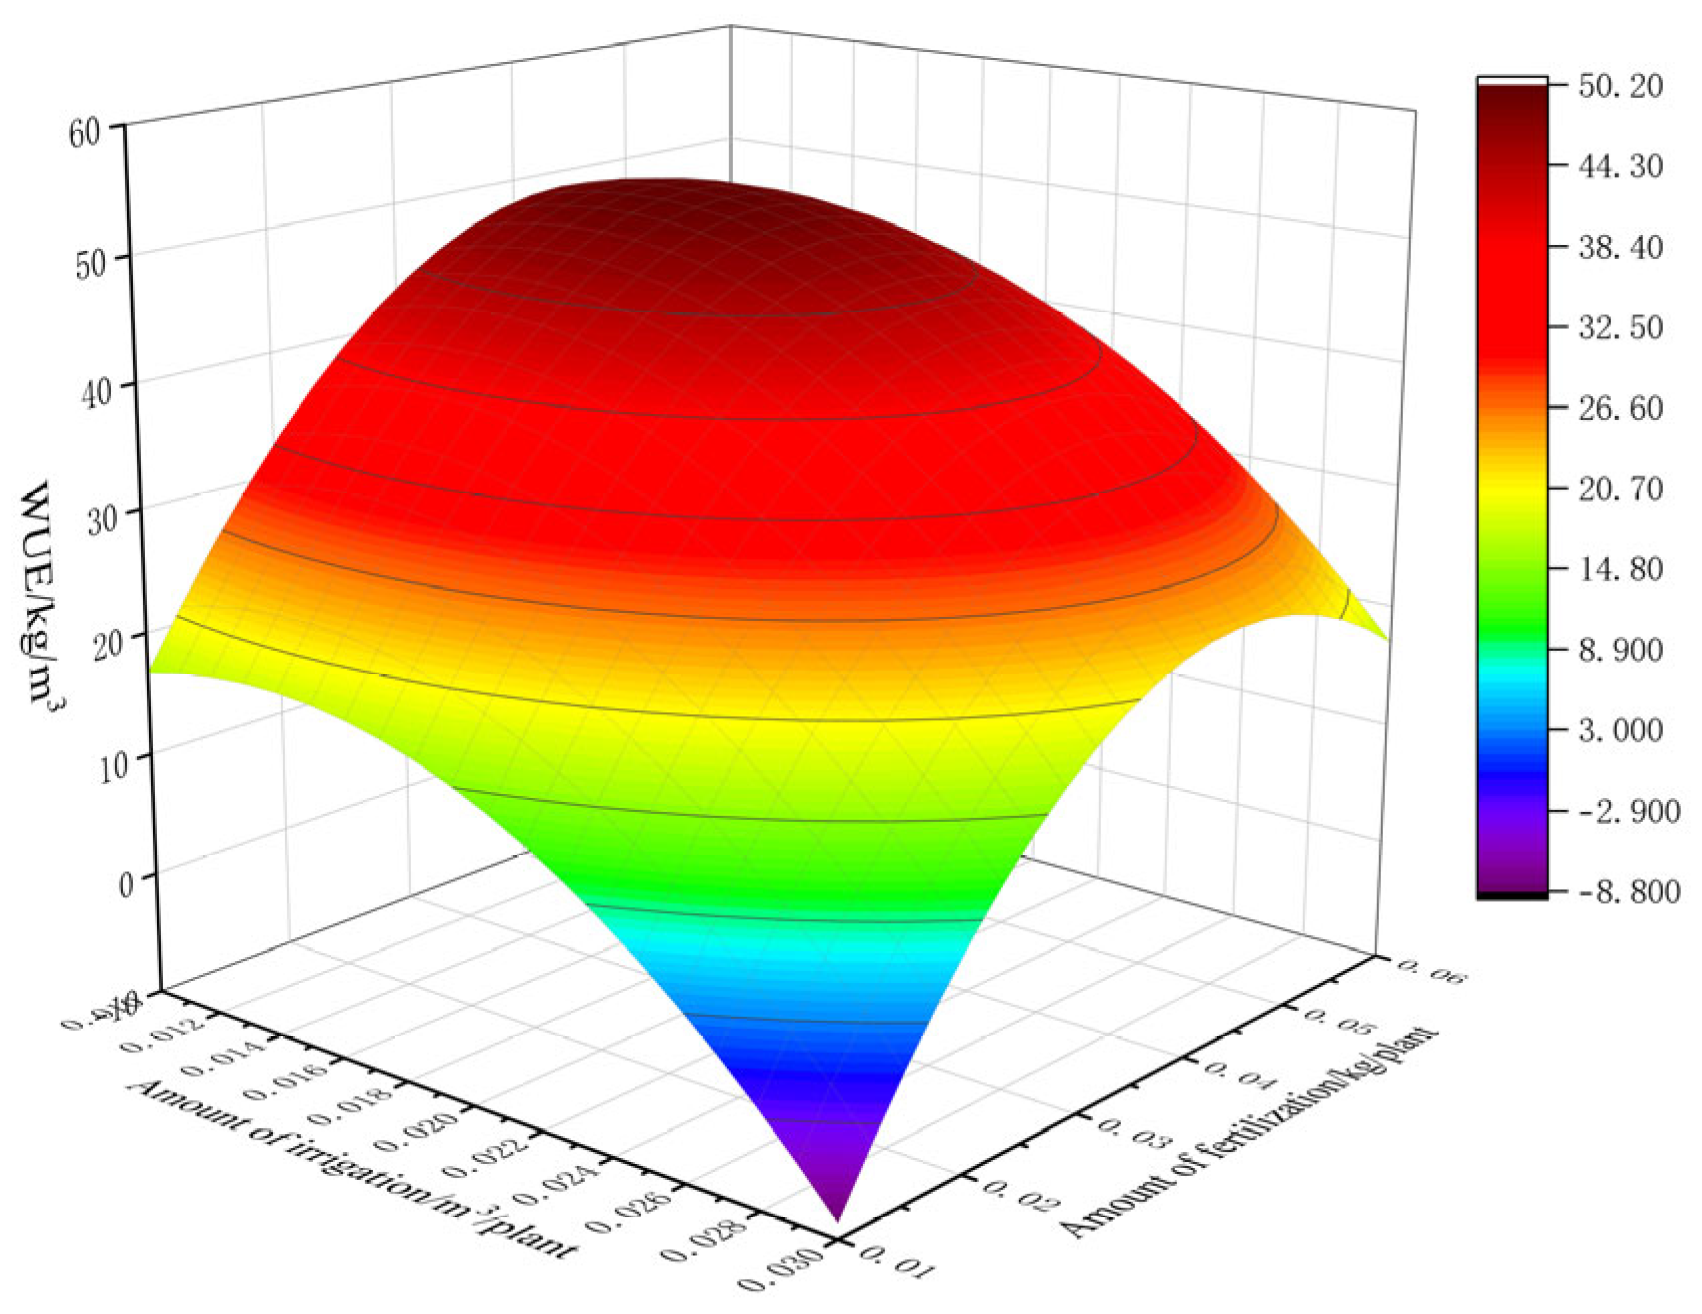
3.1. Coupling Effects of Water and Fertilizer on Fruit Yield and WUE

After BBCH 81, all the fruit samples were harvested and weighed. Treatments W1F1, W1F2, and W1F3 each had a total water consumption of 21,694 mL per plant. Treatments W2F1, W2F2, and W2F3 each had a total water consumption of 17,355 mL per plant, while treatments W3F1, W3F2, and W3F3 each had a total water consumption of 13,016 mL per plant. The WUE and fruit yield of tomato were measured for nine treatments (as shown in Table 1). WUE was calculated as the weight of fresh fruit produced per 1 m3 of water [31,32,33,34,35,36].
Fruit yield was significantly affected by fertilizer application, while no significant effect of irrigation amount on fruit yield was found. It showed that the effects of the irrigation regimes and the fertilizer applications on fruit yield were significant, while fruit yield was not affected by the interaction of irrigation and fertilizer application. WUE was significantly affected by the irrigation regimes, while it was not affected by the interaction of irrigation and fertilizer application.
To quantify the impact of irrigation and fertilizer application on fruit yield, we developed Equation (9) using regression analysis. This equation, with a correlation coefficient of 0.881, effectively describes the relationship between these three factors. Figure 3 visually represents this relationship as a curved surface.
Y = 3.985 + 312.216 x 1 + 193.697 x 2 7522.598 x 1 2 3281.271 x 2 2
where Y is the fruit yield per plant, kg/plant; x 1 is the irrigation amount per plant, m3/plant; and x 2 is the fertilizer application amount per plant, kg/plant.
By analyzing the partial derivative of Equation (9), we determined that fruit yield reaches its maximum value (2.11 kg) when the irrigation amount is 0.0208 m3 and the fertilizer application amount is 0.0295 kg.
Similarly, we established Equation (10) to quantify the effect of irrigation and fertilizer application on WUE. This regression equation allows us to analyze how these factors influence WUE.
W U E = 22.43 + 2822.22 x 1 + 2381.33 x 2 102366.41 x 1 2 26675.86 x 2 2
where W U E is the water use efficiency of tomato, kg/m3.
The correlation coefficient of Equation (10) was 0.823, so Equation (10) indicates the relationship between the irrigation amount, the fertilizer application amount, and WUE. According to Equation (10), the relationship of the three factors is shown in Figure 4 as a curved surface.
According to the partial derivative of Equation (10), it was shown that when the irrigation and fertilizer application amounts were 1.38 × 10 2 m3 and 4.46 × 10 2 kg, WUE reached the maximum value.
As shown in Figure 3 and Figure 4, the maximum WUE was observed when the irrigation and fertilizer application amounts were 0.01–0.015 and 0.025–0.05, respectively, whereas the yield of tomato reached the maximum value when the irrigation and fertilizer application amounts were 0.017–0.022 and 0.022–0.027, respectively. Therefore, the highest fruit yield and WUE were achieved when the basic irrigation and fertilizer application amounts were 0.017 m3 (80% Q w i ) and 0.027 kg (110% Q f i ).
Perlite was used as the growing substrate, and excess fertilizer was removed daily from the growing pots without leaving any nutrient residue. In addition, Patanè documented that the deficit irrigation strategies can improve WUE, minimize fruit losses, and maintain a high fruit quality [37], which is consistent with the results of the present study. Therefore, the proposed base fertilization level in this study is slightly higher than those used in previous studies, while still maintaining optimal WUE and fruit quality.

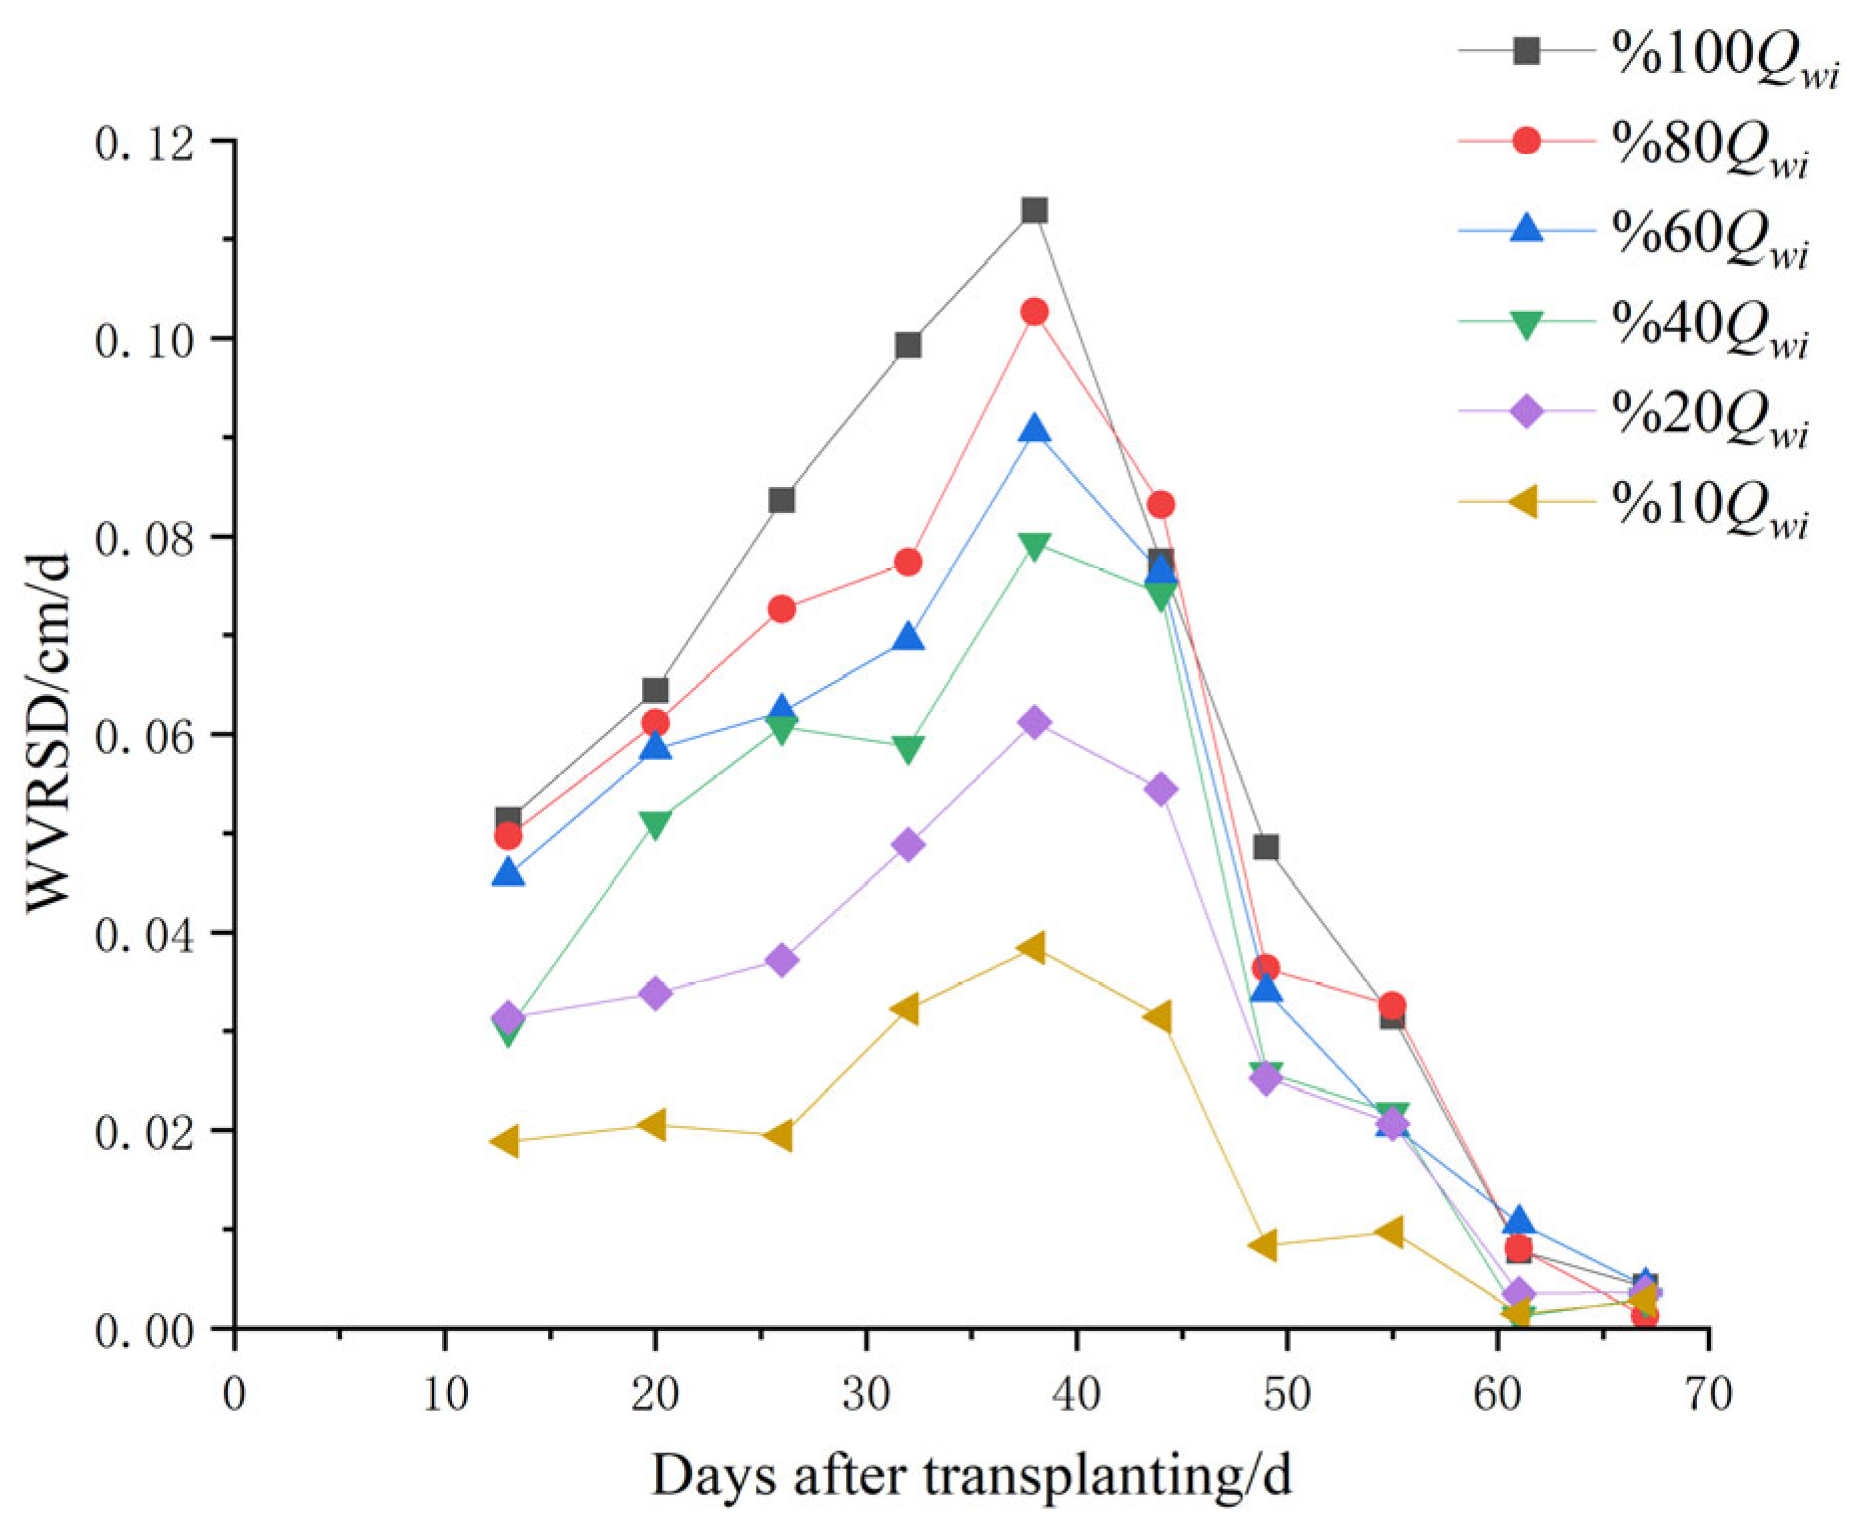
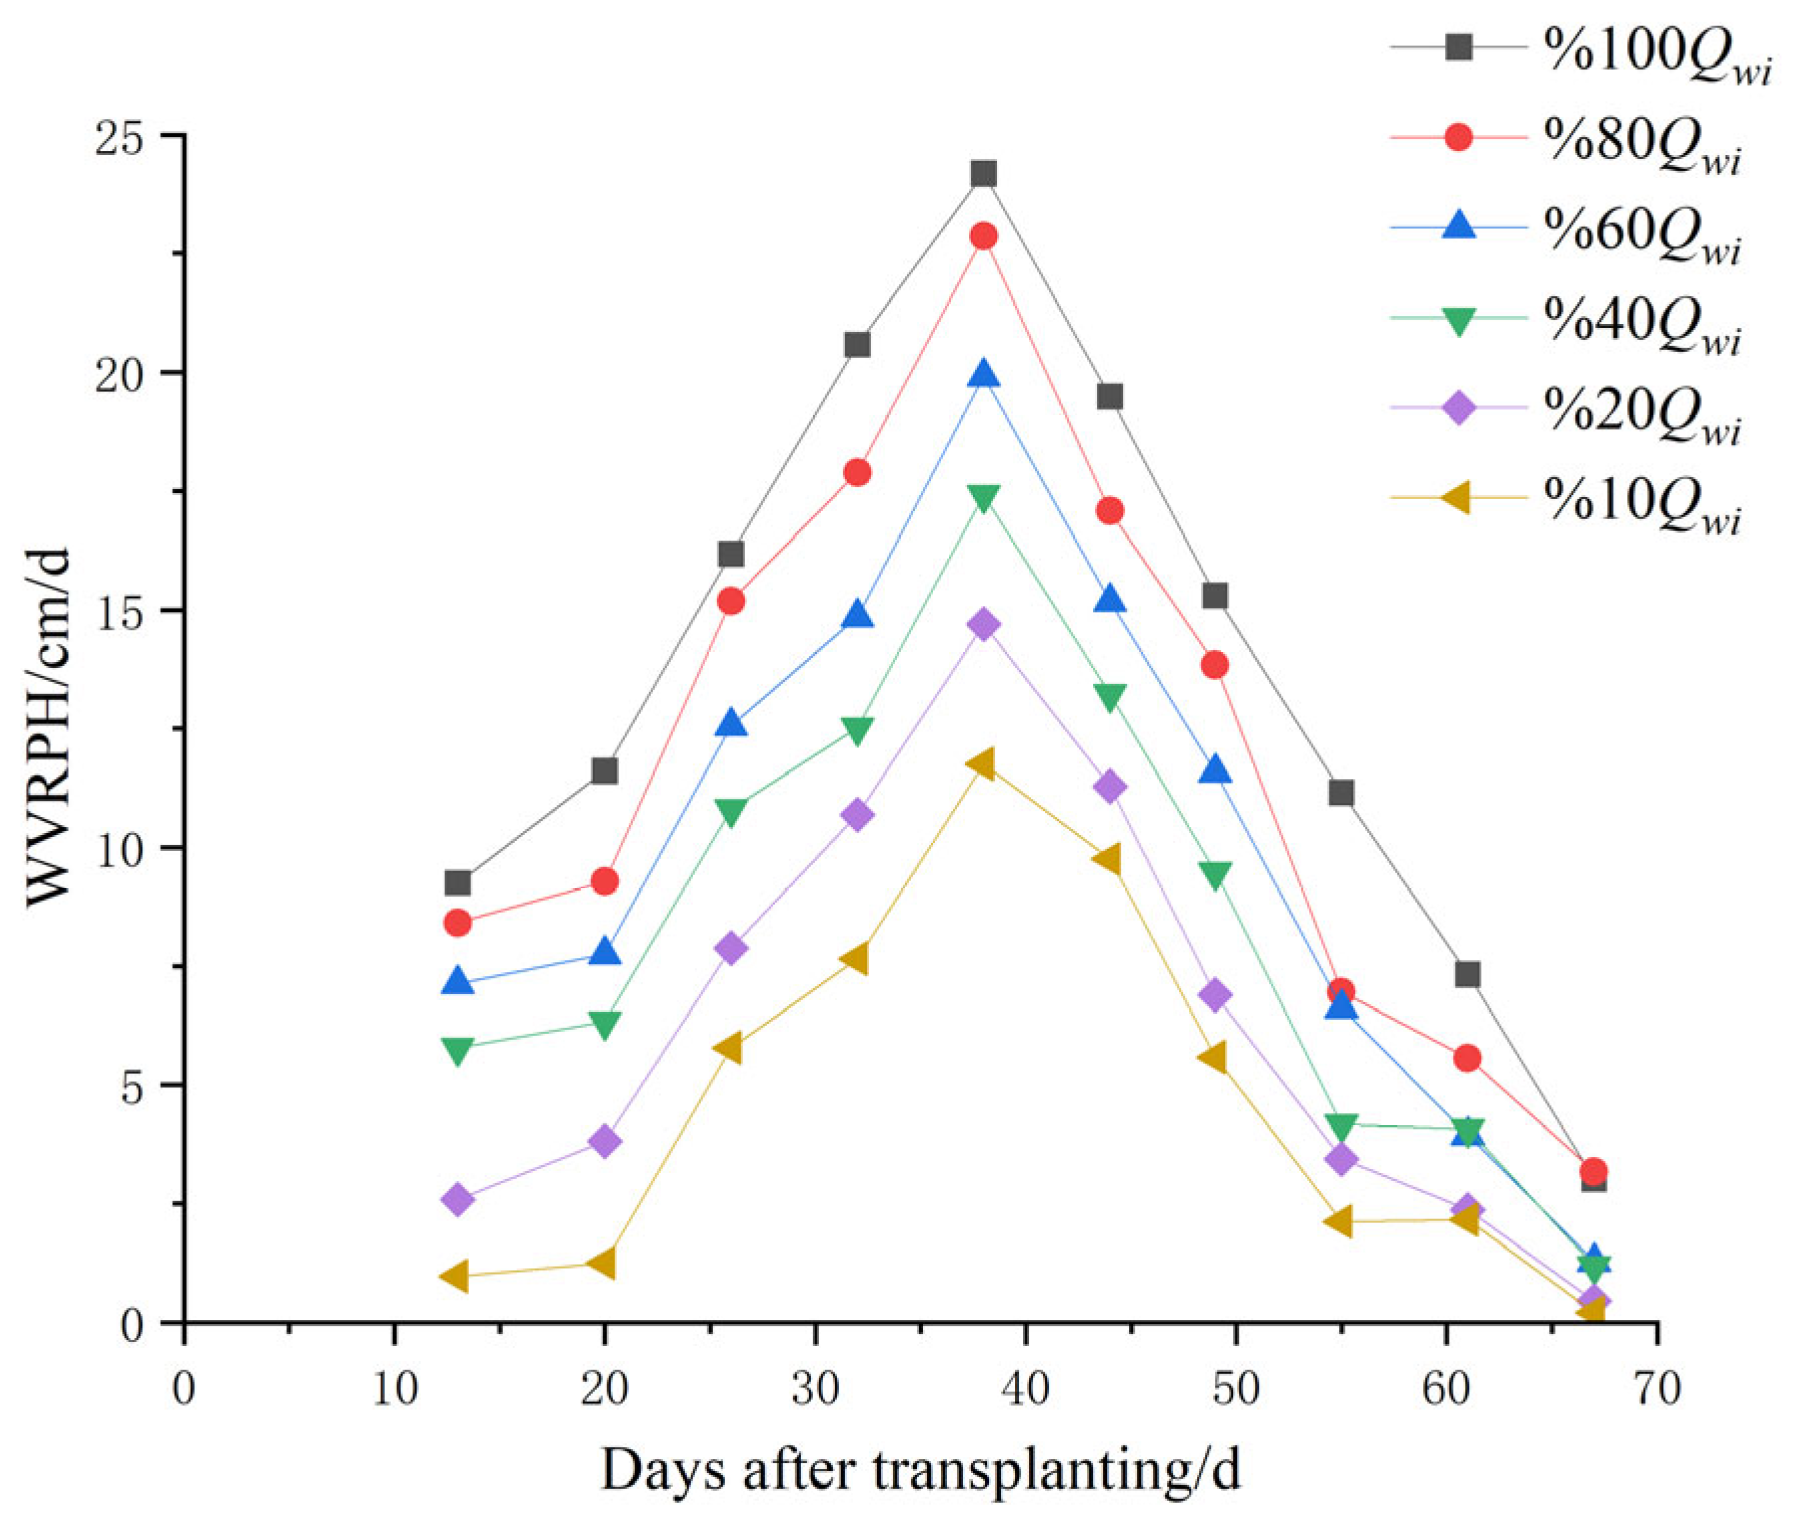
3.2. Effects of Irrigation Amount Change on Stem Diameter and Plant Height

In the irrigation experiment, the stem diameter and plant height of six treatments were measured at BBCH 14, BBCH 60, and BBCH 89, and the WVRSD and WVRPH were calculated (as shown in Figure 5 and Figure 6). The total water consumption per plant for treatments W1, W2, W3, W4, W5, and W6 was 21,694 mL, 17,355 mL, 13,016 mL, 8677.6 mL, 4338.8 mL, and 2169.4 mL, respectively.
Figure 5 and Figure 6 show that the WVRSD and the WVRPH were affected by the irrigation amount when the fertilizer application amount was constant. At the same time, the WVRSD and the WVRPH changed significantly at the seedling and flowering stages, while there were no significant changes at the full bearing stage, indicating that plant started to move forward from the vegetative stage to the reproductive stage. Throughout the growth stage, the WVRSD and the WVRPH gradually decreased. These may explain how irrigation has a positive effect and it is well known how tomato grows with water [35]. The effect of the irrigation regime at the seedling and flowering stages on stem diameter and plant height, respectively, was analyzed. At the seedling and flowering stages, the amount of fertilizer application remained constant. When the irrigation amount was increased by 20% or decreased by 20%, 40%, 60%, and 70%. The effects of irrigation amount changes on the WVRSD and the WVRPH are shown in Table 2.
Regression models describing the relationship between the WVRSD and the irrigation amount were developed for the seedling and flowering stages of tomato plants, as shown in Equations (11) and (12).
W V R S D S = 0.0406 C W S 0.0008
where W V R S D S is the WVRSD of tomato in the seedling stage, cm/7d; C W S is the change in water content in the seedling stage, %.
W V R S D F = 0.0689 C W F 0.0024
where W V R S D F is the WVRSD of tomato in the flowering stage, cm/7d; C W F is the change in water content in the flowering stage, %.
Similarly, regression models of the WVRPH and the irrigation amount at the seedling and flowering stages were established, as shown in Equations (13) and (14).
W V R P H S = 9.834 C W S 0.124
where W V R P H S is the WVRPH of tomato in the seedling stage, cm/7d.
W V R P H F = 12.861 C W F 0.368
where W V R P H F is the WVRPH of tomato in the flowering stage, cm/7d.
A significance test for Equations (11)–(14) was performed. The correlation coefficient R and p value are shown in Table 3.
As shown in Table 3, Equations (11)–(14) all reached a very significant level, which indicated that the above equations could accurately represent the model of change in stem diameter and plant height in response to irrigation amount at the seedling and flowering stages.
Therefore, through the above equations and the correlation coefficient of the WVRPH and the WVRSD, a mathematical model of the WVRPH, the WVRSD, and irrigation amount at the seedling stage was established, as shown in Equation (15).
C W S = 12.1 W V R S D S + 0.05 W V R P H S + 0.007
Similarly, at the flowering stage, a mathematical model of the WVRPH, the WVRSD, and irrigation amount was developed, as shown in Equation (16).
C W F = 7.2 W V R S D F + 0.04 W V R P H F 0.04

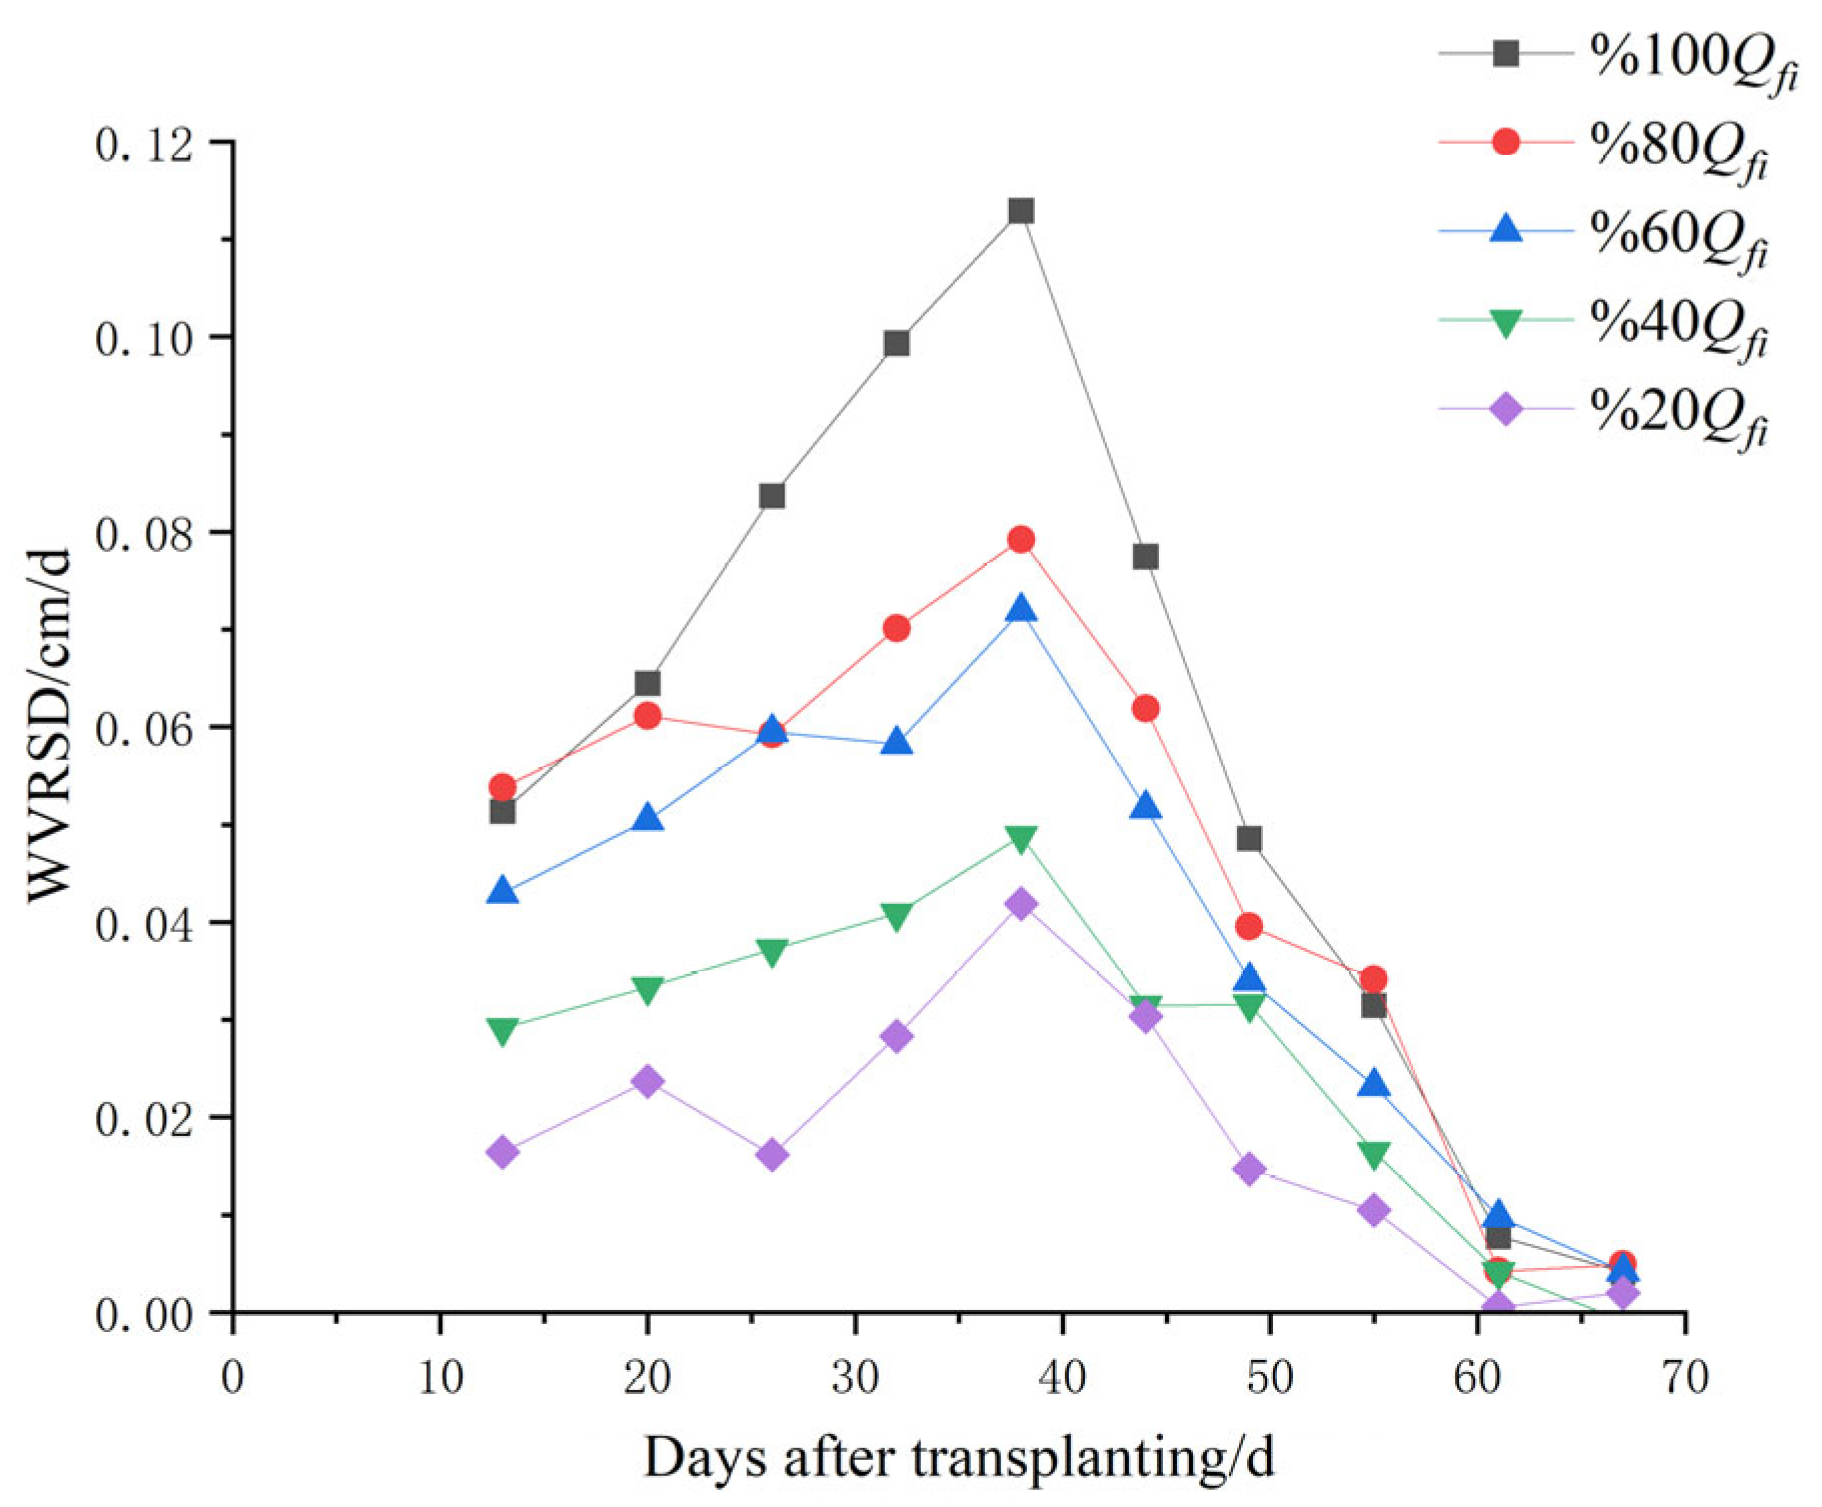
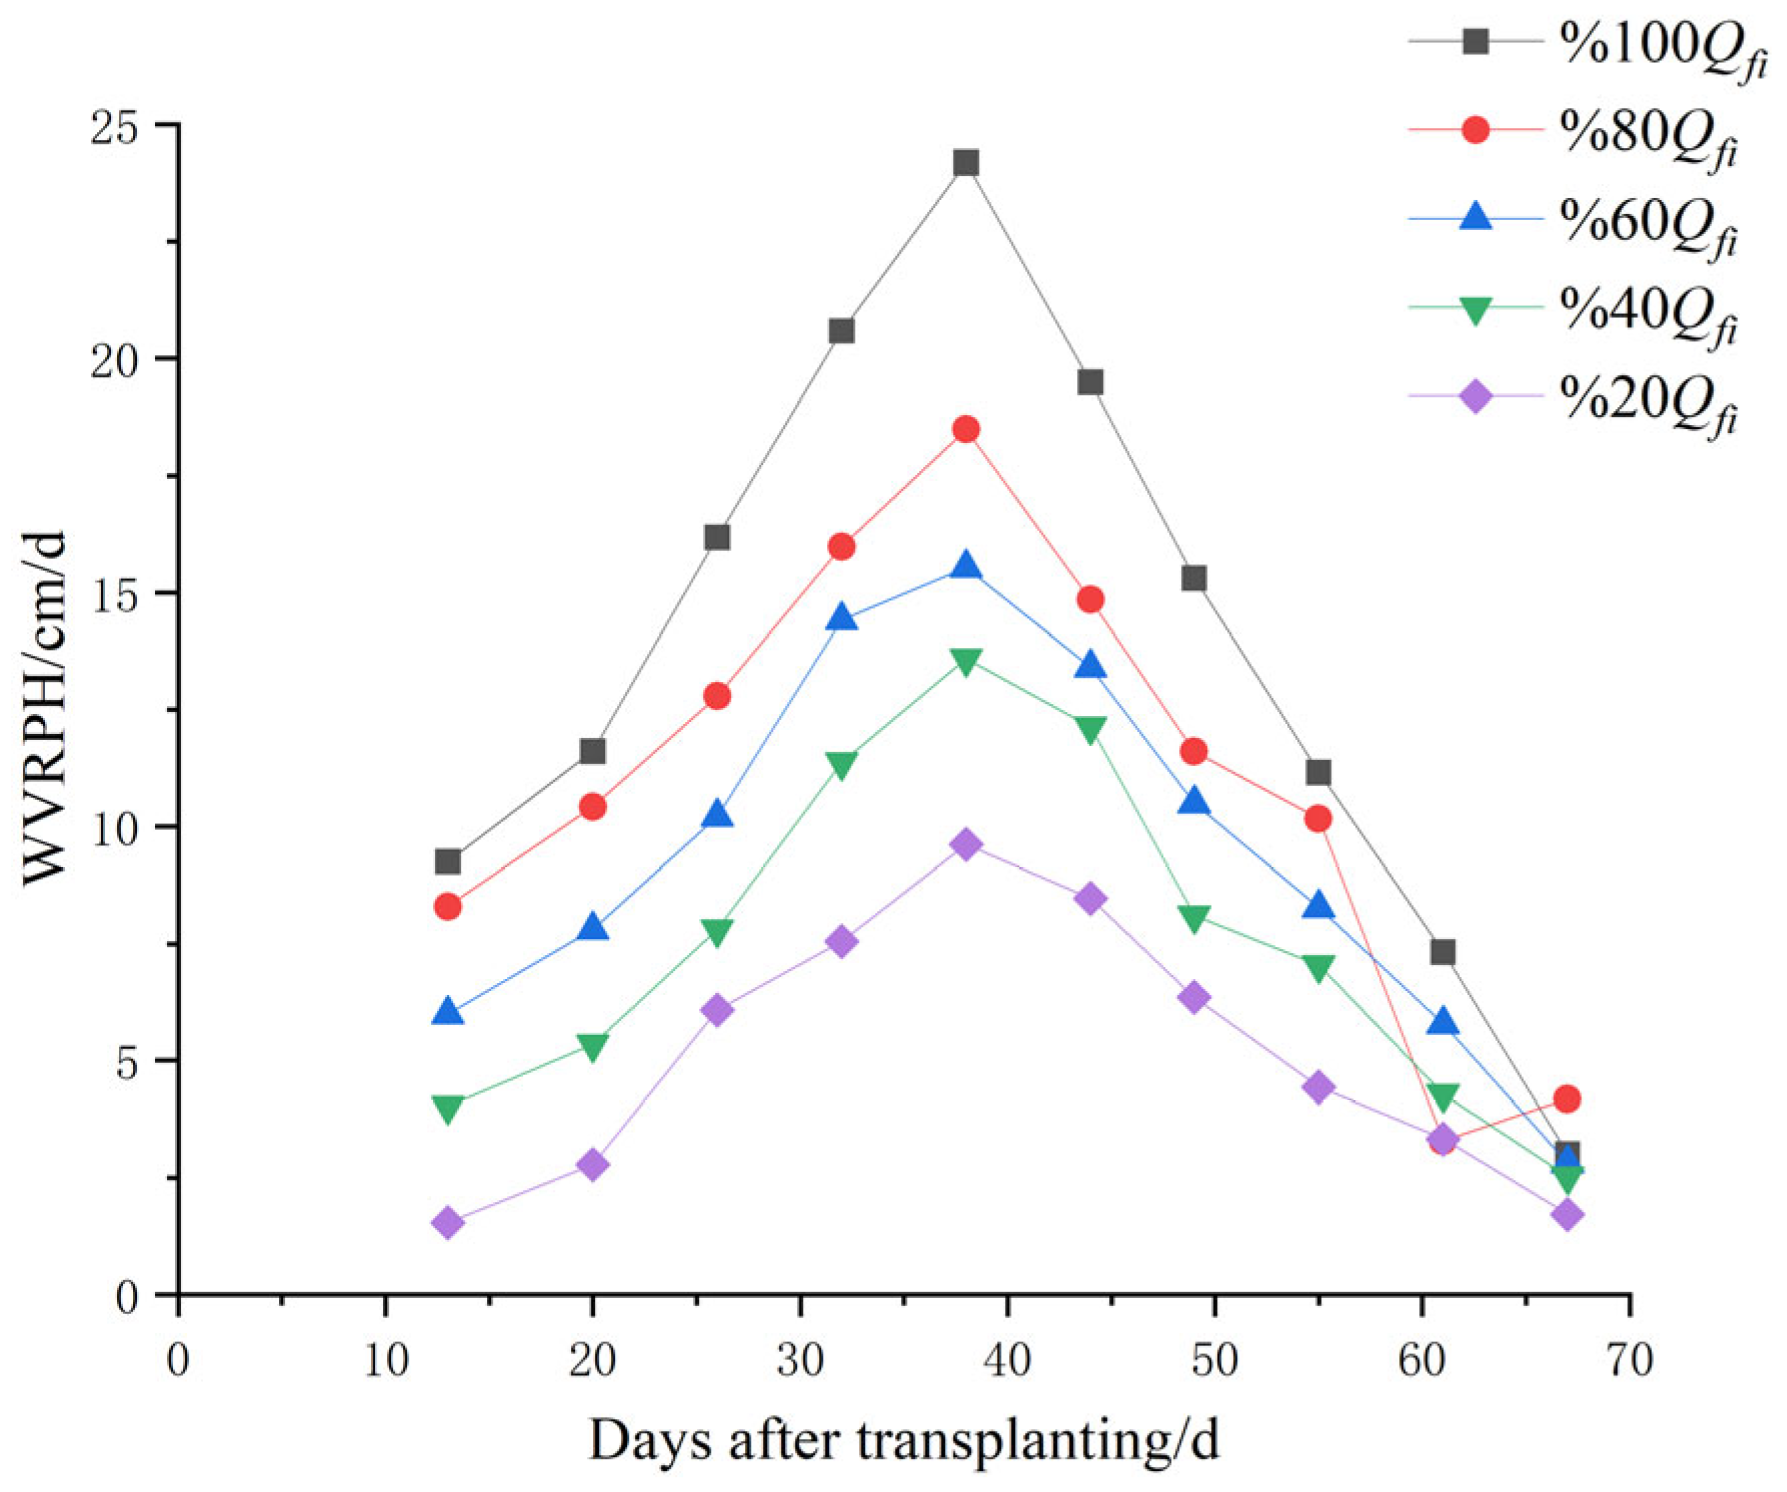
3.3. Effects of Fertilization Change on Stem Diameter and Plant Height

In the fertilization experiment, stem diameter and plant height were measured for five treatments at BBCH 14, BBCH 60, and BBCH 89, and then the WVRSD and the WVRPH were also calculated. The results are shown in Figure 6 and Figure 7.
As shown in Figure 7 and Figure 8, when the amount of irrigation was constant, the WVRSD and the WVRPH were affected by the fertilizer application amount. In addition, the fertilizer application amount had an obvious effect on the WVRSD and the WVRPH in the seedling stage and the flowering stage, while it had no effect in the full bearing stage. When the fertilizer amount was increased by 20% and 40% or decreased by 20% and 40%, the effects of the fertilizer amount change on the WVRSD and the WVRPH are shown in Table 4.
According to Table 4, the regression analysis of the WVRSD, the WVRPH, and irrigation amount was established. Regression models of the WVRSD and fertilizer application amount at the seedling and flowering stages were developed, as shown in Equations (17) and (18).
W V R S D S = 0.0509 C F S 0.0041
where C F S is the change in fertilization content in the seedling stage, %.
W V R S D F = 0.0835 C F F 0.0027
where C F F is the change in fertilization content in the flowering stage, %.
Similarly, regression models of the WVRPH and fertilizer application amount at the seedling and flowering stages were established, as shown in Equations (19) and (20).
W V R P H S = 10.617 C F S 0.193
W V R P H F = 14.987 C F F + 0.239
We performed significance tests on Equations (17)–(20) to assess their validity. The resulting correlation coefficients (R) and p values are shown in Table 5.
Table 5 demonstrates that Equations (17)–(19) all reached a statistically significant level. This indicates that these equations accurately model how stem diameter and plant height respond to fertilizer application at the seedling and flowering stages.
Using these equations and the correlation coefficient between the WVRPH and the WVRSD, we established a mathematical model (Equation (21)) to predict fertilizer application amount based on the WVRPH and the WVRSD at the seedling stage.
C F S = 9.4 W V R S D S + 0.045 W V R P H S + 0.015
Similarly, at the flowering stage, a mathematical model of the WVRPH, the WVRSD, and fertilizer application amount was developed, as shown in Equation (22).
Similarly, we developed Equation (22) to model the relationship between the WVRPH, the WVRSD, and fertilizer application amount at the flowering stage.
C F F = 5.8 W V R S D F + 0.035 W V R P H F 0.005

3.4. Dynamic Water and Fertilizer Management Strategy

The dynamic water and fertilizer management strategy employed in this study utilized the Penman–Monteith equation (Equation (1)) to estimate the daily water requirements of tomato plants. The daily fertilizer requirement was determined using Equation (2). The initial baseline values were set to be 80% of the calculated water requirement ( Q w i ) and 110% of the calculated fertilizer requirement ( Q f i ), respectively, based on preliminary analysis and previous research that suggests the potential for optimizing both fruit yield and WUE at these levels.
To ensure optimal plant growth and avoid excessive or insufficient water and nutrient supply, the model incorporated a feedback mechanism based on real-time plant morphological measurements. The difference between the measured and predicted values of plant height and stem diameter was monitored. This difference served as an indicator of the plants’ actual water and nutrient status, reflecting deviations from the expected growth trajectory. Based on this discrepancy, the baseline irrigation and fertilizer application amounts were dynamically adjusted.
At the seedling stage, the adjusted irrigation and fertilizer amounts were calculated using Equations (23) and (24), respectively. These equations integrate the relationships established in Equations (5)–(7), (15), and (21), effectively linking the predicted plant growth parameters (plant height and stem diameter) with the adjustments needed for irrigation and fertilization.
Q W S = 12.1 D M D C + 0.05 H M H C + 0.807 × Q w i
Q F S = 9.4 D M D C + 0.045 H M H C + 1.115 × Q f i
where Q W S is the final irrigation amount per plant at the seedling stage, mL/plant; D M is the actual measurement of stem diameter, mm; H M is the actual measurement of plant height, cm; and Q F S is the final fertilizer application amount per plant at the seedling stage, kg/plant.
Similarly, Equations (25) and (26) were used to calculate adjustments to irrigation and fertilization during the flowering stage.
Q W F = 7.2 D M D C + 0.04 H M H C + 0.796 × Q w i
Q F F = 5.8 D M D C + 0.035 H M H C + 1.095 × Q f i
where Q W F is the final irrigation amount per plant at flowering stage, mL/plant; Q F F is the final fertilizer application amount per plant at flowering stage, kg/plant.
This dynamic adjustment process, guided by real-time plant feedback, ensured that irrigation and fertilization were tailored to the specific needs of the tomato plants throughout their growth cycle, optimizing resource use and promoting both high yield and WUE.
The environmental conditions, specifically the mean daily temperature and relative humidity, were recorded throughout the experiment (Figure 9). Figure 10 and Figure 11 illustrate the daily irrigation and fertilizer application amounts per plant for each treatment group (WF1, WF2, and CK). The total water consumption for treatments WF1, WF2, and CK was 20,609 mL, 20,616 mL, and 30,924 mL, respectively. The stem diameter and plant height of the tomato plants in the WF1, WF2, and CK treatments were measured during the seedling and flowering stages, as depicted in Figure 12 and Figure 13. Tomato fruit yield and WUE for these treatments were recorded at the end of the entire growth period (Table 6).
As shown in Figure 12 and Figure 13, the measured values of stem diameter and plant height under the WF1 treatment closely align with the predicted values, indicating the model’s effectiveness in tracking and responding to plant growth. In contrast, both the WF2 and CK treatments exhibited deviations from the predicted growth patterns. Specifically, the WF2 and CK plants showed smaller stem diameters than predicted and greater plant heights than predicted, suggesting potential overgrowth and the less efficient allocation of resources. Furthermore, as presented in Table 6, the fruit yield per plant is lower in the WF2 and CK treatments compared to that of the WF1 treatment.
The WF1 treatment resulted in 6.9% and 14.7% increases in fruit yield per plant compared to those of the WF2 and CK treatments, respectively (Table 6). WUE also improved under the WF1 treatment, with increases of 6.93% and 43.17% relative to those in the WF2 and CK treatments, respectively. These improvements translated into better economic benefits per plant under the WF1 treatment, exceeding those of WF2 and CK by 4.9% and 20.6%, respectively.
These results confirm that the dynamic water and fertilizer management strategy, as implemented in the WF1 treatment, effectively improves both WUE and fruit yield in greenhouse tomato production. This approach contributes to water-saving irrigation strategies and promotes more sustainable and efficient resource utilization.

4. Discussion

4.1. Interactive Effects of Water and Fertilizer on Yield and WUE

This study’s findings corroborate the established understanding that both irrigation and fertilization significantly influence tomato fruit yield. However, the lack of a statistically significant interaction effect between them within the tested ranges suggests that their effects on yield are largely independent, at least under the conditions of this experiment. This implies that within certain limits, increasing either irrigation or fertilization can enhance yield, but their combined effect is additive rather than synergistic. This aligns with the concept of limiting factors in plant growth, where the most deficient resource dictates the overall growth response.
The significant impact of irrigation on WUE is noteworthy. The results highlight the effectiveness of the WF1 treatment’s dynamically adjusted irrigation, which approximated 80% of the calculated water requirement ( Q w i ), in achieving high WUE. This finding is consistent with a growing body of research demonstrating the benefits of deficit irrigation in improving WUE in various crops, including tomatoes [3]. Deficit irrigation, when properly managed, can induce mild water stress that triggers physiological responses in plants, such as stomatal closure and increased root growth, leading to reduced water consumption without significant yield penalties.
The significant influence of fertilizer on yield, but not on WUE, suggests that nutrient availability was a primary limiting factor for yield in this study. While the WF1 treatment received a dynamically adjusted fertilizer amount that potentially started around 100% of the calculated requirement and was increased as needed, the results suggest that fine-tuning fertilizer application based on real-time plant needs can enhance yield without compromising WUE. This is in line with the principles of precision agriculture, which advocates for site-specific nutrient management to optimize resource use and minimize the environmental impact [2,7,25].

4.2. Morphological Responses as Indicators for Precision Management

The strong correlation observed between the plant morphological characteristics (stem diameter and plant height) and the varying irrigation and fertilization regimes, particularly during the seedling and flowering stages, validates their use as indicators for the real-time monitoring of plant status. This is consistent with previous studies that have explored the use of stem diameter fluctuations and plant height as proxies for water stress and nutrient deficiency in various crops [24,38,39,40,41].
The dynamic adjustment of irrigation and fertilization in the WF1 treatment, based on these morphological indicators, proved effective in optimizing resource use and enhancing both yield and WUE. This highlights the potential of integrating plant-based sensing into irrigation and fertilization management systems to achieve greater precision and efficiency. The observed changes in the WVRSD and the WVRPH throughout the growth stages, particularly the shift from vegetative to reproductive growth, emphasize the need for stage-specific management strategies tailored to the changing needs of the plant.

4.3. Model Validation and Effectiveness of the Dynamic Management Strategy

The superior performance of the WF1 treatment, guided by the dynamic decision support model, underscores the advantages of a demand-driven approach to water and fertilizer management in greenhouse tomato production. The model’s ability to integrate real-time plant feedback allows for the more precise and efficient allocation of resources compared to that of conventional fixed or standard fertigation practices, as represented by the WF2 and CK treatments, respectively.
The significant improvements in yield, WUE, and economic benefits achieved with the WF1 treatment demonstrate the practical value of this approach for enhancing the sustainability and profitability of greenhouse tomato cultivation. By optimizing resource use and minimizing waste, this technology can contribute to reducing the environmental footprint of greenhouse production, particularly in water-scarce regions [42,43].

4.4. Limitations and Future Directions

We acknowledge certain limitations in the present study. Firstly, the sample size used in the initial irrigation and fertilization response experiments (Section 2.6.3) was relatively small (n = 3). This was primarily due to constraints imposed by limited greenhouse space and the labor-intensive nature of the dynamic measurements required for model development. However, these initial experiments were designed to establish fundamental relationships between the plant morphological characteristics (stem diameter and plant height) and the varying irrigation and fertilization levels. These relationships were subsequently incorporated into the dynamic management strategy. The primary validation of the strategy’s effectiveness was then performed in a separate experiment (Section 2.6.4) with a slightly larger sample size (n = 4). While a larger sample size in the initial experiments would have been desirable, we believe that the consistency of the observed trends, coupled with the successful validation of the dynamic management strategy, provides support for the overall findings.
Secondly, as shown in Figure 10 and Figure 11, fluctuations in water and fertilizer consumption were observed in the WF1 treatment, particularly the decreases between days 7 and 15 and around day 75 after planting. These trends deviate from the typically high demand expected during active growth phases. We attribute these deviations primarily to significant weather events that occurred during these periods, as captured in our environmental data (Figure 9). Specifically, the reduced water consumption from days 7 to 15 (Figure 10) coincided with a period of consecutive rainy days, following an initial 6 days of sunny weather. This increased natural water availability likely reduced the plants’ irrigation needs, leading to a downward adjustment by the dynamic management strategy. Similarly, the marked decrease in both water and fertilizer consumption around day 75 (Figure 10 and Figure 11) corresponded with a sudden temperature drop of approximately 10 °C, which persisted for about one week. These weather events undoubtedly influenced plant physiological processes, likely leading to a temporary reduction in growth rate, and consequently a decreased demand for both water and nutrients. The dynamic adjustments made by the WF1 strategy during these periods reflect their responsiveness to these changes in plant needs, as indicated by the altered growth indicators (stem diameter and plant height). While these weather-induced fluctuations highlight the strategy’s sensitivity to external environmental factors, they also demonstrate their ability to adapt to changing conditions. It is important to emphasize that the primary function of the dynamic management strategy is to optimize resource allocation based on real-time plant requirements, which may vary considerably in response to the prevailing environmental conditions.
This study focused on a single tomato cultivar under specific environmental conditions within a controlled greenhouse setting. Future research should aim to validate the robustness of the dynamic management strategy across different tomato cultivars, varying growing environments (e.g., different greenhouse types and soil-based systems), and a wider range of climatic conditions. This validation should also involve larger sample sizes to enhance the generalizability of the results.
Furthermore, integrating this dynamic management strategy with other precision agriculture technologies holds significant promise. For instance, coupling the strategy with automated irrigation systems, sensor networks for real-time environmental monitoring, and advanced data analytics platforms could lead to the development of fully automated, closed-loop systems for optimizing resource use in greenhouse production. Investigating the long-term effects of dynamic water and fertilizer management on soil health, nutrient cycling, and overall system sustainability would also be highly valuable. Finally, exploring the potential of incorporating other plant physiological indicators, such as leaf water potential or chlorophyll fluorescence [44,45], into the dynamic management strategy could further enhance its accuracy and responsiveness. These indicators may provide complementary information about plants’ water and nutrient statuses, leading to even more precise adjustments in irrigation and fertilization, ultimately contributing to the development of more resilient and resource-efficient agricultural practices.

5. Conclusions

This study investigated the coupled effects of irrigation and fertilization regimes on tomato yield and WUE in a greenhouse environment. A dynamic management strategy for water and fertilizer applications was developed using the Penman–Monteith equation to estimate initial crop water requirements and a tailored approach for initial fertilizer requirements. The strategy incorporated real-time measurements of stem diameter and plant height to dynamically adjust these inputs, optimizing them based on the plants’ physiological status. This model-driven approach (WF1) was compared against a standard fertigation control (CK) and a fixed irrigation and fertilization treatment (WF2).
The experimental results demonstrated that the dynamic management strategy (WF1) significantly enhanced both fruit yield and WUE more than the fixed and control treatments. Specifically, the WF1 treatment resulted in 6.9% and 14.7% increases in yield per plant compared to those of the WF2 and CK treatments, respectively. Moreover, the WF1 treatment achieved the highest WUE, showing improvements of 6.93% and 43.17% relative to those of the WF2 and CK treatments, respectively. These improvements translated into substantial economic benefits, with the WF1 treatment exceeding WF2 and CK by 4.9% and 20.6% in per plant economic benefits, respectively.
The superior performance of the dynamic management strategy (WF1) underscores the effectiveness of integrating real-time plant morphological data into irrigation and fertilization management. The strategy’s ability to dynamically adjust to plant needs allows for the more precise and efficient allocation of resources, leading to improved yield and WUE. In contrast, fixed treatments (WF2 and CK) performed worse than the dynamic strategy (WF1), highlighting the limitations of static approaches that do not account for real-time plant demands.
The dynamic water and fertilizer management strategy developed in this study offers a significant advancement for optimizing greenhouse tomato production. This approach provides a practical and effective tool for improving resource use, enhancing yield, and increasing economic profitability more than the conventional fixed or standard fertigation practices. These findings provide a valuable scientific basis for implementing precision irrigation and fertilization strategies in greenhouse tomato cultivation, contributing to more sustainable and efficient agricultural practices.

Author Contributions

Conceptualization, Z.Z., H.M. and T.L.; methodology, Z.Z., D.Y. and T.L.; software, T.L., J.S. (Jicheng Sun), H.P. and G.M.; validation, J.S. (Jinxiu Song), D.Y., G.M. and H.P.; investigation, T.L., J.S. (Jicheng Sun), D.Y. and J.S. (Jinxiu Song); resources, T.L.; data curation, T.L. and J.S. (Jicheng Sun); writing—original draft preparation, Z.Z., T.L. and J.S. (Jicheng Sun); writing—review and editing, Z.Z. and H.M.; visualization, T.L., G.M. and H.P.; supervision, Z.Z.; project administration, Z.Z. and H.M. All authors have read and agreed to the published version of the manuscript.

Funding

This research was funded by the China Agriculture Research System (CARS-23-D03), a Project Funded by the Priority Academic Program Development of Jiangsu Higher Education Institutions (Jiangsu Education Department, Grant No. PAPD-2023-87).

Institutional Review Board Statement

Not applicable.

Data Availability Statement

The raw data supporting the conclusions of this article will be made available by the authors on request.

Conflicts of Interest

The authors declare no conflicts of interest.

References

  1. Sun, Y.; Duan, L.; Zhong, H.; Cai, H.; Xu, J.; Li, Z. Effects of irrigation-fertilization-aeration coupling on yield and quality of greenhouse tomatoes. Agric. Water Manag. 2024, 299, 108893. [Google Scholar] [CrossRef]
  2. Zhang, J.; Xiang, L.; Liu, Y.; Jing, D.; Zhang, L.; Liu, Y.; Li, W.; Wang, X.; Li, T.; Li, J. Optimizing irrigation schedules of greenhouse tomato based on a comprehensive evaluation model. Agric. Water Manag. 2024, 295, 108741. [Google Scholar] [CrossRef]
  3. Ullah, I.; Mao, H.; Rasool, G.; Gao, H.; Javed, Q.; Sarwar, A.; Khan, M.I. Effect of deficit irrigation and reduced N fertilization on plant growth, root morphology and water use efficiency of tomato grown in soilless culture. Agronomy 2021, 11, 228. [Google Scholar] [CrossRef]
  4. Zhang, C.; Lia, X.; Yan, H.; Ullaha, I.; Zuo, Z.; Li, L.; Yu, J. Effects of irrigation quantity and biochar on soil physical properties, growth characteristics, yield and quality of greenhouse tomato. Agric. Water Manag. 2020, 241, 106263. [Google Scholar] [CrossRef]
  5. Li, Z.; Xu, B.; Du, T.; Ma, Y.; Tian, X.; Wang, F.; Wang, W. Excessive nitrogen fertilization favors the colonization, survival, and development of Sogatella furcifera via bottom-up effects. Plants 2021, 10, 875. [Google Scholar] [CrossRef]
  6. Shabbir, A.; Mao, H.; Ullah, I.; Buttar, N.A.; Ajmal, M.; Solangi, K.A. Improving water use efficiency by optimizing the root distribution patterns under varying drip emitter density and drought stress for cherry tomato. Agronomy 2021, 11, 3. [Google Scholar] [CrossRef]
  7. Li, Y.; Wang, J.; Du, Y.; Chen, Q. Optimization of an aerated fertilizer irrigation application scheme for tomato photosynthesis, yield and quality in Xi’an, China. Sci. Hortic. 2024, 338, 113743. [Google Scholar] [CrossRef]
  8. Yue, W.; Liu, L.; Chen, S.; Bai, Y.; Li, N. Effects of water and nitrogen coupling on growth, yield and quality of greenhouse tomato. Water 2022, 14, 3665. [Google Scholar] [CrossRef]
  9. Wang, L.; Uri, Y.; Yasuor, H.; Ning, S.; Tan, J.; Ben-Gal, A. Simulating water and potassium uptake of greenhouse tomato as a function of salinity stress. Irrig. Sci. 2022, 40, 873–884. [Google Scholar] [CrossRef]
  10. Sun, Y.; Duan, L.; Zhong, H.; Cai, H.; Wang, X. Response mechanism of soil greenhouse gas emission and yield of greenhouse tomato to water-fertilizer-air coupling. Trans. Chin. Soc. Agric. Eng. 2024, 55, 312–322. [Google Scholar] [CrossRef]
  11. Shabbir, A.; Mao, H.; Ullah, I.; Buttar, N.A.; Ajmal, M.; Lakhiar, I.A. Effects of drip irrigation emitter density with various irrigation levels on physiological parameters, root, yield, and quality of cherry tomato. Agronomy 2020, 10, 1685. [Google Scholar] [CrossRef]
  12. Veerachamy, R.; Ramar, R.; Balaji, S.; Sharmila, L. Autonomous application controls on smart irrigation. Comput. Electr. Eng. 2022, 100, 107855. [Google Scholar] [CrossRef]
  13. Cantore, V.; Lechkar, O.; Karabulut, E.; Sellami, M.H.; Albrizio, R.; Boari, F.; Stellacci, A.M.; Todorovic, M. Combined effect of deficit irrigation and strobilurin application on yield, fruit quality and water use efficiency of “cherry” tomato (Solanum lycopersicum L.). Agric. Water Manag. 2016, 167, 53–61. [Google Scholar] [CrossRef]
  14. Szabó, A.; Széles, A.; Illés, Á.; Bojtor, C.; Mousavi, S.M.N.; Radócz, L.; Nagy, J. Effect of different nitrogen supply on maize emergence dynamics, evaluation of yield parameters of different hybrids in long-term field experiments. Agronomy 2022, 12, 284. [Google Scholar] [CrossRef]
  15. Zhang, M.; Xiao, N.; Li, Y.; Li, Y.; Zhang, D.; Xu, Z.; Zhang, Z. Growth and fruit yields of greenhouse tomato under the integrated water and fertilizer by moistube irrigation. Agronomy 2022, 12, 1630. [Google Scholar] [CrossRef]
  16. Farid, M.; Anshori, M.F.; Rossi, R.; Haring, F.; Mantja, K.; Dirpan, A.; Larekeng, S.H.; Mustafa, M.; Adnan, A.; Tahara, S.A.M.; et al. Combining image-based phenotyping and multivariate analysis to estimate fruit fresh weight in segregation lines of lowland tomatoes. Agronomy 2024, 14, 338. [Google Scholar] [CrossRef]
  17. Li, R.; Bai, J.; Li, D.; Ren, X.; He, D.; Du, R.; Feng, Z.; Zhang, Z. Water and fertilizer decision model for synergistic optimization of yield, quality and efficiency of cherry tomato based on combination evaluation. Comput. Electron. Agric. 2024, 224, 109224. [Google Scholar] [CrossRef]
  18. Liang, Z.; Liu, X.; Xiong, J.; Xiao, J. Water allocation and integrative management of precision irrigation: A systematic review. Water 2020, 12, 3135. [Google Scholar] [CrossRef]
  19. Zhao, F.; Yoshida, H.; Goto, E.; Hikosaka, S. Development of an automatic irrigation method using an image-based irrigation system for high-quality tomato production. Agronomy 2022, 12, 106. [Google Scholar] [CrossRef]
  20. Georgieva, T.; Veleva, P.; Atanassova, S.; Daskalov, P. Indirect determination of basic tomato quality parameters using color digital images. Eng. Proc. 2024, 70, 24. [Google Scholar] [CrossRef]
  21. Sai, K.; Sood, N.; Saini, I. Time series data modelling for classification of drought in tomato plants. Theor. Exp. Plant Physiol. 2023, 35, 379–394. [Google Scholar] [CrossRef]
  22. Labrador, R.H.; Masot, R.; Alcaniz, M.; Baigts, D.; Soto, J.; Martinez-Manez, R.; Garcia-Breijo, E.; Gil, L.; Barat, J.M. Prediction of NaCl, nitrate and nitrite contents in minced meat by using a voltammetric electronic tongue and an impedimetric sensor. Food Chem. 2010, 122, 864–870. [Google Scholar] [CrossRef]
  23. Silva, P.C.; Ferreira, A.F.A.; Araújo, E.S.; Net, J.V.B.; Costa, A.R.d.; Fernandes, L.d.S.; Martins, A.A.S.; Cândido, R.d.S.; Jardim, A.M.d.R.F.; Pandorfi, H.; et al. Cherry tomato crop management under irrigation levels: Morphometric characteristics and their relationship with fruit production and quality. Gesunde Pflanz. 2022, 75, 1277–1288. [Google Scholar] [CrossRef]
  24. Olagunju, S.O.; Sosanya, O.S.; Oguntade, O.A.; Adewusi, K.M.; Soremi, P.A.S.; Joda, A.O.; Nassir, A.L. Effect of NPK fertiliser on upper and basal stem diameters and implication on growth habit of tomato. J. Saudi Soc. Agric. Sci. 2024, 23, 55–66. [Google Scholar] [CrossRef]
  25. Bwambale, E.; Abagale, F.K.; Anornu, G.K. Model-based smart irrigation control strategy and its effect on water use efficiency in tomato production. Cogent Eng. 2023, 10, 2259217. [Google Scholar] [CrossRef]
  26. Wang, J.; Wang, Z.; He, G. Vegetable Soilless Cultivation Practical Technology; China Agricultural University: Beijing, China, 2000. [Google Scholar]
  27. Yun, Y.; Sheng, W. Prediction of stem diameter variations based on principal component regression. Trans. Chin. Soc. Agric. Eng. 2015, 46, 306–314. [Google Scholar] [CrossRef]
  28. Ding, J.; Peng, S.; Xu, J.; Jiao, X.; Luo, Y. Calculation method for reference crop evaportranspiration based on temperature data. J. Hohai Univ. 2007, 35, 633–637. [Google Scholar]
  29. Harel, D.; Sofer, M.; Broner, M.; Zohar, D.; Gantz, S. Growth-stage-specific kc of greenhouse tomato plants grown in semi-arid mediterranean region. J. Agric. Sci. 2014, 6, 132–142. [Google Scholar] [CrossRef]
  30. Qi, W.; Zhang, Z.; Zou, Z.; He, C.; Sun, Z. Research of tomato’s growth rule based on accumulation temperature in greenhouse. J. Hua Zhong Agric. Univ. 2004, 35, 53–57. [Google Scholar]
  31. Wang, X.; Meng, Z.; Duan, A.; Liu, Z. Mechanism and methodology for monitoring tomato water content based on stem diameter variation. Trans. Chin. Soc. Agric. Eng. 2010, 26, 107–113. [Google Scholar] [CrossRef]
  32. Ma, X.; Yang, Y.; Tan, Z.; Cheng, Y.; Wang, T.; Yang, L.; He, T.; Liang, S. Climate-smart drip irrigation with fertilizer coupling strategies to improve tomato yield, quality, resources use efficiency and mitigate greenhouse gases emissions. Land 2024, 13, 1872. [Google Scholar] [CrossRef]
  33. Zeineldin, F.I.; Turk, K.G.B.; Elmulthum, N.A. Modified surface drip irrigation and hydraulic barrier impacts on soil moisture and water productivity for tomatoes in a greenhouse. Water 2024, 16, 2926. [Google Scholar] [CrossRef]
  34. Sun, L.; Li, B.; Yao, M.; Mao, L.; Zhao, M.; Niu, H.; Xu, Z.; Wang, T.; Wang, J. Simulation of soil water movement and root uptake under mulched drip irrigation of greenhouse tomatoes. Water 2023, 15, 1282. [Google Scholar] [CrossRef]
  35. Sharma, S.P.; Leskovar, D.I.; Crosby, K.M.; Volder, A.; Ibrahim, A.M.H. Root growth, yield, and fruit quality responses of reticulatus and inodorus melons (Cucumis melo L.) to deficit subsurface drip irrigation. Agric. Water Manag. 2014, 136, 75–85. [Google Scholar] [CrossRef]
  36. Wang, D.; Kang, Y.; Wan, S. Effect of soil matric potential on tomato yield and water use under drip irrigation condition. Agric. Water Manag. 2007, 87, 180–186. [Google Scholar] [CrossRef]
  37. Patanèa, C.; Tringalia, S.; Sortino, O. Effects of deficit irrigation on biomass, yield, water productivity and fruit quality of processing tomato under semi-arid Mediterranean climate conditions. Sci. Hortic. 2011, 129, 590–596. [Google Scholar] [CrossRef]
  38. Zhao, D.; Reddy, K.R.; Kakani, V.G.; Reddy, V.R. Nitrogen deficiency effects on plant growth, leaf photosynthesis, and hyperspectral reflectance properties of sorghum. Eur. J. Agron. 2005, 22, 391–403. [Google Scholar] [CrossRef]
  39. De Swaef, T.; De Schepper, V.; Vandegehuchte, M.W.; Steppe, K. Stem diameter variations as a versatile research tool in ecophysiology. Tree Physiol. 2015, 35, 1047–1061. [Google Scholar] [CrossRef]
  40. Wang, X.; Meng, Z.; Chang, X.; Deng, Z.; Li, Y.; Lv, M. Determination of a suitable indicator of tomato water content based on stem diameter variation. Sci. Hortic. 2017, 215, 142–148. [Google Scholar] [CrossRef]
  41. Viégas, I.d.J.M.; Cordeiro, R.A.M.; de Almeida, G.M.; Silva, D.A.S.; da Silva, B.C.; Okumura, R.S.; da Silva Júnior, M.L.; da Silva, S.P.; de Freitas, J.M.N. Growth and visual symptoms of nutrients deficiency in mangosteens (Garcinia mangostana L.). Am. J. Plant Sci. 2018, 9, 1014–1028. [Google Scholar] [CrossRef]
  42. Heiba, Y.; Nasr, M.; Fujii, M.; Mohamed, A.E.; Ibrahim, M.G. Improving irrigation schemes using sustainable development goals (SDGs)-related indicators: A case study of tomato production in pot-scale experimentation. Environ. Dev. Sustain. 2024, 26, 17721–17747. [Google Scholar] [CrossRef]
  43. Wu, Y.; Zhang, J.; Yan, S.; Si, W.; Liu, R.; Yang, J.; Qiu, Z.; Fan, J.; Zhang, F. Changing drip fertigation strategy to decrease greenhouse agroecosystem soil nitrate residue and improve tomato production in Northwest of China. J. Soil Sci. Plant Nutr. 2024, 24, 4565–4580. [Google Scholar] [CrossRef]
  44. Jain, P.; Huber, A.E.; Rockwell, F.E.; Sen, S.; Holbrook, N.M.; Stroock, A.D. New approaches to dissect leaf hydraulics reveal large gradients in living tissues of tomato leaves. New Phytol. 2024, 242, 453–465. [Google Scholar] [CrossRef]
  45. Liu, X.; Ali, S.; Yang, L.; He, T.; Pang, G.; Shaik, M.R.; Assal, M.E.; Hussain, S.A.; Khan, M.N. Optimized irrigation practices with fertilizer utilization strategies to improve photo-fluorescence efficiency, vascular bundles and maize production in semi-arid regions. Heliyon 2024, 10, e39222. [Google Scholar] [CrossRef]
Figure 1. Experimental setup of tomato plants in greenhouse.
Agriculture 15 00304 g001
Figure 2. Experimental layouts for different treatment factors and replicates. Each block represents replicate, and treatments were randomized within each block. Each circle represents single pot containing one tomato plant. (a) Randomized block design for irrigation and fertilization interaction experiment (3 replicates and 9 treatments: W1F1, W1F2, W1F3, W2F1, W2F2, W2F3, W3F1, W3F2, and W3F3); W1, W2, and W3 represent 100%, 80%, and 60% of calculated water requirement, respectively; F1, F2, and F3 represent 100%, 80%, and 60% of calculated fertilizer requirement, respectively. (b) Randomized block design for irrigation experiment (3 replicates and 6 treatments: W1, W2, W3, W4, W5, and W6); W1–W6 represent 100%, 80%, 60%, 40%, 20%, and 10% of calculated water requirement, respectively, with 100% of calculated fertilizer requirement. (c) Randomized block design for fertilization experiment (3 replicates and 5 treatments: F1, F2, F3, F4, and F5); F1–F5 represent 100%, 80%, 60%, 40%, and 20% of calculated fertilizer requirement, respectively, with 100% of calculated water requirement. (d) Randomized block design for model validation experiment (3 replicates and 3 treatments: WF1, WF2, and CK); WF1 represents dynamic water and fertilizer management strategy treatment, WF2 represents fixed water and fertilizer regime, and CK represents control treatment.
Agriculture 15 00304 g002
Figure 3. Response relationship of tomato yield to irrigation and fertilization.
Agriculture 15 00304 g003
Figure 4. Response relationship of tomato WUE to irrigation and fertilization.
Agriculture 15 00304 g004
Figure 5. Effect of irrigation level (percentage of Q w i ) on WVRSD in tomato.
Agriculture 15 00304 g005
Figure 6. Effect of irrigation level (percentage of Q w i ) on WVRPH in tomato.
Agriculture 15 00304 g006
Figure 7. Effect of fertilization level (percentage of Q f i ) on WVRSD in tomato.
Agriculture 15 00304 g007
Figure 8. Effect of fertilization level (percentage of Q f i ) on WVRPH in tomato.
Agriculture 15 00304 g008
Figure 9. Mean daily temperature and relative humidity during tomato growing period.
Agriculture 15 00304 g009
Figure 10. Daily irrigation amount per plant under different treatments.
Agriculture 15 00304 g010
Figure 11. Daily fertilization amount per plant under different treatments.
Agriculture 15 00304 g011
Figure 12. Growth of tomato stem diameter under different water and fertilizer treatments (WF1, WF2, and CK), with predicted values.
Agriculture 15 00304 g012
Figure 13. Growth of tomato plant height under different water and fertilizer treatments (WF1, WF2, and CK), with predicted values.
Agriculture 15 00304 g013
Table 1. Effects of different water and fertilizer regimes on tomato yield and WUE.
Treatment LevelYield (kg/Plant)WUE (kg/m3)
W1F11.859228.57
W1F21.926129.59
W1F31.398321.49
W2F11.994938.32
W2F21.758533.77
W2F31.189922.85
W3F11.686632.19
W3F21.333228.99
W3F31.034426.49
Significance test (F value)
Irrigation factor45.205 *15.014 **
Fertilization factor16.760 **0.351
Coupling effect of irrigation and fertilization0.5341.633
‘*’ and ‘**’ indicate that significant differences were found at p < 0.01 and p < 0.05 levels, respectively.
Table 2. Effects of different irrigation amounts on WVRSD and WVRPH.
Irrigation Amount ChangeSeedling StageFlowering Stage
WVRSDWVRPHWVRSDWVRPH
+20%+0.0025+1.5889+0.0144+1.6704
0%0000
−20%−0.0032−1.4056−0.0101−2.8667
−40%−0.0147−2.7833−0.0179−5.0704
−60%−0.0228−5.6444−0.0351−7.5593
−70%−0.0357−7.7278−0.0542−10.2482
Table 3. Results of significance tests for WVRSD and WVRPH regression equations under different irrigation regimes.
Source of VarianceRp
Seedling stageWVRSD regression model0.9500.004 *
WVRPH regression model0.9800.001 *
Flowering stageWVRSD regression model0.9750.001 *
WVRPH regression model0.9920.000 *
‘*’ indicates significant difference at p < 0.01 level.
Table 4. Effects of different fertilizer application amounts on WVRSD and WVRPH.
Fertilizer Amount ChangeSeedling StageFlowering Stage
WVRSDWVRPHWVRSDWVRPH
+40%+0.0112+3.5333+0.0354+6.9333
+20%+0.0107+2.4611+0.0063+2.3667
00000
−20%−0.0155−2.2167−0.0209−2.4667
−40%−0.0267−4.7444−0.0344−5.637
Table 5. Results of significance tests for WVRSD and WVRPH regression equations under different fertilizer application amounts.
Source of VarianceRp
Seedling stageWVRSD regression model0.9680.007 *
WVRPH regression model0.9920.001 *
Flowering stageWVRSD regression model0.9940.001 *
WVRPH regression model0.9920.007 *
‘*’ indicates significant difference at p < 0.01 level.
Table 6. Effects of different water and fertilizer regimes on tomato fruit yield, WUE, and economic benefits.
TreatmentYield (kg/Plant)WUE (kg/m3)Economic Benefit (RMB/Plant)
WF12.36238.2131.38
WF22.19935.5529.84
CK2.01421.7124.93
Disclaimer/Publisher’s Note: The statements, opinions and data contained in all publications are solely those of the individual author(s) and contributor(s) and not of MDPI and/or the editor(s). MDPI and/or the editor(s) disclaim responsibility for any injury to people or property resulting from any ideas, methods, instructions or products referred to in the content.

