1. Introduction
Pleurotus eryngii is highly valued not only for its rich nutritional content but also for its health-promoting properties, such as its hypotensive and hypolipidemic effects (Zhang et al., 2020) [
1]. It is characterized by a thick flesh texture, a unique almond-like aroma and flavor profiles reminiscent of abalone. Its high oligosaccharide content supports prebiotic activity through beneficial interactions with
Bifidobacterium, offering potential dual advantages for gastrointestinal well-being and cosmetic applications (Wang et al., 2024) [
2]. In modern cultivation techniques, accurately measuring phenotypic traits like stipe length, pileus diameter, color characteristics and morphological features is essential for breeding programs. However, traditional manual measurement methods can be inefficient and inconsistent due to the risk of human error and subjective judgment.
Thanks to the rapid advancement of intelligent sensing, computer vision and deep learning technologies, agricultural phenotypic analysis is gradually moving toward automation, high-throughput processing and improved precision. In response to the increasing need for comprehensive data acquisition, several automated platforms have been developed, such as track-based systems (Li et al., 2023) [
3], pipeline and imaging chamber systems (Dengyu et al., 2016) [
4] and mobile platforms (Wang et al., 2023) [
5]. Zhou et al. (2021) [
6] created a portable and affordable plant phenotyping system that incorporates image sensors to assess soybean salt tolerance, thus supporting breeding programs. Zhu et al. (2023) [
7] developed a mushroom measurement system using resistance strain gauges to accurately determine position, size and weight. An et al. (2016) [
8] created a high-throughput phenotyping system using dual digital cameras to measure leaf length and rosette leaf area. These crop-specific systems greatly boost the efficiency of data collection, minimize human error and improve measurement accuracy.
Sensors like RGB imaging, hyperspectral imaging, RGB-D sensor and LiDAR are commonly used in plant phenotyping platforms to measure and analyze crop traits. These sensors play a valuable role in monitoring crop growth, conducting trait analysis and enabling precise breeding (Dengyu et al., 2016 [
4]; Li et al., 2023 [
3]; Wang Y. et al., 2023 [
5]). RGB-D camera and LiDAR are used to capture spatial information such as crop structure, volume and biomass (Raj et al., 2021 [
9]; Rong et al., 2023) [
10]. Compared to LiDAR, RGB-D sensor have lower hardware and computational costs (Ravaglia et al., 2019) [
11], which makes them a great choice for medium and small-scale phenotypic acquisition and automated systems. Baisa and Al-Diri (2022) [
12] investigated the potential of using affordable consumer-grade RGB-D sensor to create an innovative algorithm. This algorithm focuses on detecting, locating and estimating the 3D pose of mushrooms to enable efficient robotic picking capabilities. Zhou et al. (2024) [
13] introduced a method to align RGB and depth images and convert 2D coordinates into 3D coordinates via reverse prediction, allowing for precise measurement of corn stem diameters. These studies enhance RGB images through the introduction of depth information, reducing the requirement for external references (such as checkerboards or calibration objects) and thereby enhancing the accuracy of measurement and the practicality of the system.
In phenotypic analysis research, image segmentation is a crucial step in extracting morphological parameters (Narisetti et al., 2022) [
14], particularly when it comes to tasks such as size measurement and area calculation, where precise semantic segmentation becomes very important for achieving accurate results. The segmentation results can be used to determine the contour area and length-width dimensions of crops through geometric calculation methods (Raj et al., 2021) [
9]. For instance, Yang et al. (2022) [
15] introduced a segmentation and localization method for
Agaricus bisporus using Mask R-CNN, applying elliptical fitting techniques to determine the centroid position and stem size of the mushrooms. Meanwhile, Kolhar and Jagtap (2023) [
16] adopted the DeepLabV3 Plus to perform contour segmentation of Komatsuna leaves, enabling the estimation of leaf count, projected area and growth stages. The segmented regions of interest not only help to reduce the influence of environmental and other factors but also allow us to integrate the color quantization and grading algorithm within the chromaticity space (Ahmad et al., 2021) [
17] with the shape classification algorithm based on contour features (Vazquez et al., 2024) [
18]. The integration allows for the precise classification of various phenotypic parameters, such as color and shape.
Recent advancements have been made in non-destructive geometric measurement of
Pleurotus eryngii. Luo et al. (2024) [
19] used RGB-D imaging to measure
Pleurotus eryngii volume, filling an early gap in mushroom phenotyping and greatly reducing detection time. However, their method focuses solely on volume and does not consider gill-related phenotypic information. Similarly, Yin et al. (2025) [
20] used mobile multi-view imaging combined with structured light to reconstruct the 3D geometry of
Pleurotus eryngii, enabling detailed modeling of surface features. Nevertheless, their method still relies on external structured-light modules, involves a relatively complex and time-consuming acquisition process, and is not well suited for high-throughput, and real-time phenotyping in breeding or production environments.
One of the key challenges in acquiring multiple phenotypes of Pleurotus eryngii is to develop an efficient, portable and precise method for phenotype collection and analysis. To this end, the main contributions of this study encompass the following three aspects:
- (1)
We introduce a portable multi-phenotype acquisition system for Pleurotus eryngii using RGB and RGB-D cameras. This system addresses common inefficiencies and errors in traditional manual measurements, providing a fast, real-time, and precise approach for phenotyping edible fungi.
- (2)
We created an enhanced semantic segmentation model that improves the accuracy of mask segmentation for Pleurotus eryngii fruiting bodies and enables the automatic extraction of multiple phenotypic parameters.
- (3)
A set of algorithms was developed to efficiently measure the size, color and shape of Pleurotus eryngii, offering strong support for intelligent breeding analysis of edible fungi.
2. Materials and Methods
2.1. Phenotypic Acquisition Device
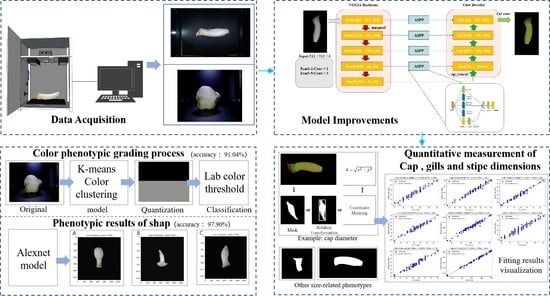
Figure 1 presents the phenotypic acquisition device, which consists of a dark chamber integrated with a RealSense D405 (Intel Corporation, Santa Clara, CA, USA), an RGB camera (Shenzhen Ruier Weishi Technology Co., Ltd, Shenzhen, China), a pressure sensor (Shenzhen Xintai Microelectronics Technology Co., Ltd, Shenzhen, China), a temperature/humidity sensor (Guangzhou Aosong Electronics Co., Ltd, Guangzhou, China), a light source controller with a 6-watt white LED, and an STM32F103C8T6 microcontroller (STMicroelectronics, Geneva, Switzerland). The microcontroller collects data from the sensors via UART serial communication and transmits them to the application terminal for real-time processing and interaction.
2.2. Data Acquisition
The
Pleurotus eryngii samples utilized in this study were sourced from Zhongyan Mushroom Industry Co., Ltd., located in Zhangzhou City, China Using the self-developed phenotypic acquisition platform, the samples were precisely positioned so that the caps were directed toward the RGB camera and the fruiting bodies aligned with the RGB-D camera at a working distance of 30 cm, as shown in
Figure 1. In total, more then 300 samples were systematically collected for analysis. In this study, 607 images of the fruiting bodies were captured using the RGB-D camera, while 304 images of the caps were acquired with the RGB camera. To ensure data consistency, all images were uniformly resized to 640 × 460 pixels.
In addition, key morphological parameters of each sample, including cap diameter and stipe length, were measured manually using a ruler. Cap color was quantitatively assessed with a standardized color chart. Based on manual observation and classification, the fruiting body morphology was categorized into three types: bowling-pin shaped (swollen on one side of the stipe), cylindrical (uniform width of cap, gills, and stipe), and standard type (broad cap with slender stipe). Similarly, the cap color was manually classified into three categories: yellowish-brown, dark brown, and light brown, based on reference color cards.
2.3. Data Preprocessing
In the image segmentation task, we assigned labels to the cap, gills and stipe of the Pleurotus eryngii fruiting body to help distinguish between different regions. Using Labelme (v4.5.11), each part of the fruiting body was manually annotated and organized into three categories: cap, gills, and stipe. The data were randomly divided into training, validation and test sets in 7:2:1 ratio.
To enhance model robustness and mitigate overfitting, we applied a variety of data augmentation techniques before training. Specifically, we randomly rotated and flipped images to introduce diversity, adjusted brightness, contrast and saturation to mimic real-world lighting conditions, scaled and cropped images to help the model adapt to different sizes and added random deformations to improve its ability to handle shape variations. The dataset was enriched by increasing the number of training images from 607 to 1136.
2.4. Model Structure and Improvement
2.4.1. U-Net Basic Network
Ronneberger et al. (2015) [
21] proposed the U-Net architecture, which has demonstrated strong effectiveness in medical image segmentation, particularly under limited training data. As illustrated in
Figure 2, the U-Net architecture primarily consists of an encoder, a series of skip connections, and a decoder. The encoder extracts hierarchical features through repeated convolution and downsampling operations, where the feature representations gradually transition from low-level spatial details to high-level semantic information. The skip connections transmit feature maps from the encoder to the corresponding decoder layers, enabling the model to retain fine-grained spatial information that may be lost during downsampling. This mechanism helps preserve localization accuracy and enhances the mode’s ability to delineate structural boundaries. The decoder then progressively restores spatial resolution through upsampling and convolution, integrating encoder features via skip connections to reconstruct detailed segmentation maps with high accuracy.
2.4.2. VGG16 Network Structure
Simonyan and Zisserman (2015) [
22] proposed the VGG16 network, a classic deep convolutional neural network architecture and its network structure is depicted in
Figure 3. VGG16 significantly improved model performance by increasing network depth and achieved outstanding results in the ImageNet Large Scale Visual Recognition Challenge (ILSVRC), establishing itself as an important foundation in modern computer vision research.
VGG16 construct a deep network by layering multiple small convolutional kernels (3 × 3 kernels). Compared with earlier architectures relying on large convolutional filters, the use of small kernels allows the network to increase depth while keeping the number of parameters manageable. This thoughtful design enables VGG16 to achieve an excellent balance between depth and computational efficiency. By progressively stacking multiple small convolutional kernels, the network can effectively learn local details while gradually capturing broader image features through deeper-level combinations. This thoughtful design enables the network to excel in both precision and scope of feature extraction.
VGG16 also exhibits strong transfer-learning capability. It delivers competitive performance on ImageNet and performs well in downstream tasks such as image classification, object detection, and semantic segmentation. Thanks to its robust capabilities, it has become a cornerstone for computer vision applications. Researchers can efficiently develop domain-specific models by fine-tuning pre-trained VGG16. Its architecture is easy to work with and excels at feature extraction, which makes it as a favored choice in deep learning research. Although more advanced architectures such as ResNet and EfficientNet have emerged, VGG16 continues to serve as a reliable and influential benchmark due to its simplicity, robustness, and ease of implementation.
2.4.3. The Pyramid Pooling Module
The Atrous Spatial Pyramid Pooling (ASPP) module (He et al., 2014) [
23] is widely employed in computer vision tasks, including image segmentation and object detection, to enhance a model’s capacity for multi-scale feature extraction As shown in
Figure 4, ASPP utilizes atrous convolutions with multiple dilation rates (e.g., 1, 2, 4, and 8) to capture both local details and global contextual information. Its primary advantage lies in expanding the receptive field while maintaining computational efficiency.
To further improve performance, the ASPP module integrates a global average pooling layer, which computes the mean of the entire feature map, providing global context and ensuring that essential semantic information is retained during feature fusion. Subsequently, multi-scale and global features are aggregated along the channel dimension to form a comprehensive feature representation, significantly enhancing the effectiveness of deep learning models in visual tasks. For example, its incorporation into the DeepLab series has demonstrated superior performance in image segmentation, particularly in scenes with complex backgrounds and objects of varying scales, improving both segmentation accuracy and recall.
2.4.4. Aspp-VGGUnet Network Structure
In this work, we enhanced the encoder of the U-net structure by replacing its original downsampling pathway with the first 13 convolutional layers of VGG16 and incorporating a pyramid structure into the Copy and Crop phase. The improved U-net network is shown in
Figure 5, primarily consisting of an enhanced encoder feature extraction network and skip connections.
Specifically, the five convolutional blocks of VGG16 were adopted to substitute the “convolution + max pooling” structure in the standard U-net encoder. The feature maps output from each VGG16 block were used as multi-scale representations for the corresponding encoding stages. Leveraging the continuous small-kernel convolutions and pre-trained weights of VGG16 enables the encoder to extract richer low-level textures, structural patterns, and semantic information while reducing feature loss during downsampling.
Furthermore, the ASPP module was incorporated into the skip connections. For each skip connection, the feature map from the encoder is first processed by ASPP, where parallel atrous convolutions with different dilation rates generate multi-scale contextual responses. These enhanced features are then concatenated with the corresponding decoder features to facilitate more effective feature fusion. By expanding the receptive field without compromising spatial resolution, ASPP provides strong multi-scale context perception and significantly improves boundary delineation, localization accuracy, and the overall robustness of the segmentation network.
2.5. Phenotypic Measurement Algorithm
To evaluate the effectiveness of the method introduced in this work for measuring the phenotypic parameters of Pleurotus eryngii, we selected eight key characteristics as measurement indicators. These include the color of the cap, the maximum diameter of the cap, the thickness and length of the cap, the length and width of the gills, the length of the stem and the overall shape of the fruiting body.
2.5.1. Algorithm for Measuring Dimensional Phenotypes
This approach employs optical triangulation technology to calculate the spatial position of an object relative to the camera, thereby generating depth images in the process. To estimate the size information of fruiting bodies, caps, gills and stems, their regions of interest are typically extracted first. Subsequently, the length of their minimum bounding rectangles is measured to obtain phenotypic size data. For this study, the measurement method consists of three critical stages, The detailed steps of the process are presented in
Figure 6:
- (1)
The regions of interest for the cap, gills and stem of the mushroom are identified using the Aspp-VggUnet semantic segmentation network.
- (2)
The mask block filters out irrelevant depth data to identify the ROI and preserve its depth values.
Defined by Equation (1), (u,v) denotes the pixel coordinates (column and row indices) where M is the binary segmentation mask, D is the raw depth map, and
denotes element-wise multiplication.
Since the object’s placement direction is predefined, its 2D mask contour is rotated by a known angle θ before calculating the minimum bounding rectangle (MBR). This aligns the MBR’s sides with the coordinate axes. The 2D rotation transformation is applied:
Defined by Equation (2) (x,y) are the original contour points, (x,y) are the rotated points, and is the centroid. This method standardizes orientation, ensuring measurement consistency.
This method standardizes the rectangle’s orientation and ensures consistency with the coordinate system.
- (3)
The horizontal dimensions of the 3D object’s projection are determined by mapping the ROI’s 3D contour coordinates to a 2D plane. Traditional calibration methods often produce significant size errors due to difficulty maintaining alignment between the calibration and measured objects during real-time measurements. RGB-D cameras, however, acquire depth information actively or passively, generating 3D point cloud data P = {
}, enabling direct Euclidean distance calculation for true dimensions:
This enables more precise measurement of
Pleurotus eryngii’s true size, reducing errors from height variations and complex shapes common in traditional methods.
2.5.2. Algorithm for Color Classification
In order to accurately capture the color details of Pleurotus eryngii caps, we applied the K-means clustering algorithm to identify and group the primary cap colors. K-means is a helpful unsupervised learning technique that organizes image pixels according to their color characteristics.
The specific procedures are presented as follows:
- (1)
The region of interest (ROI) in the cap is identified using the semantic segmentation algorithm, allowing us to focus on the most relevant areas.
- (2)
To identify the dominant color of the mushroom cap, the K-means clustering algorithm was first employed with K = 3 to group pixels into three major color clusters. Each pixel is assigned to the nearest cluster center based on Euclidean distance in RGB space:
Defined by Equation (4), p denotes a pixel represented as 3D vector in RGB space (R, G, and B intensity channels),
is the i-th cluster center, and d (p,
) denotes their Euclidean distance.
In this equation, p denotes a pixel point, and denotes the i-th cluster center. The cluster centers are iteratively updated based on the average color values of the assigned pixels until the algorithm converges. After convergence, the cluster containing the largest number of pixels is selected. The centroid color of this dominant cluster is then taken as the single representative foreground color of the cap.
- (3)
For finer perceptual color grading, the obtained cluster centroids (or the dominant centroid) are transformed into the perceptually uniform Lab color space. By analyzing their positions in this space—particularly the lightness (L) and yellow–blue (b) components—and establishing empirically derived thresholds based on sample statistics, the color grades (light brown, yellowish brown, and dark brown) can be accurately classified, ensuring precise and consistent color differentiation.
The classification rules are defined as follows: Light Brown corresponds to L* > 60 and b* > 10; Yellowish Brown corresponds to 45 ≤ L* ≤ 60 and b* > 15; and Dark Brown corresponds to L* < 45 and b* ≤ 15. These thresholds were optimized through statistical analysis of color centroids obtained from 134 labeled samples, ensuring that the grading aligns with human visual perception while maintaining objective measurability and reproducibility.
2.5.3. Algorithm for Shape Classification
As shown in
Figure 7, the AlexNet network consists of eight convolutional layers arranged consecutively. Each layer is followed by a max pooling layer and uses the ReLU activation function to enhance non-linear features. Additionally, the network includes three fully connected layers that help achieve the final classification output. During the data preprocessing stage, all input images are resized to 227 × 227 pixels to meet the requirements of the AlexNet model. The number of output channels in the convolutional layers is 96, 256, 384, 384 and 256. Through this step-by-step feature extraction and compression process, the model learns the shape characteristics of the
Pleurotus eryngii fruiting body, enabling it to make accurate predictions. Finally, the model makes decisions using a fully connected layer with 1000 neurons and outputs the classification results.
2.6. Experimental Environment
For this experiment, we utilized an Intel® Xeon® Silver 4214R CPU with a clock speed of 2.40 GHz, 90 GB of memory and an RTX 3080 Ti GPU. The deep learning framework was established on the Ubuntu 20.04 system using Python 3.9.0 and PyTorch 2.1.0. In the segmentation task, we employed the Adam optimizer with a momentum value of 0.9, an initial learning rate of 0.0001, a batch size of 8 and a total of 135 training iterations.
2.7. Evaluation Indices
In this work, commonly adopted evaluation metrics were employed to comprehensively assess model performance. For the semantic segmentation of Pleurotus eryngii fruiting bodies, mPA, mIoUand F1-score (also known as the Dice coefficient) were used. In addition, Mean Squared Error (MSE) and the coefficient of determination (R2) were utilized to evaluate the accuracy of the size phenotype extraction algorithm, mPA reflects the average pixel accuracy across all categories and evaluates how accurately each category’s pixels are classified.
MPA is a core evaluation metric for semantic segmentation. It computes the pixel-wise classification accuracy for each class independently and then averages these accuracies across all classes. Compared to overall PA, mPA treats each class equally, thereby effectively mitigating evaluation bias caused by class imbalance in pixel count.
Defined by Equation (5), K denotes the total number of semantic classes; (True Positives) denotes the number of pixels correctly predicted as class ; (False Negatives) denotes the number of pixels that actually belong to class but are incorrectly predicted as other classes.
MIoU can be used to evaluate the performance of semantic segmentation. It calculates the IoU for each category and then determines the average value.
Defined by Equation (3), (False Negatives) denotes the number of pixels that belong to class in the ground truth but are incorrectly predicted as other classes;
The F1 Score (or Dice coefficient) is a metric that thoughtfully balances precision and recall, making it particularly well-suited for scenarios where classes are imbalanced.
MSE is a commonly used metric for understanding the difference between a model’s predicted values and its true values. Calculating the average of the squared prediction errors it provides insight into how accurate the model is. A smaller RMSE value indicates that the model’s predictions are closer to the actual values, which is a sign of better performance.
R2 is used to evaluate how well the size phenotype algorithm explains the variability in the actual size data of
Pleurotus eryngii. Its value ranges between 0 and 1, and the closer it gets to 1, the better the algorithm fits the data.
n is the number of pixels or samples. is the ground truth value. is the predicted value produced by the model.
By combining the MSE and R2, the model’s performance can be evaluated from two complementary angles. R2 provides insight into how well the model fits the size data, while MSE quantifies the discrepancy between predicted and actual measured values. Together, these metrics help gain a deeper understanding of the algorithm’s accuracy and reliability, offering valuable guidance for further refinement.
4. Discussion
A portable phenotyping system for
Pleurotus eryngii was developed, integrating an RGB camera and the RealSense D405 to simultaneously capture RGB and depth images for 3D phenotypic measurement (Zhou et al., 2021) [
24]. Furthermore, the proposed modified U-Net architecture based on ASPP and the VGG16 network achieved remarkable performance enhancements in the segmentation tasks of the cap, gills, and stem, with the mIoU reaching 96.47% and mPA attaining 98.53%. Although excellent results were achieved in the current task, the performance of this network might be constrained by specific datasets, and its generalization ability in other domains (such as medical images, remote sensing images) and complex outdoor scenarios still requires further validation.
In the task of phenotypic acquisition and analysis, this study proposes a method that utilizes depth information from the camera to calculate three-dimensional coordinates and directly compute size parameters based on spatial data. Unlike traditional 2D imaging or fixed-distance measurement approaches, this method relies on depth-derived 3D coordinates for calculation, thereby fundamentally avoiding the scale errors caused by variations in imaging distance (Guo & Chen, 2018) [
25]. The method stands out for its ability to meet size measurement requirements in complex scenarios, providing robust and reliable support for phenotypic analysis. This advantage becomes particularly evident when compared with multi-view neural radiance field (NeRF)-based reconstruction methods, such as that presented by Yin et al. (2025) [
20], which require extended data acquisition and processing time. Our system maintains measurement accuracy while significantly improving throughput, making it better suited for high-throughput or near-real-time applications such as on-site breeding screening. In contrast, our method demonstrates superior acquisition efficiency, providing rapid and reliable phenotypic measurements suitable for high-throughput or real-time applications.
For color and shape classification, the perceptually uniform Lab color space was adopted to decouple luminance from chromaticity, establishing an illumination-robust pipeline that enhanced the repeatability and standardization of color assessment. Meanwhile, a standard AlexNet model effectively resolved subtle morphological variations across mushroom phenotypes, attaining a classification accuracy of 97.90%. These results confirm that established computer vision and deep learning architectures, when embedded within a customized hardware-software pipeline, can reliably execute complex phenotypic analysis under controlled imaging environments. Nevertheless, the present performance remains dependent on consistent acquisition conditions and dataset uniformity. Extending the system to scenarios with variable illumination, wider genetic backgrounds, or less structured field settings would require further validation and could be improved through adaptive preprocessing or transfer-learning strategies to enhance generalization capability.
In summary, the method introduced in this study has achieved notable success in tasks such as phenotype acquisition, color classification and shape classification. However, there are still some areas for improvement, including the reliance on depth information accuracy and challenges with color stability under extreme lighting conditions. While this study focuses on the automated extraction of mature phenotypes, investigating phenotypic variations across different maturity levels and growth conditions will be an important direction for future research. Further development, for example, by incorporating time-series models and dynamic phenotypic data at different environmental conditions for a given variety, will help broaden the understanding of mushroom morphological changes.


