Article

Design and Experiment of a Variable-Rate Spraying System Based on RBFNN-SMC Control

1
College of Engineering, Heilongjiang Bayi Agricultural University, Daqing 163319, China
2
College of Information and Electrical Engineering, Heilongjiang Bayi Agricultural University, Daqing 163319, China
*
Author to whom correspondence should be addressed.
Agriculture 2025, 15(23), 2444; https://doi.org/10.3390/agriculture15232444
Submission received: 27 October 2025 / Revised: 19 November 2025 / Accepted: 24 November 2025 / Published: 26 November 2025
(This article belongs to the Section Agricultural Technology)

Abstract

To address the issue of improving the accuracy and efficiency of variable-rate application under large-scale field conditions, an RBFNN-SMC variable-rate application control system was designed and experimentally verified. A first-order inertial pure lag model of the spray flow rate was identified through step tests. Based on this, three controllers, namely traditional SMC, fuzzy SMC, and RBFNN-SMC, were designed for comparison. The simulation results indicated that RBFNN-SMC had the shortest adjustment time and the smallest steady-state error under conditions of model uncertainty and time delay. Its maximum overshoot was reduced by 11.2% compared to traditional SMC, and the steady-state error was controlled within ±0.51%. The control strategy was implemented on a microcontroller and integrated with a prescription-based spray system. Field trials showed that the average absolute error of the proposed system in tracking the target flow rate was 3.2%, and it achieved a weed control effect comparable to that of traditional uniform spraying. These results suggest that the RBFNN-SMC-based variable spray rate system can enhance flow rate control performance and support more precise and potentially more sustainable herbicide application, providing a reference and ideas for the research on variable-rate application flow rate control based on prescription maps.

1. Introduction

The application of chemical pesticides remains the most economical and effective solution for controlling weeds in farmland. The uniform application rate of spraying often leads to over-application in areas with low weed pressure and under-application in areas with high weed pressure. Over-application not only increases input costs but also intensifies soil and water pollution and the risk of developing herbicide-resistant weed populations. Variable-rate spraying technology achieves precise spatial control of pesticide application through the acquisition and integration of multi-source information, thereby reducing the amounts of chemical agents used and their environmental impact while maintaining weed control effectiveness. The main technical routes can be divided into two categories: offline guidance based on prescription maps and real-time target control based on sensors [1,2,3]. Compared with real-time target control schemes, the variable-rate spraying technology based on prescription maps is more suitable for large-scale field weed control due to its fast operation speed and comprehensive information acquisition [4,5].
Extensive research has been conducted globally on prescription map-based variable-rate spraying control systems. Mariano et al. [6] utilized machine vision to generate weed prescription maps, determining flow rate adjustments based on prescription values and feedback signals from flow sensors at nozzles. They employed fixed-pulse control to regulate solenoid valve operations for individual nozzles during spraying tests, achieving a delay distance error of approximately 0.044 m. Ma [7] designed a variable-rate spraying control system leveraging prescription map data, implementing a pulse-width modulation approach with solenoid valves in field experiments. The results indicated average absolute relative errors of 2.07%, 1.99%, and 1.82% for flow rate, pressure, and speed, respectively, with an average absolute relative error of 2.04% for application volume, demonstrating minimal control deviations. Liu et al. [8] developed a variable-rate spraying system based on the PTO protocol, where the main controller receives user-defined application rates, calculates corresponding nozzle duty cycles, and transmits them via CAN communication to multi-channel controllers for real-time adjustment of solenoid nozzles’ switching frequency and duty cycle. The system exhibited satisfactory control stability and reliability within a duty cycle range of 20% to 94%, though field validation of application efficacy remains pending. Zhang et al. [9] designed an improved premixing variable-rate spraying system controlled by an Arduino platform, enabling precise mixing of water and chemical concentrates. Experimental results confirmed high control accuracy, yet variable-rate spraying trials based on prescription maps were not conducted. Salcedo et al. [10] implemented pulse-width modulation (PWM) technology to regulate nozzle flow rates through solenoid valves, testing three control modes (Manual-PWM, Laser-PWM, Disabled-PWM) to reduce pesticide usage, thereby mitigating environmental impact and lowering agricultural costs. Wang et al. [11] developed a multi-return variable-rate spraying system modifying existing wide-span crop protection equipment, adjusting spraying flow by regulating proportional control valve openings at return ports. Testing revealed relative errors between actual and set application volumes below 6%, indicating high precision in variable-rate spraying. Nasir et al. [12] proposed novel pressure and flow control techniques for variable-speed precision agricultural sprayers, employing direct solenoid valve actuation with PID and cascade feedback control strategies. Cai et al. [13] designed an electric ball valve-based application system capable of variable regulation using environmental parameters (temperature, humidity, wind speed), establishing a mathematical model for application volume through pressure–volume relationship analysis. While simulation studies yielded preliminary results, physical prototype testing was not conducted. Padhiary et al. [14] developed a semi-autonomous vehicle sprayer that regulates nozzle pressure and flow rate by controlling the pump, flow control valve, and pressure regulating valve based on operational speed and wind velocity, thereby minimizing drift. Experimental results demonstrate that this system achieves superior spray uniformity (96.82–97.67%), field capacity (0.2–0.3 ha/h), and field efficiency (65%).
In summary, existing research has achieved progress in nozzle-level on/off control, pressure/return flow regulation, and mixture ratio control [15]. However, although pressure-based and mixture-based solutions feature simple structures and lower costs, they struggle to rapidly stabilize the spray volume to the setpoint, exhibiting significant dynamic hysteresis. In contrast, PWM solutions offer faster response and better droplet distribution uniformity, yet they heavily rely on the performance of high-speed solenoid valves [16,17,18]. Due to their respective limitations, these methods are yet to be well-suited for large-scale variable-rate spraying applications based on prescription maps. Balancing high operational efficiency with control accuracy remains a core challenge in promoting prescription map-based variable-rate spraying control systems.
Previous research has extensively investigated various advanced agricultural spraying control strategies, encompassing Fuzzy PID control, sliding-mode control (SMC), backstepping control, and neural network-based methodologies, among others. Most of these works demonstrated improved tracking performance under specific operating conditions, but either relied on complex models or were validated only in simulation or laboratory settings. In this work, SMC is adopted as the basic framework because it offers strong robustness against modeling errors, parameter variations, and external disturbances, which are unavoidable in pesticide spraying due to nonlinear valve characteristics and fluctuations in pressure and forward speed. These robustness and fast-response properties make SMC more suitable than conventional PID-type controllers for guaranteeing accurate flow-rate tracking under variable-rate application conditions.
On this basis, a Radial Basis Function Neural Network (RBFNN) is introduced as an adaptive compensator. The RBFNN is a class of feedforward neural networks with universal approximation capability; by learning the nonlinear mapping between tracking errors and unknown disturbances, it can adaptively compensate for parameter variations and unmodeled dynamics in real time [19,20]. When embedded into the SMC structure, the neural compensator helps to reduce chattering and improve steady-state accuracy without requiring an accurate process model. This makes the proposed RBFNN-SMC controller particularly suitable for prescription-map-based variable-rate spraying, where the commanded flow rate changes frequently with the spatial prescription and machine operating conditions.
To address the aforementioned issues, this study proposes a control strategy that employs RBFNN to optimize Sliding Mode Control (SMC), termed RBFNN-SMC. Centered around the STM32 microcontroller, the system utilizes PWM to drive the electric flow control valve and integrates a flow sensor to form a closed-loop control architecture. This approach realizes a variable spray rate system suitable for prescription map-driven scenarios. To validate the effectiveness of the proposed approach, comparative simulations involving conventional SMC, fuzzy SMC, and RBFNN-SMC were conducted. Field experiments under real farming conditions were also carried out to evaluate flow control accuracy, dynamic flow adjustment, and field weed control efficacy. The research focuses on the most critical scenario of “adjacent prescription level transitions” in prescription map-driven variable-rate application, directly aligning with the prescription grid resolution to accurately measure the real impact of “boundary over-spray/under-spray.” By introducing a neural network online compensator on top of the sliding mode control (SMC) baseline, adaptive compensation is achieved for unmodeled hydraulic hysteresis, velocity disturbances, and pressure fluctuations, significantly reducing overshoot and spatial lag at prescription transition points. Compared to existing solutions, such as nozzle-level PWM switching/segmented control, return flow pressure stabilization, and ratio control, this control system directly regulates volumetric flow rate without conflicting with pressure stabilization/ratio control, and can even provide more precise target flow rates for nozzle-level PWM or segmented control at a higher level.

2. Materials and Methods

2.1. Variable-Spray Control System Architecture and Operational Principles

The variable-rate spraying system based on weed prescription maps comprises a 3WPZ-1300 self-propelled high-clearance boom sprayer (Shandong Xiangrui Agriculture and Forestry Technology Co., Ltd., Linyi, China) as the carrier, a variable-rate spraying control system, and a handheld host computer, as illustrated in Figure 1. The upper computer (8, Xiaomi Technology Co., Ltd., Beijing, China) retrieves prescription maps and real-time GPS (7) data, calculates target flow rates, and transmits the data via Bluetooth to the vehicle-mounted controller (9). This controller executes the RBFNN-SMC algorithm to issue control commands based on feedback from the flow sensor (13), thereby precisely regulating the electrically actuated flow control valve (12) for accurate variable-rate spraying.
The variable-rate spraying control subsystem is primarily composed of an STM32F407ZGT6 microcontroller (Guangzhou Xingyi Electronic Technology Co., Ltd., Guangzhou, China), a 2W025-08/DC24V solenoid valve (Delixi Electric Co., Ltd., Yueqing, China), a PM-03L electric flow control valve (Shenzhen Paigesen Technology Co., Ltd., Shenzhen, China), a DC1.8-5.5V flow sensor (Yueqing Ponai Sensor Technology Co., Ltd., Yueqing, China), and a WL-801 pressure sensor (Shanghai Weiruitai Instrument Co., Ltd., Shanghai, China). The microcontroller features a 168 MHz Cortex-M4F core with integrated FPU/DSP, providing sufficient PWM/ADC/timer resources to achieve hard real-time closed-loop control for valve PWM driving and flow/pressure sampling. The solenoid valve’s adaptation to PWM frequency and duty cycle, along with its response time, meets the target bandwidth, while its pressure resistance range covers the spraying working pressure. The flow control valve exhibits a maximum error of less than 0.5%, utilizing analog signals for high precision and simplified processing. The flow sensor and pressure sensor offer detection ranges of 2–45 L/min and 0–10 Mpa, respectively, with an accuracy class of 0.5% FS, and their pressure resistance performance fully satisfies the testing requirements. Based on the geographic location and spraying application rate information derived from the prescription map interpreted by the host computer, the control strategy is executed to make decisions. The microcontroller outputs PWM signals to adjust the opening of the electric flow control valve and the on/off state of the solenoid valve, thereby regulating the flow rate within the system. By integrating real-time flow data feedback from the flow sensor, the subsystem continuously adjusts and tracks the target spraying volume to ensure precision in application.

2.2. Design of the RBFNN-SCM

2.2.1. Modeling of Variable-Rate Application Control System

In practical spray operations, the controlled object model is closely associated with numerous factors, such as variations in water pressure, the inherent characteristics of the valve control system, water hammer effects induced by valve opening and closing processes, and flow fluctuations resulting from changes in the liquid supply pressure of the chemical pump [21]. Considering all these factors would render the system analysis exceedingly complex and complicate the establishment of an accurate system model. Without loss of generality, the pesticide spraying system of plant protection equipment can be represented by a linear model at a specific operating point. The mathematical model of the system is identified using input-output data. Based on mechanistic studies of electrically regulated valves, the drive signal of the valve actuator is regarded as the adjustable input variable, while the pipeline flow rate serves as the output variable.
This study aims to establish a mathematical model of the spraying system under the ideal spraying state of the plant protection machine. The process of the electric regulating valve controlling the water supply system is divided into two parts. The flow characteristics related to the valve body can be approximately regarded as a first-order inertial link. The transfer function is expressed as Equation (1).
G v ( s ) = Q v ( s ) U ( s ) = K 1 T 1 s + 1
  • GV(S) = Qv(s)/U(s) is the transfer function of the valve body;
  • K1—the flow gain of the valve body, [L/min];
  • T1—the time constant of the valve body, [s];
  • s—complex frequency variable in the Laplace domain.
In engineering practice, the transfer function of an electric actuator can be approximated as a first-order inertial delay element with a dead time of 2T, accounting for both electromagnetic and mechanical inertia of the actuating mechanism. The transfer function is expressed as Equation (2).
G a ( s ) = Q a ( s ) U ( s ) = K 2 e - τ s T 2 s + 1
  • Ga(S) = Qa(s)/U(s) is the transfer function of the electric actuator;
  • K2—the gain of the actuator, [L/min];
  • T2—the time constant of the actuator, [s];
  • τ—the signal transmission delay time, [s].
Consequently, the comprehensive model of the entire system can be conceptualized as a series connection of the aforementioned two components, with its transfer function represented by Equation (3).
G ( s ) = G a ( s ) G v ( s ) = K e τ s ( T 1 s + 1 ) ( T 2 s + 1 )
where G(S) is the transfer function of the entire system; K = K1K2 denotes the overall gain.
Given the significant disparity between the time constants of the two first-order inertial elements (T1 = 0.80 s, T2 = 0.20 s), and to simplify the controller design, the model can be further reduced to a first-order inertial model with time delay using Skogestad’s half-rule method for first-order equivalence [22]:
T T 1 + 0.5 T 2 = 0.90 s , τ 0.25 s , K 0 = K
  • T—the time constant, [s];
  • K0—the system gain, [L/min].
Here, τ is adopted from step-response inspection (0.20–0.25 s), taking the conservative bound 0.25 s. Hence, Equation (5) is derived as follows from the aforementioned analysis.
G 0 ( s ) = Q ( s ) U ( s ) = K 0 e τ s T s + 1
where Q(S) and U(S) are the Laplace transforms of q(t) and u(t), respectively.
  • u—the control input (PWM duty cycle signal);
  • q(t)—flow rate contributions [L/min].
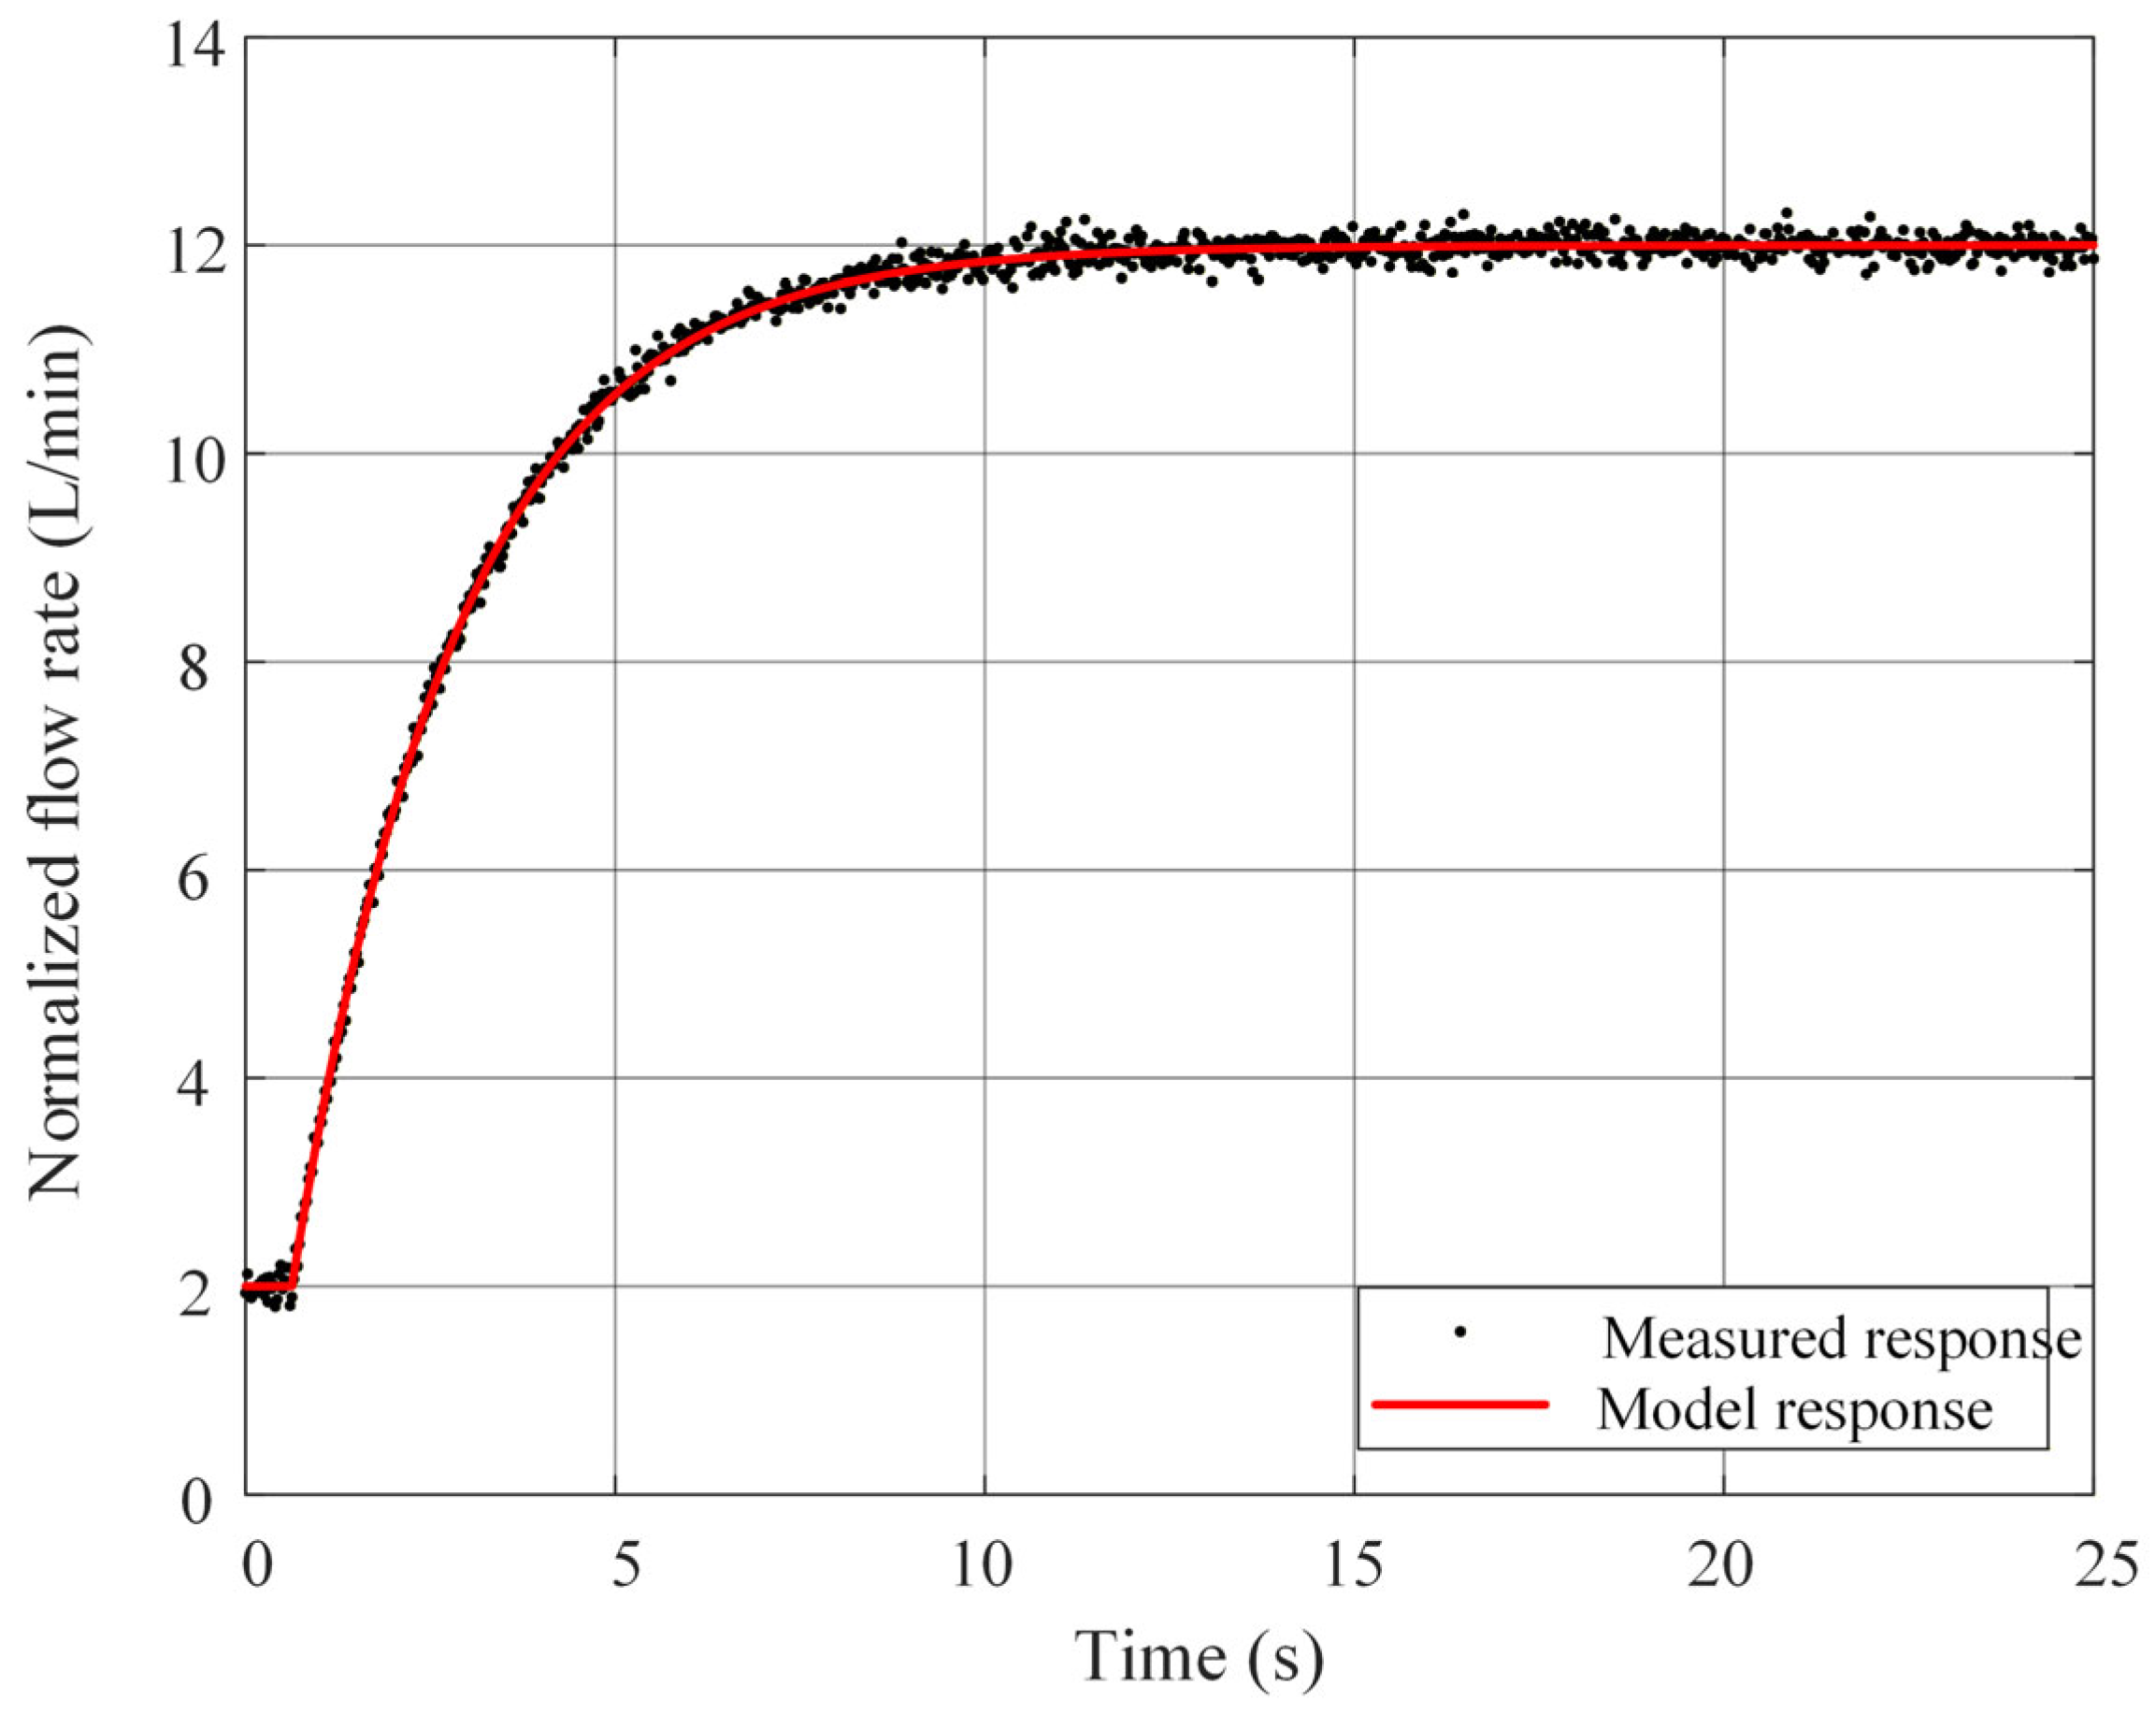
The parameters in (5) were identified from step-response experiments on the 3WPZ-1300 sprayer. The sampling period for flow rate and pressure feedback has been configured at 100 Hz. This value approximates one-twentieth of the dominant time constant of the spray system. This selection adheres to the conventional criterion of setting the value below T/10, which is sufficient to capture relevant dynamic variations while preventing aliasing phenomena. Additionally, it maintains a low computational load on the STM32 microcontroller. System identification was performed in MATLAB R2022b using the System Identification Toolbox to fit a first-order plus dead-time structure by minimizing the prediction error criterion, with K0 = 1.0, T = 1.0 s, and τ = 0.15 s, achieving a best-fit value of 91.09%.
As illustrated in Figure 2, the measurement response scatter points exhibit a high degree of overlap with the simulated response curve throughout the entire regulation process, indicating that the simplified model possesses sufficient accuracy for controller design and performance analysis.
For comparison, the two-point method is further applied to the step response at two ratio points p1 and p2 (arrival times tp1 and tp2), yielding the calculation shown via Equation (6).
T s = t p 2 t p 1 ln 1 p 1 1 p 2 , τ s = t p 1 + T s ln ( 1 p 1 )
  • Ts—The time constant obtained via the two-point method, [s];
  • τs—The equivalent delay determined via the two-point method, [s];
  • p1—the first response ratio point selected;
  • p2—the second response ratio point selected;
  • tp1—the arrival time of p1, [s];
  • tp2—the arrival time of p2, [s].
The results demonstrate that the simplified model satisfies the time-scale separation criterion with T2/T1 = 0.25 ≤ 0.3. The first-order equivalent model yields T ≈ 0.90 s and τ ≈ 0.25 s, while the two-point method produces Ts ≈ 0.90 s and τs ≈ 0.20 s, showing strong consistency between the two approaches. It is therefore justified to adopt the reduced first-order model with time delay for subsequent controller design.

2.2.2. Design of SMC

To address the system’s nonlinearity, time-varying characteristics, and external disturbances, SMC was selected as the fundamental control framework [23]. In prescription map-guided variable-rate spraying, the desired spray volume yd varies dynamically based on GPS positioning and operational speed. The control objective is to minimize the error between the actual spray volume y, measured via flow sensor feedback, and the desired value yd, while ensuring stable tracking performance under operational disturbances. The tracking error is defined as shown in Equation (7).
e = y d y
  • e—the tracking error, [L/min];
  • yd—the desired spray volume, [L/min];
  • y—the actual spray volume, [L/min].
Given the requirement for steady-state accuracy in the spraying system, an integral sliding surface is designed as shown in Equation (8).
s = e + λ e d t
  • s—sliding surface variable, [L/min];
  • λ—sliding surface coefficient;
where λ > 0 governs the convergence rate. The objective is to design a control law such that s → 0, thereby ensuring e → 0.
Based on the principles of system dynamics:
y ˙ = f ( x , t ) + b ( x , t ) u
  • f(x,t)—the aggregate of unmodeled dynamics, nonlinear characteristics, and external disturbances;
  • b(x,t)—the control input gain.
The ideal equivalent control is defined as:
u e q = 1 b ( x , t ) y ˙ d + λ e f ( x , t )
  • ueq—Equivalent Control.
However, since f(x,t) is unknown, the actual control law needs to incorporate a switching term to ensure that the reaching condition is obtained as shown in Equation (11):
u a = u e q k sat ( s / φ )
  • ua—actual control law;
  • φ—the boundary layer thickness, [L/min];
  • k—the switching gain;
  • sat()—the saturation function.

2.2.3. Integration of RBFNN with SMC

To mitigate chattering intensity and reduce dependence on switching gain k, an RBFNN is introduced to approximate the unknown function f(x,t) online. Simulation results demonstrate that when the hidden layer comprises five nodes, the network achieves an optimal balance between approximation performance and computational efficiency, along with high control precision. The inputs to the input layer consist of the tracking error e(k) at the k-th sampling instant, the error integral term ∫e(k)dt, and the error derivative term e · (k). With the fixed scaling factors 3, 7, 3 applied to the three channels, the normalized inputs become e/3, ∫edt/7, e · /3. This normalization process compresses the magnitudes of the three channels to the same order of magnitude, ensuring that the Gaussian kernel width h maintains consistent physical significance across the three dimensions, thereby facilitating the placement of basis function centers and widths on a unified scale. The normalized input signals are then fed into the hidden layer, where Gaussian radial basis functions serve as activation functions. The outputs propagate forward and are linearly combined by the weighting coefficients Wi in the output layer, yielding the final output of the neural network, which represents the estimated value of the system’s unknown dynamics f(x,t). Utilizing the Xavier initialization method, the initial weights are randomly generated within the range of −0.5 to 0.5 [24].
RBFNN Architecture:
Input Layer: x = [x1, x2, x3]T; Normalization processing is designed to accelerate network convergence.
Hidden Layer: Employs five Gaussian radial basis function nodes, with the output expressed as:
h i = exp x c i 2 2 σ i 2 , i = 1 , 2 , 3 , 4 , 5
  • hi—hidden layer output;
  • ci—the i-th RBF center;
  • σi—the i-th RBF width.
Output Layer: Linearly combines the hidden layer outputs to generate estimated values for unknown items:
f ^ ( x ) = i = 1 5 w i h i + b
  • wi—output layer weights;
  • b—output layer bias.
To achieve uniform coverage and avoid weight oscillations caused by over-parameterization, the center ci is set to M = 5, selected from the candidate list −1.5, −1, −0.5, 0, 0.5, 1, 1.5, choosing the first five to cover high-probability regions. On one hand, a small-scale network is sufficient to approximate the locally equivalent perturbations observed in simulations and bench tests in this study. On the other hand, M = 5 ensures that the computational complexity of each forward and backward step is sufficiently low, guaranteeing real-time performance on the embedded side. All basis functions adopt a uniform width σi = h, and the width can be designed according to the “desired adjacent overlap degree ρ,” which can be derived from exp(−g2/2h2) = ρ.
h = g 2 ln ( 1 / ρ )
Simulation analysis reveals that when the normalized g is on the order of 3 × 10⁻², ρ ≈ 0.2∼0.35 is selected. Consequently, the range of h is from 0.018 to 0.030, and a uniform width of h = 0.02 is adopted to ensure locality while avoiding pathological collinearity caused by excessive overlap of multiple kernels.
The control law is revised as follows:
u = u ^ e q k sat ( s / φ )
The parameter ûeq is approximated through the output of the RBFNN, significantly reducing the reliance on precise mathematical models.
The weight update mechanism employs gradient descent to yield Equation (16).
Δ w i = η s s u h i
  • Δwi—The incremental adjustment of the weight associated with the i-th output layer;
  • η—learning rate;
  • s u —sensitivity of the sliding surface to the control input u.
Constructing a Lyapunov function for stability analysis:
V = 1 2 s 2 + 1 2 η i = 1 4 w ˜ i 2
where w ˜ i = w i w i * denotes the weight error and w i * represents the ideal weight. By differentiating and substituting the control law and weight update law, the following expression is derived after simplification:
V ˙ η | s | + | s | | ε | + | s | | Δ |
In the equation, ε denotes the bounded approximation error of the neural network (|ε| ≤ εN), and Δ represents the sum of external disturbances and unmodeled dynamics of the system (|Δ| ≤ Δmax).
According to Equation (18), if the sliding mode gain is designed such that k > εN + Δmax, then v · ≤ −|s|(kεN − Δmax) holds. Based on Lyapunov stability theory, the system satisfies the condition for uniform ultimate boundedness. The sliding surface s and the tracking error e will be attracted and stabilized within a small neighborhood around the origin, the size of which is determined by the neural network approximation accuracy εN and the upper bound of disturbances Δmax. The introduction of the RBFNN for online compensation of system uncertainties effectively reduces the requirement for switching gain η, thereby significantly mitigating control chattering while ensuring stability.
Based on the Lyapunov function candidate in (17), the sufficient condition for asymptotic convergence is k > kmin = (|ε|max + Δmax)/φ. The controller gains used in this study satisfy these inequalities, and no divergence or sustained oscillations were observed in either simulation or field experiments, which provides practical confirmation of the derived stability conditions.
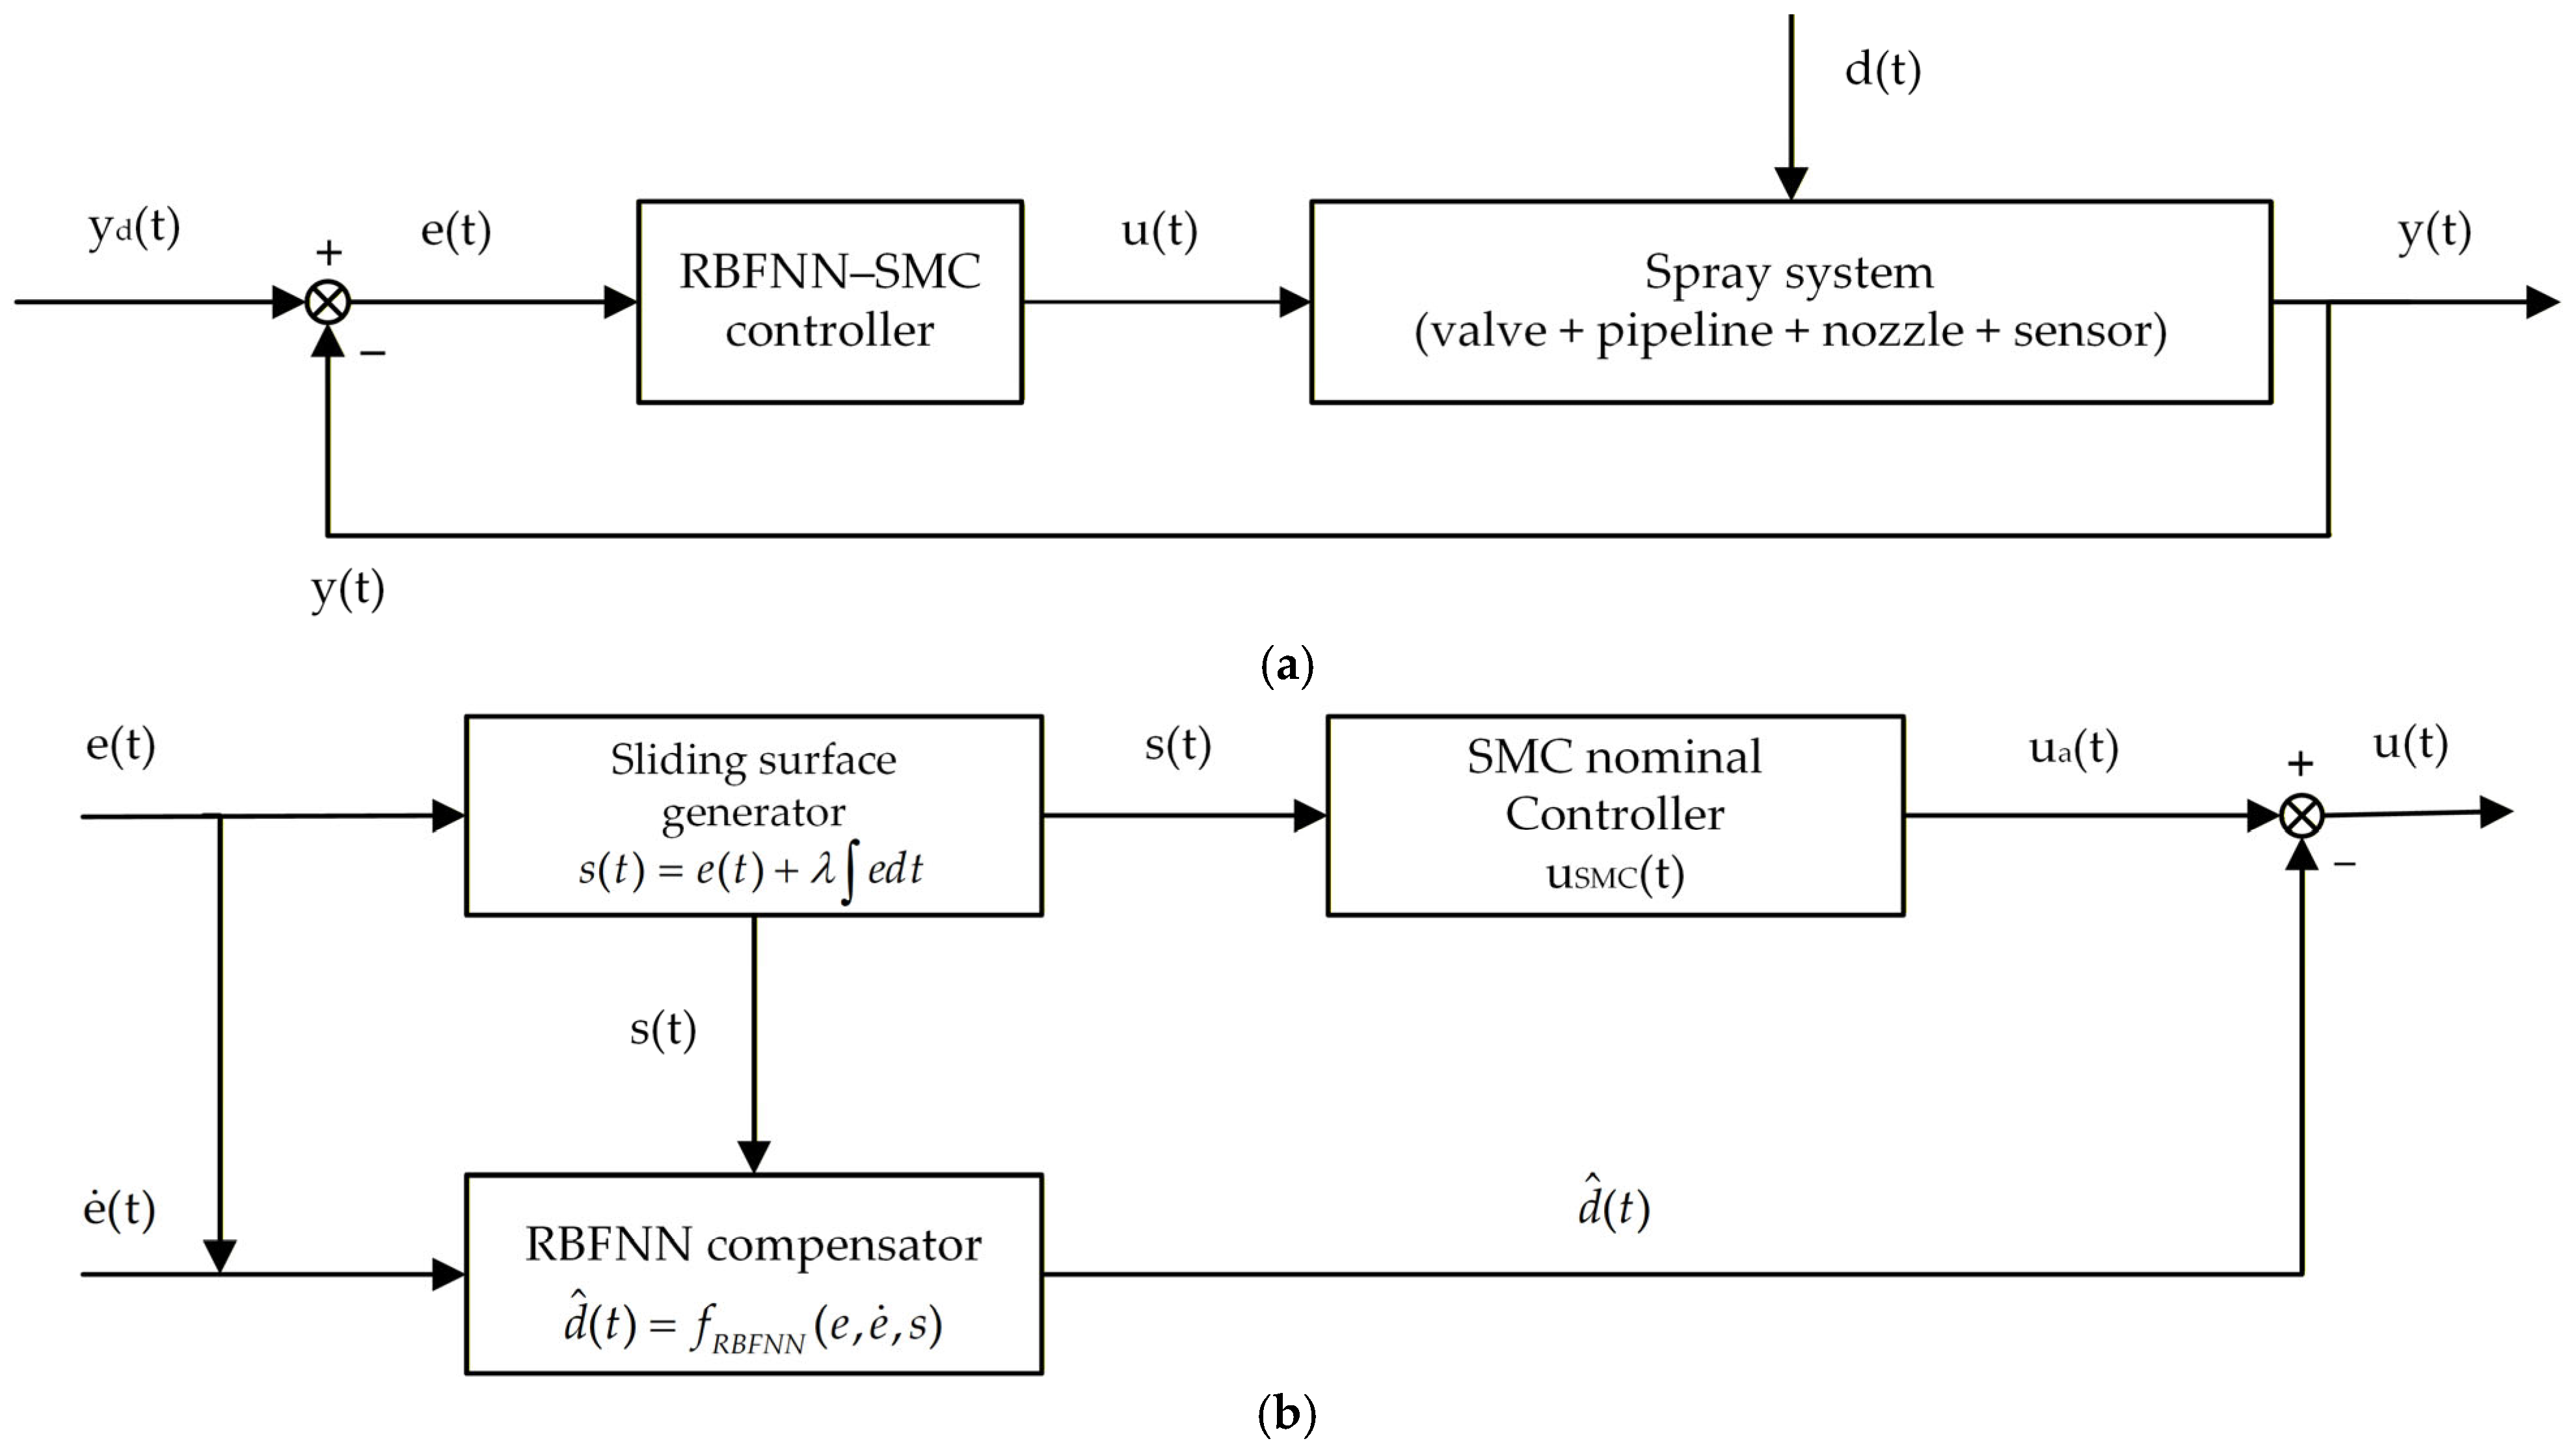
Figure 3a illustrates the closed-loop structure of the RBFNN-SMC variable dosing system. The error e is formed by the difference between the reference flow rate yd and the feedback flow rate y, which is then input into the internal RBFNN-SMC hybrid controller depicted in Figure 3b. Both e and its derivative e · serve as inputs to the RBFNN compensator, enabling online approximation of the equivalent disturbance term and providing an estimated value d ^ . This estimated value is synthesized with the generated ua to form the final control law u, thereby maintaining the robustness of sliding mode control while mitigating chattering induced by switching terms and enhancing steady-state accuracy.

2.3. Experimental Design and Methodology

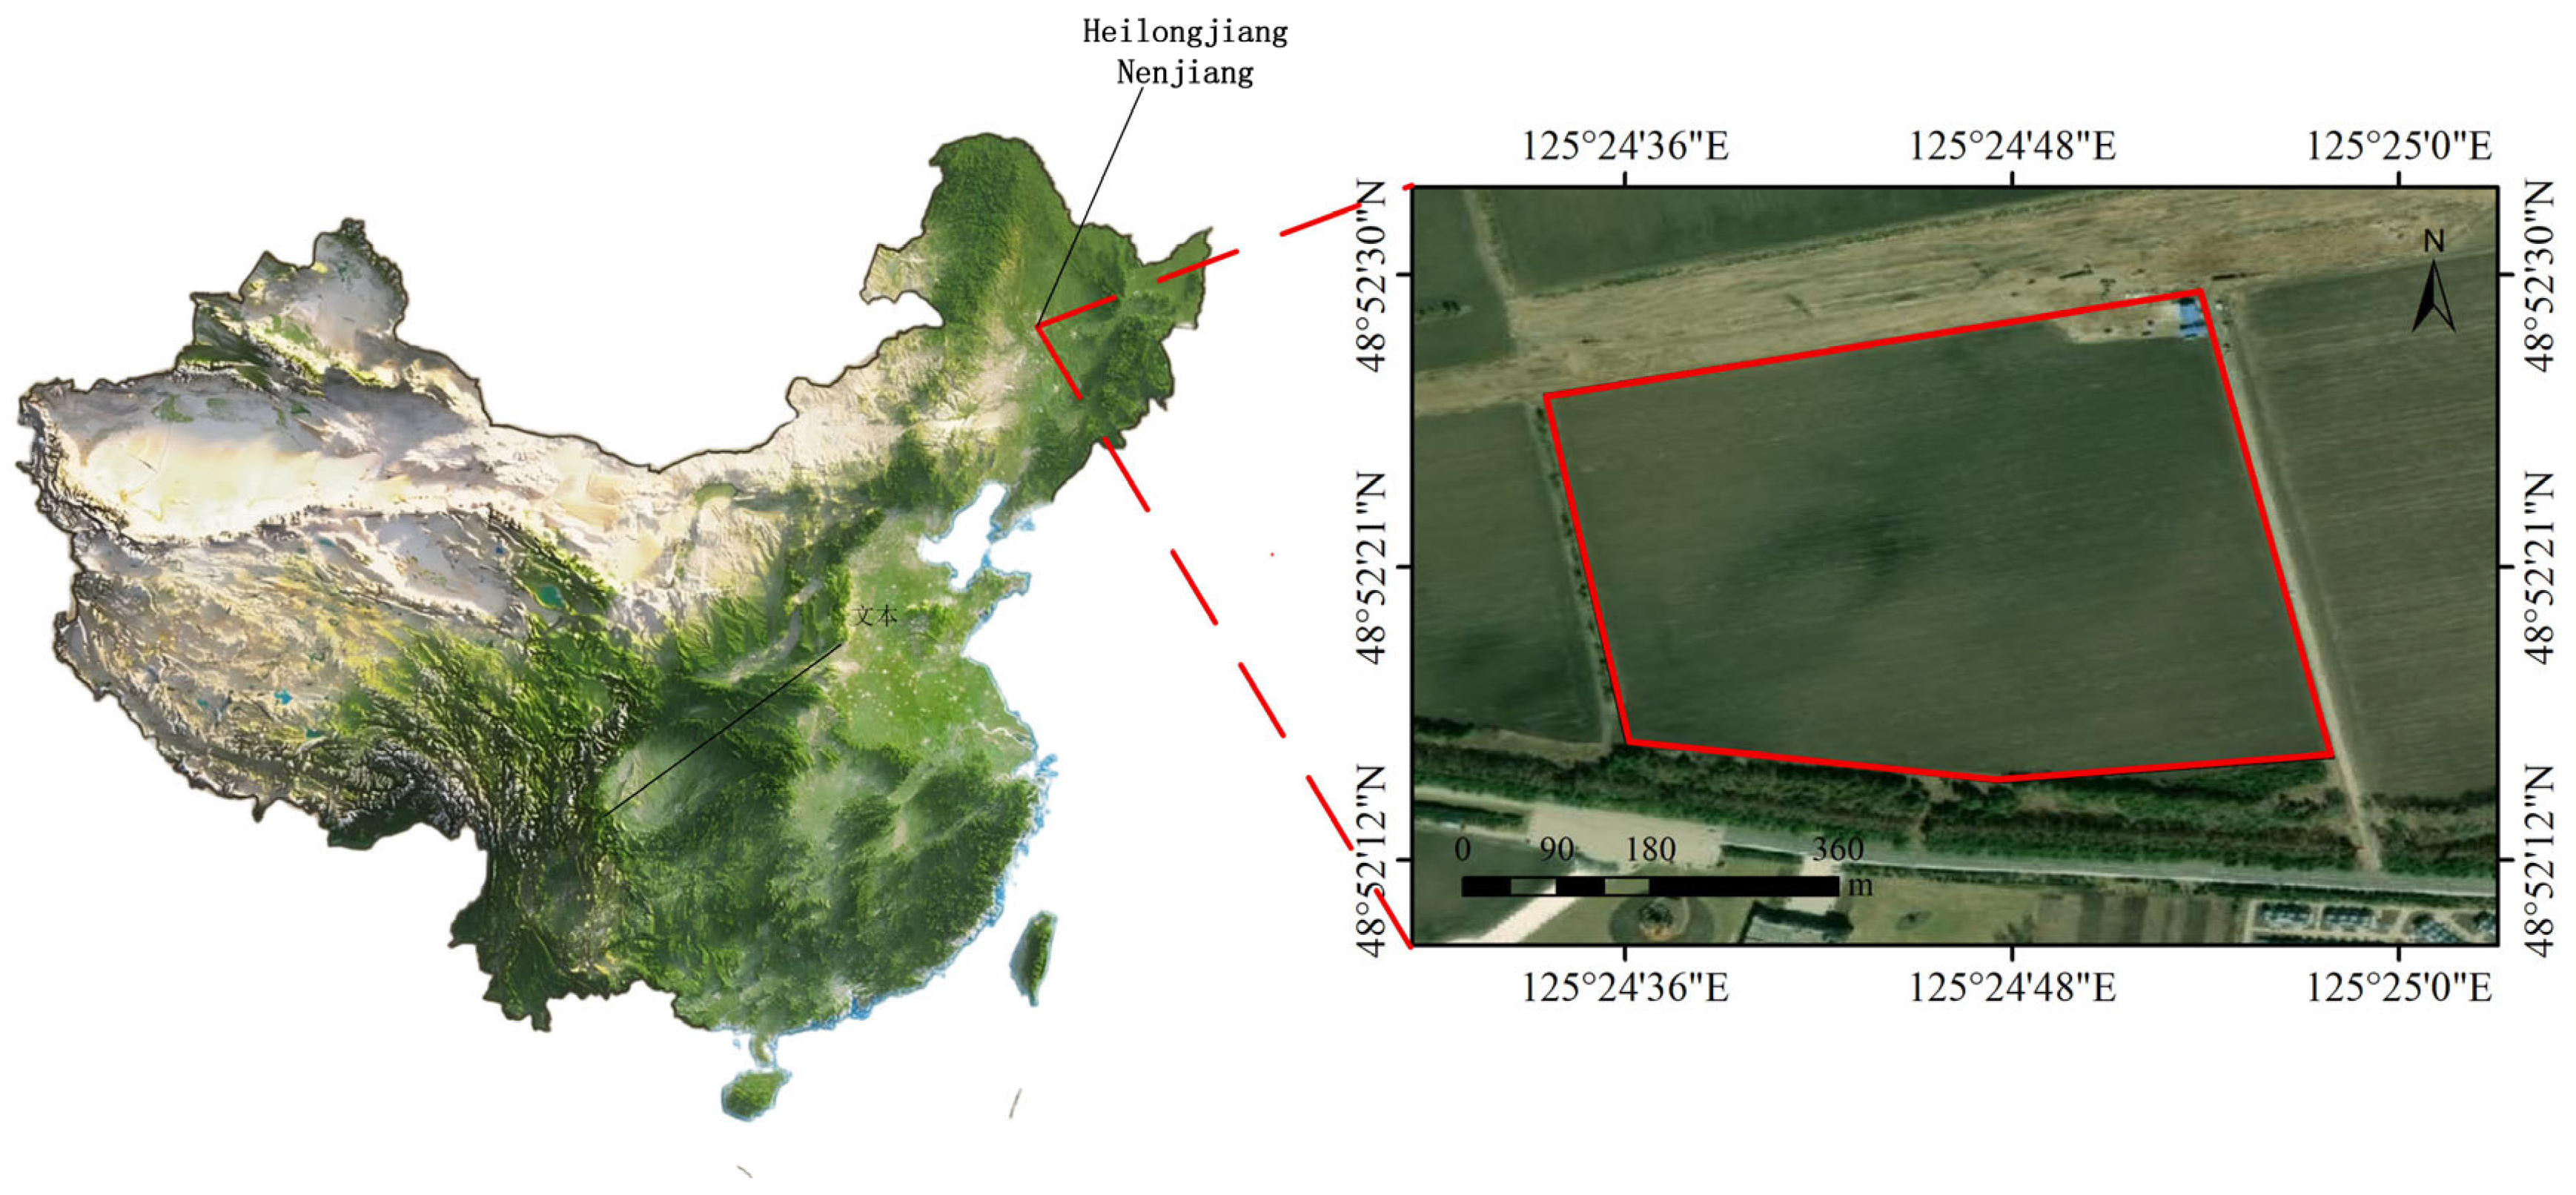
The experiment comprised a control system flow performance test and a field application efficacy test, conducted from 7 to 11 June 2025, at the Agricultural Machinery Factory of Jianshan Farm and the soybean experimental field of Jianshan Science and Technology Service Center under the Nenjiang Jiusan Administration in Heilongjiang Province. The position is as shown in Figure 4. The test references GB/T 20183.3-2024, “Equipment for crop protection—Spraying equipment—Part 3: Test method to assess the performance of volume/area adjustment systems,” [25] which specifies forward speeds of 4, 6, 8, 16, and 24 km/h for testing. Given that typical field spraying operations generally proceed at 6–10 km/h, and considering the demand for high efficiency and large spray volumes in practical field applications, the test speed range was set at 8–10 km/h, with a conventional spray volume of 120 L/ha. Based on the prescription map generated by the research team, the application rates in the study were progressively reduced in 5% increments relative to the conventional field rate, resulting in five application levels arranged in ascending order: 96, 102, 108, 114, and 120 L/ha. Prior to the experiments, the flow sensor was calibrated using a graduated cylinder and stopwatch over the operating range of 5–30 L/min, yielding a calibration error within ±0.4%, which meets the test requirements. And during the installation and commissioning of the equipment on the 3WPZ-1300 self-propelled high-clearance boom sprayer, it was found that when the valve opening reached 70%, the system had already reached its maximum flow rate. Therefore, to mitigate sensor noise and actuator saturation, a moving-average filter and jump-detection logic are applied to the flow-rate measurement, while conditional integration with saturation limits is used in the controller to prevent integral windup. The synthesized control signal and valve duty cycle are further bound to the actuator range,

2.3.1. System Accuracy Verification Test

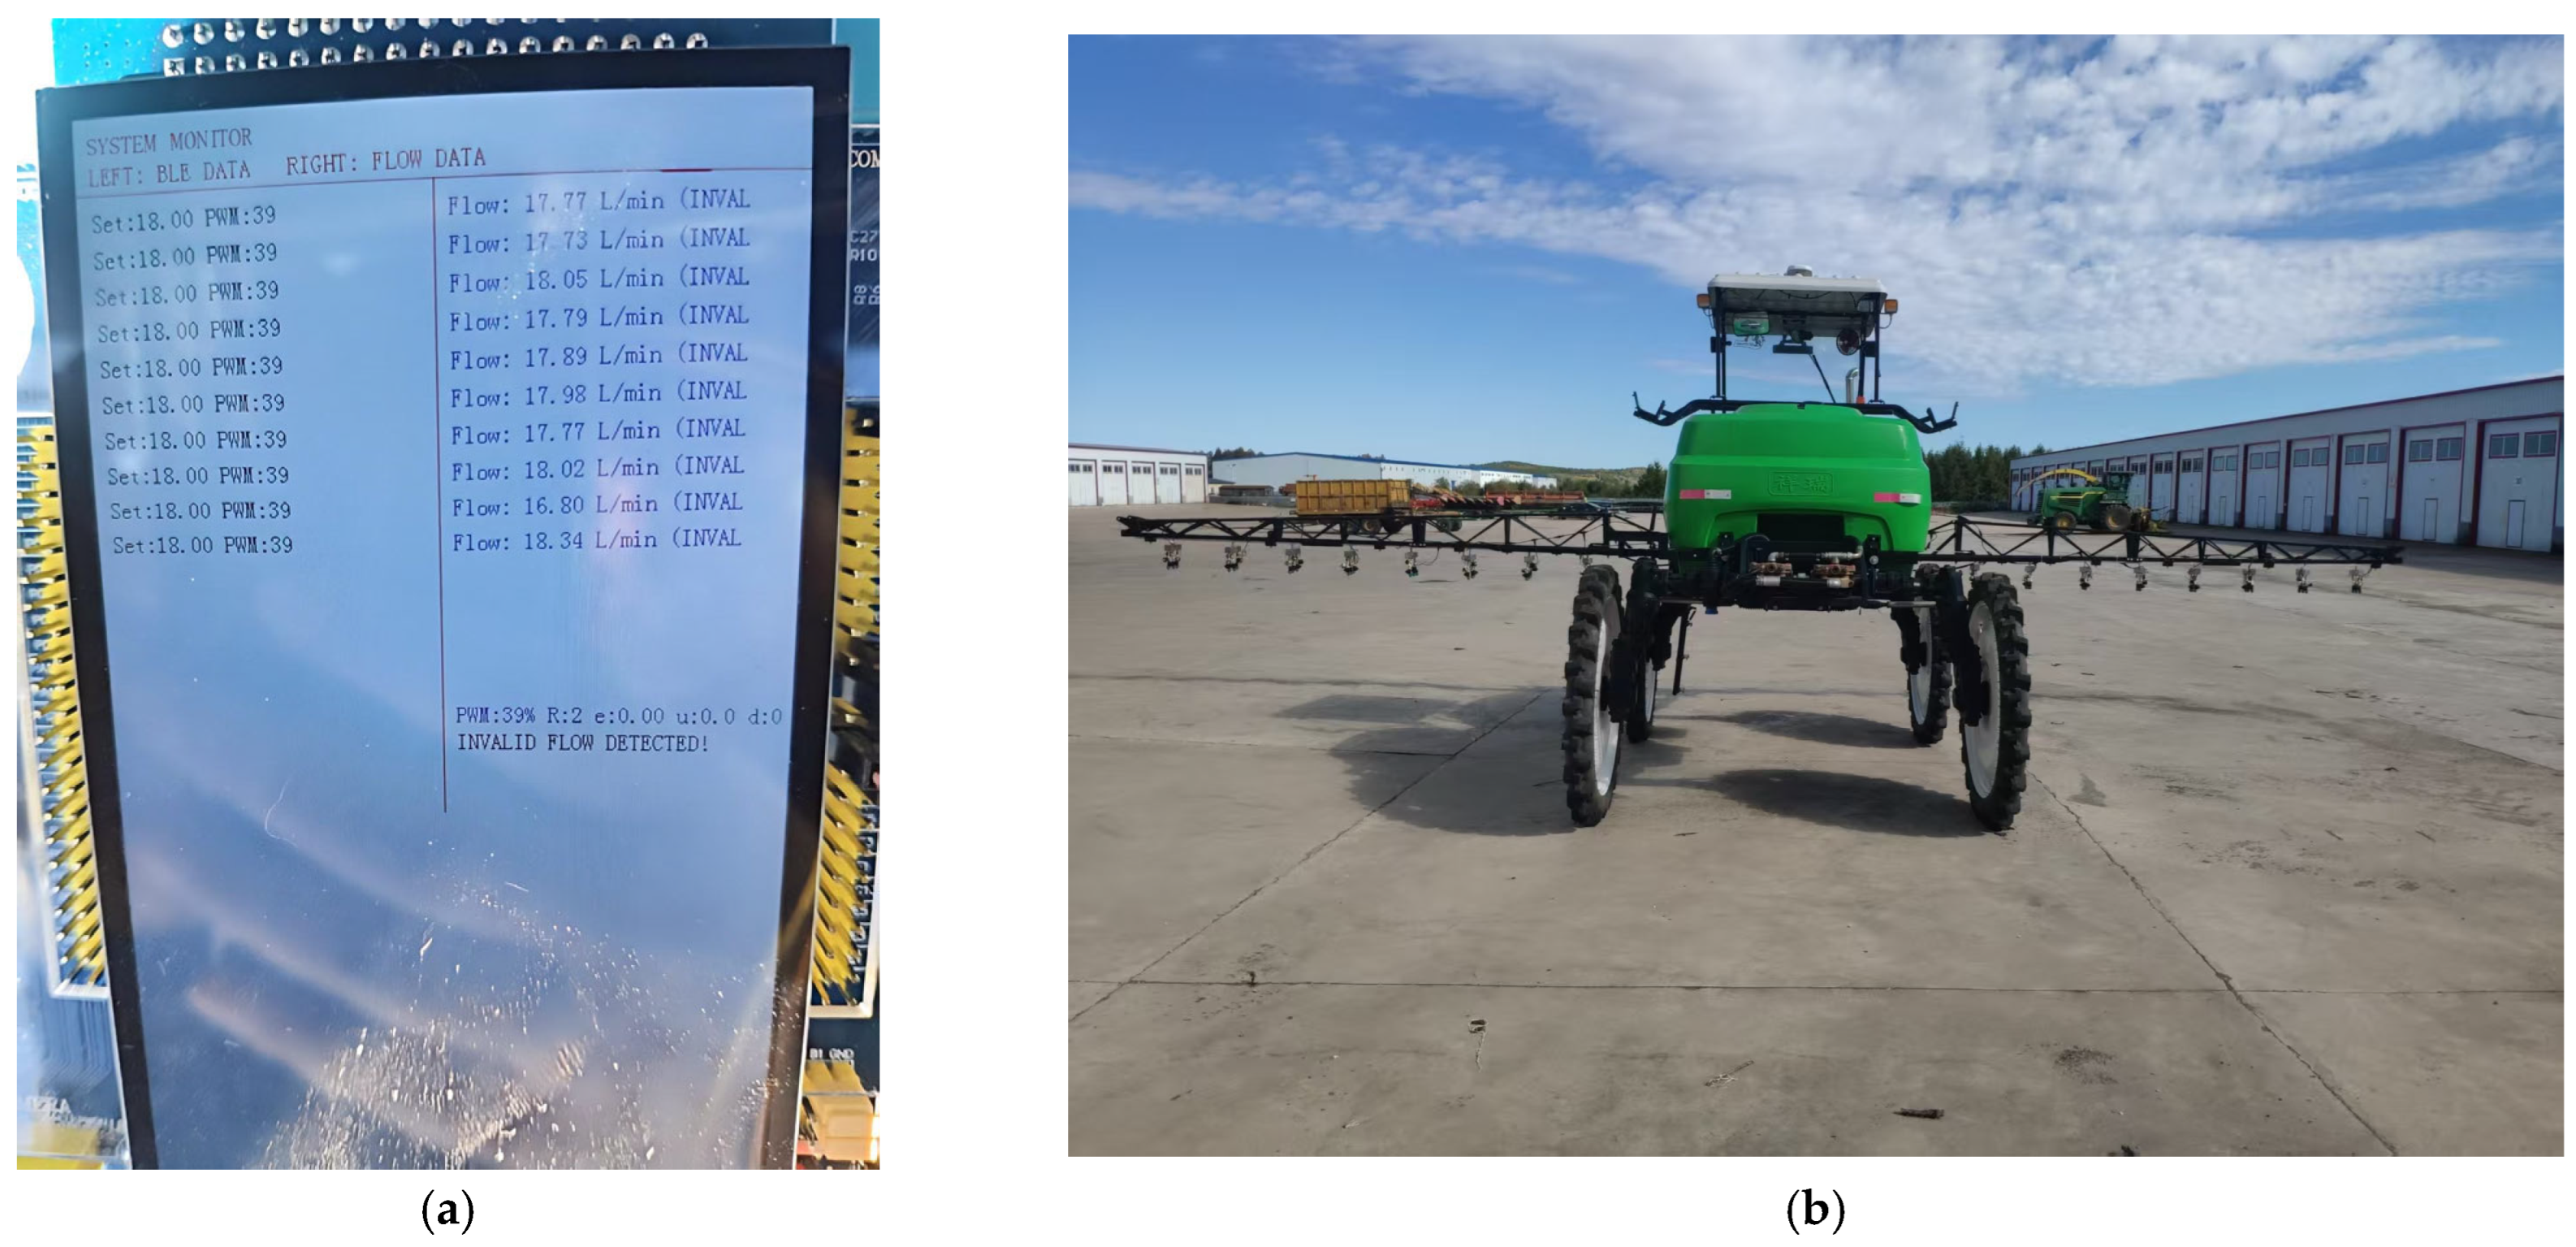
To evaluate the flow control precision of the designed RBFNN-SMC variable spraying system under preset application rates, the system was configured to operate in quantitative spraying mode. The experimental procedure is illustrated in Figure 5. Tests were conducted using water as the medium at vehicle speeds of 8, 9, and 10 km/h, with five gradient application rates. Utilizing graduated cylinders, the average spray volume was determined by conducting three one-minute spray measurements at each of the five spray gradient levels. After the flow sensor readings stabilized, as illustrated in Figure 6a, the actual discharge volume from the nozzles was collected and recorded for analysis. This experiment was repeated three times under the same conditions.
To effectively validate the real-time control superiority of the designed RBFNN-SMC variable-rate spraying system under field operating conditions, a comparative prescription approach with adjacent variation patterns was adopted to evaluate its dynamic tracking performance. Within a 100 × 20 m flat paved rectangular area at the Jianshan Farm Machinery Plant, a 55 × 11 m rectangular zone was demarcated and subdivided into five 11 × 11 m square plots, as illustrated in Figure 6b. Boundary coordinates were recorded using a CGI-430 GNSS receiver (Shanghai Huatai Navigation Technology Co., Ltd., Shanghai, China), and multiple simplified prescription maps were generated in ArcGIS (10.8, Environmental Systems Research Institute, Inc., Redlandz, CA, USA). based on the acquired coordinates. These maps were assigned five distinct spray application rates to ensure inclusion of all gradational differences. The prescription maps were then imported into the RBFNN-SMC variable-rate system for spray trials within the demarcated area. A DJI Action 4 camera (Shenzhen DJI Innovation Technology Co., Ltd., Shenzhen, China) recorded the process at 120 fps, enabling calculation of adjustment time by analyzing frame counts between marker passage and completion of flow control valve actuation. The experiment was repeated three times.

2.3.2. Field Efficacy Test of Pesticide Application

The experimental soybean field at Jianshan Technology Service Center spans 16.8 hectares. Herbicide application was conducted during the critical post-emergence weed control period, specifically from the soybean unifoliate stage to the first trifoliate expansion stage, as illustrated in Figure 7a. The operation was conducted from 15:00 to 18:00 under environmental conditions of 68% relative humidity, 23 °C temperature, and 2.1 m/s wind speed. A fan-shaped nozzle (requiring a working pressure of 0.2–0.5 MPa) was utilized, with the application pressure maintained within the range of 0.3–0.4 MPa. The nozzle was positioned 50 cm above the ground, and the sprayer operated at a speed of 9 km/h, and the working width was 12 m. As the working conditions were consistent with conventional application practices, factors such as wind speed, droplet characteristics, or drift patterns were not considered. The weed distribution map generated through analysis of UAV-acquired image data, developed by our research team, serves as a variable-rate application prescription map for precision spraying operations, as illustrated in Figure 7b. Herbicide solutions were prepared following standard farm formulations and dosage protocols. The field was divided into two comparative groups: variable-rate application and uniform application. Post-application weed control efficacy was evaluated following GB/T 17980.125-2004, “Pesticide—Guidelines for the field efficacy trials (II)—Part 125: Herbicides against weeds in soybean.” [26]. Based on weed density distribution, the experimental area was categorized into five density-grade zones. From each zone under both application methods, five sampling points (each covering 10 m2) were selected. UAV-based monitoring was conducted on the 7th, 10th, and 15th days after treatment, with manual quantification of weed counts from the aerial imagery to assess changes in weed population, as illustrated in Figure 7c.

3. Results

3.1. Control System Simulation

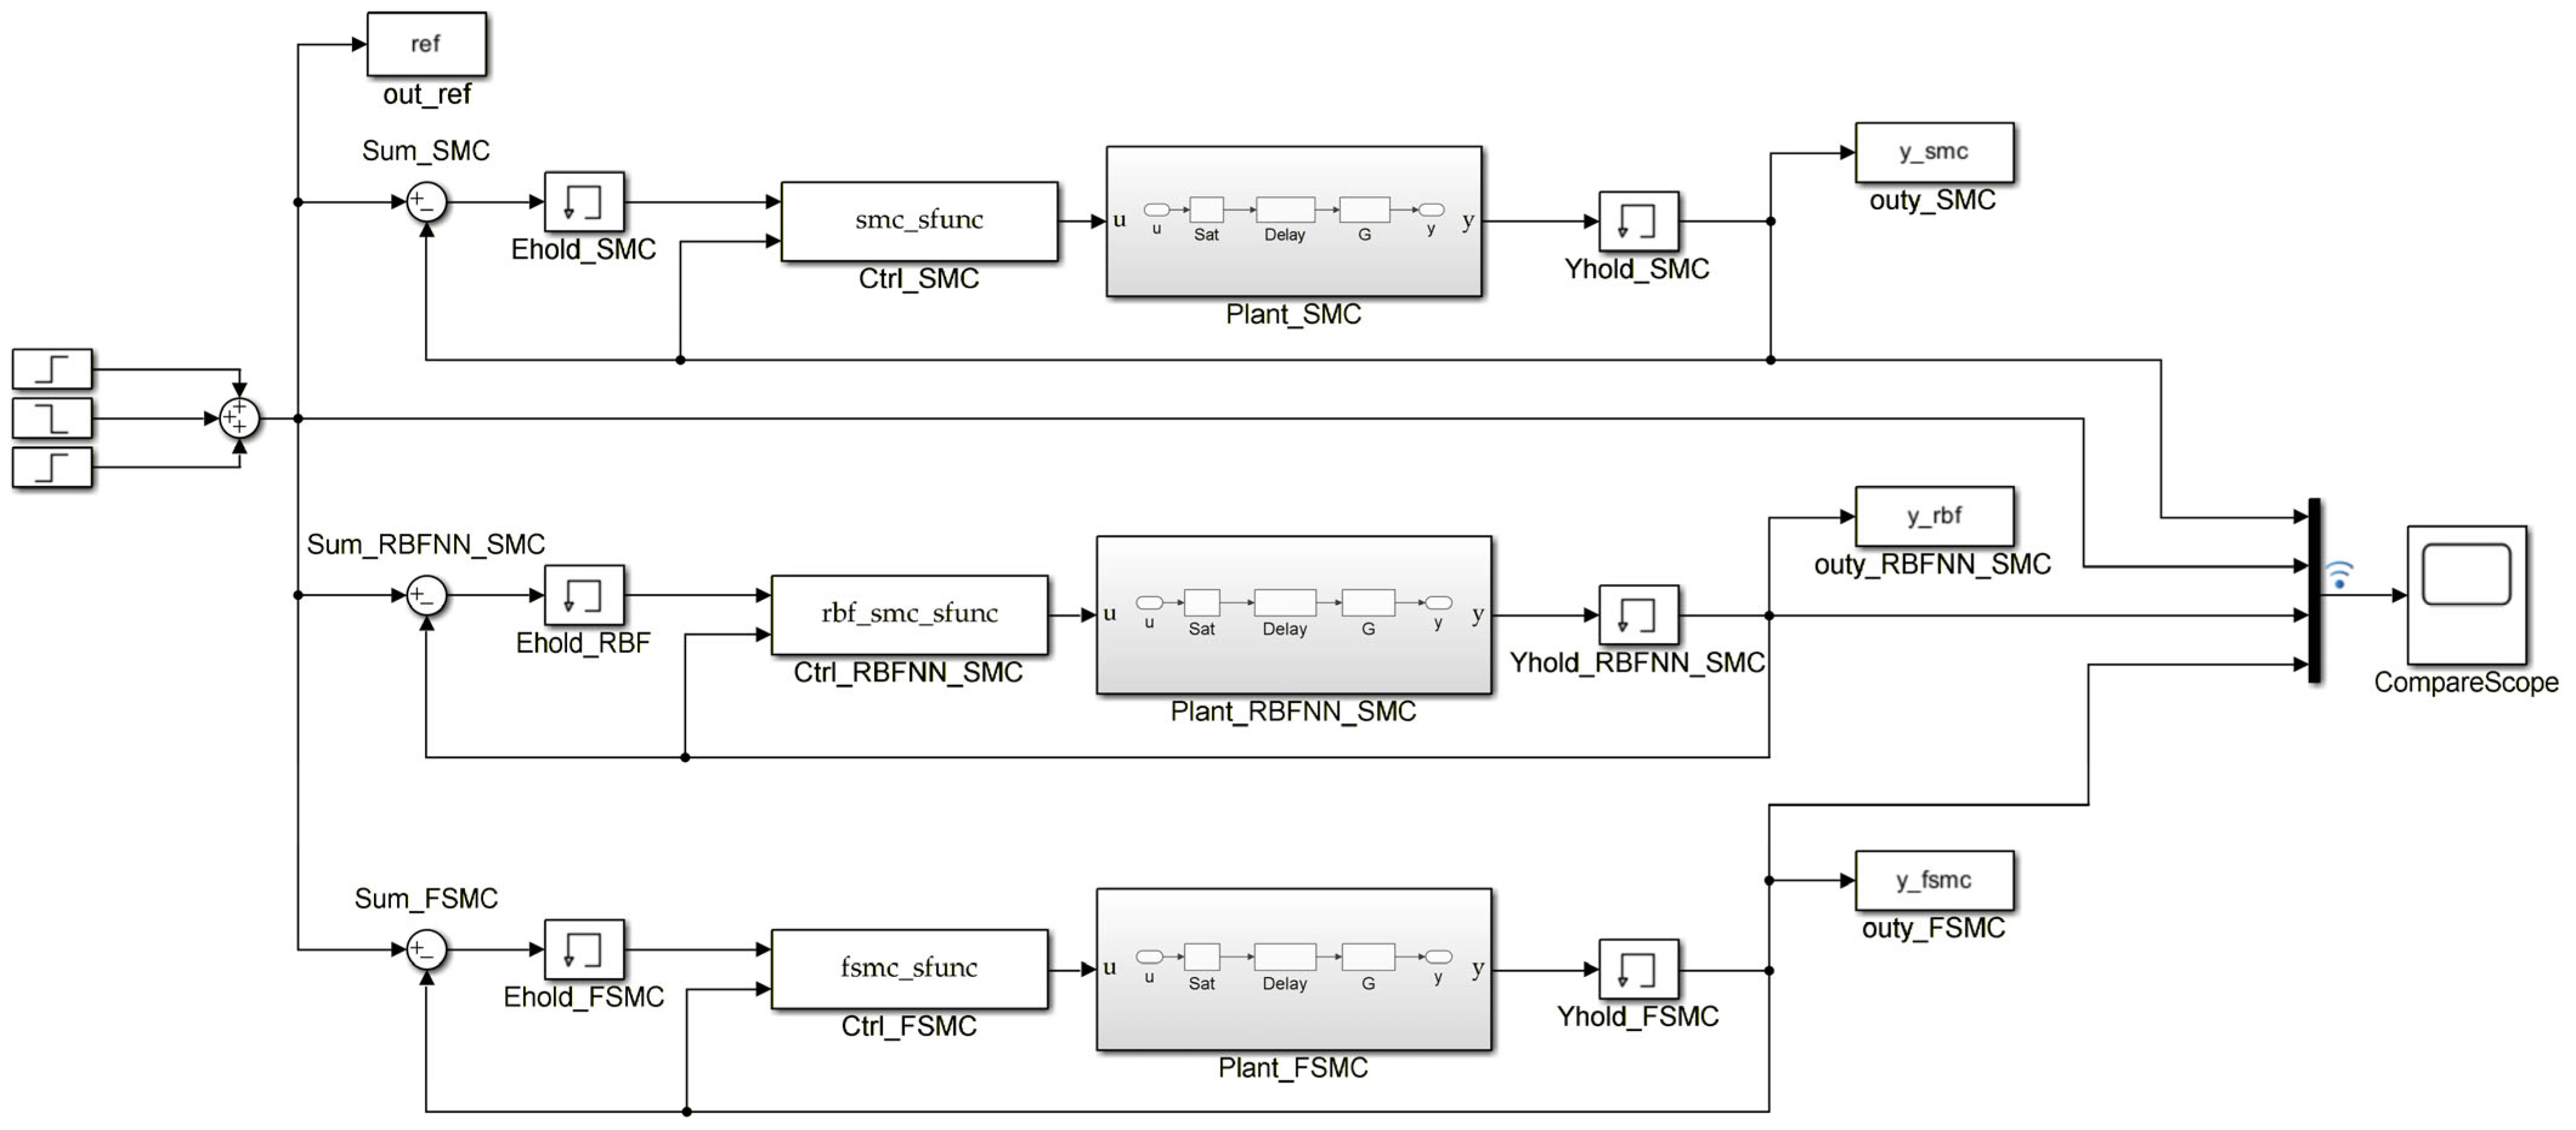
To validate the superiority and reliability of the RBFNN-SMC applied to a variable-rate spray system, models of conventional sliding mode control, fuzzy sliding mode control, and RBFNN-SMC were developed using the MATLAB R2022b/Simulink (10.6, MathWorks, Inc., Natick, MA, USA) platform, as illustrated in Figure 8. A multi-step reference signal is generated by summing three-step inputs to emulate successive changes in the target flow rate. This reference is fed in parallel to three closed-loop systems, each consisting of an error calculation block, a sample-and-hold unit, a controller implemented as an S-function, and an identical plant model representing the spraying system dynamics. In each loop, the plant output is held and fed back to the summing junction to compute the tracking error. The outputs of the three plants are recorded and combined by a multiplexer, so that the flow-rate responses of the three control strategies can be directly compared in the scope. Based on repeated measurements of input and output data collected from the equipment installed on the 3WPZ-1300 self-propelled high-clearance boom sprayer, it was determined that dividing the operational range into a linear region (PWM output 30–50%) and a saturation region (PWM output 50–70%) and establishing corresponding mathematical models better represents the actual system. Using the identified reduced-order model in (5), the operating range was further divided into a linear region (30–50% PWM) and a saturation region (50–70% PWM). Piecewise gains were estimated from the same dataset, leading to the following models for simulation.
G A ( s ) = 1.0 e 0.15 s s + 1
G B ( s ) = 0.2 e 0.15 s s + 1
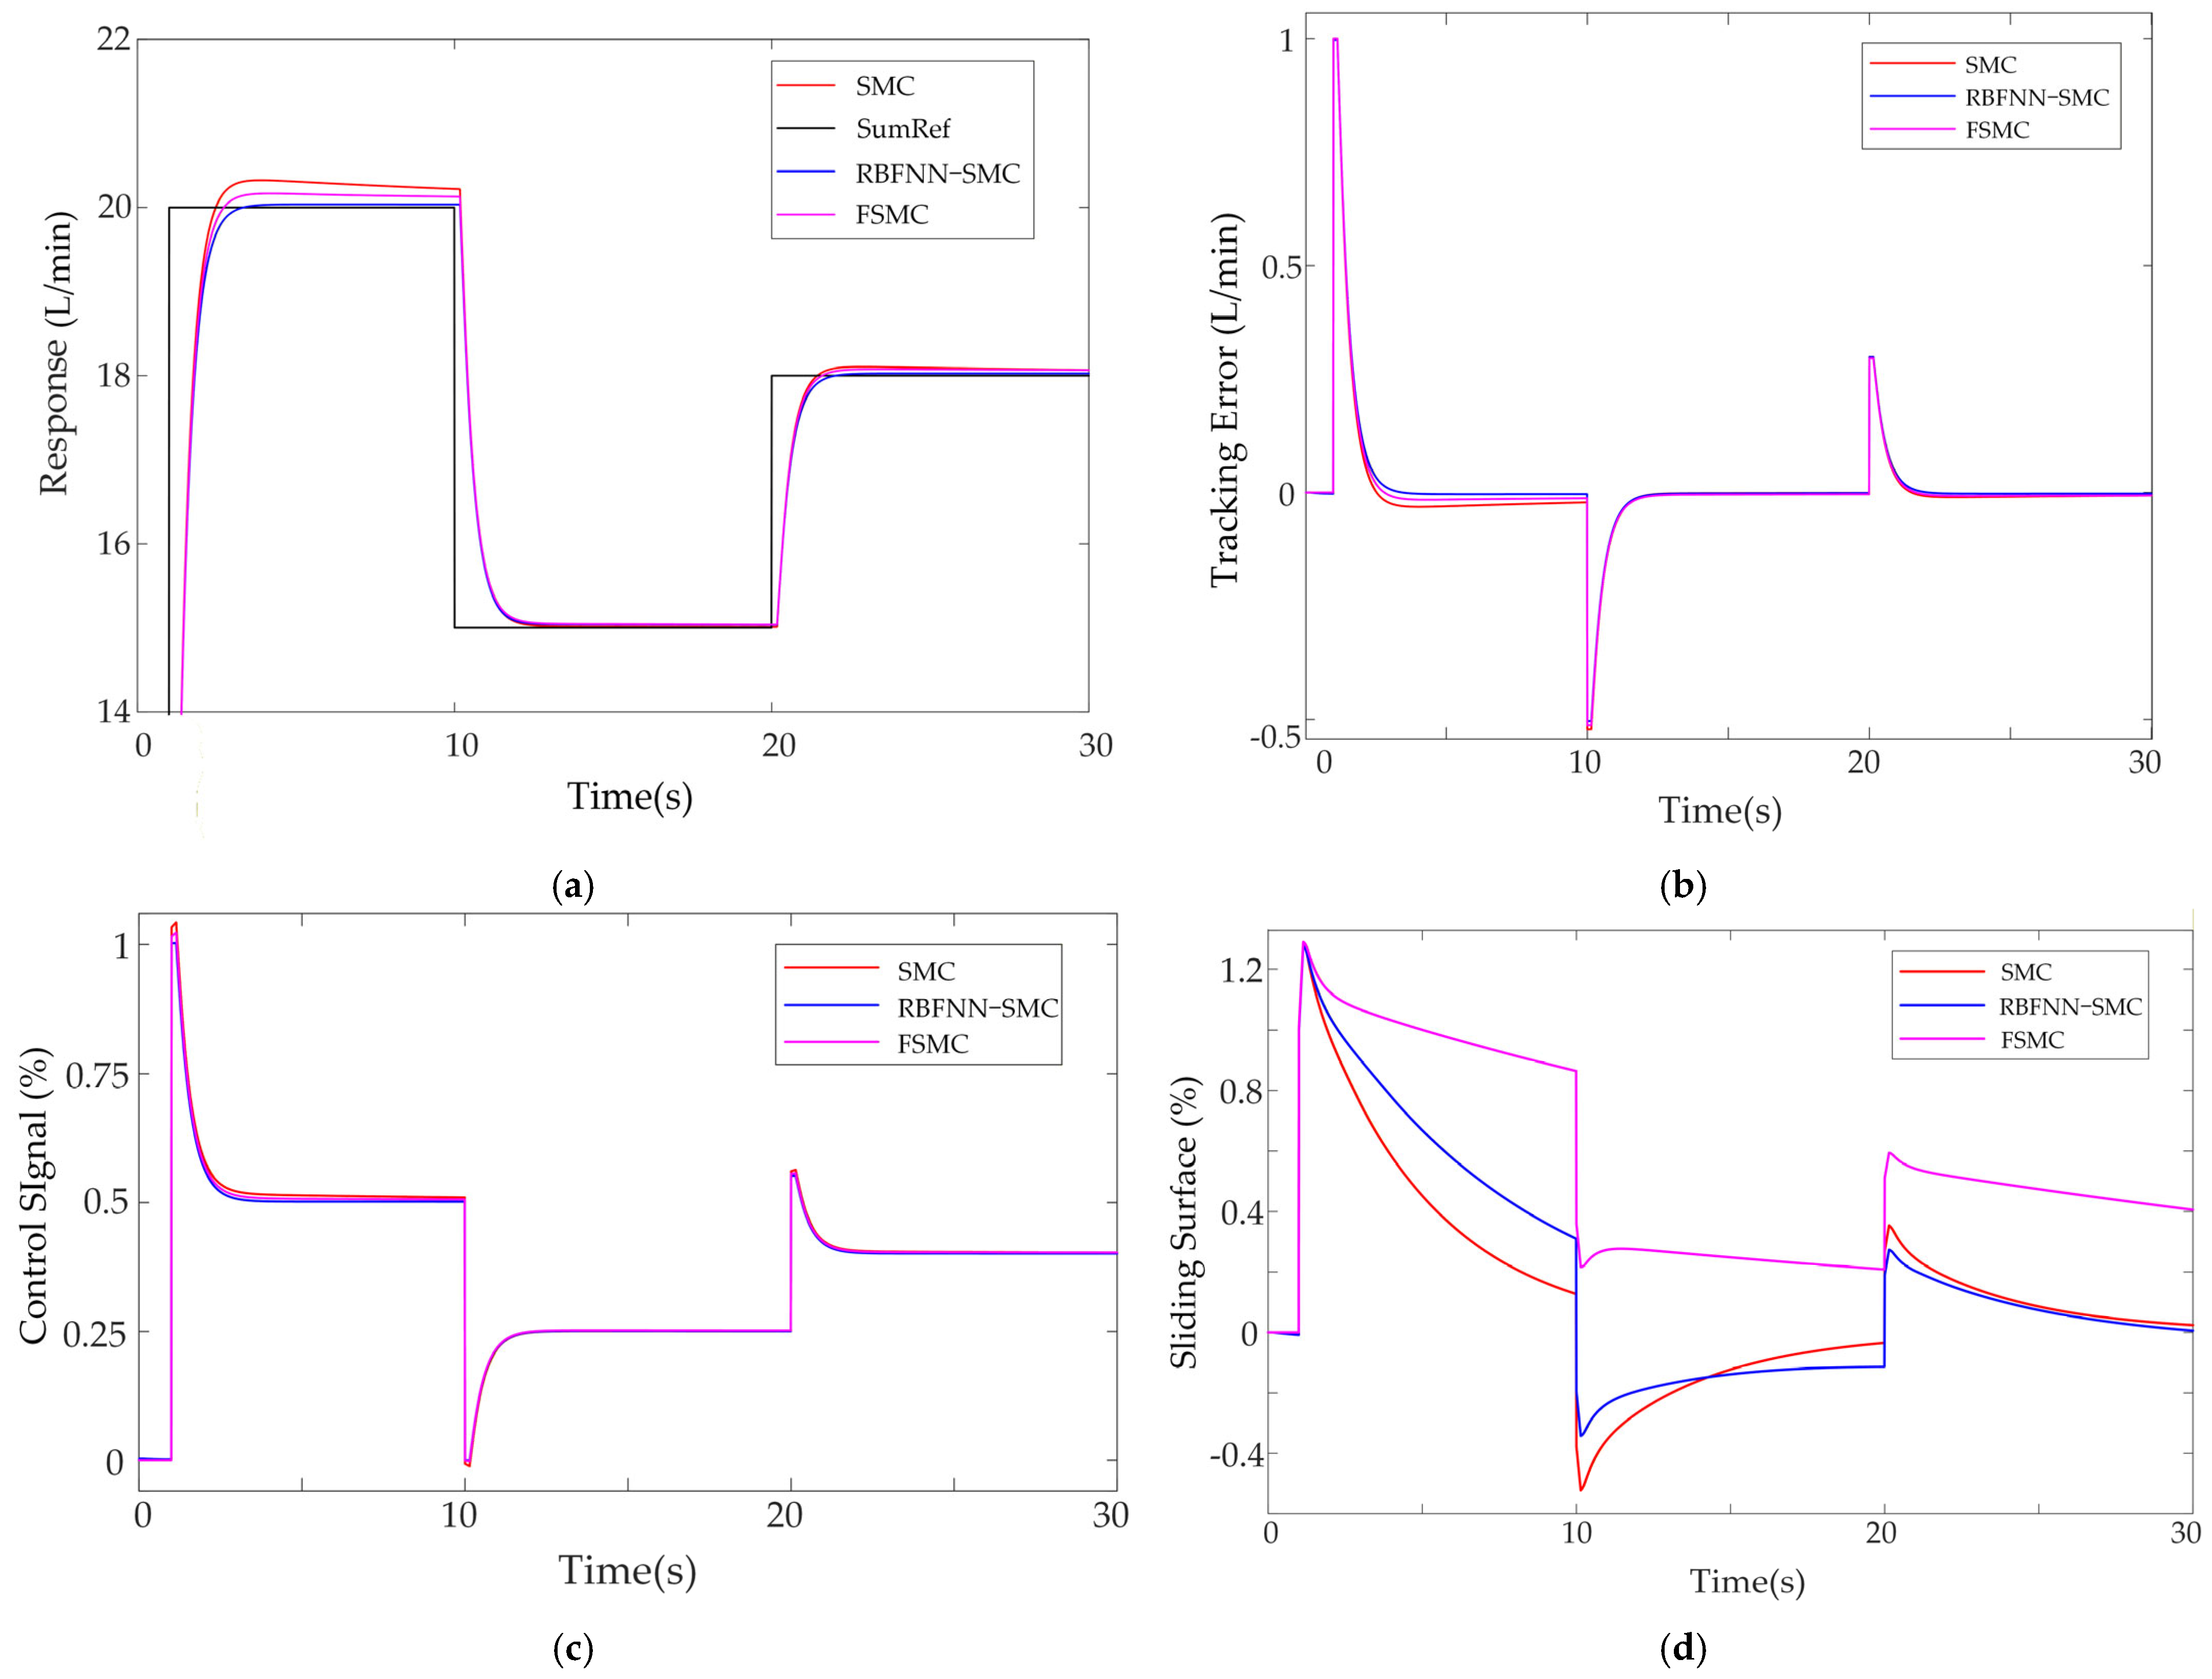
In the conventional sliding mode control, the convergence rate, switching gain, and boundary layer thickness are determined through a trial-and-error method. Based on the time scale of the first-order system T = 1, with λ = 2 as the baseline, φ is gradually reduced from 3 under the premise of non-saturation and reachability, while k is incrementally increased from 0.1, ensuring the reachability condition s s · < 0 without overdriving. Through iterative adjustments, the final parameters are determined as λ = 2.0, kSMC = 0.2, and φ = 3. For the fuzzy sliding mode control, triangular membership functions are selected with input and output ranges of −3~3 and −1~1, respectively [27]. By comparing the switching intensity with SMC, kFSMC = 0.1 is chosen to ensure sufficient drive in the large error region without excessive response in the small error region. For the RBFNN-SMC, maintaining λ = 2.0 and φ = 3, kRBF is gradually increased from 0.01 to preserve necessary switching robustness, and through trial and error, kRBF = 0.02 is ultimately obtained. The learning rate of the network is set to η = 0.0001, which was chosen empirically as a compromise between convergence speed and stability. Larger values led to oscillatory weight updates and degraded tracking performance, whereas smaller values resulted in excessively slow adaptation. In the present design, the online weight updates converge within several tens of sampling periods after a change in the reference signal. The network weights were initialized to 0.1, and the centers and widths of the radial basis functions were fixed according to the range of the sliding surface. During real-time operation, the RBFNN is trained online using the tracking error and sliding surface as inputs; no separate offline training phase is required. A step response simulation was conducted to compare the three control strategies, and the results are illustrated in Figure 9 and Table 1.
Figure 9a illustrates the outlet-flow responses relative to the stepwise reference. All controllers follow the reference with short adjustment times, but SMC produces noticeable overshoot and slower settling. FSMC and RBFNN-SMC significantly reduce overshoot, and RBFNN-SMC remains closest to the reference throughout all step changes. Figure 9b compares the tracking errors of the three controllers under multi-step changes. All controllers quickly drive the error close to zero, but SMC shows a larger peak and a small steady-state offset. FSMC and especially RBFNN-SMC further reduce overshoot and residual error, giving the smallest tracking error over the whole horizon. Figure 9c shows the corresponding control signals. SMC requires the largest transient control effort and exhibits higher peaks, while FSMC and RBFNN-SMC provide smoother duty-ratio trajectories. Among them, RBFNN-SMC achieves the smallest control variation while maintaining accurate tracking. As shown in Figure 9d, from the perspective of sliding-surface dynamics, all three methods produce transient peaks after each step and then decay toward zero. RBFNN-SMC yields the smallest |s| peaks and the smoothest convergence around t = 10 s and t = 20 s, indicating that the neural network’s online compensation of unmodeled uncertainties and delays lowers the required switching gain and alleviates chattering. FSMC achieves the fastest initial reaching, but shows a noticeable positive bias in the second phase (10–20 s), implying conservative equivalent control and prolonged boundary-layer sliding in this region. The standard SMC exhibits intermediate behavior, with moderate reaching speed and residual surface amplitude.
As shown in Table 1, under step signal excitation, the system controlled by RBFNN-SMC exhibits a rise time of 0.27 s, an overshoot of 14.87%, and a steady-state error of ±0.51%. In comparison, fuzzy sliding mode control yields a rise time of 0.35 s, an overshoot of 15.80%, and a steady-state error of ±1.11%, while conventional sliding mode control results in a rise time of 0.32 s, an overshoot of 16.53%, and a steady-state error of ±1.40%. The overshoot of the RBFNN-SMC control strategy is 1.66 percentage points lower than that of the SMC control strategy, representing a relative reduction of 11.2%. In absolute terms, at a rated flow rate of 20 L/min, this improvement reduces the peak overshoot from approximately 23.3 L/min to 22.9 L/min, thereby directly mitigating the risk of excessive usage during each step transition. This magnitude of reduction is generally considered to have a significant impact on transient control performance. Overall, the RBFNN-SMC strategy demonstrates superior step response performance with reduced overshoot, shorter rise time, and lower steady-state error. The simulation results indicate that RBFNN-SMC offers further advantages due to its diminished sliding surface impact and smoother return-to-zero behavior, effectively addressing the issues of excessive overshoot in conventional sliding mode control and hysteresis in fuzzy sliding mode control under the established model. Taking into account robustness, transient smoothness, and implementation complexity, RBFNN-SMC exhibits a more balanced overall performance.

3.2. Variable-Spray Experiment Results

3.2.1. Analysis of System Accuracy Test Results

According to Table 2, during a 1- to 2-level transition, the system achieves steady-state recovery within approximately 0.2 s; even for a 4-level transition, the adjustment time remains below 0.4 s. At a travel speed of 10 km/h, the spatial lag under the most adverse condition is estimated to be approximately 1.1 m. As indicated in Table 3, the relative errors across all 15 datasets range from 1.38% to 3.85%, with a mean value of 2.89%. The corresponding absolute errors fall between 0.27 and 0.77 L/min, averaging 0.52 L/min. The errors do not exhibit systematic amplification with variations in vehicle speed or preset application rate: the average relative errors at each speed are 2.85% (8 km/h), 2.96% (9 km/h), and 2.88% (10 km/h), respectively. The maximum error occurs under the condition of “102 L/ha, 10 km/h” (3.85%), while the minimum is observed at “108 L/ha, 10 km/h” (1.38%). Overall, the spray volume control error consistently remains within ±4%.

3.2.2. Analysis of Field Efficacy Test Results for Pesticide Application

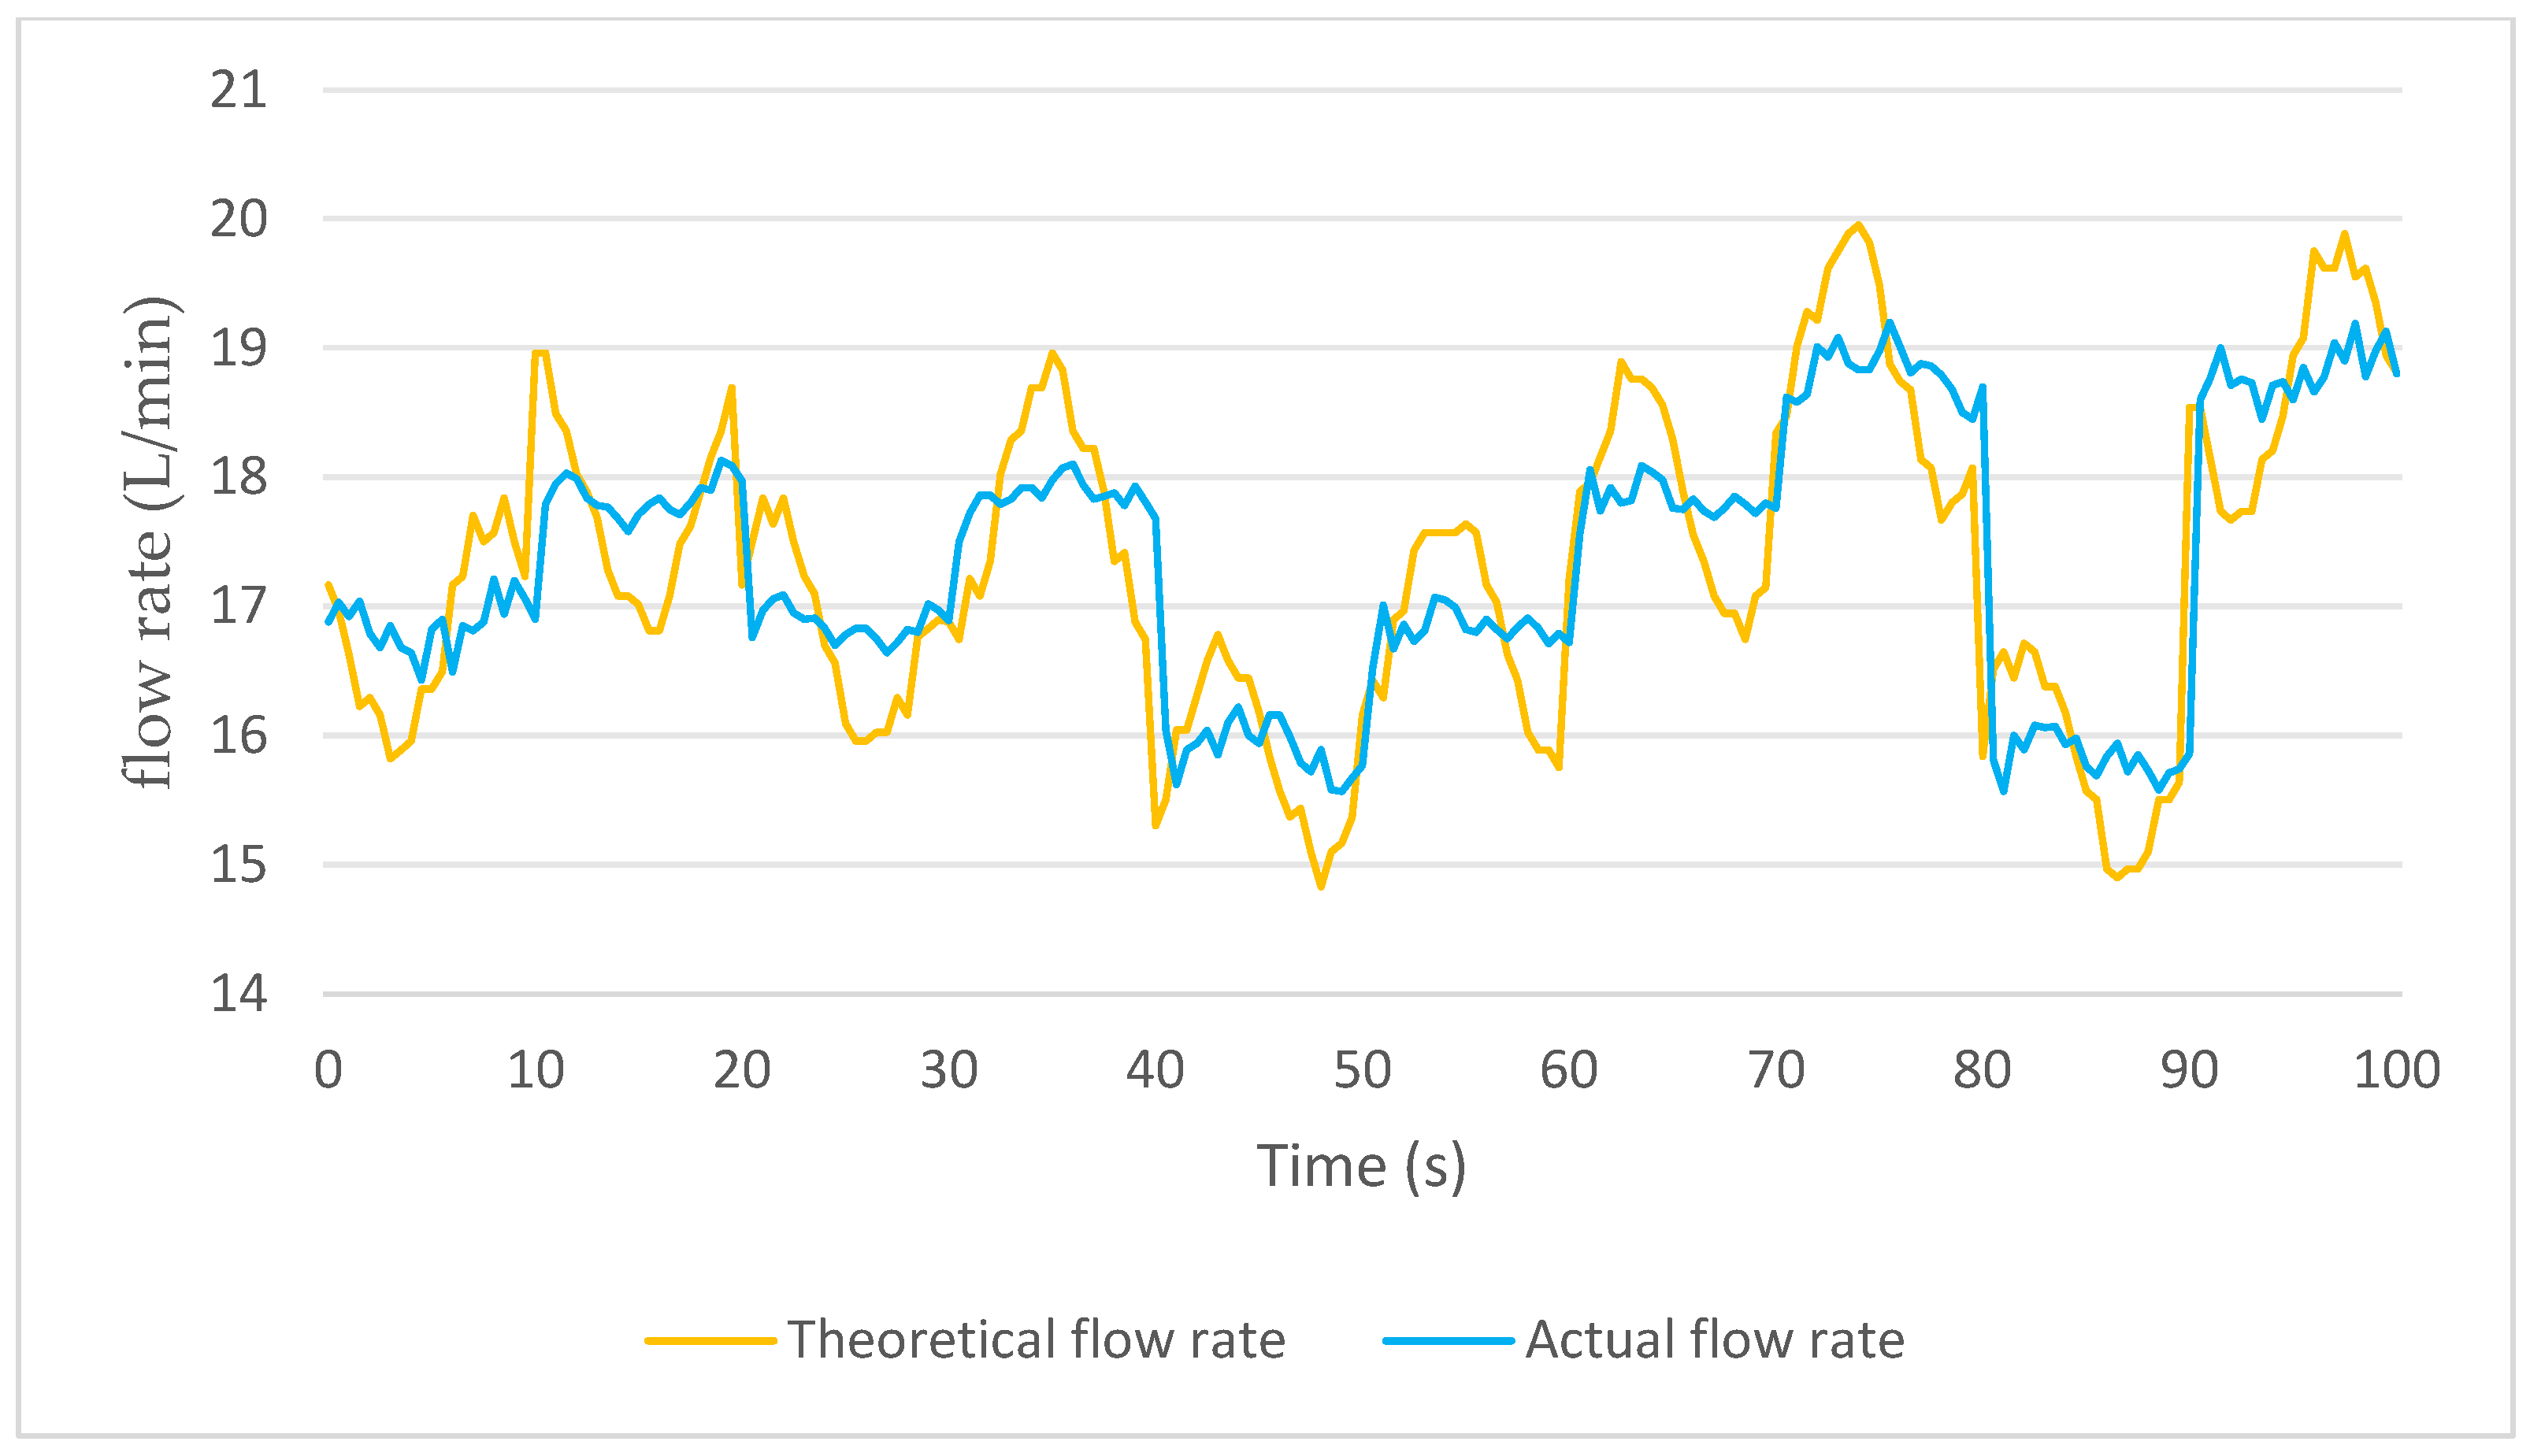
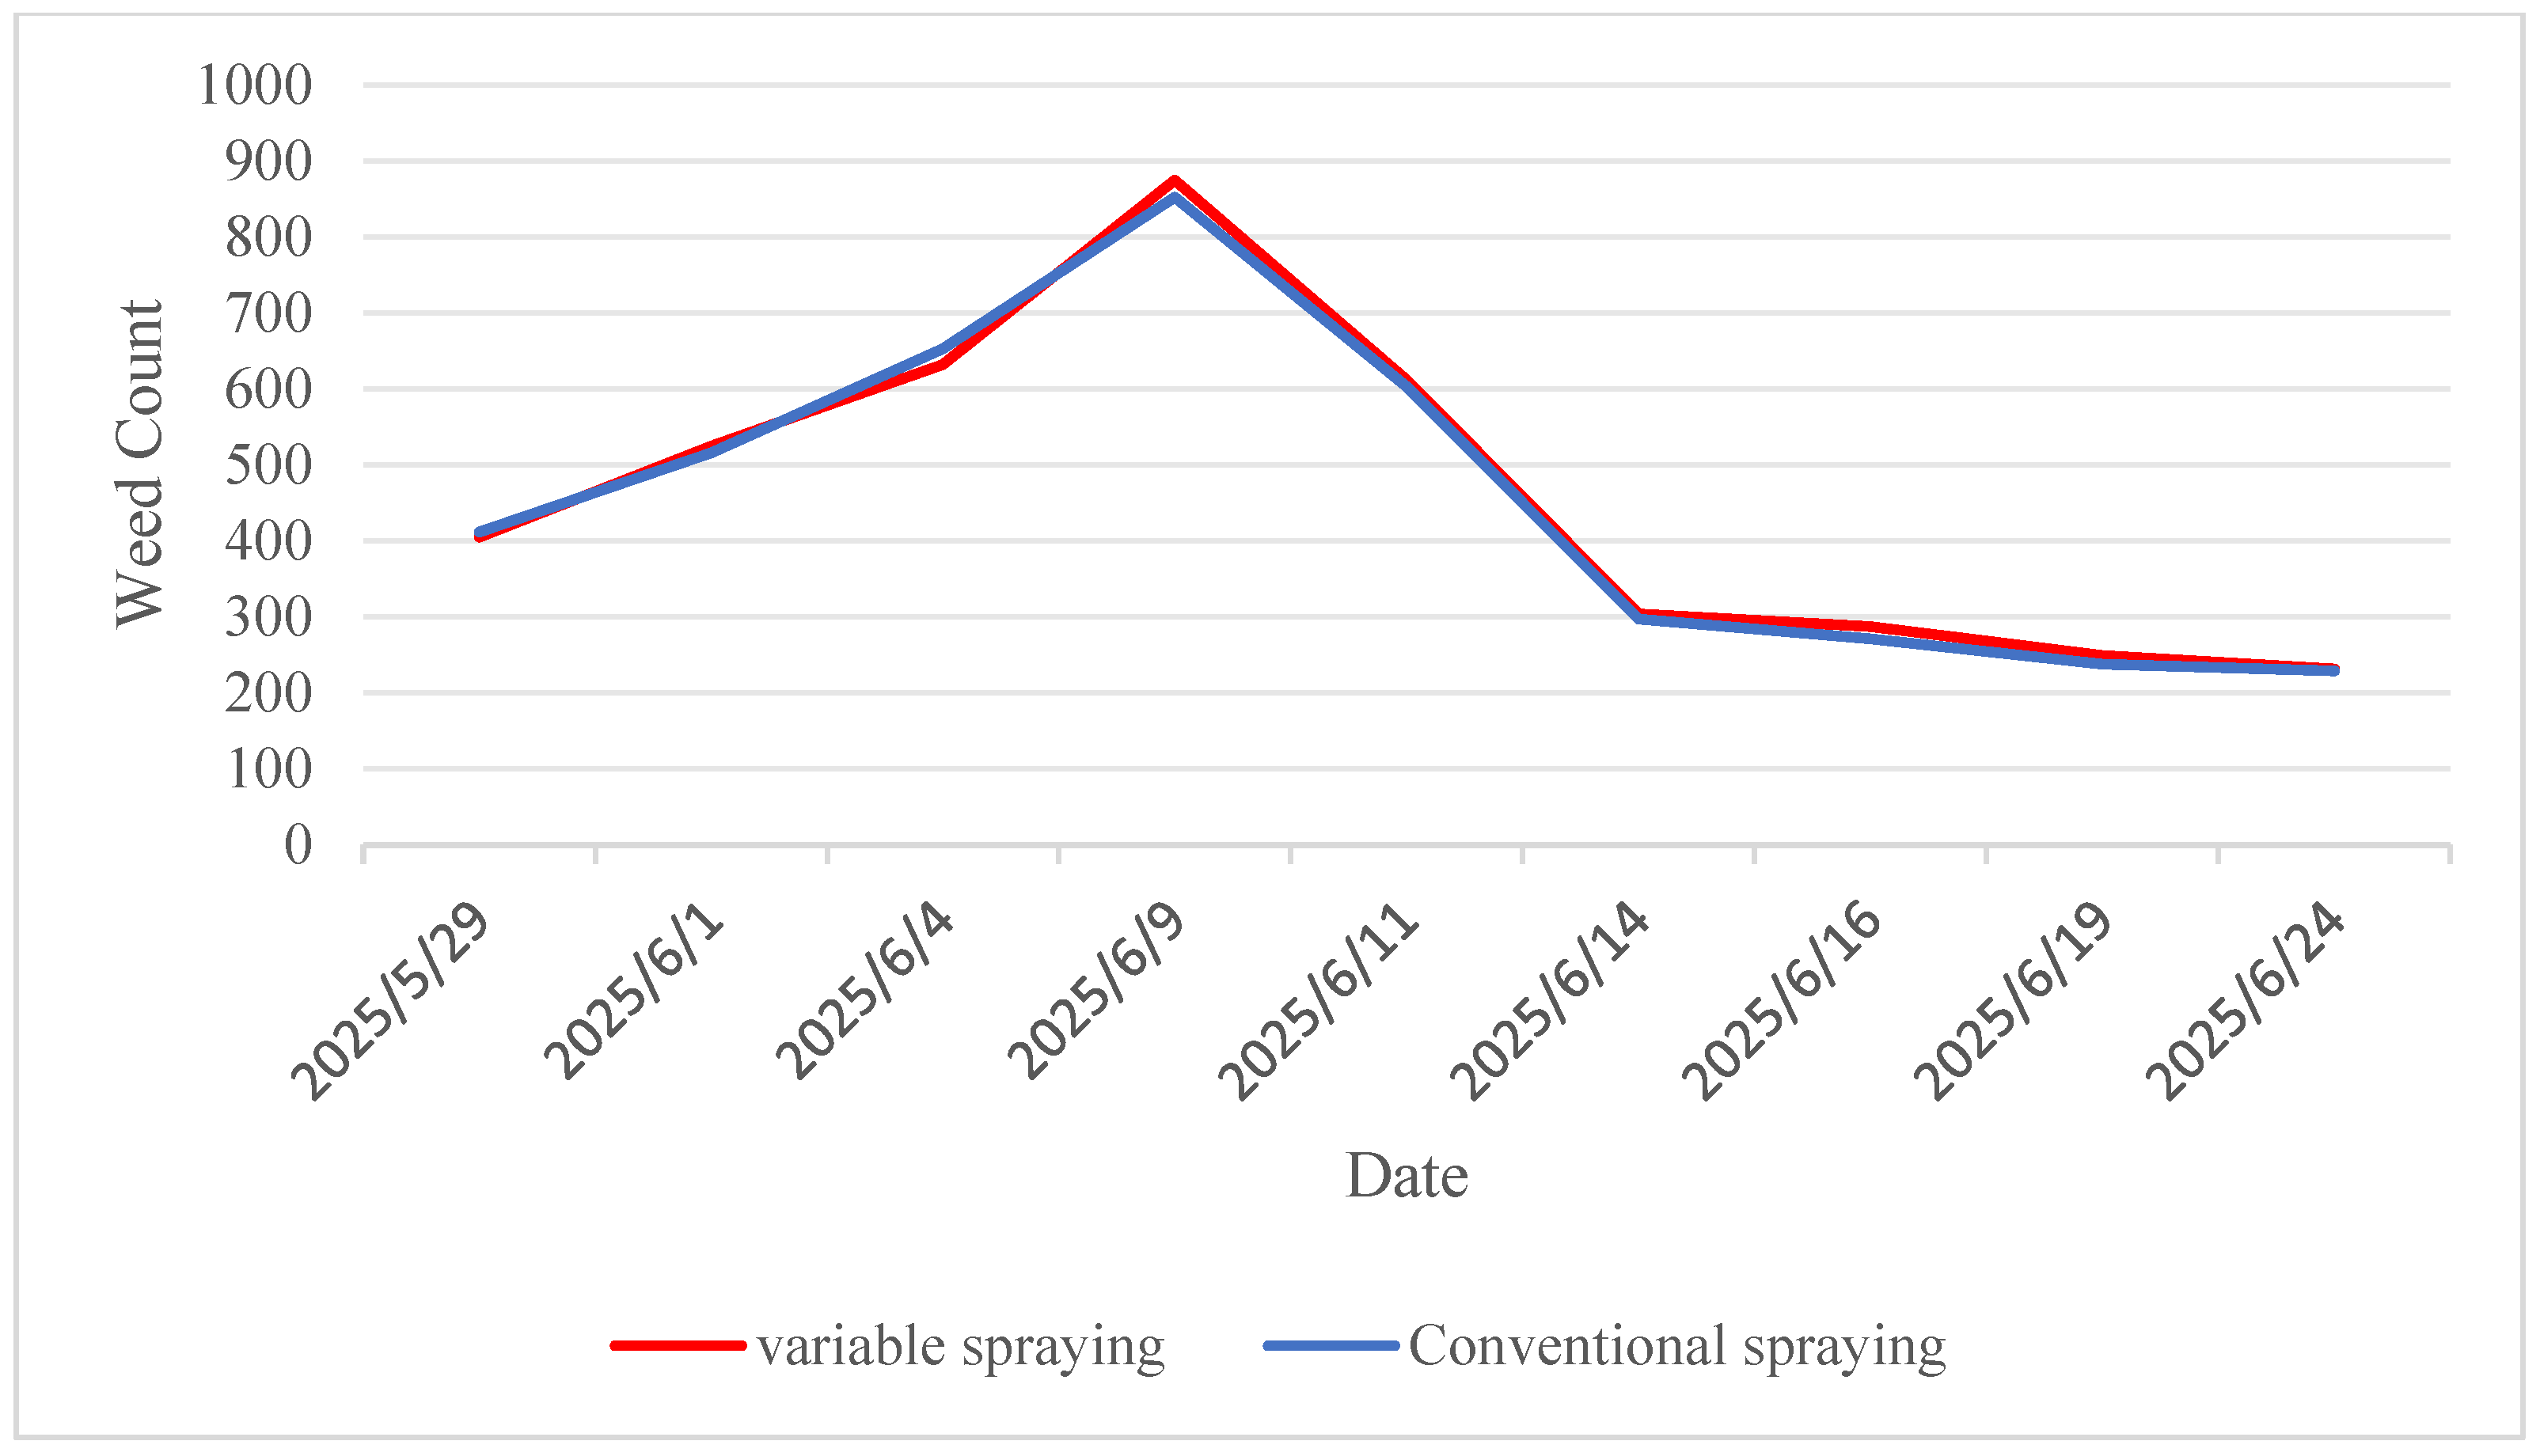
During the field operation, field disturbance phenomena related to flow control were recorded and reviewed, as illustrated in Figure 10. The analysis focused on performance characteristics near prescription level transitions, which can be categorized into two representative scenarios: short-term fluctuations in travel speed and pressure variations within the pipeline. Due to micro-terrain effects, the vehicle speed may exhibit minor acceleration or deceleration over brief periods, directly resulting in slight fluctuations in theoretical flow rate that follow the speed changes, thereby reducing the synchronization of flow control tracking. In this experiment, the following curve was observed to be relatively smooth, with lesser overshoot and rapid recovery. Additionally, as the sprayer must maintain its travel speed, throttle adjustments are required, leading to variations in the rotational speed of the sprayer’s plunger pump. This causes pressure changes within the system pipeline. The actual spray curve, as seen from the following curve, demonstrates fewer oscillations and rapid amplitude convergence. The statistical analysis of field trials indicates that the average tracking error in pesticide application is 3.2%. As illustrated in Figure 11, field investigations following herbicide application revealed a marked decline in weed density over time under both treatment methods, with minimal divergence in the decreasing trends. The herbicide efficacy of variable-rate application 15 days after pesticide spraying was 73.48%, while that of conventional application reached 73.15%. These findings indicate that under the experimental conditions, variable-rate application did not compromise weed control efficacy, demonstrating herbicidal efficiency comparable to conventional uniform application.

4. Discussion

4.1. Control Performance and Comparison with Existing Approaches

The simulation and field results collectively show that embedding an RBFNN into an SMC framework effectively improves the dynamic performance of flow-rate control in prescription-map-based variable-rate spraying. In step-response simulations, the RBFNN-SMC achieved shorter rise time, smaller overshoot, lower steady-state error, and a smoother sliding-surface trajectory than conventional SMC and fuzzy SMC, indicating that the RBFNN’s online approximation of unmodeled dynamics and disturbances can reduce the required switching gain and chattering without sacrificing robustness. In field tests, the average relative flow-rate error remained below 3% across three travel speeds and five application levels, with all individual errors within ±4%; the measured adjustment times of 0.12 to 0.38 s for one- to four-level transitions correspond to a worst-case spatial lag of about 1.1 m at 10 km/h, helping to reduce boundary over- and under-application. Compared with existing pressure-, reflux-, or mixing-ratio-based schemes that regulate in-pipe flow indirectly and often exhibit pronounced dynamic hysteresis, and nozzle-level PWM systems that rely on high-speed solenoid valves with limited service life, the proposed closed-loop architecture directly regulates volumetric flow rate via an intelligent RBFNN-SMC controller, ensuring both tracking accuracy and adjustment speed under practical field conditions.
Previous research on sliding mode control has primarily focused on motion control and path tracking of plant protection machinery [28,29,30], while studies on spray control based on neural networks have mainly concentrated on maintaining constant application rates per unit area under varying speeds of plant protection equipment [31]. In contrast, this study integrates the RBFNN-SMC control strategy with a prescription map-based operational framework, and its performance has been validated through both simulations and field experiments using commercial-scale sprayers.

4.2. Agronomic Efficacy, Economic, and Environmental Implications

The field efficacy tests showed that variable-rate and uniform applications produced similar trends in weed population decline over 15 days after treatment, despite the spatially varying application rates prescribed by the weed-density map. This indicates that, under the tested conditions, variable-rate spraying did not compromise weed-control efficacy. From an agronomic standpoint, maintaining comparable weed suppression while adjusting the dose according to local weed pressure is essential for the practical adoption of variable-rate technology. In this study, several regions of the field received lower doses than the conventional rate, while high-pressure zones were treated at or near the standard rate. This dosing pattern implies the potential to reduce overall herbicide consumption and associated costs, while also lowering the environmental load related to chemical residues and off-target exposure. The closed-loop control of flow rate further supports environmentally responsible application by limiting overshoot and reducing the likelihood of localized over-application at prescription boundaries. Variable-rate application systems can be installed on most common self-propelled boom sprayers, and they are more cost-effective compared to purchasing a whole variable-rate application machine.

4.3. Limitations and Future Work

Despite the encouraging results, several limitations should be acknowledged. This experiment was conducted under the large-scale planting model in the Heilongjiang Reclamation Area of China, specifically in the soybean field of Jianshan Farm in Nenjiang City, using the pesticide application level of this region. The range of possible selected variables may not be applicable to other regions or crops. Therefore, future research should include multi-crop and multi-site experiments to evaluate the flow rate error and weed control effect under different conditions. Secondly, this study primarily evaluates the system performance from the perspectives of flow control and weed density variation, without measuring spray quality indicators such as droplet spectrum, canopy deposition, and drift loss, which are crucial for environmental risk assessment. Subsequent research will integrate the multi-channel combination nozzle designed by the team to monitor spray deposition and drift, thereby comprehensively assessing the environmental benefits of the variable-rate application system. The current research adopts pre-generated UAV prescription maps and does not achieve real-time prescription adaptive updates during the operation process. Integrating this control system with on-board vision or multi-sensor networks to obtain real-time weed information and make online prescription corrections, and exploring its application in scenarios, such as unmanned aerial vehicle spraying and variable fertilization, are key directions for future work.

5. Conclusions

This study developed and evaluated a prescription-map-based variable-rate spraying system that combines an RBFNN-SMC control strategy with an STM32-based embedded platform and a closed-loop flow-control architecture. A simplified first-order model of the hydraulic spraying system was established, and three types of control strategies, namely conventional SMC, fuzzy SMC, and RBFNN-SMC, were designed based on this model. Simulation results showed that the proposed RBFNN-SMC strategy achieved the shortest rise time, the smallest overshoot, and the lowest steady-state error among the three control strategies, while providing smoother sliding-surface evolution under model uncertainty and time delay. The controller was installed on a self-propelled boom sprayer and guided by the application prescription map generated based on the images from the unmanned aerial vehicle. Field trials conducted at a speed of 8 to 10 km per hour and five application rate levels demonstrated that the system maintained an average flow control error of 2.89%, with all relative errors within ±4%. The flow switching adjustment time was achieved within 0.12 to 0.38 s, equivalent to a meter-level spatial lag at a speed of 10 km per hour. Weed population monitoring indicated that the variable application rate achieved a weed control effect comparable to that of conventional uniform spraying, suggesting that the improved dynamic flow control did not affect agronomic performance and could support more precise spatial application, potentially leading to greater economic and environmental benefits. Overall, the proposed system meets the demands of large-scale pesticide application in farmlands.

Author Contributions

Conceptualization, C.Z.; Data curation, C.Z.; Formal analysis, C.Z. and J.L.; Funding acquisition, W.Z.; Investigation, C.Z., C.Y. and J.L.; Methodology, C.Z.; Resources, W.Z.; Software, C.Z.; Supervision, L.Q., B.Z. and W.Z.; Validation, C.Z. and L.Q.; Writing—original draft, C.Z.; Writing—review and editing, W.Z. and B.Z. All authors have read and agreed to the published version of the manuscript.

Funding

This study was funded in part by the earmarked Fund for China Agriculture Research System (CARS-04-PS32), in part by the Guiding Science and Technology Plan Project in Daqing City (ZD-2024-24).

Institutional Review Board Statement

This research does not require ethical approval.

Data Availability Statement

The data presented in this study are available on request from the corresponding author. The data are not publicly available due to ongoing research utilizing the same dataset for future publications.

Conflicts of Interest

The authors declare that they have no known competing financial interests or personal relationships that could have appeared to influence the work reported in this paper.

References

  1. He, X.K. Research status and development proposal of precision application technology and equipment in China. Smart Agric. 2020, 2, 133–146. [Google Scholar] [CrossRef]
  2. Yang, G.Y.; Kong, H.; Lan, Y.B.; Yin, L.L.; Han, X. Key technologies and application status of precise variable application. Agric. Technol. Equip. 2022, 1, 96–97. [Google Scholar] [CrossRef]
  3. Zhang, B.; Zhai, C.Y.; Li, H.Z.; Yang, S. Development Status Analysis of Precision Pesticide Application Techniques and Equipments. J. Agric. Mech. Res. 2016, 38, 1–5+28. [Google Scholar] [CrossRef]
  4. Campos, J.; Gallart, M.; Llop, J.; Ortega, P.; Salcedo, R.; Gil, E. On-farm evaluation of prescription map-based variable rate application of pesticides in vineyards. Agronomy 2020, 10, 102. [Google Scholar] [CrossRef]
  5. Hu, C.M.; Ru, Y.; Fang, S.P.; Rong, Z.F.; Zhou, H.P.; Yan, X.H.; Liu, M.G. Orchard variable rate spraying method and experimental study based on multidimensional prescription maps. Comput. Electron. Agric. 2025, 235, 110379. [Google Scholar] [CrossRef]
  6. Mariano, G.; Luis, E.; Manuel, P.; Juan, A.; Pablo, G. Autonomous systems for precise spraying–Evaluation of a robotised patch sprayer. Biosyst. Eng. 2016, 146, 165–182. [Google Scholar] [CrossRef]
  7. Ma, F.Y. Research on Variable Rate Application Control System Based on Prescription Map. Master’s Thesis, Jilin Agricultural University, Changchun, China, 2022. [Google Scholar]
  8. Liu, L.; Kong, F.X.; Yi, L.L.; Lan, Y.B.; Han, X.; Zhao, J.; Liu, J.; Lv, P.C.; Zhang, M.H. Design and Testing of a Variable Spray System Based on Pto Protocols. INMATEH-Agric. Eng. 2024, 73, 2. [Google Scholar] [CrossRef]
  9. Zhang, W.Z.; Liu, Z.Z. Experiment on variable rate spray with real-time mixing pesticide of 3WY-A3 sprayer. Trans. Chin. Soc. Agric. Eng. 2011, 27, 130–133. [Google Scholar] [CrossRef]
  10. Salcedo, R.; Zhu, H.; Ozkan, E.; Falchieri, D.; Zhang, Z.H.; Wei, Z.M. Reducing ground and airborne drift losses in young apple orchards with PWM-controlled spray systems. Comput. Electron. Agric. 2021, 189, 106389. [Google Scholar] [CrossRef]
  11. Wang, X.Y.; Hu, Z.X.; Li, X.Q.; Li, S.C.; Gai, J.X.; Wang, F.M. Design and Experiment of Multi-reflux Variable Spraying Control System. Trans. Chin. Soc. Agric. Mach. 2019, 50, 123–131. [Google Scholar] [CrossRef]
  12. Nasir, F.E.; Alam, M.S.; Tufail, M.; Khan, M.T. A novel pressure and flow control technique for variable-rate precision agricultural sprayer. In Proceedings of the 2021 International Conference on Robotics and Automation in Industry (ICRAI), Xian, China, 26 November 2021. [Google Scholar] [CrossRef]
  13. Cai, Y.J.; Wu, Z.D.; Gao, S.B.; Cui, C. Design and simulation of variable injection system based on PID control. Cereals Oils 2020, 33, 97–100. [Google Scholar]
  14. Padhiary, M.; Tikute, S.V.; Saha, D.; Barbhuiya, J.A.; Sethi, L.N. Development of an IOT-based semi-autonomous vehicle sprayer. Agric. Res. 2025, 14, 229–239. [Google Scholar] [CrossRef]
  15. Feng, Y.N.; Pei, L.; Chen, X.; Chen, X.B.; Liu, Y. A review of key technologies for variable application. J. Chin. Agric. Mech. 2021, 42, 65–71. [Google Scholar] [CrossRef]
  16. Grella, M.; Gioelli, F.; Marucco, P.; Zwertvaegher, I.; Mozzanini, E.; Mylonas, N.; Nuyttens, D.; Balsari, P. Field assessment of a pulse width modulation (PWM) spray system applying different spray volumes: Duty cycle and forward speed effects on vines spray coverage. Precis. Agric. 2022, 23, 219–252. [Google Scholar] [CrossRef]
  17. Butts, T.R.; Luck, J.D.; Fritz, B.K.; Hoffmann, W.C.; Kruger, G.R. Evaluation of spray pattern uniformity using three unique analyses as impacted by nozzle, pressure, and pulse-width modulation duty cycle. Pest Manag. Sci. 2019, 75, 1875–1886. [Google Scholar] [CrossRef]
  18. Fabula, J.; Sharda, A.; Luck, J.D.; Brokesh, E. Nozzle pressure uniformity and expected droplet size of a pulse width modulation (PWM) spray technology. Comput. Electron. Agric. 2021, 190, 106388. [Google Scholar] [CrossRef]
  19. Tang, R.P.; Tang, J.R.; Aridas, N.K.; Talip, M.S.A.; Luen, L.C. Research on RBF-PID hybrid drive control models for drone pesticide applications in tropical orchards. Geo-Spat. Inf. Sci. 2025, 1–18. [Google Scholar] [CrossRef]
  20. Chen, Q.; Zhang, J.; Zhang, C.; Zhou, H.P.; Jiang, X.S.; Yang, F.G.; Wang, Y. CFD analysis and RBFNN-based optimization of spraying system for a six-rotor unmanned aerial vehicle (UAV) sprayer. Crop Prot. 2023, 174, 106433. [Google Scholar] [CrossRef]
  21. Gao, Z.N.; Chen, Q.Y.; Hu, G.R.; Chen, C.; Li, C.L.; Chen, J. Design and Test of Self-Propelled Straddletype Lycium Barbarum L. Spraying machine. INMATEH-Agric. Eng. 2021, 65, 345–354. [Google Scholar] [CrossRef]
  22. Huyett, L.M.; Dassau, E.; Zisser, H.C.; Doyle, F.J. Design and Evaluation of a Robust PID Controller for a Fully Implantable Artificial Pancreas. Ind. Eng. Chem. Res. 2015, 54, 10311–10321. [Google Scholar] [CrossRef]
  23. Wang, X.T.; Zhao, Z.; Wang, Y.; Li, L. High Precision Control Method of Liquid Fertilizer Flow Based on Sliding Mode Technology. J. Agric. Mech. Res. 2023, 45, 8–14. [Google Scholar] [CrossRef]
  24. Sai, T.A.; Lee, H. Weight initialization on neural network for neuro pid controller-case study. In Proceedings of the 2018 International Conference on Information and Communication Technology Robotics (ICT-ROBOT), Xiamen, China, 27 January 2018. [Google Scholar] [CrossRef]
  25. GB/T 20183.3-2024; Equipment for Crop Protection—Spraying Equipment—Part 3: Test Method to Assess the Performance of Volume/Area Adjustment Systems. State Administration for Market Regulation, National Standardization Administration: Beijing, China, 2024.
  26. GB/T 17980.125-2004; Pesticide—Guidelines for the Field Efficacy Trials (II)—Part 125: Herbicides Against Weeds in Soybean. General Administration of Quality Supervision, Inspection and Quarantine of the People’s Republic of China, Standardization Administration of the People’s Republic of China: Beijing, China, 2004.
  27. Li, P. Research on Drone Spraying Control System for Foliar Fertilization in Rice. Master’s Thesis, Heilongjiang Bayi Agricultural University, Daqing, China, 2023. [Google Scholar]
  28. Wen, H.J.; Ma, X.D.; Qin, C.J.; Chen, H.; Kang, H.Y. Research on path tracking of unmanned spray based on dual control strategy. Agriculture 2024, 14, 562. [Google Scholar] [CrossRef]
  29. Xu, W.H.; Cao, L.J.; Peng, B.Y.; Wang, L.; Gen, C.; Liu, Y.J. Adaptive nonsingular fast terminal sliding mode control of aerial manipulation based on nonlinear disturbance observer. Drones 2023, 7, 88. [Google Scholar] [CrossRef]
  30. Wen, H.; Liang, Z.X.; Zhou, H.X.; Li, X.Y.; Yao, B.H.; Mao, Z.H.; Lian, L. Adaptive sliding mode control for unknown uncertain non-linear systems with variable coefficients and disturbances. Commun. Nonlinear Sci. Numer. Simul. 2023, 121, 107225. [Google Scholar] [CrossRef]
  31. Sun, W.F.; Liu, H.Y.; Wang, R.T.; Fu, T.P.; Lu, J.Q.; Wang, F.L. Design and Experiment of PID Control Variable Application System Based on Neural Network Tuning. Trans. Chin. Soc. Agric. Mach. 2020, 51, 55–64+94. [Google Scholar] [CrossRef]
Figure 1. Schematic diagram of the structure and function of the RBFNN-SMC variable-rate spraying system.
Agriculture 15 02444 g001
Figure 2. Comparative analysis of measured response and simulated response.
Agriculture 15 02444 g002
Figure 3. Diagram of the RBFNN-SMC control strategy. (a) The closed-loop structure of the RBFNN-SMC variable-rate application system. (b) The internal structure and process of the hybrid RBFNN-SMC controller.
Agriculture 15 02444 g003
Figure 4. The specific location of the test site.
Agriculture 15 02444 g004
Figure 5. Flowchart of the flow accuracy test experiment.
Agriculture 15 02444 g005
Figure 6. System accuracy testing conducted at the agricultural machinery factory. (a) The controller interface for observing the spraying flow rate. (b) The experiments conducted at this test site.
Agriculture 15 02444 g006
Figure 7. Field experiments conducted in the soybean experimental field. (a) The experiments conducted in this experimental field. (b) The graphical user interface of the host computer and the displayed interpreted pesticide application prescription map. (c) Example count of the number of weeds in the photos of the sampling points taken by the unmanned aerial vehicle.
Agriculture 15 02444 g007
Figure 8. The simulation model of the RBFNN-SMC/Fuzzy-SMC/SMC control system constructed in MATLAB.
Agriculture 15 02444 g008
Figure 9. The curve obtained from the system response simulation. (a) System response curve. (b) Tracking error curve. (c) Control signal curve. (d) Sliding surface trajectory.
Agriculture 15 02444 g009
Figure 10. The dynamic flow tracking curve of the control system in-field application.
Agriculture 15 02444 g010
Figure 11. The trend curve of weed population dynamics after pesticide spraying.
Agriculture 15 02444 g011
Table 1. The data obtained from the system response simulation.
Control
Strategy
Average
Overshoot (%)
Average
Rise Time (s)
Average
Steady-State Error (%)
Sliding Mode Control16.530.321.40
Fuzzy Sliding Mode Control15.800.351.11
Radial Basis Function Neural Network–Sliding Mode Control14.870.270.51
Table 2. Test results of the dynamic adjustment time for the control system.
Pesticide Application Levels Differential1234
Average Adjustment Time
(s, mean ± SD)
0.12 ± 0.010.21 ± 0.010.3 ± 0.020.38 ± 0.02
Times of Repetition3333
Table 3. Test results for flow control accuracy in the control system.
Theoretical Application Rate/
(L/h)
Speed/
(km/h)
Theoretical
Flow Rate/
(L/min)
Measured
Flow Rate/
(L/min, Mean ± SD, n = 3)
Absolute
Error/
(L/min, Mean ± SD)
Relative
Error/
(%, Mean ± SD)
96814.0814.52 ± 0.280.44 ± 0.283.03 ± 1.98
915.8415.37 ± 0.330.47 ± 0.333.06 ± 2.05
1017.6017.13 ± 0.300.47 ± 0.302.74 ± 1.71
102814.9615.34 ± 0.290.38 ± 0.292.47 ± 1.96
916.8316.25 ± 0.230.58 ± 0.233.56 ± 1.36
1018.7019.45 ± 0.430.75 ± 0.433.85 ± 2.28
108815.8416.32 ± 0.190.48 ± 0.192.94 ± 1.21
917.8218.43 ± 0.200.61 ± 0.203.31 ± 1.14
1019.8019.53 ± 0.300.27 ± 0.301.38 ± 1.52
114816.7217.23 ± 0.200.51 ± 0.202.95 ± 1.22
918.8118.35 ± 0.230.46 ± 0.232.50 ± 1.21
1020.9020.13 ± 0.300.77 ± 0.303.82 ± 1.43
120817.6018.12 ± 0.290.52 ± 0.292.86 ± 1.63
919.8019.34 ± 0.290.46 ± 0.292.37 ± 1.48
1022.0021.44 ± 0.410.56 ± 0.412.61 ± 1.88
Disclaimer/Publisher’s Note: The statements, opinions and data contained in all publications are solely those of the individual author(s) and contributor(s) and not of MDPI and/or the editor(s). MDPI and/or the editor(s) disclaim responsibility for any injury to people or property resulting from any ideas, methods, instructions or products referred to in the content.