Article

Calibration of DEM Model for Root–Soil Breakage in Winter Wheat During the Regreening Stage

1
College of Mechanical and Electrical Engineering, Xinjiang Agricultural University, Urumqi 830052, China
2
Intelligent Equipment Research Center, Beijing Academy of Agriculture and Forestry Sciences, Beijing 100097, China
3
State Key Laboratory of Intelligent Agricultural Power Equipment, Beijing 100097, China
*
Authors to whom correspondence should be addressed.
Agriculture 2025, 15(23), 2427; https://doi.org/10.3390/agriculture15232427
Submission received: 10 November 2025 / Revised: 22 November 2025 / Accepted: 24 November 2025 / Published: 25 November 2025
(This article belongs to the Section Agricultural Soils)

Abstract

A critical challenge in the design optimization of subsoiling and deep-fertilization implements for root pruning during the regreening stage of winter wheat lies in the lack of a validated root–soil discrete element (DEM) model. This study analyzed and measured the geometric morphology of winter wheat root systems in soil during the regreening stage and constructed corresponding geometric models. Based on the DEM framework, a Hertz–Mindlin with bonding model (HMBM) for the wheat root system was developed. The parameters of this model were calibrated using Plackett–Burman (PB) and Box–Behnken design (BBD) methods. Soil particles were simplified to spherical shapes according to particle size distribution analysis, and a discrete element model of soil particles using the Johnson–Kendall–Roberts (JKR) contact model was established. Soil model parameters at three different moisture contents were calibrated with the angle of repose (AOR) as the target response. The accuracy of the root bonding model and parameters, as well as the root–soil contact model and parameters, was verified through pull-out tests and corresponding DEM simulations of single roots in soil. Comparison between experimental and simulated pull-out results confirmed the validity of the developed root–soil DEM model for winter wheat during the regreening stage. This study provides a solid theoretical and experimental basis for future research on root cutting and tillage operations in winter wheat.

1. Introduction

Wheat is one of the world’s most extensively cultivated cereal crops, contributing roughly 28% of global grain production and serving as a major source of both food and feed [1]. As the global population continues to rise, increasing wheat productivity per unit area without expanding cultivated land has become a major challenge for sustainable agriculture [2]. Previous studies have presented that root pruning during the regreening stage of winter wheat can increase yield, harvest index, and water-use efficiency [3], a period during which root activity, nutrient uptake capacity, and water absorption efficiency increase sharply. Management practices such as tillage, root pruning, and fertilization implemented during this stage have a significant impact on root system architecture and subsequent shoot development compared with the tillering or jointing stages [4,5]. However, the interactions between the root system, soil, and agricultural machinery components are highly complex, difficult to directly observe, and costly to quantify experimentally. Therefore, there is a need for efficient and precise numerical approaches to visualize and quantify root–soil–machinery interactions, thereby providing a theoretical basis for the design and optimization of agricultural implements.
The discrete element method (DEM) [6,7,8], with its diverse contact and bonding models, can accurately reproduce the deformation, damage, and failure behavior of materials. In agricultural engineering, DEM has been used extensively to investigate various aspects of root, soil, and tool interaction. For crop root mechanics, existing studies have mainly concentrated on mature or harvest-stage root systems. For example, Zhou et al. [9] established a bonding model for Jerusalem artichoke root-tuber systems and simulated the cutting process; Zhao et al. [10] established a DEM bonding model for wheat roots at harvest, calibrated parameters via mechanical tests, and validated its accuracy, providing a reference for tillage-related root–machinery interaction studies. Furthermore, Research has also extended to root–soil composite structures, recognizing that roots interact mechanically with surrounding soil to form a complex composite that directly affects mechanical resistance. Zhang et al. [11] established a DEM model for the maize root–soil composite and characterized its shear properties through direct shear tests. Liu et al. [12] developed a yam root–soil composite model using a bonding approach and calibrated bonding parameters via compression tests, providing a basis for harvesting machinery design. Ma et al. [13] simulated maize root–stubble excavation using a 3D DEM model, enabling analysis of forces and energy consumption at different excavation angles and speeds. In addition, DEM has been widely applied to soil–tool interactions and soil mechanical behavior under different moisture conditions. For example, Zhang et al. [14] used DEM to optimize the design of a bio-inspired shovel for ginseng harvesting, reducing resistance in the soil and improving operational efficiency. Adajar et al. [15] proposed a method for calibrating the key DEM parameters of crop residues and their contact interface with soil. By designing physical experiments, the intrinsic parameters of the residues and the residue–soil contact model parameters were calibrated, providing a reliable foundation for tillage simulation involving soil covered with crop residues. Cheng et al. [16] simulated the adhesion of wet clay to rotary tiller blades in rice paddies. These studies collectively demonstrate the capability of DEM in modeling root–soil–machinery interactions.
However, despite the demonstrated capability of DEM in these studies, a notable limitation is that the research objects predominantly focus on root systems at the crop maturity or harvest stages, with relatively few studies on the root systems of wheat during the regreening stage. Substantial physiological and mechanical differences exist between regreening-stage and mature roots: regreening-stage roots exhibit higher moisture content, smaller diameters, and lower lignification, leading to reduced brittleness, increased flexibility, and a greater tendency for plastic deformation [17]. These characteristics fundamentally alter their mechanical behavior under external loading, such as during soil–root cutting or pruning operations [18]. Consequently, DEM parameters calibrated for mature roots cannot be directly applied to regreening-stage root systems. Dedicated measurements, bonding-model parameter calibration, and soil–root interaction modeling are therefore essential for accurately capturing the mechanical behavior of regreening-stage wheat roots.
To address the aforementioned issues, the present study investigates wheat root systems during the regreening stage and constructs a root–soil DEM model. First, the physical and mechanical properties of roots and soil were measured to obtain the intrinsic parameters for DEM modeling. Tensile and shear tests on single roots of different diameters were conducted to determine mechanical parameters for the bonding model. These bonding model parameters were subsequently calibrated and validated through a combination of physical experiments and DEM simulations, using PB and BBD designs to identify significant factors and optimize parameter combinations. For the soil, a particle model based on the JKR theory was adopted, and contact parameters under different moisture contents were calibrated using the AOR test as the target response. Finally, the accuracy of the developed root–soil DEM model was validated by comparing experimental and simulated results from root tensile tests, root shear tests, single-root pull-out tests, and in-soil pull-out tests, providing a reliable basis for dynamic simulations of the root-pruning process during the regreening stage.

2. Materials and Methods

2.1. Experimental Materials

Winter wheat (cultivar ‘Jingdong 22’) used in this study was collected from the Xiaotangshan National Precision Agriculture Research and Demonstration Base, Beijing (116°27′ E, 40°10′ N), during the regreening stage in March 2025. To account for spatial variability in root morphology and soil properties, samples were randomly collected from multiple locations within the experimental field. Previous studies have indicated that winter wheat roots during this stage can reach depths of at least 1 m [19]. Considering the optimal range for root pruning during the regreening stage is 100–120 mm, and manual excavation causes root damage, this study collected only wheat plants from the 0–180 mm soil layer as experimental samples [10].

2.2. Physical Parameters of Wheat Roots and Soil

The physical properties of the root system and soil were measured. These data ensured that the DEM model’s geometry and mechanical behavior accurately reflected the actual physical characteristics and particle interactions.

2.2.1. Dimensions

A wheat plant consists of the spike, stem, leaves, and root system. As presented in Figure 1a, the root system has an umbrella-shaped structure composed mainly of primary and secondary roots. In the root–soil profile (Figure 1b), the primary roots are deeper and more vertically oriented, whereas the secondary roots are shallower, spreading at acute angles with a more uniform distribution [20].
Thirty plants were randomly selected for dimensional measurements. Root–soil complexes were first softened in clean water, and adherent soil particles were gently removed with a fine-bristle brush to preserve root integrity. Root lengths were measured using a straight ruler, and diameters were measured using a digital vernier caliper (Guanglu CD-15DC, Guilin, China; accuracy ±0.02 mm, resolution 0.01 mm). The mean values were used for the DEM model input. The statistical summary of root dimensions is provided in Table 1.
Soil samples were collected using the five-point method, with ~500 g taken at each point. Samples were homogenized into a composite sample to reduce heterogeneity. Sequential sieving was performed using a mechanical sieve shaker for 15 min following the dry sieving method. Replicate tests were conducted at five different locations within the study area to ensure result consistency (Table 2). The results showed that particles of 1–5 mm accounted for the largest proportion. Based on the USDA texture classification, the soil was identified as sandy loam.

2.2.2. Moisture Content

Variations in root moisture content can significantly affect the mechanical properties of wheat root systems [21]. In this study, the moisture contents of the root systems and soil were determined using the oven-drying method. The moisture content measurements were conducted using an electronic balance (JJ1000, Changshu Shuangjie Testing Instruments, Changshu, China; accuracy: 0.001 g) and an electric thermostatic blast-drying oven (DHG-9030, Shanghai Yiheng Scientific Instruments, Changshu, China; accuracy: ±1.0 °C). Soil samples from 0–180 mm depth were obtained with a soil sampler. Wheat root systems were collected from plants at the corresponding soil sampling locations. Aboveground biomass was excised, and the roots were thoroughly washed prior to moisture content determination. Samples were oven-dried at 105 °C, and moisture content was determined gravimetrically by weighing the samples at 2-h intervals until constant mass was attained. The moisture contents of soil and root systems were calculated separately using Equation (1). Each measurement was repeated ten times, and the average value was used for subsequent analysis:
w a = m 1 m 2 m 1 × 100 %
where wa is the moisture content in %, m1 is the pre-drying mass in g, and m2 is the post-drying mass in g.

2.2.3. Density

Density is a key parameter in DEM modeling of wheat root systems and soil. The particle density assigned in DEM models directly determines the dynamic response and strongly influences the accuracy and reliability of the simulations [22]. Root density was determined using the water displacement method [11]. Fresh wheat root samples were first weighed using an electronic balance. Each sample was then carefully immersed in a graduated cylinder containing 150 mL of water. The volume of the root sample was calculated from the difference in water level before and after immersion. Root density was subsequently calculated using Equation (2). This measurement was repeated ten times, and the average value was used for analysis. Soil bulk density was measured using the cutting ring method [12,15]. A cutting ring with a known volume of 100 cm3 was driven vertically into an undisturbed soil profile at selected sampling points. After extraction, both ends of the ring were trimmed flush, sealed, and transported to the laboratory. The total mass of the ring and fresh soil was immediately recorded. The sample was then oven-dried at 105 °C for 24 h until a constant mass was achieved. After cooling in a desiccator, the total mass was measured again. Soil bulk density was finally calculated using Equation (3).
ρ g = m g v b v a
where ρg is the density in g·cm−3, mg is the sample mass in g, vb is the total volume of the sample plus water in mL, and va is the initial volume of water in mL.
ρ s = m d m s v d
where ρs is the soil density in g·cm−3, md is the mass of the cutting ring and dry soil in g, ms is the mass of the empty cutting ring in g, and vd is the volume of the cutting ring in cm3.
Experimentally determined moisture content and density values for wheat root systems and soil are summarized in Table 3. These measured parameters were directly implemented in the subsequent modeling procedure.

2.3. Mechanical Parameter Testing of Single Roots

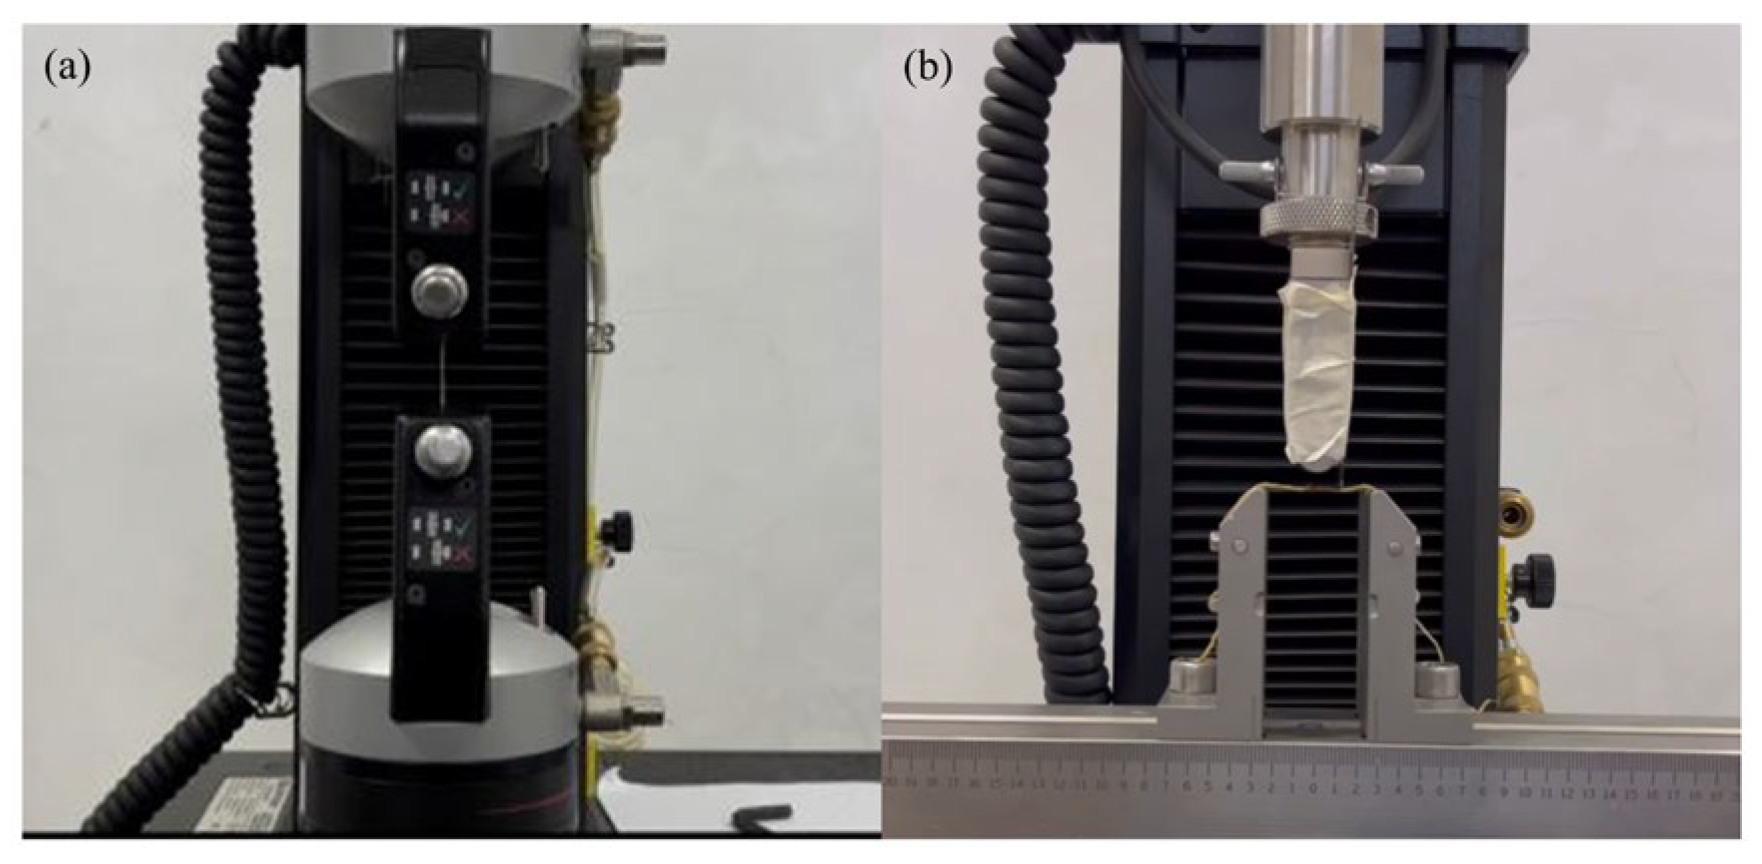
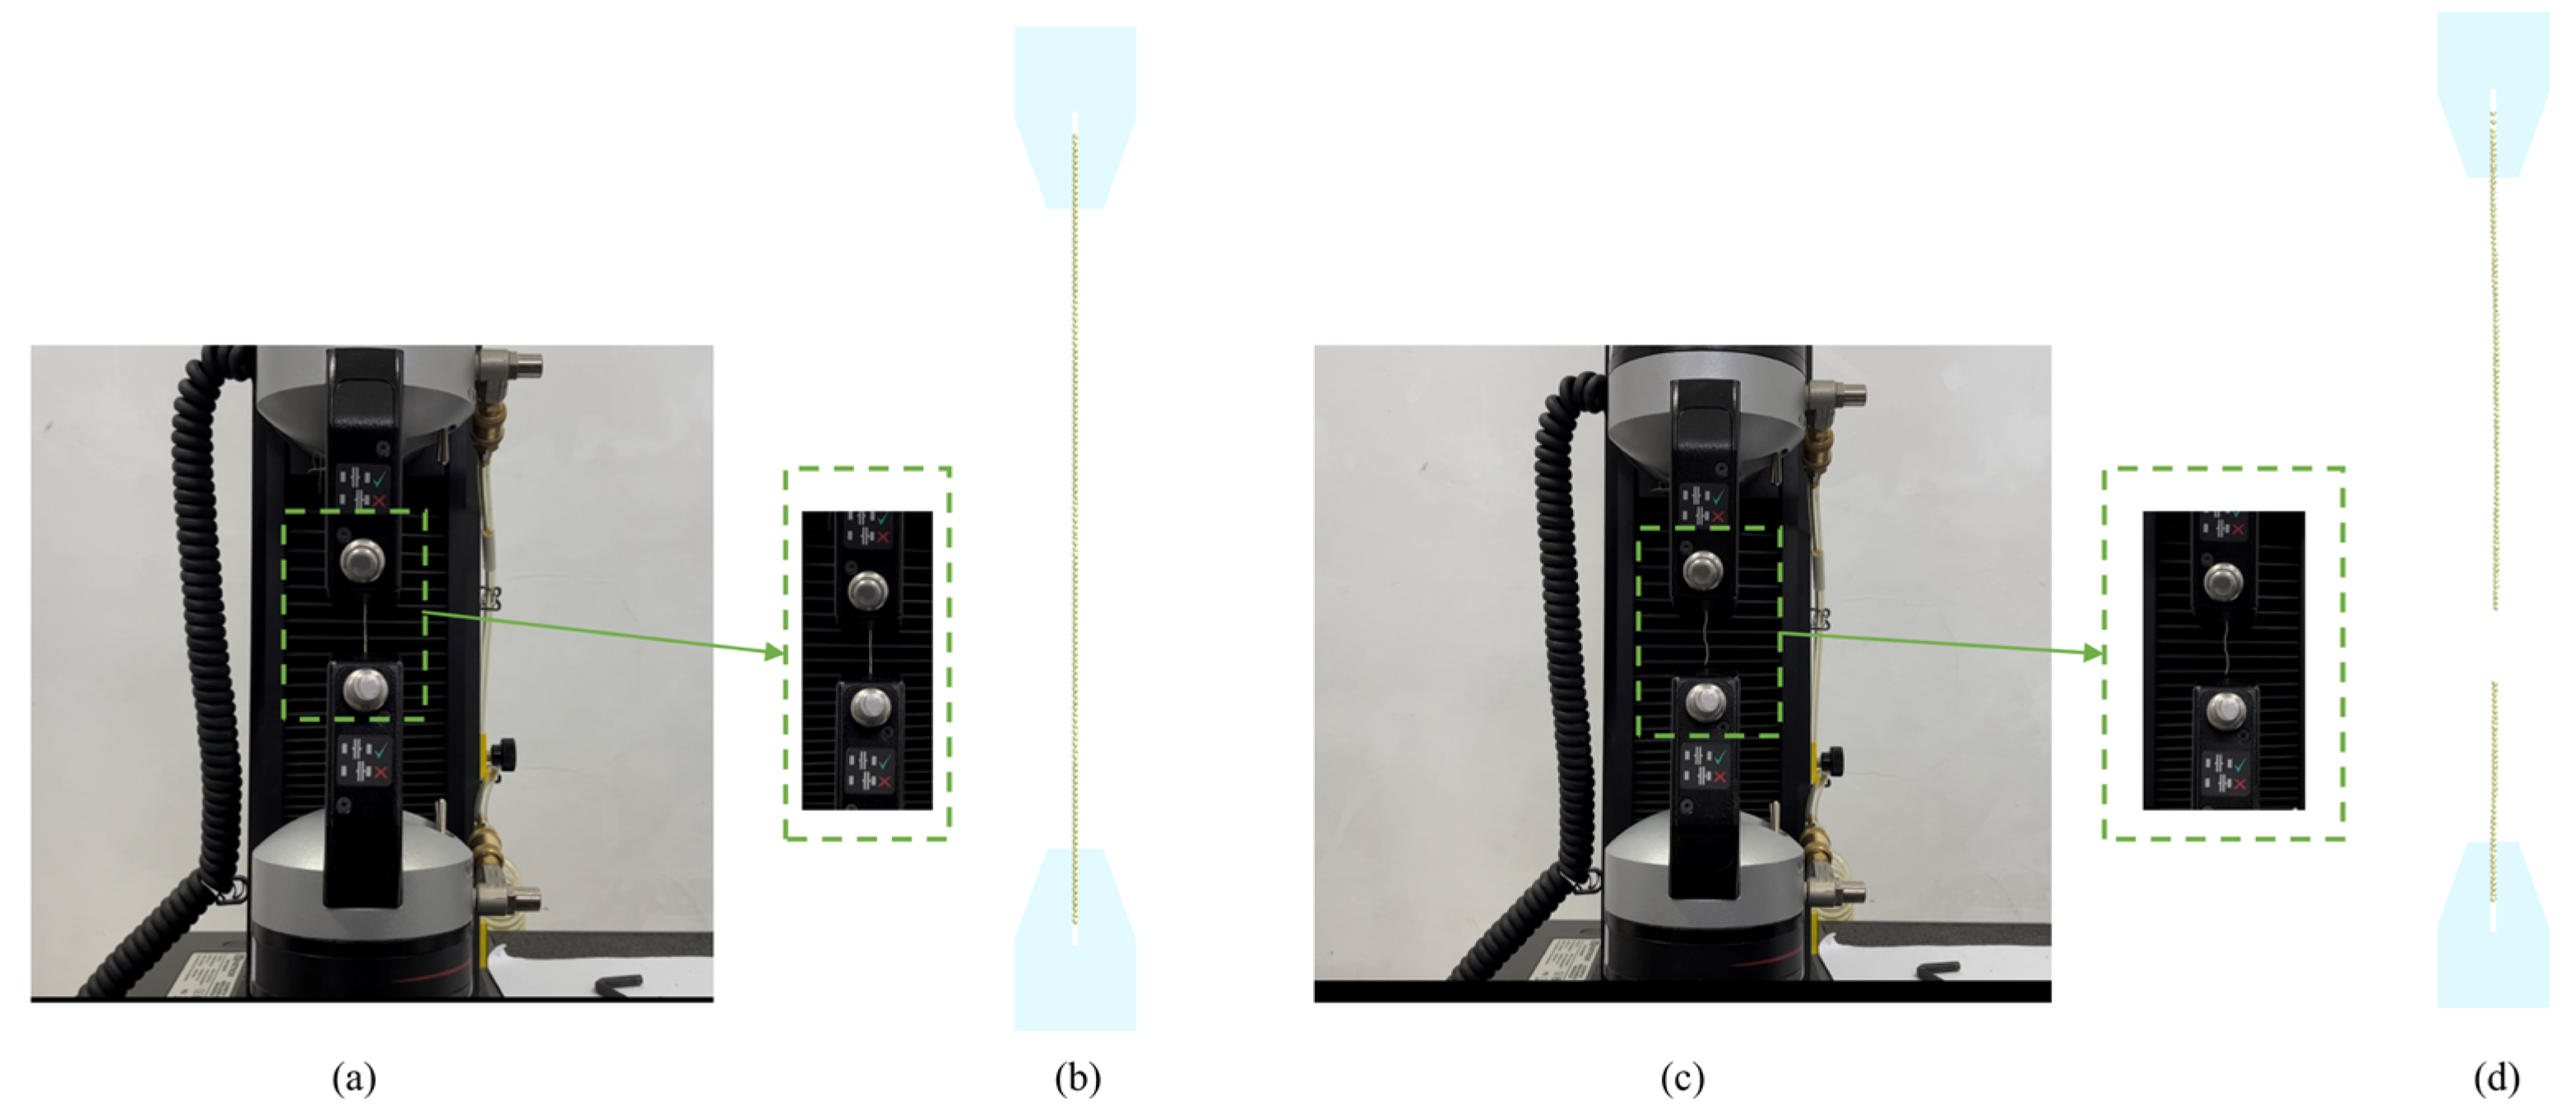
The mechanical properties of roots constitute a fundamental basis for constructing root DEM models, among which tensile strength and shear strength are two key indicators reflecting these properties [23]. The measured tensile and shear strengths provide a basis for parameter optimization in subsequent simulation experiments. The tensile and shear testing apparatus is presented in Figure 2.
In this study, a universal testing machine (Model 68SC, Instron, Accura; precision: 0.001 N and 0.001 mm, Norwood, MA, USA) was employed to conduct tensile and shear tests on individual wheat root systems, with a loading rate set at 5 mm min−1. At this speed, the quasi-static nature of the test is ensured, eliminating the influence of dynamic effects and better simulating the true mechanical properties of the root system [24]. For each set of tests, ten randomly selected individual root samples were used, and the average tensile force and average shear force were recorded separately. In addition, a digital vernier caliper was employed to measure the root diameter at the fracture location. Based on Equation (4), the tensile and shear strengths were calculated from the maximum force and corresponding root diameter. According to the theory of material mechanics, the elastic modulus of a single root can be calculated using Equation (5):
σ max = F g max A S Q max = F t max A S
where σmax is the normal stress per unit area in kPa, Qmax is the tangential stress per unit area in kPa, Fgmax is the maximum tension in the process of root stretching in N, Ftmax is the maximum shear force in the process of root shearing in N, and As is the area of the contact area in m2.
E = σ n ε = F n / A s Δ l / l
where E is the elastic modulus in kPa, σn is the tensile strength of a single root in MPa, ε is the tensile strain of a single root, Fn is the maximum tensile force applied on a single root in N, As is the area of the contact area in m2, Δl is the length change during tensile stretching of a single root in mm, l is the original length of a single root before tensile stretching in mm.

2.4. Discrete Element Simulation Contact Parameter Measurement Test

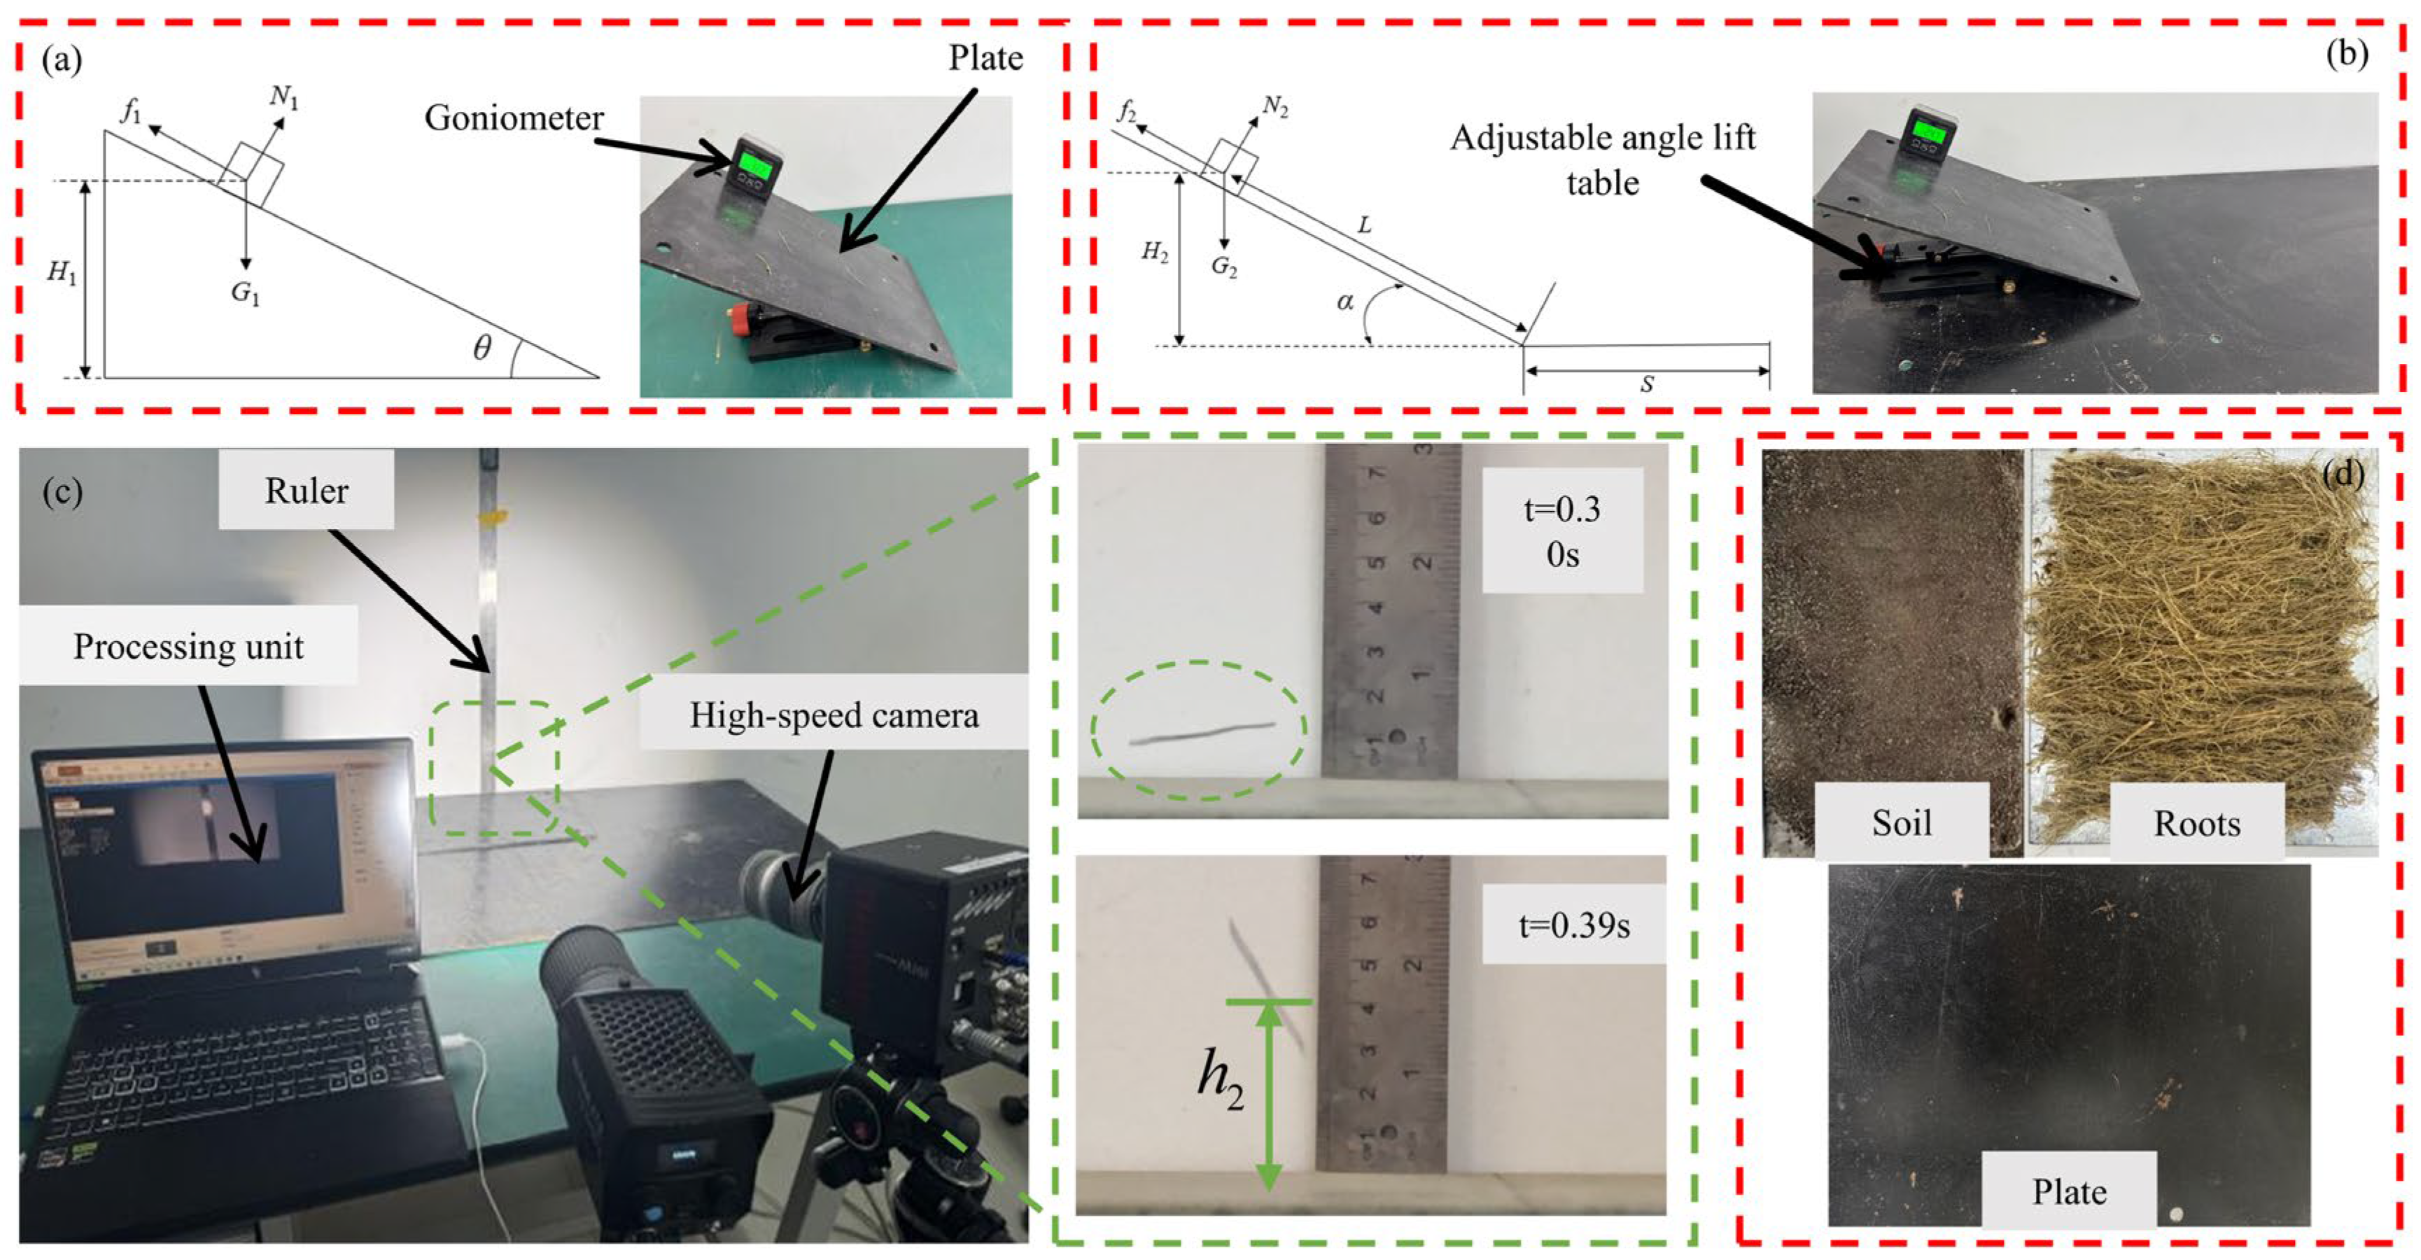
In this study, three types of contact materials were designed for the DEM simulations: a root plate, a steel plate, and a soil plate, as presented in Figure 3d. The root plate was created using roots from winter wheat plants randomly selected during the regreening stage in the experimental field. The wheat roots were carefully cleaned, pruned, and then evenly spread on the plate to simulate real root distribution. The soil was collected randomly from the experimental field to a maximum depth of 180 mm. After collection, the soil was placed directly into a container and leveled to simulate the natural field conditions, maintaining typical soil moisture levels during the regreening stage for the experiments. This approach ensures that the experimental setup closely mimics the real-world conditions encountered by winter wheat roots, allowing for more accurate simulation of root–soil interactions [25]. These materials were used to measure the various contact parameters between wheat root systems and soil. Each parameter measurement was repeated five times to ensure experimental reliability. The length of the root segments had no significant effect on the coefficient of restitution or the friction coefficients. In the contact parameter measurement tests, wheat root systems with a diameter of 1 mm were cut into segments approximately 15 mm in length [26].
For the measurement of the static friction coefficient, the test materials were placed horizontally on an angle-adjustable platform. One end of each platform was fixed, and the other end was slowly raised. At the onset of sliding, the lifting was immediately stopped, and the inclination angle of the platform was recorded using a high-precision angle sensor (accuracy: 0.01°), as shown in Figure 3a. To minimize measurement uncertainty, the inclination was adjusted in small increments, and each test was repeated multiple times; the average angle at sliding onset was used for calculating the static friction coefficient according to Equation (6).
f 1 = G 1 sin θ N 1 = G 1 cos θ f 1 = μ N 1
where G1 is the gravitational force applied in the measurement coefficient of static friction in N, f1 is the frictional force of the sample in N, N1 is the supporting force acting on the sample in N, μ is the coefficient of static friction, and θ is the angle between horizontal planes in °.
An inclined-plane rolling test was employed to determine the coefficient of rolling friction between the root segments and different materials, with the experimental setup presented in Figure 3b. The test bench consisted of an inclined plate and a horizontal plate made of the same material. The horizontal plate was kept level, and each root segment was placed at the midpoint of the inclined plate at a height of H2. The segment was then allowed to roll freely until it came to rest, and its horizontal rolling distance S was measured. Based on the law of conservation of energy, the gravitational potential energy of the segment was converted into frictional energy, and the dynamic friction coefficient of the contact interface was calculated using Equation (7).
G 2 H 2 = μ 1 G 2 L cos α 1 + S
where G2 is the gravitational force applied in the measurement coefficient of rolling friction in N, H2 is the initial height of the sample in m, μ1 is the coefficient of rolling friction, S is the distance traveled by the sample on the horizontal plane in m, L is the Rolling distance on inclined plate, α1 is the inclination angle of the inclined plate °.
In the restitution coefficient test, the material plate to be tested was horizontally fixed to the tabletop. Given the small mass of an individual wheat root segment, it was necessary to ensure that it underwent free fall from a critical height to produce a measurable rebound. The drop height was set to 1 m. A high-speed camera was used to record the motion trajectory of the root segment’s center of mass, and the experimental setup is presented in Figure 3c. The restitution coefficient at the contact interface was calculated according to Equation (8).
e = h 2 h 1
where e is the coefficient of restitution, h1 is the height of the sample in free fall in m, and h2 is the rebound height of the sample following collision in m.
The friction coefficient and coefficient of restitution were assessed through friction characteristic tests and root drop rebound tests, as illustrated in Figure 3 [27]. The average parameter values include the static friction coefficients of 0.48 for root–steel interfaces, 0.22 for root–soil interfaces, and 0.53 for root–root interfaces. The rolling friction coefficients were determined as 0.32 for root–steel interfaces, 0.56 for root–soil interfaces, and 0.33 for root–root interfaces. The coefficients of restitution were measured as 0.36 for root–steel interfaces, 0.46 for root–soil interfaces, and 0.42 for root–root interfaces.

2.5. DEM Modeling and Bonding Parameter Calibration of the Wheat Root System

2.5.1. Bonding Model of Wheat Root System

During the root-cutting process of wheat hoeing, wheat root systems undergo deformation and fracture. In this study, the HMBM in EDEM was employed for modeling and simulating wheat root systems. The HMBM integrates Hertz and Mindlin theories with a bonding and breakage mechanics framework, enabling the simulation of both the deformation and fracture behaviors of wheat roots under mechanical stress [28,29]. Compared to other commonly used DEM methods, such as the contact particle model based on JKR theory or simple bonding models, the HMBM provides a more realistic representation of root behavior by considering both the adhesive bonding between soil particles and the breakage of root tissues. While these other models are computationally more efficient, they often lack the precision needed to simulate the root systems’ mechanical response during the critical root-cutting process. The HMBM, though computationally more demanding, allows for more detailed and accurate predictions of root fracture, which is crucial for understanding the root-pruning effects in wheat hoeing operations [10]. For DEM modeling of wheat root systems using HMBM, six key parameters must be specified: the normal stiffness per unit area (Kn), tangential stiffness per unit area (Kt), critical normal stress (Kn2), critical tangential stress (Kt2), particle bonding ratio coefficient (φ), and bonding radius (Rr) [30]. The mechanical parameters include the critical normal stress and critical tangential stress, which determine the maximum stress that the bonding can withstand. If the external force on the bonding exceeds the critical stress, the bonding will break. The strength parameters were obtained from tensile and shear tests. In general, φ ranges from 1.0–1.2, and Rr is 1.2–1.5 times the particle radius [31]. The values of Kn and Kt were calculated according to Equation (9)–(14). The results of the calculations are summarized in Table 4.
K n = k n A c = 2 E * R δ n 1 2 π a 2
K t = k t A c = μ 2 k n A c
In which:
k n = 2 E * R δ n 1 2
A c = π a 2 a = 3 F n R 4 E * 1 3
F n = 4 3 E * R δ n 3 2
E * = 1 v 1 2 E 1 + 1 v 2 2 E 2 1 R = 1 R 1 + 1 R 2 1 δ n = R 1 + R 2 d
where kn is the normal contact stiffness of particles in N/m, kt is the tangential contact stiffness of particles in N/m, and Ac is the Particle contact area in m2. E* is the equivalent elastic modulus in Pa, R is the equivalent radius of particles in m, and δn is the overlap of particle phases in m. a is the particle contact radius in m, Fn is the normal contact force between particles in N, and E1 and E2 are the elastic modulus of the particle in Pa. v1 and v2 are the Poisson’s ratios of the two particles, R1 and R2 are the radii of the two particles in Pa, d is the center-to-center distance between the particles in m, and μ2 is the friction coefficient between the particles.
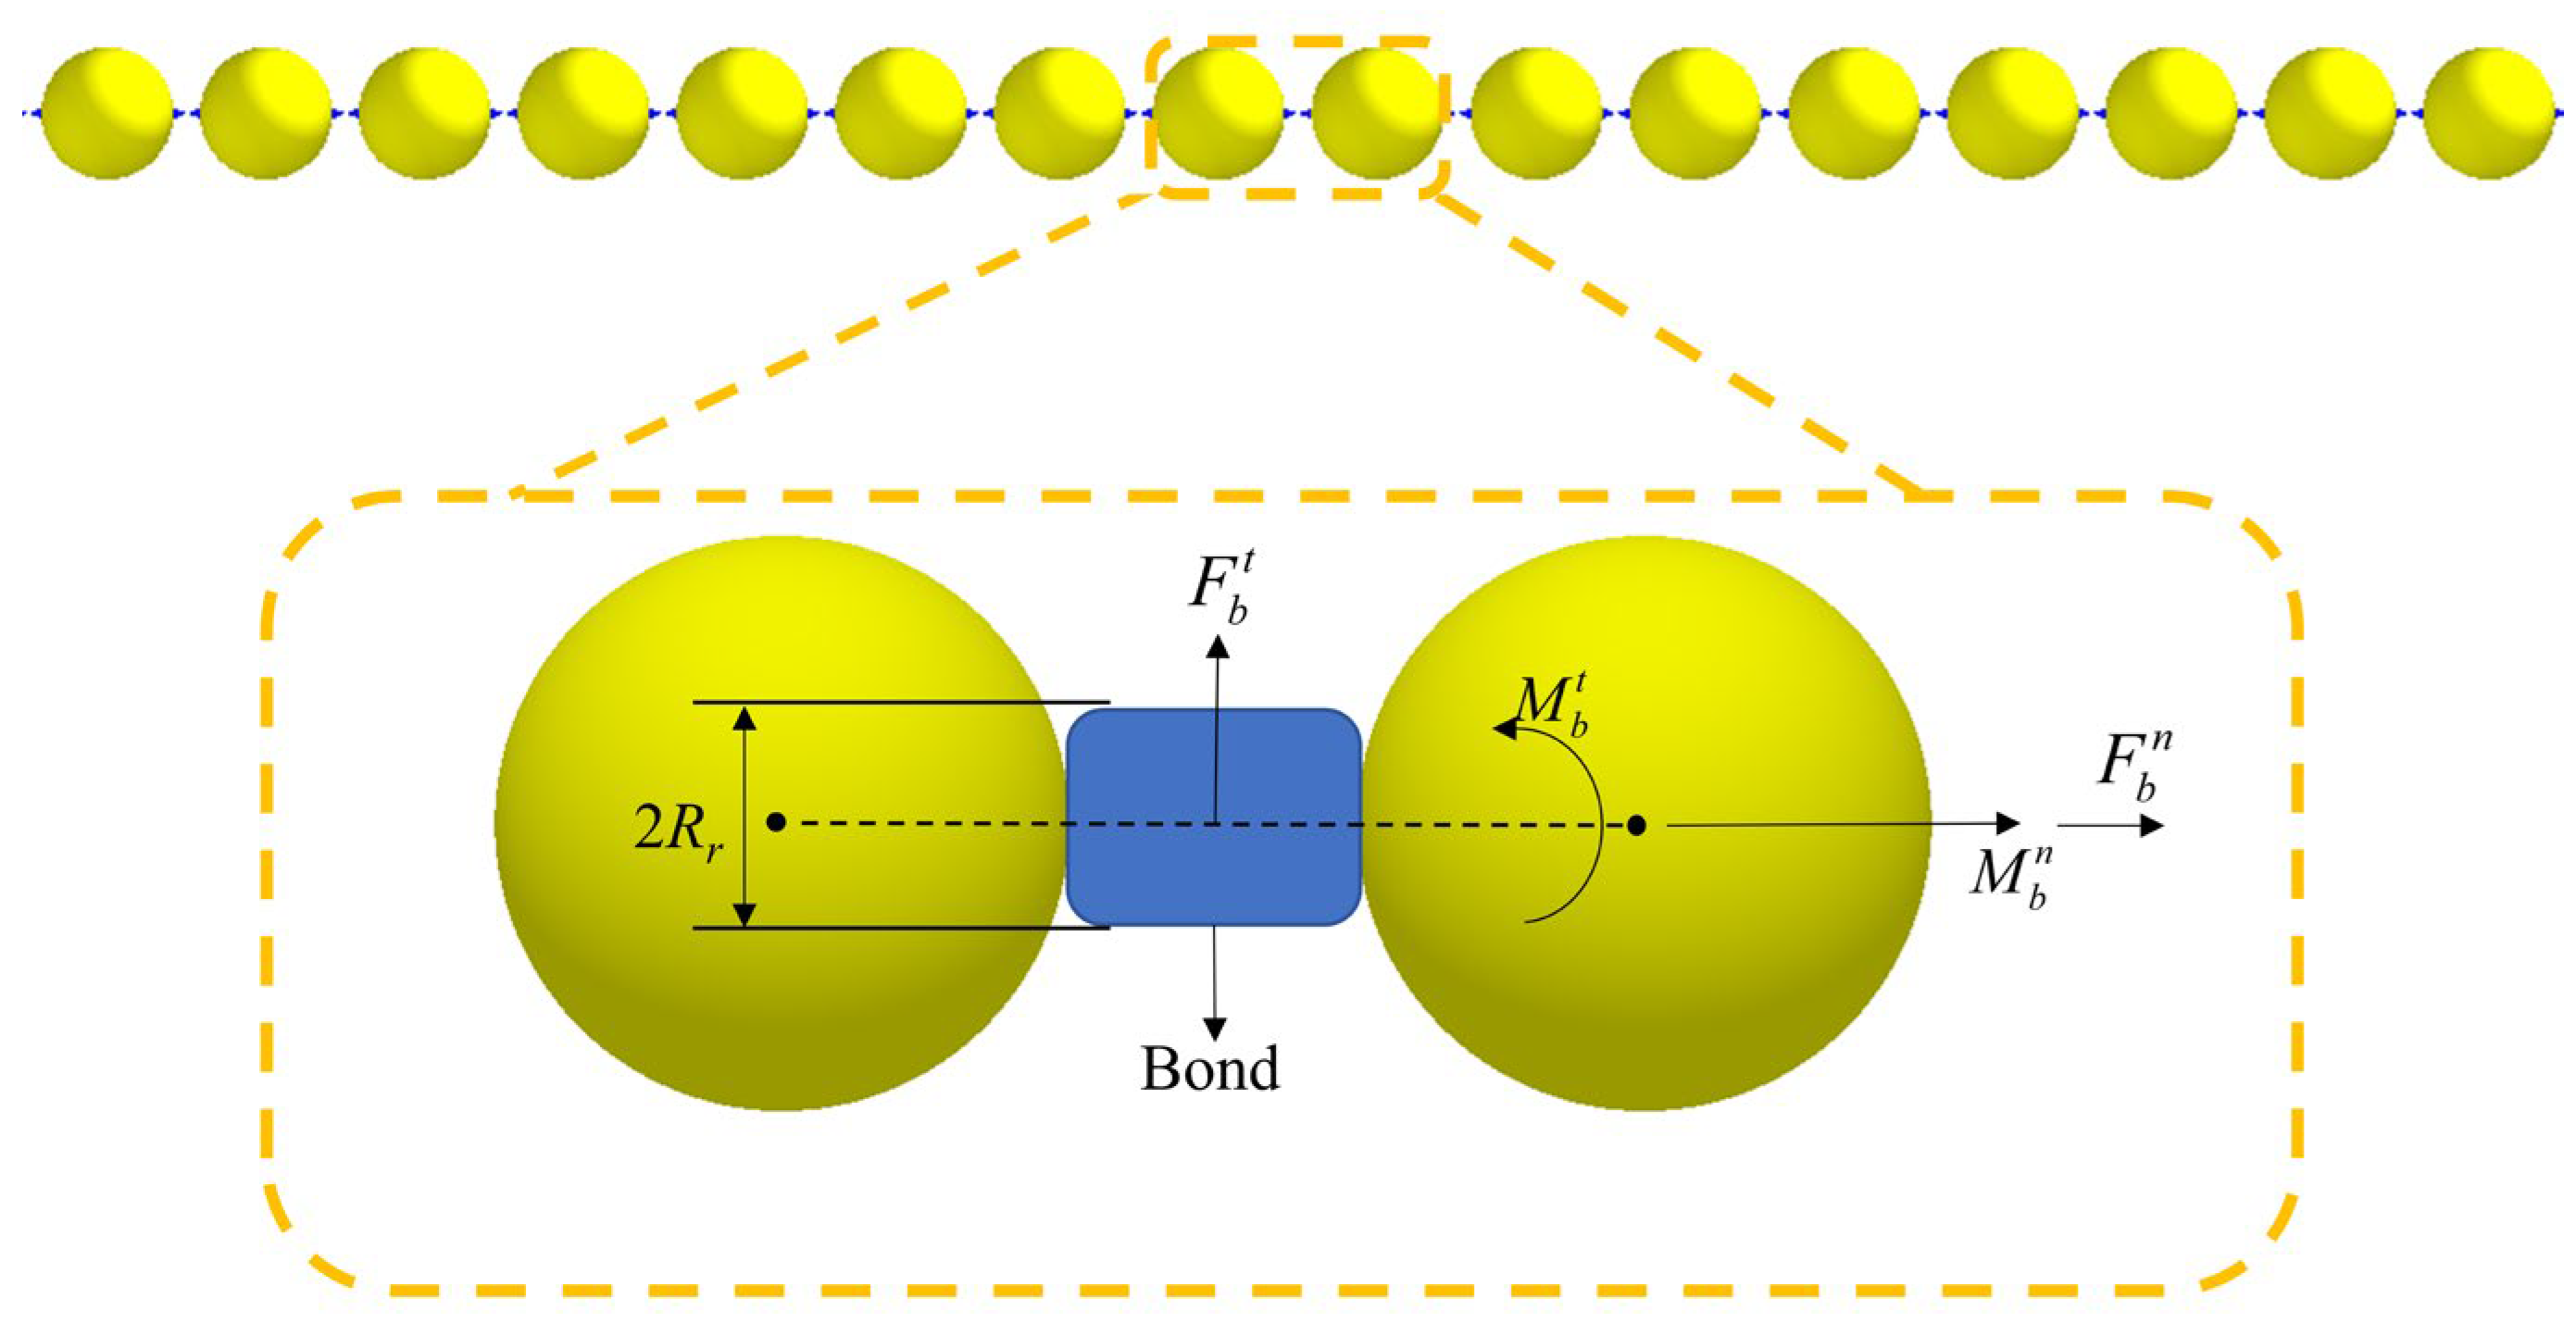
The bonding exhibits specific mechanical properties. When subjected to external forces, the model deforms and generates internal stresses. The bonding is implemented in the form of a virtual cylindrical element, with its structural principle presented in Figure 4.
When the bonding is subjected to tensile, shear, bending, or other forces, the two particle elements undergo relative motion, and the interparticle forces and moments are calculated according to Equations (15) and (16).
δ F b n = v n K n A d δ t δ F b t = v t K t A d δ t δ M b n = ω n K n J δ t δ M b t = ω t K t J 2 δ t
In which:
A d = π R r 2 J = 1 2 π R r 4
When the bonding experiences forces exceeding σmax and Qmax, bonding failure occurs. The formulas for calculating σmax and Qmax are presented in Equation (17):
σ max < F n A d + 2 M b t R r J Q max < F t A d + 2 M b n R r J
where δFbn is the increments of normal forces in N, δFbt is the increments of tangential forces in N, δMbn is the increments of normal torque in N·m, δMbt is the increments of tangential torque in N·m, ωn is the normal angular velocities of relative motion between particles in rad/s, ωt is the tangential angular velocities of relative motion between particles in rad/s, vn is the normal velocities of relative motion between particles in m/s, vt is the tangential velocities of relative motion between particles in m/s, Ad is the area of the particle contact area in m2, J is the polar moment of inertia in m4, δt is the time step in s.

2.5.2. DEM Modeling of Wheat’s Root System

The wheat root system exhibits significant structural heterogeneity: the lateral root lengths vary greatly and are distributed irregularly within the soil. To enhance the overall modeling efficiency of the root system in EDEM, this study excludes smaller roots and retains only the primary and secondary roots [32].
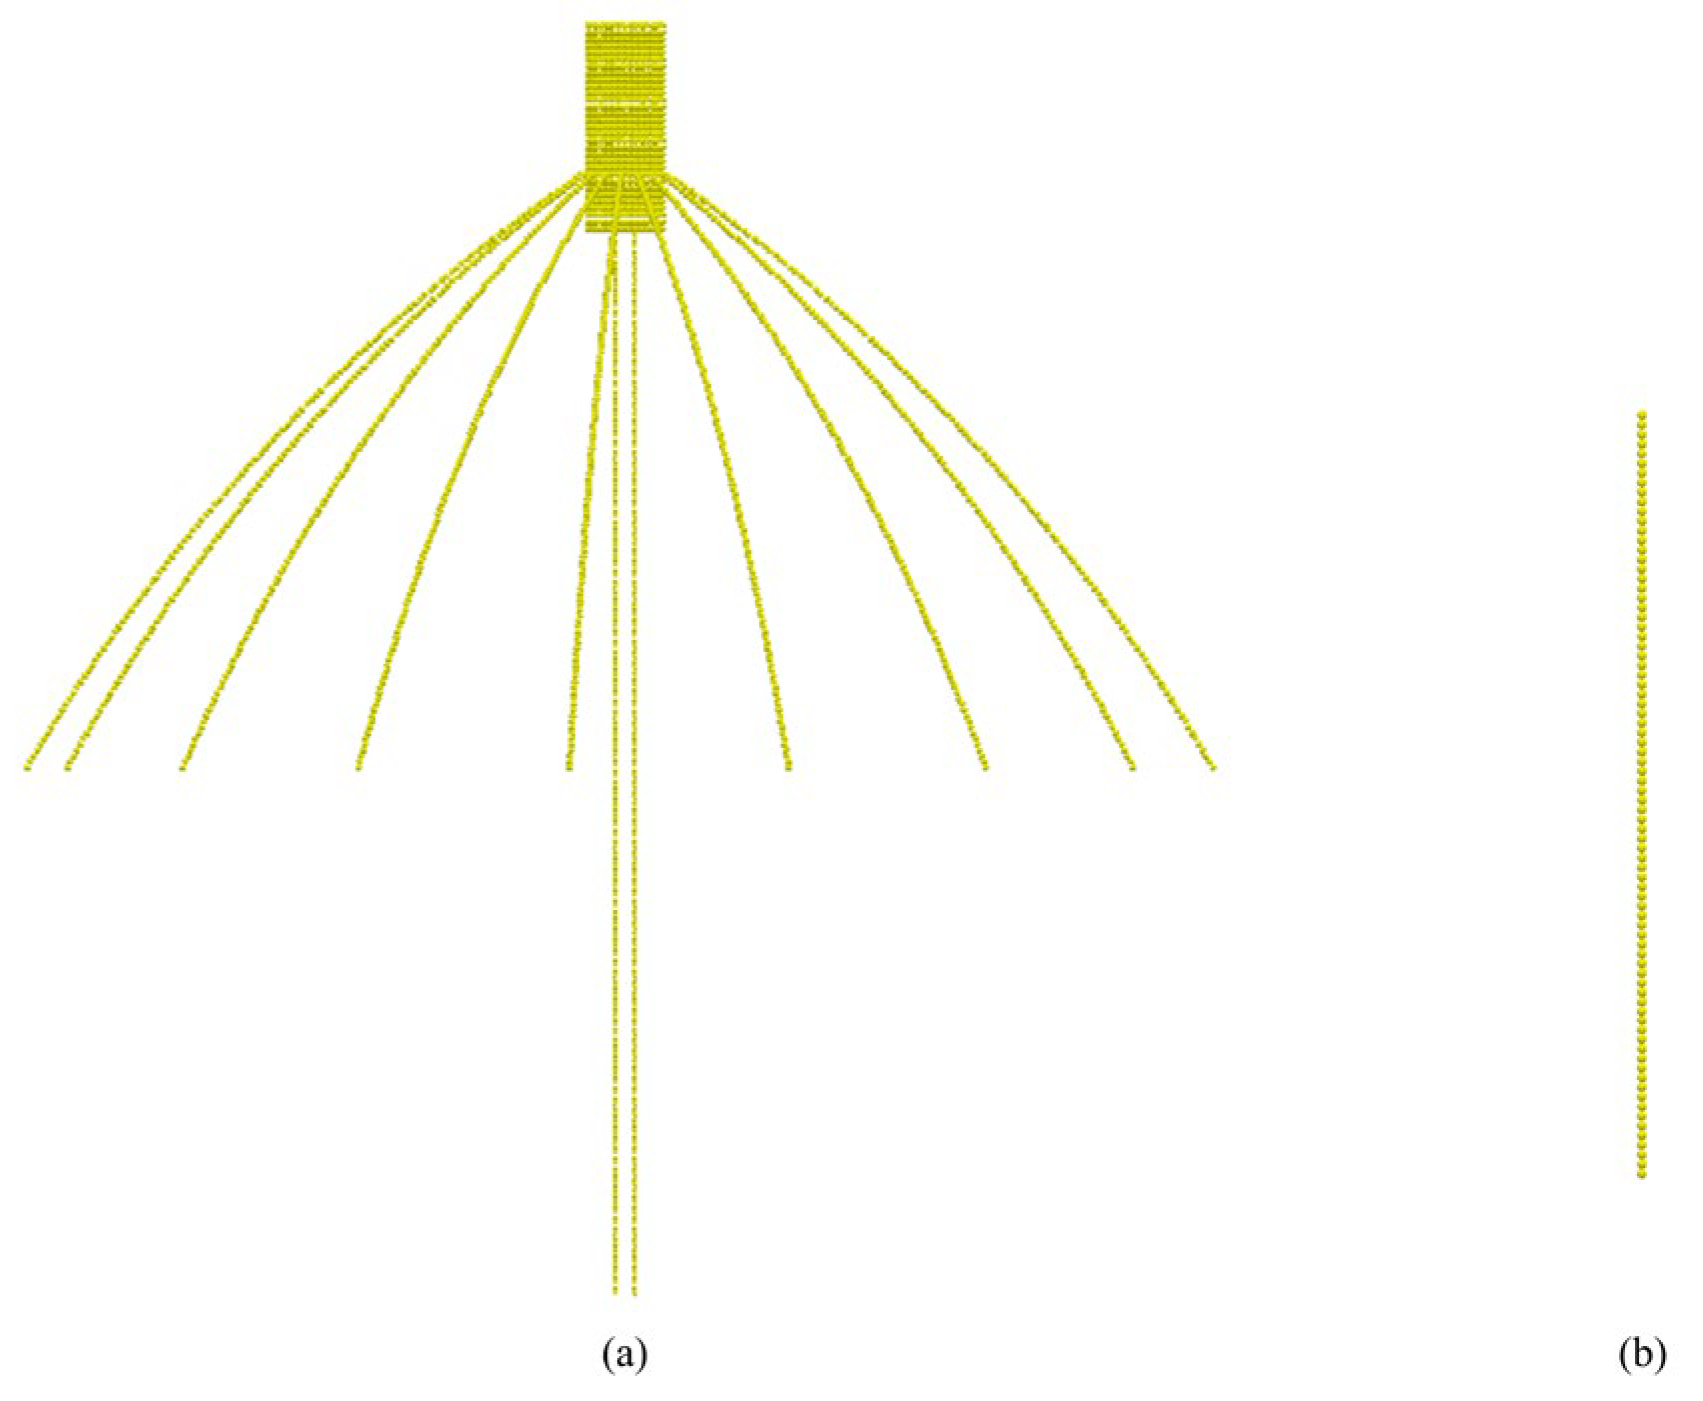
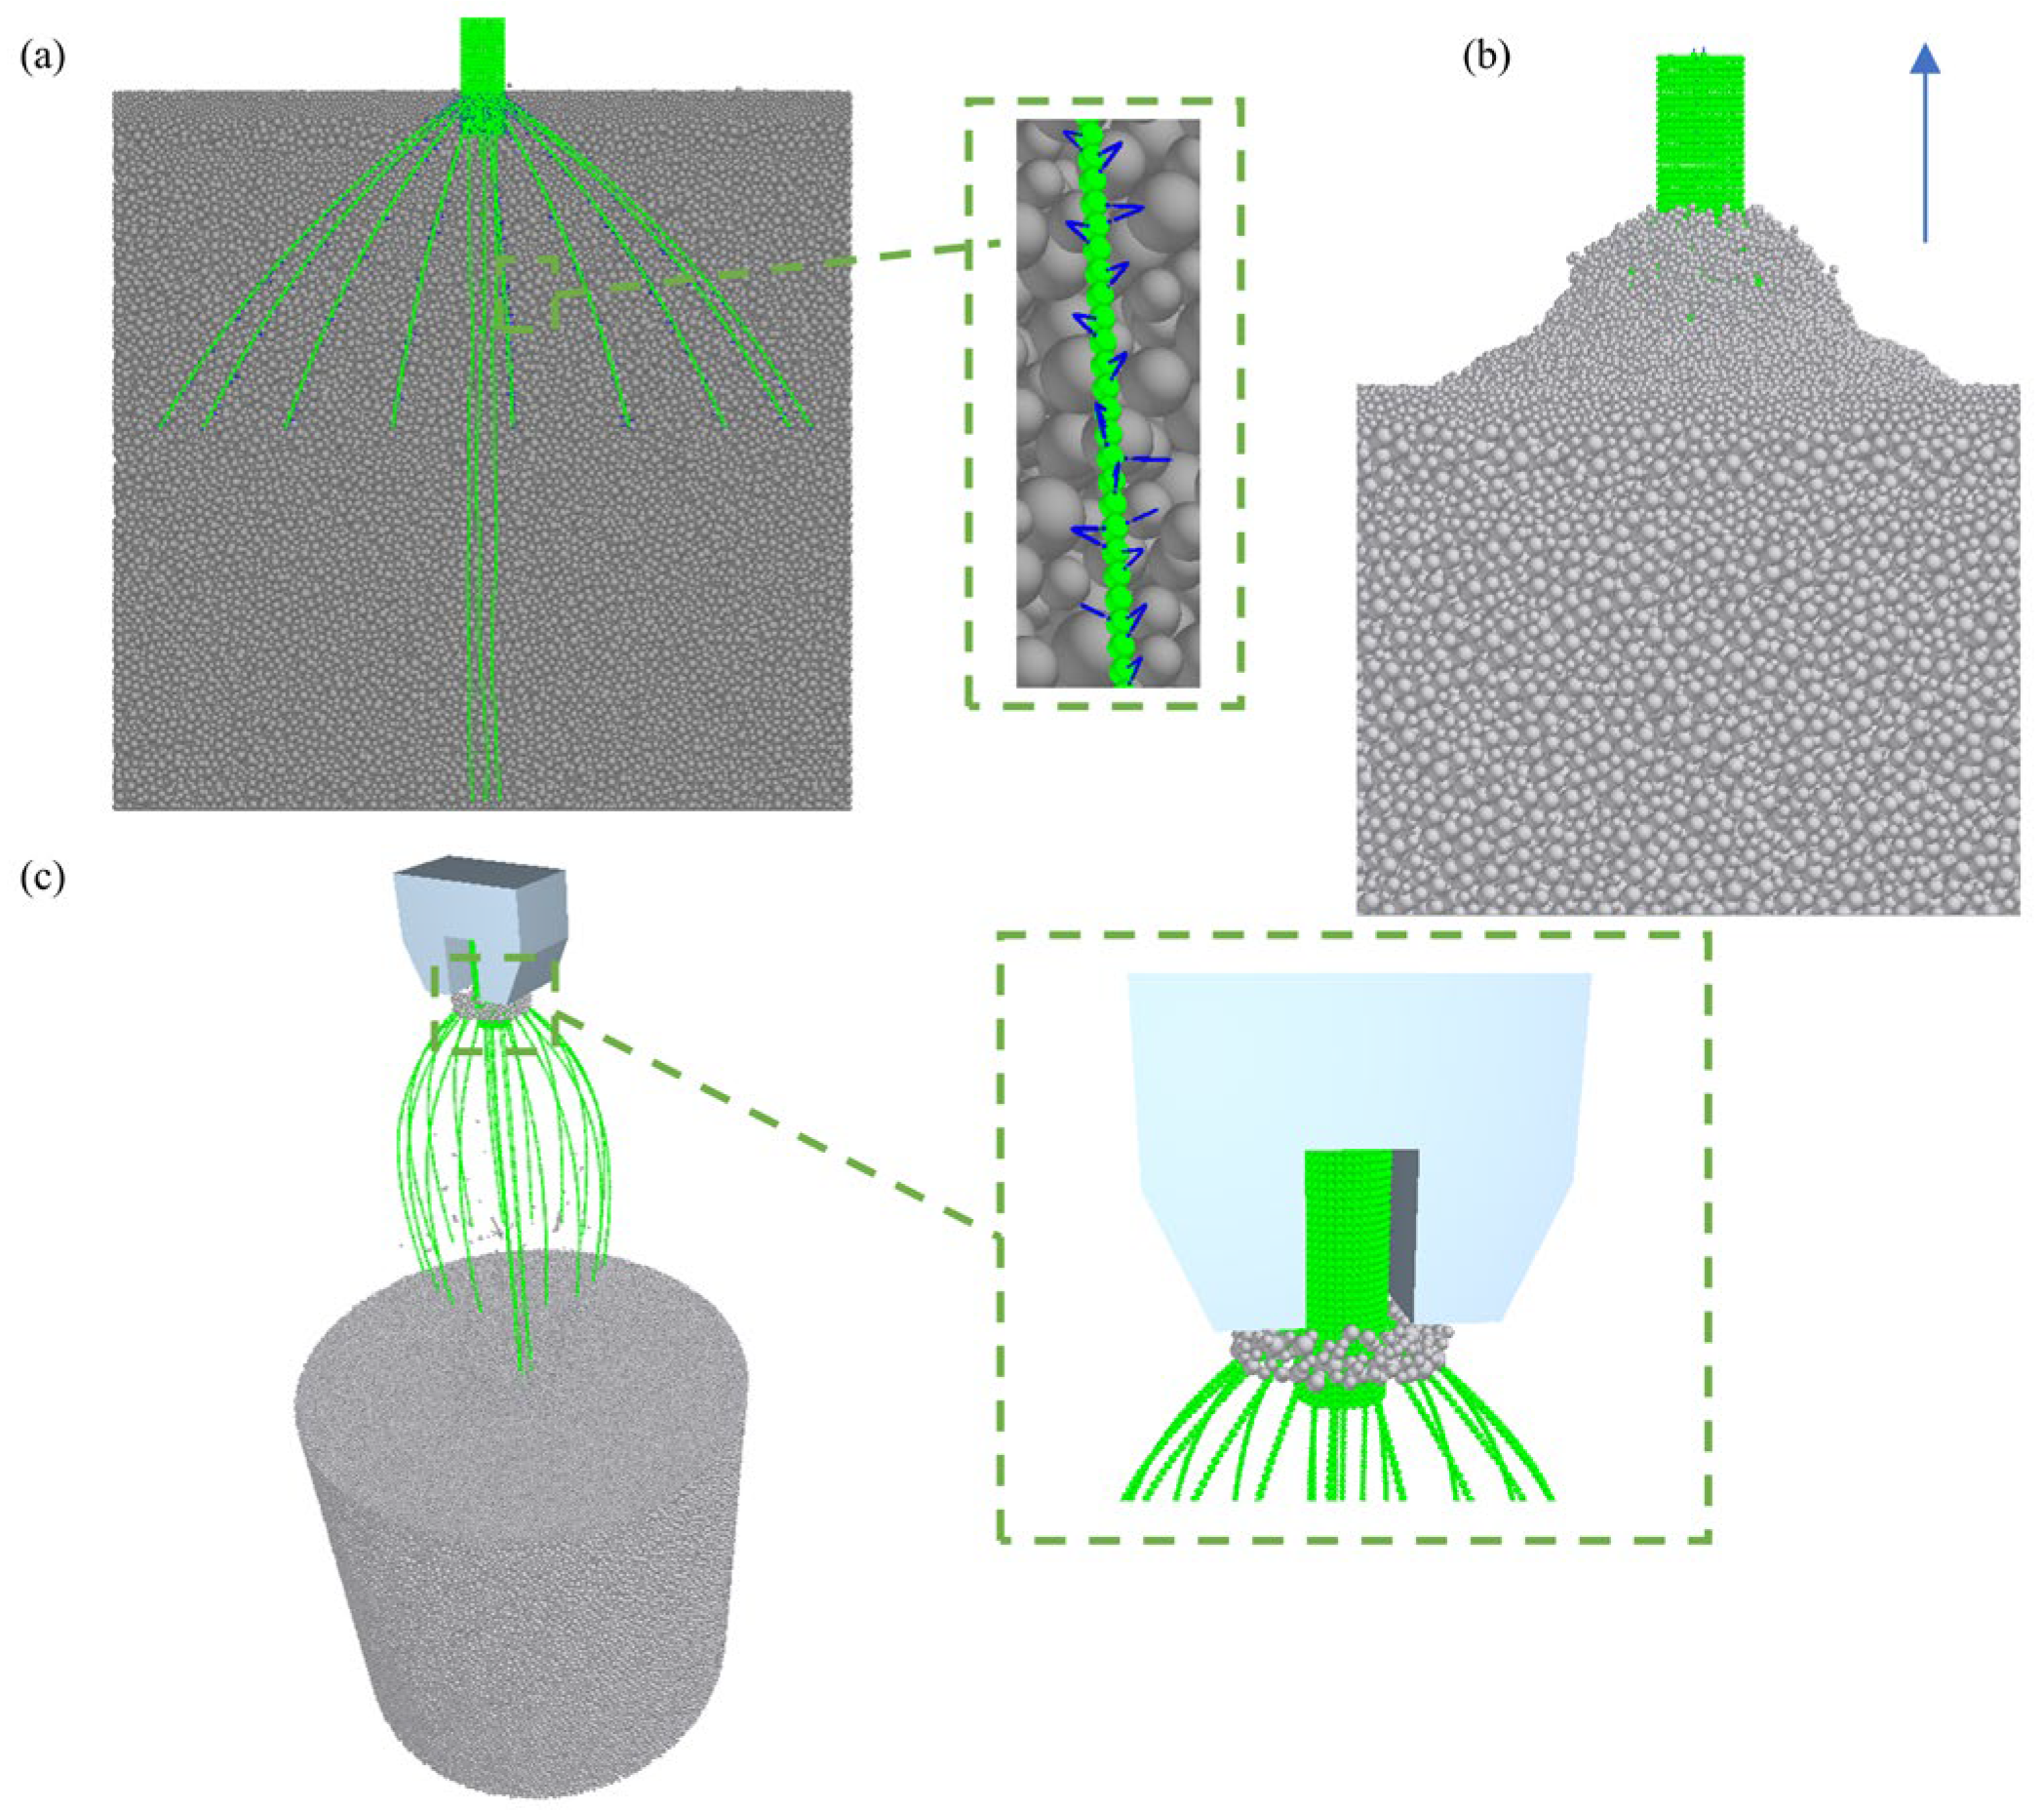
Based on the wheat root system dimensions and angles within the soil measured in Section 2.2, an arc curve was used to calculate the root depth and angle within the soil, following the formula in Equation (18) to accelerate the modeling process. The root system model was constructed using the particle packing function in the DEM simulation software. Specifically, a 3D geometric model of the wheat root system was first created in SolidWorks (version 2019), utilizing the measured root lengths, diameters, and angles. This model was subsequently imported into HyperWorks (version 2021) for finite element meshing, where mesh density was carefully adjusted according to the root length-to-diameter ratio. For discretization, primary roots were represented using particles with a diameter of 0.8 mm, while secondary roots were represented using particles with a diameter of 1.0 mm. The meshing process ensured that the mesh resolution was proportionate to the root system’s average length and diameter. Following meshing, the mesh node coordinates were exported and stored in a database for further processing. In the EDEM software (version 2022), the mesh node coordinates were used to generate root system particle assemblies by placing particles at the node positions. These particles were then connected based on their tangential points of contact, ensuring realistic particle interactions without overlap. The use of Meta-particles allowed for an accurate representation of the wheat root system, both at the full-root and individual root levels. The resulting DEM representation of the complete wheat root system, as well as the single-root model. Additionally, a second-generation method was used in EDEM, where two sufficiently large spaces were created, each with a flat surface added. These surfaces were set as virtual particle factories. The model generation was configured separately for the whole wheat plant and the single root. Both the whole root system and the single root models were set with a quantity of one, and the root orientation was fixed downward. This setup resulted in the generation of the wheat root system and single root models, as shown in Figure 5.
The root system was primarily used to simulate root–soil interactions during root pruning and pull-out processes, allowing for the validation of bonding model parameters under realistic, full-root conditions. It also serves as a tool for studying the mechanical behavior of the entire root system in soil during regreening. On the other hand, the single-root model was employed for calibration and validation of the bonding model parameters, specifically through single-root tensile and shear tests. This model helped to isolate and quantify the mechanical properties and bonding interactions of individual roots before scaling up to the whole-root system. This methodology enabled the accurate simulation of root–soil interactions, with particular focus on the regreening stage of wheat, providing a robust foundation for dynamic interaction simulations during root pruning processes.
y l = 280 1 596 x 2

2.5.3. Validation of Contact Parameters via Angle of Repose

The DEM model inherently differs from real-world conditions; therefore, validation of the contact-mechanical parameters is essential to ensure consistency between the model and actual physical parameters. The angle of repose (AOR) comprehensively reflects the contact, friction, and flow characteristics among particles. The restitution coefficient, static friction coefficient, and rolling friction coefficient between wheat root segments all exert a significant influence on the AOR [33].
To validate the effectiveness of the measured contact parameters in Section 2.4, an AOR simulation test was conducted in EDEM. In the simulation, a funnel model with the same dimensions as the physical test was first constructed in SolidWorks and then imported into EDEM. A virtual plane was created above the funnel as a particle factory, which dynamically generated root segment models with lengths of 4 mm, 8 mm, and 10 mm (Figure 6). The proportion of particles in each length category was kept consistent with the physical test samples, resulting in a total of 800 particles.
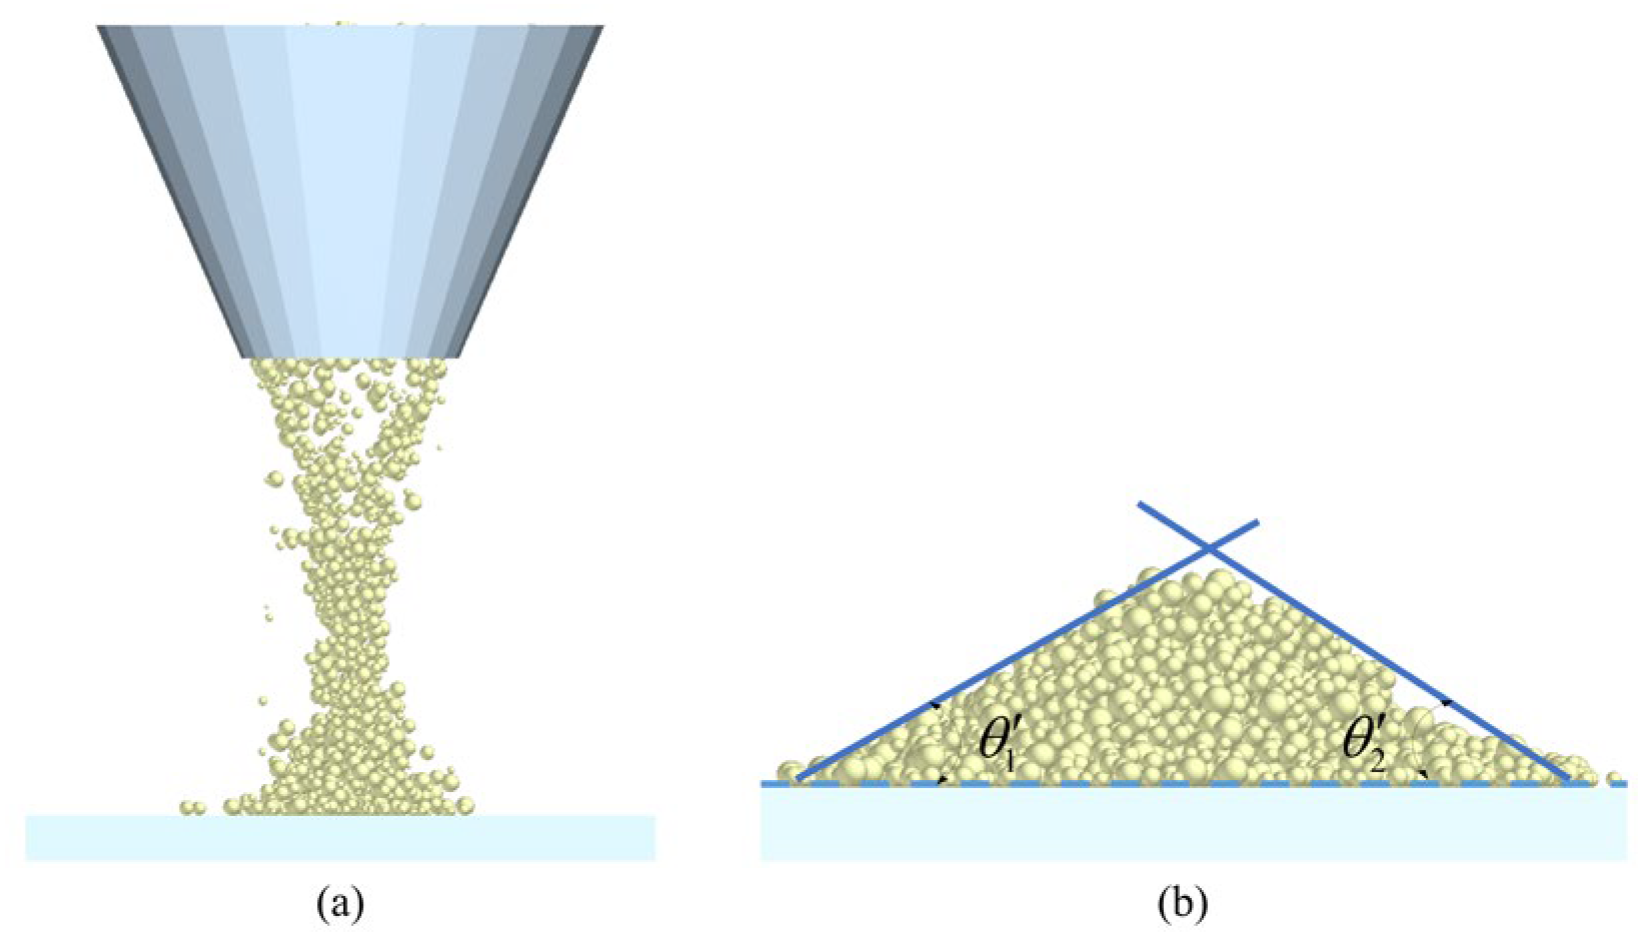
The simulation time step was selected based on EDEM’s recommended range for numerical stability and computational efficiency. Through iterative testing, a time step of 5.85 × 10⁻⁸ s was chosen, with a total simulation time of 5 s. During the simulation, particles fell naturally under gravity through the funnel and formed a conical pile on a horizontal base plate. After the simulation concluded, using the EDEM post-processing tool, the angles between the pile slope and the base plate were measured from four directions, and the average value was taken as the simulated AOR. The measured and simulated AOR values are presented in Figure 7.

2.5.4. Calibration of Bonding Parameters for Wheat Roots

To further enhance the accuracy and simulation reliability of the wheat root DEM bonding model, the HMBM parameters for the wheat root systems were optimized and calibrated based on the results of the physical tensile and shear tests presented in Section 2.3.
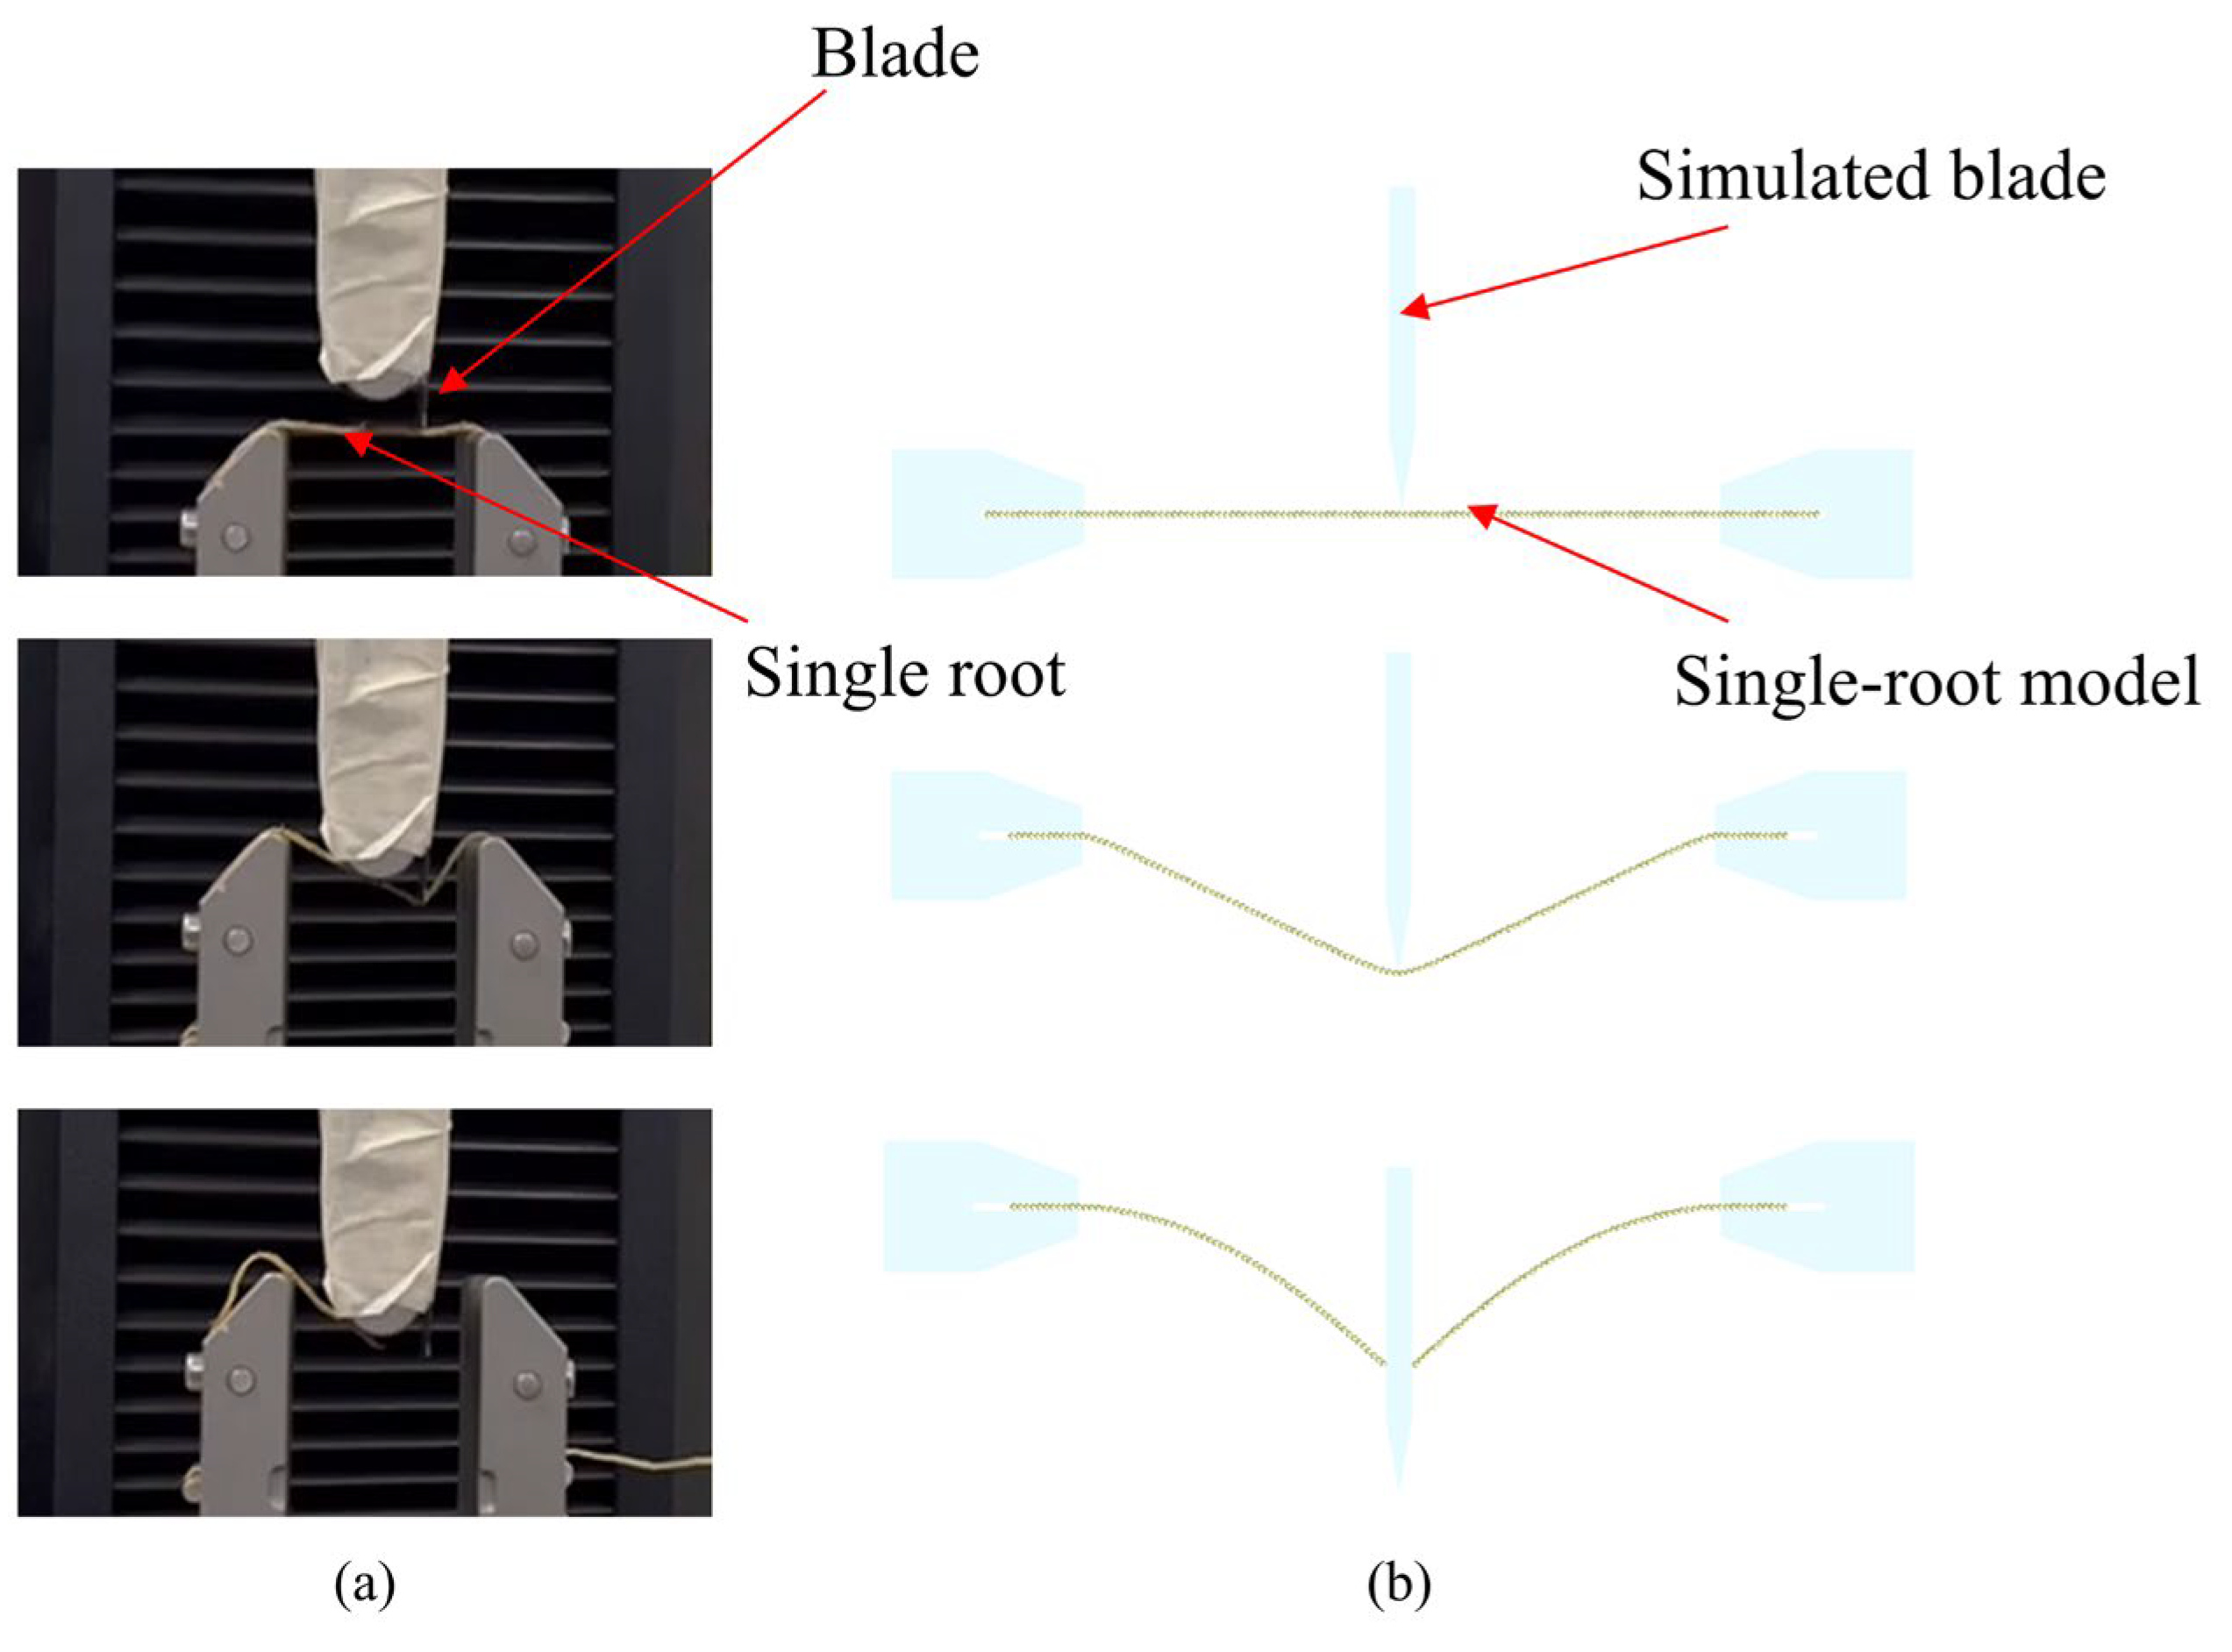
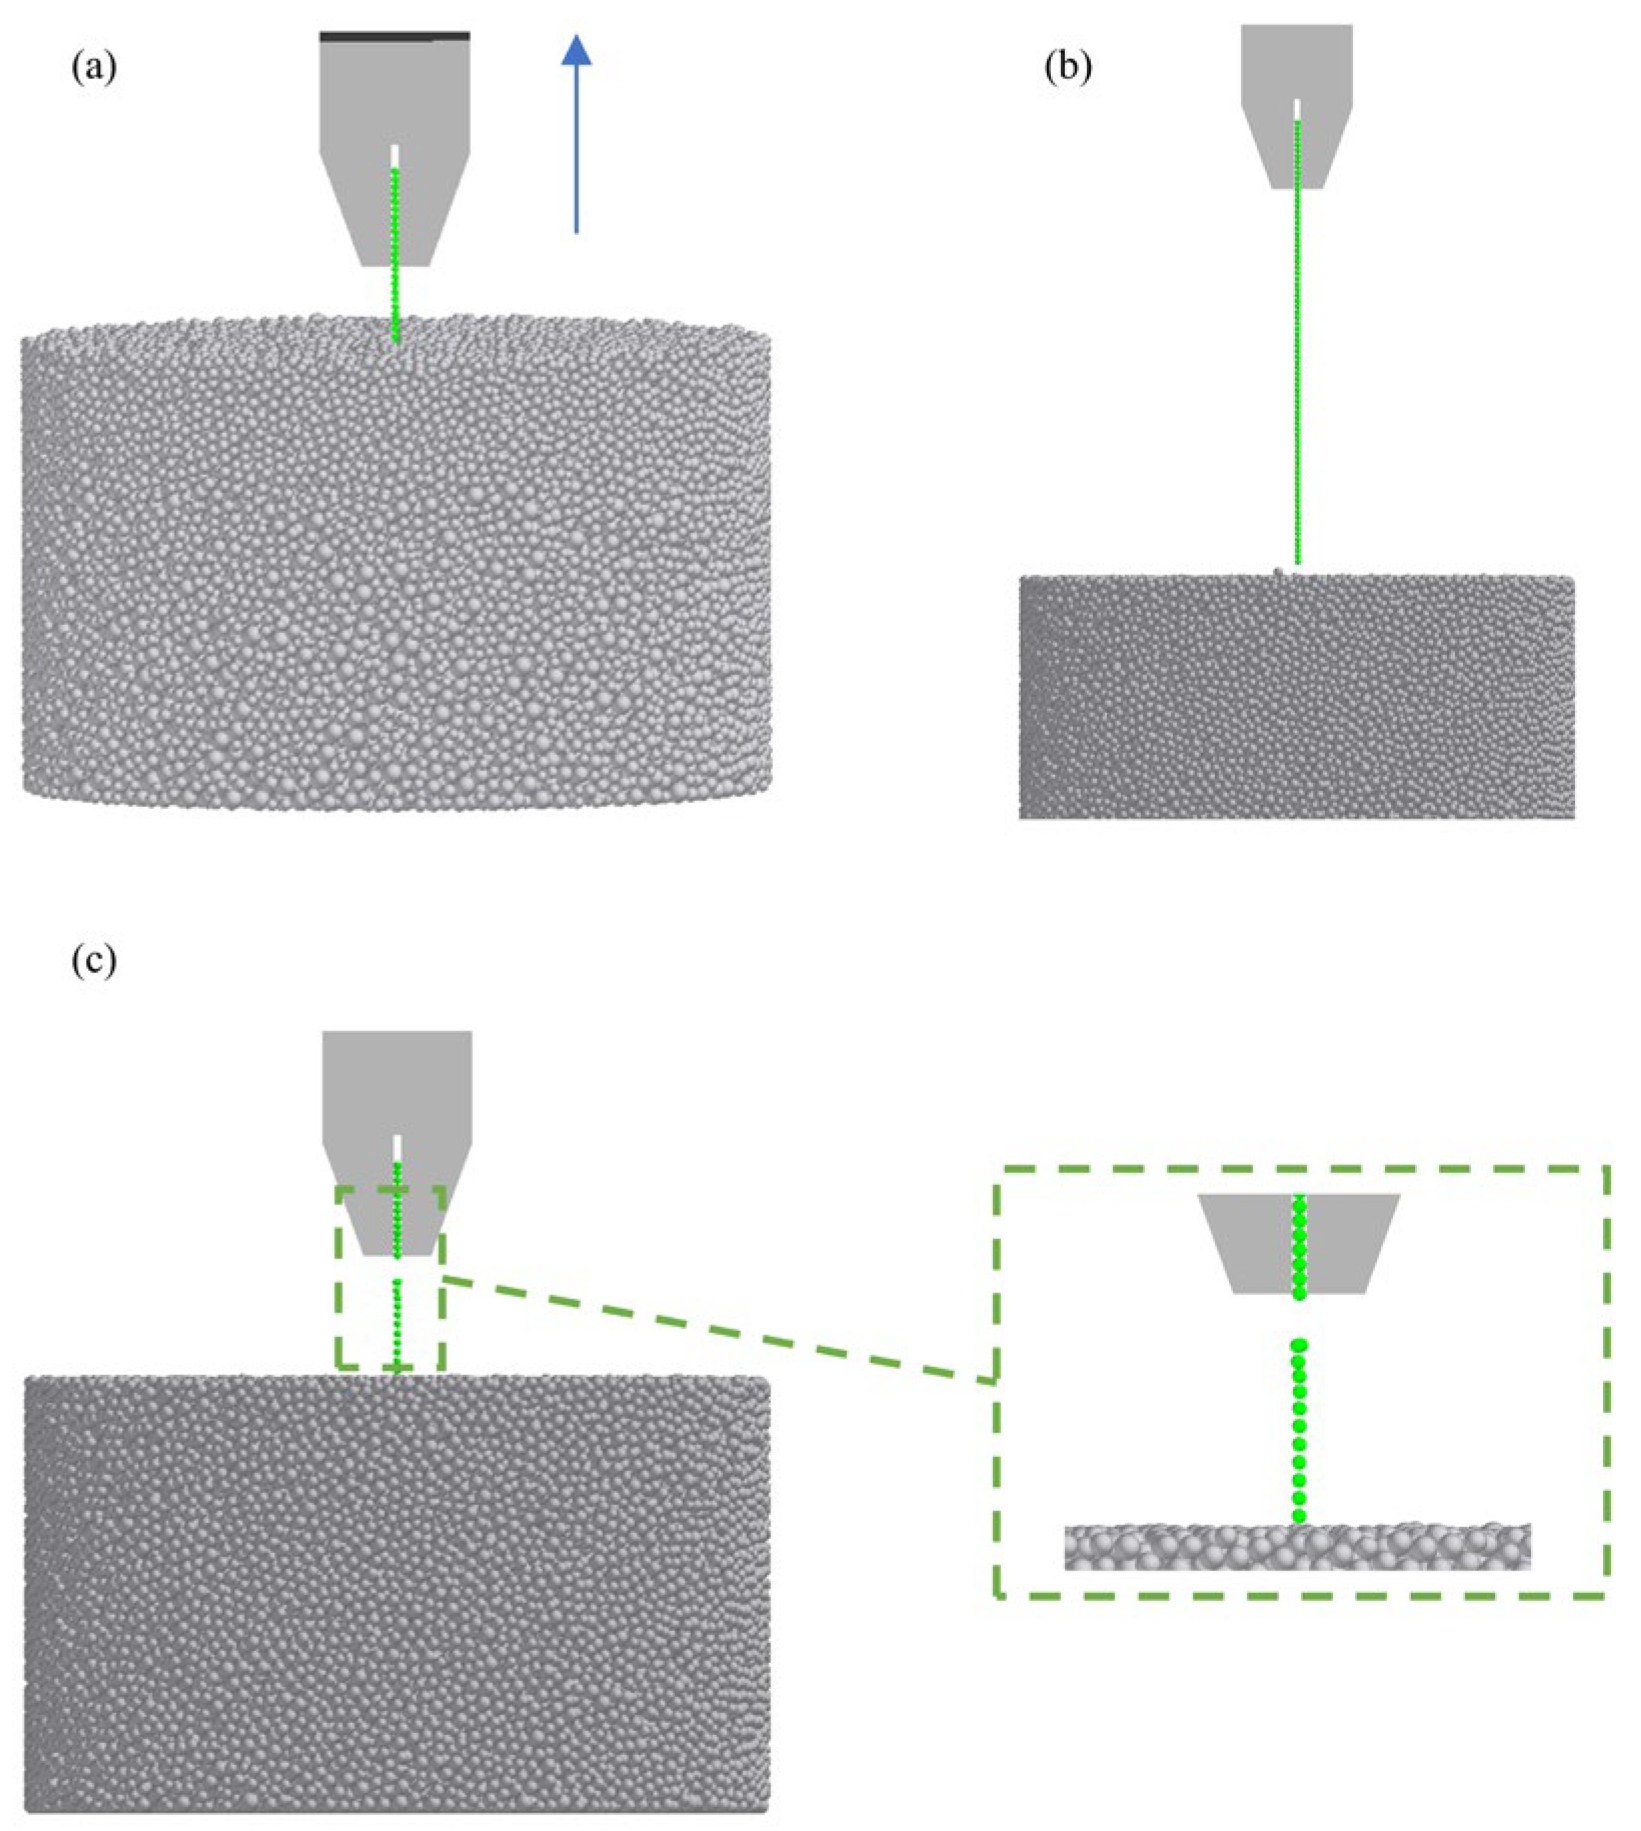
A 3D model consistent with the actual tensile and shear apparatus was created in SolidWorks and imported into EDEM software. The simulation platform was constructed using the same motion conditions as the experiment. Figure 8a,b show the initial state and failure state of a single root under actual and simulated tensile conditions, respectively. Figure 8c,d display the initial state and failure state of a single root under actual and simulated tensile conditions. Figure 9a,b illustrates the initial state and failure state of a single root under actual and simulated shear conditions.
In this study, the maximum tensile and shear forces of a single wheat root, obtained from experimental tests, were used as response variables to assess the bonding model. To identify key factors influencing the bonding model parameters, as discussed in Section 2.5.2, a Plackett–Burman (PB) design in Design-Expert software (version 13) was employed. This approach screened the most influential parameters, such as normal stiffness, tangential stiffness, and particle bonding ratio. The objective of the optimization process was to minimize the discrepancy between the experimental and simulated maximum tensile failure forces by adjusting the aforementioned parameters. The error function used to assess the discrepancy was defined as the absolute difference between experimental and simulated tensile forces. The optimization aimed to reduce this error to below a predefined threshold of 5%, based on prior model validation. For optimization, each parameter was assigned a weight based on its sensitivity to the tensile force response. Parameters with a greater influence on the tensile force were assigned higher weights, reflecting their greater contribution to the overall model accuracy. The weight assignments were determined using a sensitivity analysis based on preliminary tests. The optimization process was considered complete once the relative error between the experimental and simulated tensile forces was reduced to below the 5% threshold. This threshold was chosen based on prior validation tests, which indicated that an error of less than 5% would ensure sufficient model accuracy for further analysis. [34,35]. Subsequently, BBD was employed for response surface analysis to explore the nonlinear relationships between the response variables and factors, allowing for the determination of optimal parameter values [36]. The optimal parameters for the HMBM simulation of wheat root systems during the regreening stage, at different diameters, were finally determined.
(1)
Plackett–Burman Design for the Root Bonding Model
The influencing factors for the bonding parameters were determined as Kn, Kt, Kn2, Kt2, φ, and Rr. The wheat root model parameters, listed in Table 4, were determined based on experimental results from Section 2.3 and Section 2.4, as well as references from wheat root system modeling studies [31,37,38]. The factors and levels for the PB test of the bonding parameters are presented in Table 5.
Table 4. Wheat root system parameters.
ParametersScopeSource
Poisson’s ratio0.30[38]
Density (kg⋅m−3)358.6Calibration
Elastic modulus (Pa)3.4 × 10⁹Calibration
Steel Density (kg·m−3)7865.0[31]
Steel Poisson’s ratio0.30[31,37]
Steel Shear modulus (Pa)7.9 × 10¹⁰[31,37]
Coefficient of restitution (Root to Soil)0.46Calibration
Coefficient of static friction (Root to Soil)0.22Calibration
Coefficient of rolling friction (Root to Soil)0.56Calibration
Coefficient of restitution (Root to Steel)0.36Calibration
Coefficient of static friction (Root to Steel)0.48Calibration
Coefficient of rolling friction (Root to Steel)0.32Calibration
Coefficient of restitution (Root to Root)0.42Calibration
Coefficient of static friction (Root to Root)0.53Calibration
Coefficient of rolling friction (Root to Root)0.33Calibration
Normal stiffness per unit area (N/m3)9.1 × 109~4.6 × 10¹⁰Demanding Calibration
Tangential stiffness per unit area (N/m3)2.4 × 109~8.6 × 10⁹Demanding Calibration
Critical normal stress (Pa)3.2 × 10⁶~9.1 × 10⁶Demanding Calibration
Critical tangential stress (Pa)8.0 × 10⁶~5.0 × 10⁷Demanding Calibration
Particle contact radius (mm)0.55~0.75Demanding Calibration
Bonded Disk Scale1.0~1.2Demanding Calibration
Time step (s)3.0 × 10⁻⁷-
Table 5. Plackett–Burman test factor coding table.
LevelKn (N/m3)Kt (N/m3)Kn2 (Pa)Kt2 (Pa)Rr (mm)φ
−19.1 × 1092.4 × 1093.2 × 1068 × 1060.551.0
+14.6 × 10108.6 × 1099.1 × 1065 × 1070.751.2
(2)
Box–Behnken Design for the Root Bonding Model
A response surface model was constructed using the significant factors obtained from the PB test as independent variables and the maximum tensile force as the response variable. Finally, a regression model was established to describe the significant bonding parameters influencing the wheat root system. The optimization module of Design-Expert software was used to calculate the optimal bonding parameters based on the regression model and experimental values.

2.6. DEM Modeling and Parameter Calibration of Soil

2.6.1. Geometric Modeling and JKR Contact Model of Soil

The Hertz–Mindlin with JKR contact model is applied to simulate materials where interparticle adhesion, caused by electrostatic forces and moisture, is significant, as seen in crop and soil systems [39,40]. The soil in the wheat cultivation area is classified as cohesive and compressible loam. The high moisture content at the contact points between soil particles and major root system components of winter wheat, including primary and crown roots, results in strong adhesive forces. These soil-encased roots, in turn, enhance the overall strength of the root–soil system through this adhesion [41]. In this study, the Hertz–Mindlin with JKR contact model within the DEM simulation framework was employed to replicate the soil’s stress–strain behavior.
Based on the experimental results from Section 2.4 and relevant literature, the key soil model parameters are listed in Table 6. The mass fractions of soil particles across different size ranges were assigned according to the average values measured in Section 2.2.1 for the actual soil samples. Considering both simulation accuracy and computational efficiency, spherical particles with diameters ranging from 1 to 5 mm were selected to represent soil particles in the model. This simplification was made for computational efficiency and is widely accepted in DEM simulations. Although real soil particles are irregular, the spherical model adequately captures bulk soil behaviors, including shear strength and angle of repose, making it sufficient for modeling root–soil interactions in this study [42].

2.6.2. Physical Measurement of Soil Angle of Repose

To verify the accuracy of soil model parameters under different moisture contents, the fixed-funnel method was employed to measure and compare the actual and simulated AOR values. Based on the soil conditions during the wheat regreening stage, three categories of soil samples were prepared with moisture contents of 9.0 ± 0.5%, 12.0 ± 0.5%, and 15.0 ± 0.5% for the physical AOR measurements.
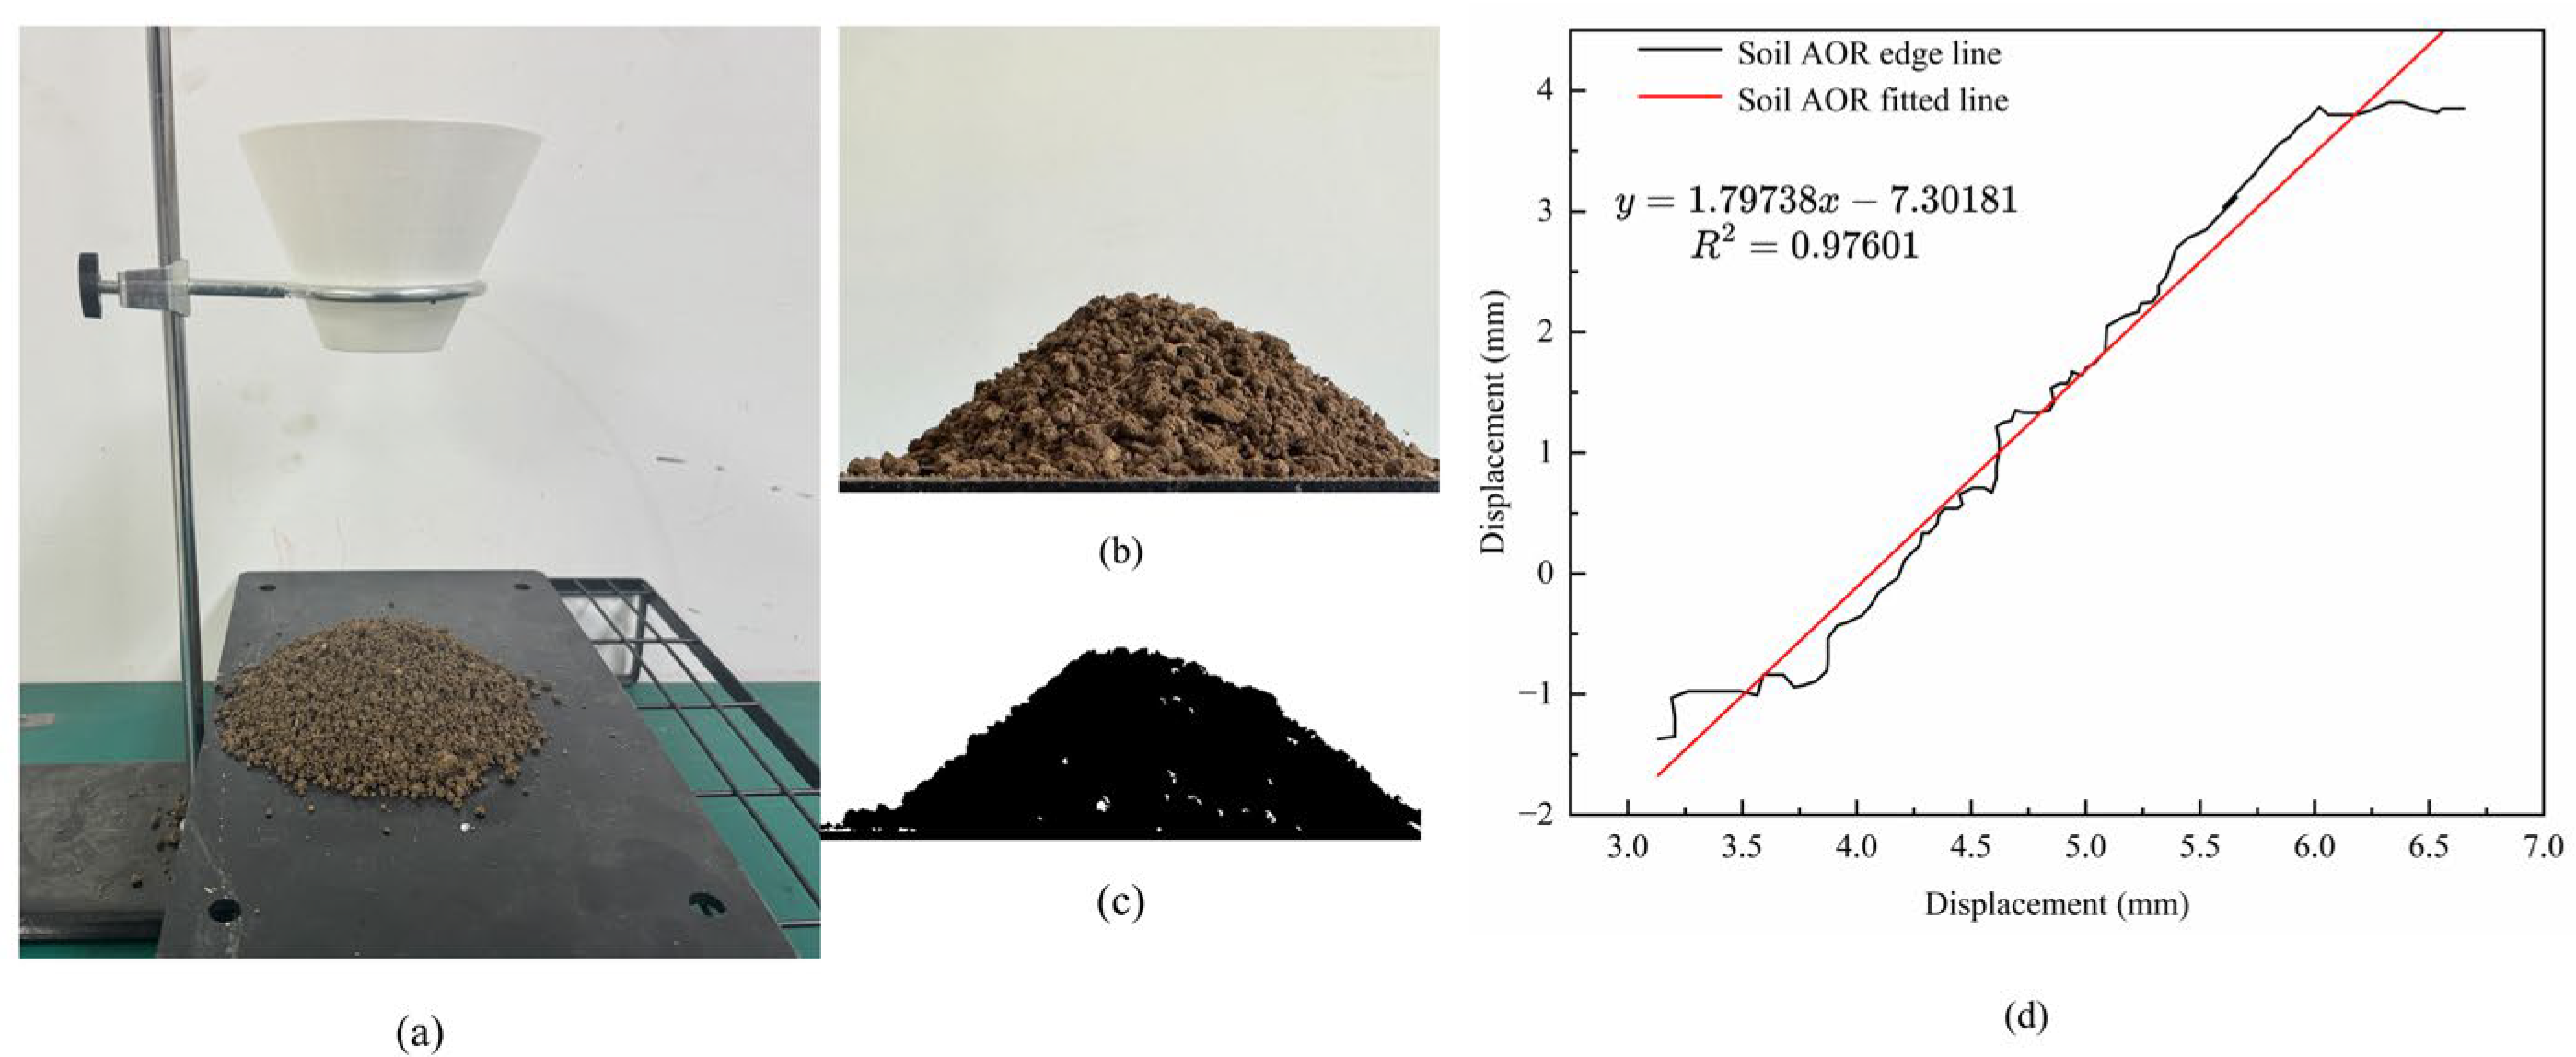
During each test, soil samples with the designated moisture content were poured into a funnel whose bottom opening was sealed with a baffle until the soil surface was flush with the funnel rim. The baffle was then quickly removed, allowing the soil to fall freely under gravity onto a metal tray and form a conical pile. Once the pile was stabilized, the angle between the slope surface and the horizontal plane was measured as the AOR (Figure 10a). For each moisture content, ten repetitions were conducted, and the average value was recorded as the AOR for that condition. The measured AOR values for the different moisture contents are presented in Figure 10b.
To enhance the measurement accuracy of AOR, an image-processing-assisted method was introduced. First, the soil pile images were binarized using MATLAB (version 2023a) to obtain binary AOR profiles (Figure 10c). These binarized images were then imported into Origin, where the pile contour coordinates were extracted using the image analysis tools. A linear fit was applied to the extracted boundary coordinates, and the slope of the fitted line was taken as the tangent of the AOR (Figure 10d).

2.6.3. Calibration of DEM Parameters for Soil Model

The AOR of soil serves as a comprehensive parameter characterizing its frictional properties and can directly influence the soil deformation behavior under the action of soil-engaging components in agricultural machinery. The AOR varies with soil moisture content [43]. Therefore, in this study, the DEM combined with Design-Expert software was employed to design experiments and determine the optimal soil model parameters for different moisture contents.
To obtain these parameters, soil pile-formation simulations were conducted in EDEM, as illustrated in Figure 11. First, a funnel model with dimensions identical to those used in the physical experiments was constructed in SolidWorks and imported into EDEM. A virtual plane positioned above the funnel served as a particle factory to dynamically generate soil particles (Figure 11a). During the simulation, particles fell freely under gravity through the funnel and accumulated on a horizontal baseplate to form a conical pile (Figure 11b). Once the particle system reached a stable state, the EDEM post-processing tool was used to measure the angles between the slope surface of the pile and the baseplate in four directions, and their average value was taken as the simulated AOR.
To analyze the influence of key contact parameters on soil cohesion and further optimize the consistency between the simulated and measured AOR values, a Box–BBD experiment was conducted using Design-Expert software. The factors selected for the BBD that affect soil model cohesion were: JKR surface energy (X1), Coefficient of restitution (X2), Coefficient of static friction (X3), and Coefficient of rolling friction (X4) [44]. The factors and their levels for the BBD experiment are presented in Table 7.

2.7. Validation of the Root–Soil Model Parameters

2.7.1. Comparative Validation of Physical and DEM Tests for Single-Root Pull-Out

To verify the accuracy of the calibrated root–soil interface contact parameters and to assess the effectiveness of the employed root–soil contact model in simulating root–soil interactions, a single-root pull-out test was conducted. The pull-out tests were performed using a universal electronic tensile testing machine (UTM, Mitutoyo Corporation, Kawasaki, Japan, Model WDW-01S), with a load capacity of 500 N and a precision of ±0.01 N.
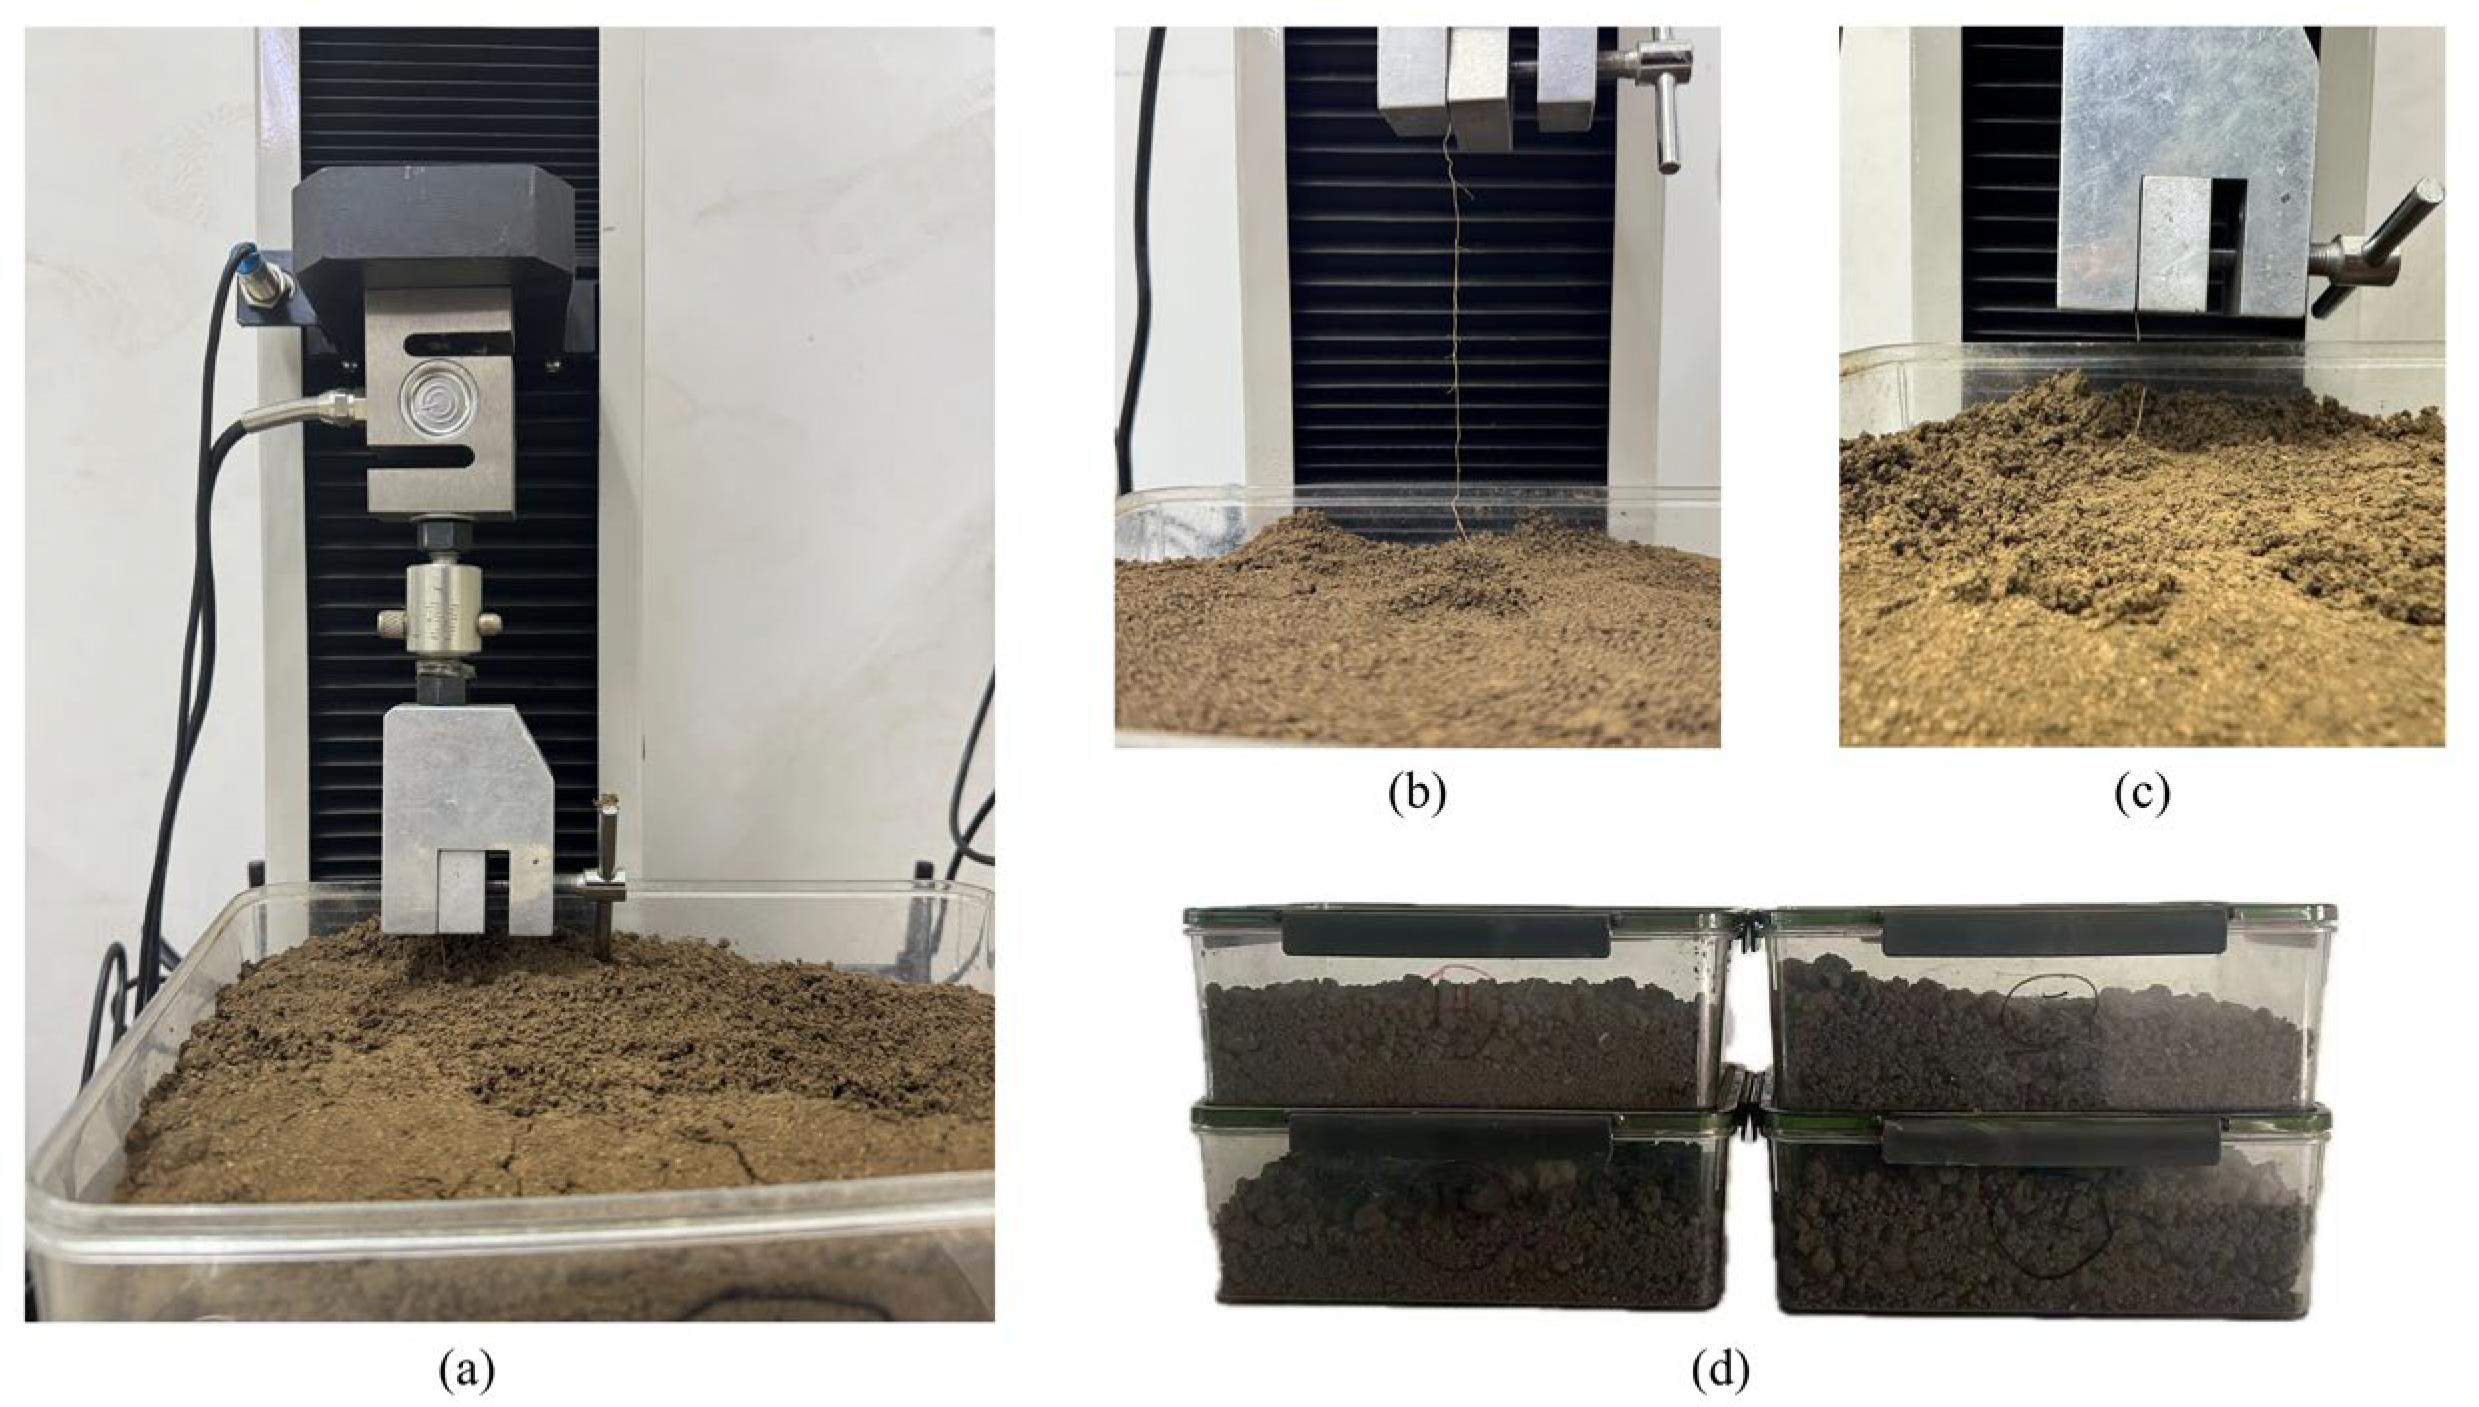
The soil moisture contents were determined based on typical field conditions during the winter wheat regreening stage, with values of 9 ± 0.5%, 12 ± 0.5%, and 15 ± 0.5% (Figure 12d). A single root segment was vertically embedded into the prepared soil samples, and the pull-out force required to extract the root was measured using the electronic tensile testing machine. To minimize boundary effects, relatively large containers were used for the pull-out tests. The distance between the root and the container wall was maintained at a minimum of 50 mm, which was deemed sufficient to mitigate any significant influence of the container walls on root–soil interactions during the tests. This arrangement was designed to prevent pile spreading near the walls and ensure that the measurements of root forces were as accurate and representative as possible. A schematic of the pull-out process and the completion of the test is presented in Figure 12. Five replicate tests were conducted at each moisture content level.
In the simulation tests, the JKR contact model was used to simulate the adhesive interactions between soil particles and the root model. Since root–soil adhesion is weaker than soil–soil adhesion, the root–soil interface surface energy was set to 70% of the soil–soil interface surface energy in the JKR model [45].
In the simulation tests, the embedding depth of the single root and the displacement velocity of the fixture were set to be identical to those in the physical experiments. The simulation procedure and results are presented in Figure 13. Upon completion of the simulation, the total contact force exerted on the fixture in the pull-out direction was extracted using the post-processing analysis module of the DEM simulation software. This force was defined as the simulated root pull-out force.

2.7.2. Comparative Validation of Experimental and DEM Root Pull-Out in Soil

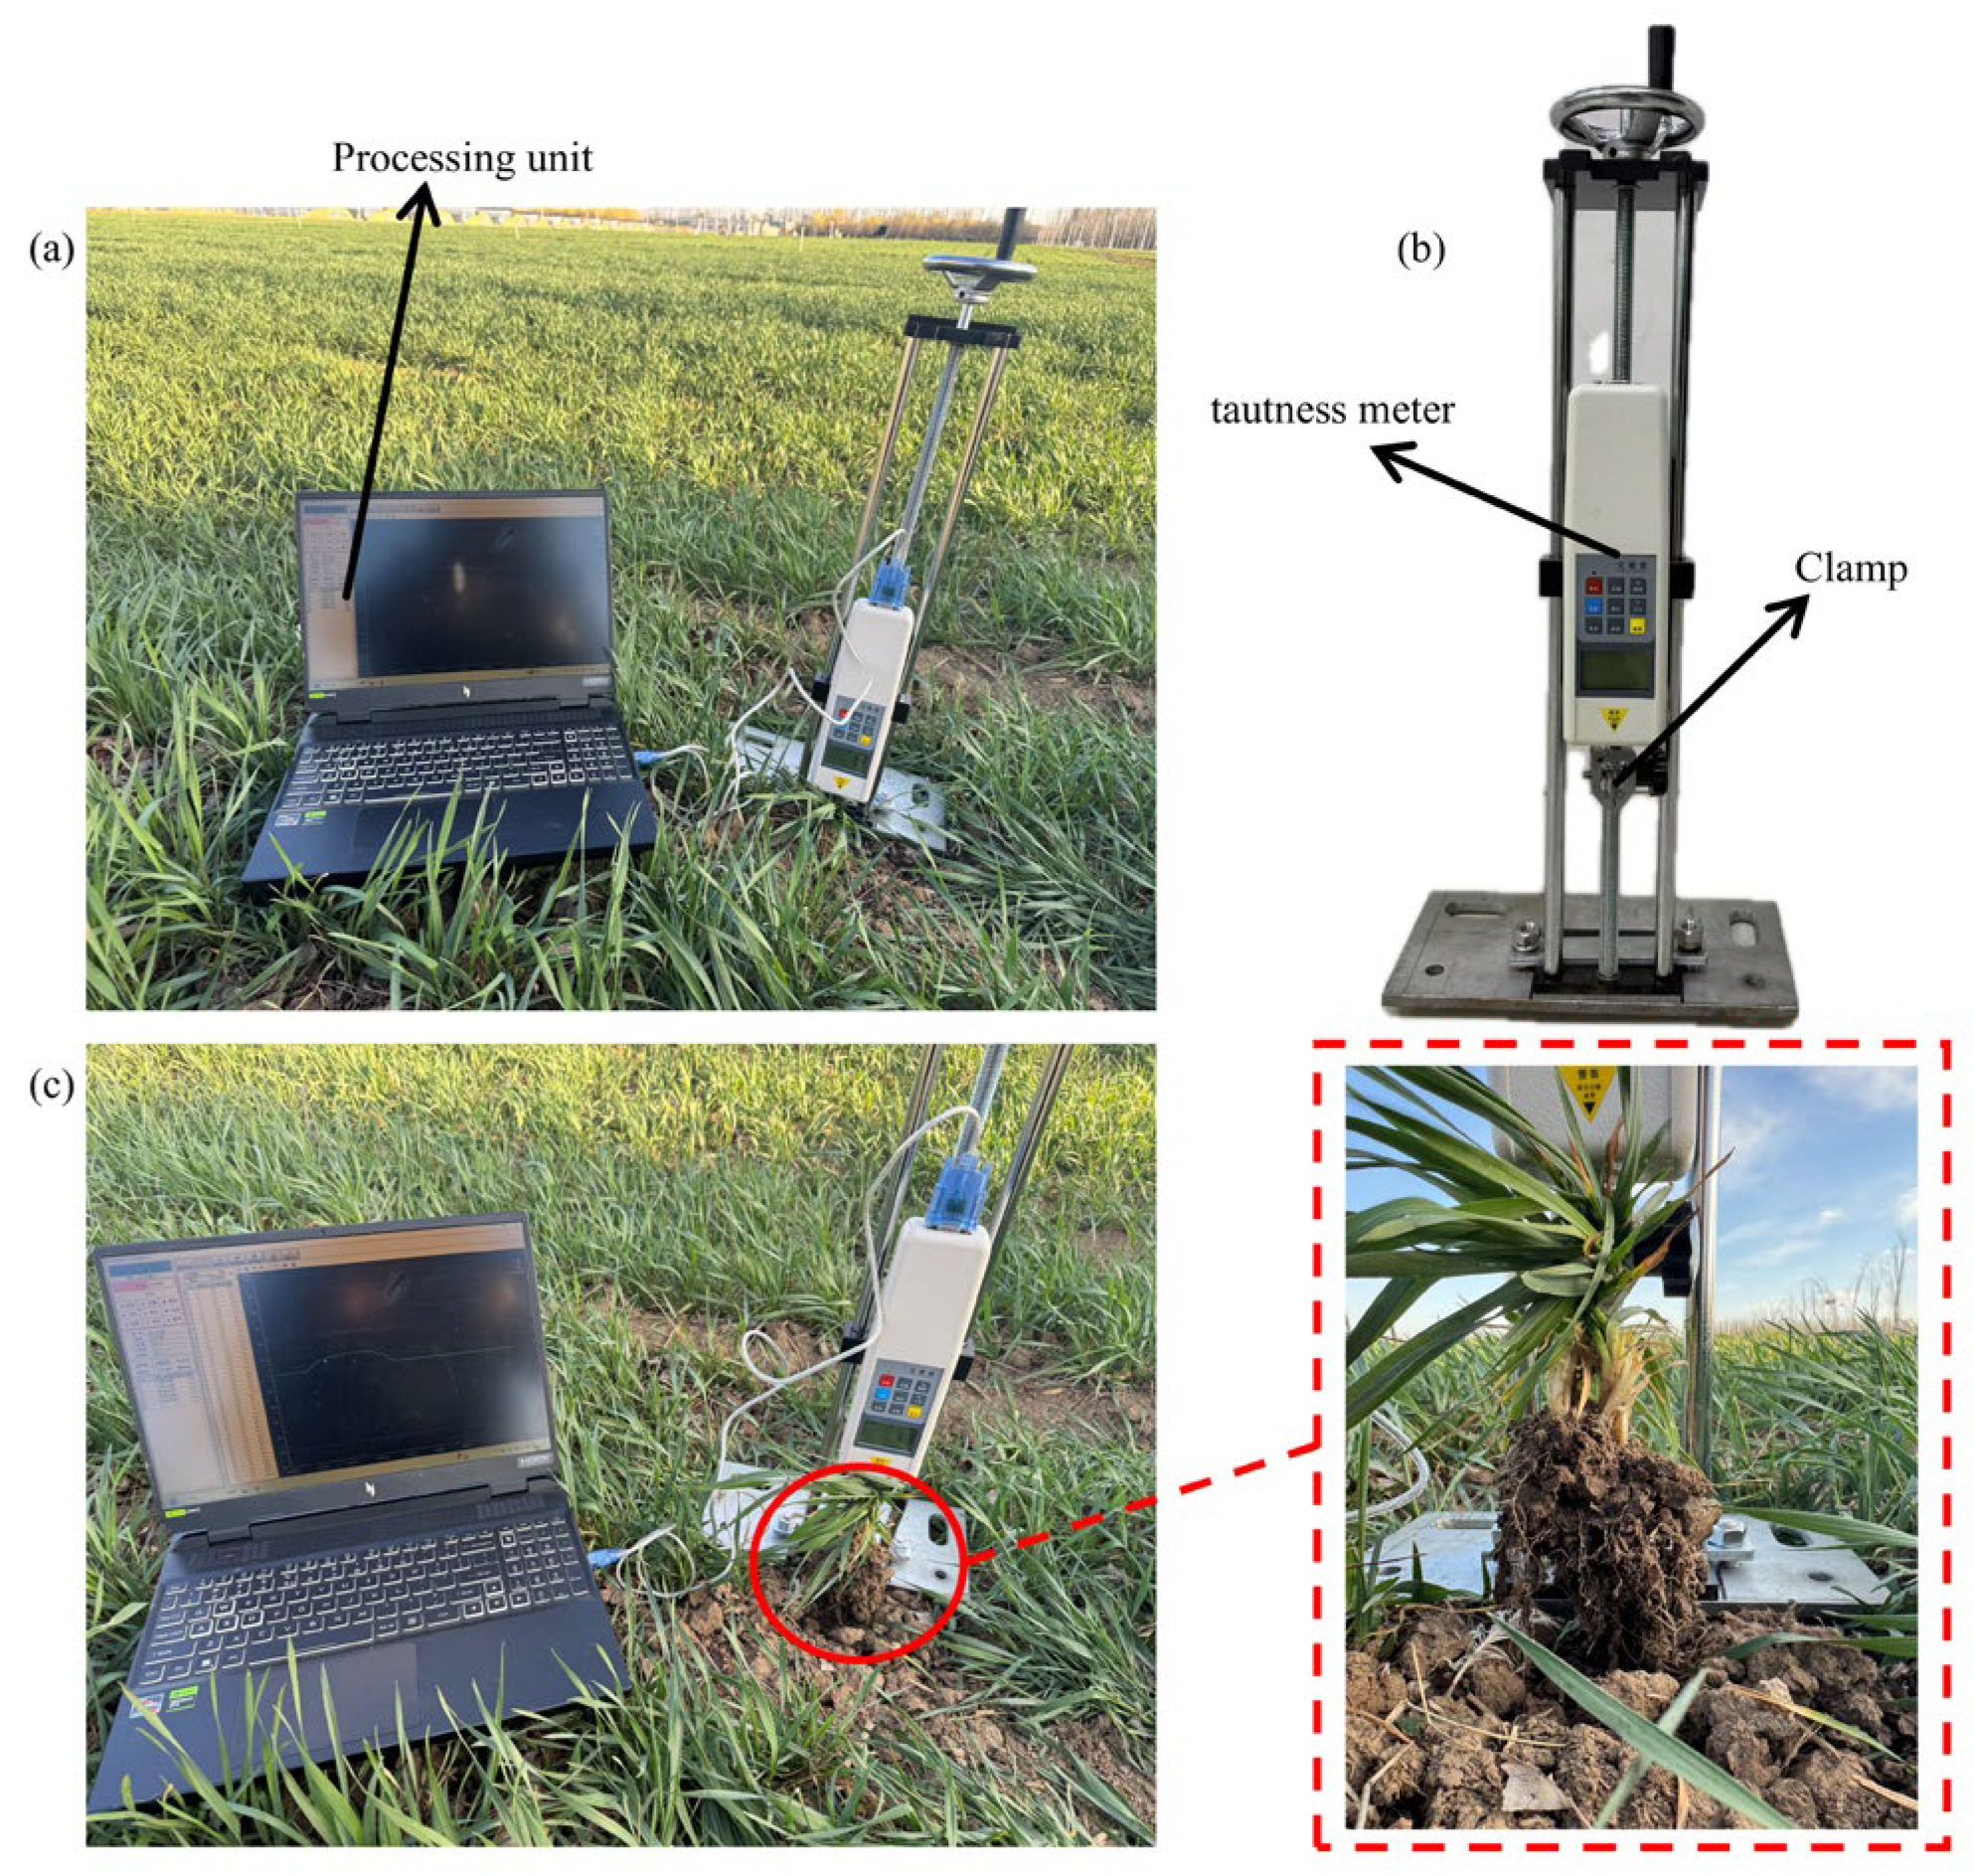
To validate the reliability of the model parameters, a comparative pull-out test was conducted between the measured values of actual wheat root systems in soil and the simulation results, to avoid excessive discrepancies between the simulated root–soil model and real-world data due to parameter inaccuracies, Pull-out tests on actual root systems in soil further validate the accuracy of root models and the universality of modeling methods [10,46]. The experiments were performed on 22 March 2025, under an average ambient temperature of 22 °C, at the National Precision Agriculture Research and Demonstration Base Wheat Experimental Field in Changping District, Beijing. Prior to testing, the average soil moisture content in the wheat root zone was measured at 12.53%. A custom-made pull-out testing system (Figure 14b) was used to conduct the tests under static environmental conditions, as presented in Figure 14. Each test was repeated five times, and the maximum pull-out force was recorded.
The simulated pull-out process of wheat root systems in soil is illustrated in Figure 15. Based on the geometric root model, in combination with the experimentally calibrated root–root contact parameters and the computed bonding coefficients, a flexible root–soil DEM model was developed. This model can effectively reproduce the bending deformation and fracture behavior of wheat root systems. Using the measured and calibrated contact parameters for soil–soil and root–soil interactions, along with adhesion-related parameters, a bonded JKR contact model was established to simulate the state of roots in soil during the regreening stage (Figure 15a). According to the measured soil moisture content during this stage, the soil bonding parameters were set to correspond to a moisture content of 12%. The simulated pull-out process of roots from soil is presented in Figure 15b,c. Use Equation (19) to calculate the critical time step for each simulation. The time step used for the DEM simulations was taken as a quarter of this critical Rayleigh time step. The simulation was performed with a time step of 2.63 × 10⁻⁸ [47].
d t r = π r ρ t G t 0.1631 v t + 0.8766
where Gt is the shear modulus, ρt is particle density, vt is Poisson’s ratio, and r is the radius of the smallest particle.

3. Results and Analysis

3.1. Results and Analysis of Single-Root Mechanical Tests

Based on the tensile and shear test results of wheat root systems at the regreening stage presented in Table 8, a comparative analysis was conducted with those of mature-stage wheat root systems. Previous studies on DEM modeling of mature wheat root systems [38] have indicated that, at maturity, wheat roots have ceased growth and possess slightly larger diameters than those at the regreening stage. Moreover, mature roots exhibit tissue senescence and lower moisture content, whereas regreening stage roots are in an active growth phase with higher moisture content. These physiological differences lead to distinct mechanical properties between the two growth stages. Such differences provide critical reference data for the DEM modeling of wheat root systems during the regreening stage.

3.2. Experimental Results and Analysis of Contact Parameters Based on the Angle of Repose for Wheat Root Systems

To validate the contact parameters of the wheat root model, AOR simulation tests were conducted. After each test, a post-processing tool was used to measure the slope angles of the four sides of the particle pile along two mutually perpendicular directions. The arithmetic mean of these measurements was taken as the final simulated AOR.
According to the relative error results between the physical and simulated AOR values presented in Table 9, the DEM model constructed based on the calibrated contact parameters was able to accurately predict the stacking behavior of wheat root particle segments. These results confirm the reliability and appropriateness of the calibrated contact parameters for wheat root systems.

3.3. Results and Analysis of Bonding Parameter Calibration for the Wheat Root Model

3.3.1. Results and Analysis of the Plackett–Burman Test

The design scheme and results of the PB test for the wheat root system bonding model parameters are presented in Table 10. To identify parameters with a significant effect on the maximum pull-out force, an analysis of variance (ANOVA) was conducted on the PB test results using Design-Expert software, as presented in Table 10. The results indicate that Kn2 had a highly significant effect on the maximum pull-out force (p < 0.01), while Kn and Kt had significant effects (p < 0.05). The effects of the remaining factors were not significant (p > 0.05). To minimize interference, the non-significant factors were set to their intermediate values. The PB test thus provided the basis for variable selection in the subsequent BBD test, ensuring that parameter calibration focused on the key factors exerting a decisive influence on the maximum pull-out force. Based on the results in Table 11, Kn, Kt, and Kn2 were selected for the BBD test to enable further calibration and optimization.

3.3.2. Results and Analysis of the Box–Behnken Test

To further investigate the interactive effects between the maximum tensile failure force of wheat roots and the parameters Kn, Kt, and Kn2, as well as to determine their optimal combination, a BBD was conducted based on the results of the PB test. In this design, Kn, Kt, and Kn2 were selected as independent variables, while the maximum tensile force experienced by a single root during the stretching process was used as the response variable. The factors and levels of the BBD test are presented in Table 12.
The results of the BBD test are presented in Table 13. Based on regression fitting analysis of the BBD data, a regression equation was derived with Kn, Kt, and Kn2, as presented in Equation (20).
y n = 5.58 + 1.12 x 1 x 2 + 3.13 x 3 + 0.5525 x 1 x 2 + 1.33 x 1 x 3 0.0375 x 2 x 3 0.312 x 1 2 + 1.32 x 2 2 + 0.633 x 3 2
where yn is the maximum tensile failure force of a single root.
The analysis of variance (ANOVA) for the BBD experimental results of the root bonding parameters, performed using Design-Expert software, is presented in Table 14. According to the ANOVA results in Table 14, the model’s p-value was found to be highly significant, while the lack-of-fit p-value was negligible. This indicates that the experimental design and the regression equation are well-fitted to the actual tensile behavior of individual roots. Consequently, Equation (20) can be considered a reliable tool for predicting and analyzing the optimal bonding parameters of wheat root systems.
Based on the ANOVA results from the Box–Behnken design (Table 14), the model demonstrates a strong fit, with R2 and Adjusted R2 values indicating good performance, and a p-value showing statistical significance. The significance analysis confirms that Kn and Kt have significant linear effects on the response variable. The quadratic term Kn2 had the most substantial effect. While significant interaction effects were observed for Kn and Kn2, significant quadratic effects were observed for Kt2. Notably, Kn2 had an extremely significant impact on the maximum tensile force, and Kn and Kt also exhibited significant effects. However, interactions such as KnKt and KtKn2, as well as some other quadratic terms, did not show significant effects on the response variable. Overall, the results indicate that the model successfully captures the relationship between the key parameters and the response variable, with no evidence of unaccounted factors influencing the response.

3.3.3. Optimization Results of Bonding Parameters

To further enhance the simulation accuracy of the wheat root bonding model, the regression model established in the previous section was employed in combination with the optimization module of Design-Expert software to perform parameter optimization. Using the maximum tensile failure force of root segments with different diameters obtained from physical experiments as the target value, a mathematical optimization model was constructed to determine the optimal bonding parameters of the wheat root model. The objective function and constraint conditions are presented in Equation (21), and the resulting optimal parameter sets for single-root bonding models of different diameters are presented in Table 15.
y n target 4.25 N 4.6 × 10 10 K n 1.2 × 10 11 N / m 3 2.4 × 10 9 K t 8.6 × 10 9 N / m 3 3.2 × 10 6 K n 2 9.1 × 10 6 p a

3.3.4. Results and Analysis of Bonding Parameter Validation

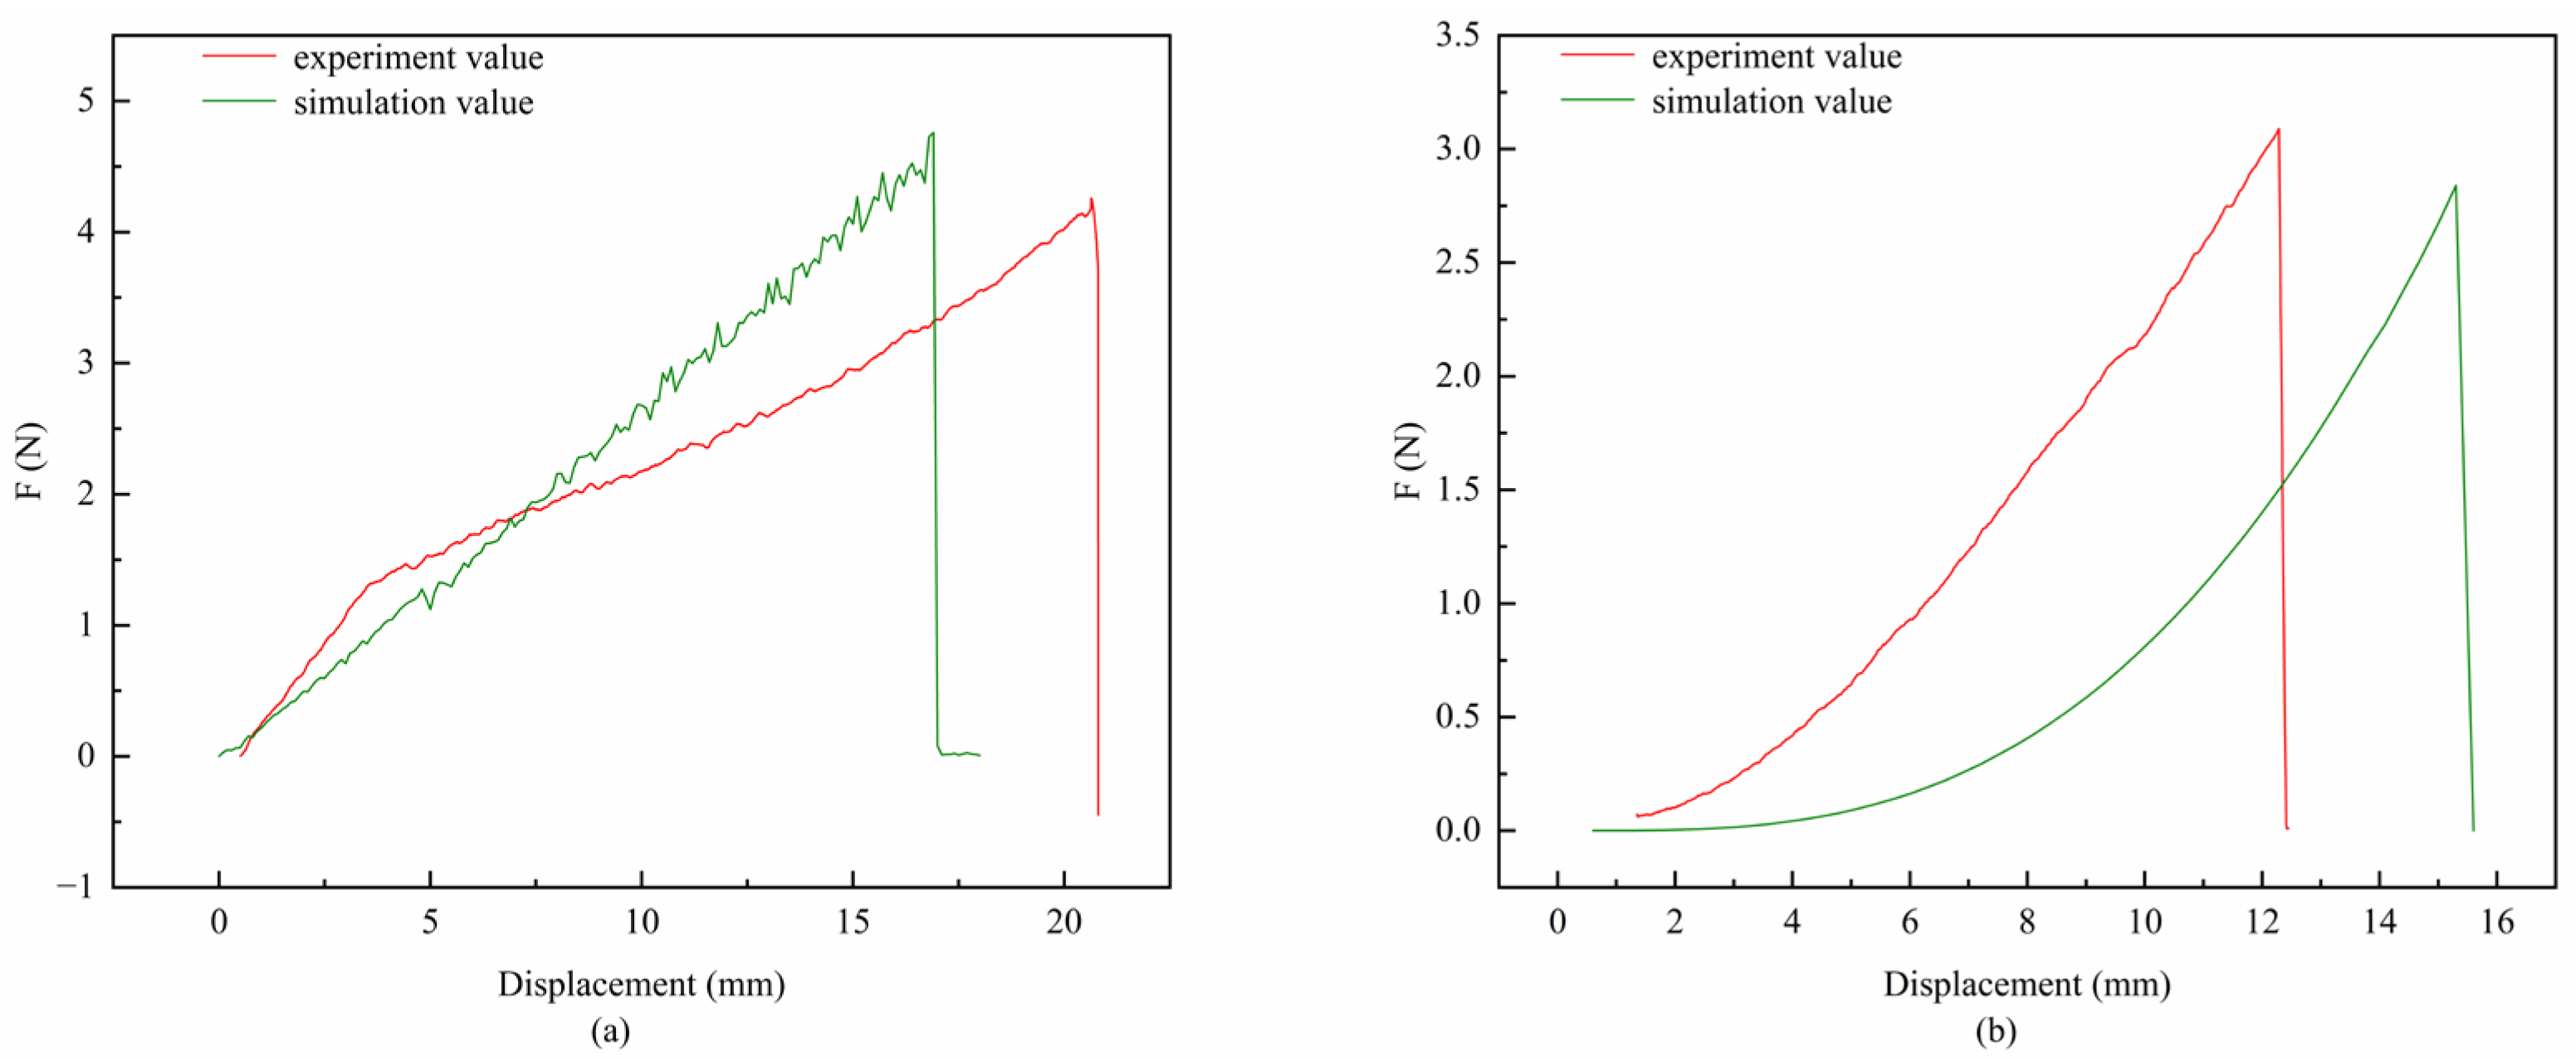
To verify the accuracy of the model parameters, tensile and shear simulation tests were conducted on individual wheat roots with a diameter of 1 mm, using the optimized bonding parameters of the wheat root model. The simulation results were compared with the maximum tensile and shear failure forces obtained from the physical tests described in Section 3.1. Figure 16a,b present the force–displacement response curves from the physical tensile test and DEM tensile simulation, as well as from the physical shear test and DEM shear simulation, respectively. The results present that the simulated curves closely match the experimental curves in both overall trend and peak failure force, demonstrating a good fit. The discrepancies between the simulated and measured maximum forces for the tensile and shear tests of 1 mm roots were both within 10%.
Significant differences were observed between the tensile and shear forces of wheat roots during the regreening stage and at maturity. Compared with reported results for mature wheat roots, those in the regreening stage required greater force to achieve tensile failure but exhibited relatively lower shear strength. This can be attributed to the higher moisture content, lower degree of lignification, and softer tissue structure of roots during the regreening stage, which collectively result in distinct mechanical properties compared with mature roots.

3.4. Results and Analysis of Soil Parameter Calibration

To enhance the accuracy of the DEM model in simulating soil piling behavior and to accurately characterize the internal friction properties of soil under different moisture contents, a BBD experiment was conducted using Design-Expert software to examine four factors influencing the soil AOR. The BBD results identified the optimal levels of the significant parameters (Table 16). Regression analysis of the BBD data yielded the regression Equation (22) for the significant influencing factors.
y a o r = 45.08 + 8.85 X 1 3.91 X 3 + 11.9 X 4 0.135 X 1 X 3 + 0.5175 X 1 X 4 + 0.0234 X 1 2 + 5.07 X 3 2 2.96 X 4 2
where yaor is the actual AOR.
ANOVA was performed on the BBD experimental results for the root bonding model parameters using Design-Expert software, and the results are presented in Table 17. As presented in Table 17, the model was highly significant, indicating that it can be reliably used to predict the soil AOR. Among the four experimental factors, X1, X2, and X3 exhibited extremely significant effects on the AOR. Using the Optimization module of Design-Expert, the measured AOR under different soil moisture contents was set as the optimization target. The optimal soil model parameter set, selected based on the minimum prediction error, is presented in Table 18.

3.5. Results and Analysis of Root–Soil Model Validation

3.5.1. Comparative Analysis of Single-Root Pull-Out Tests and DEM Simulation

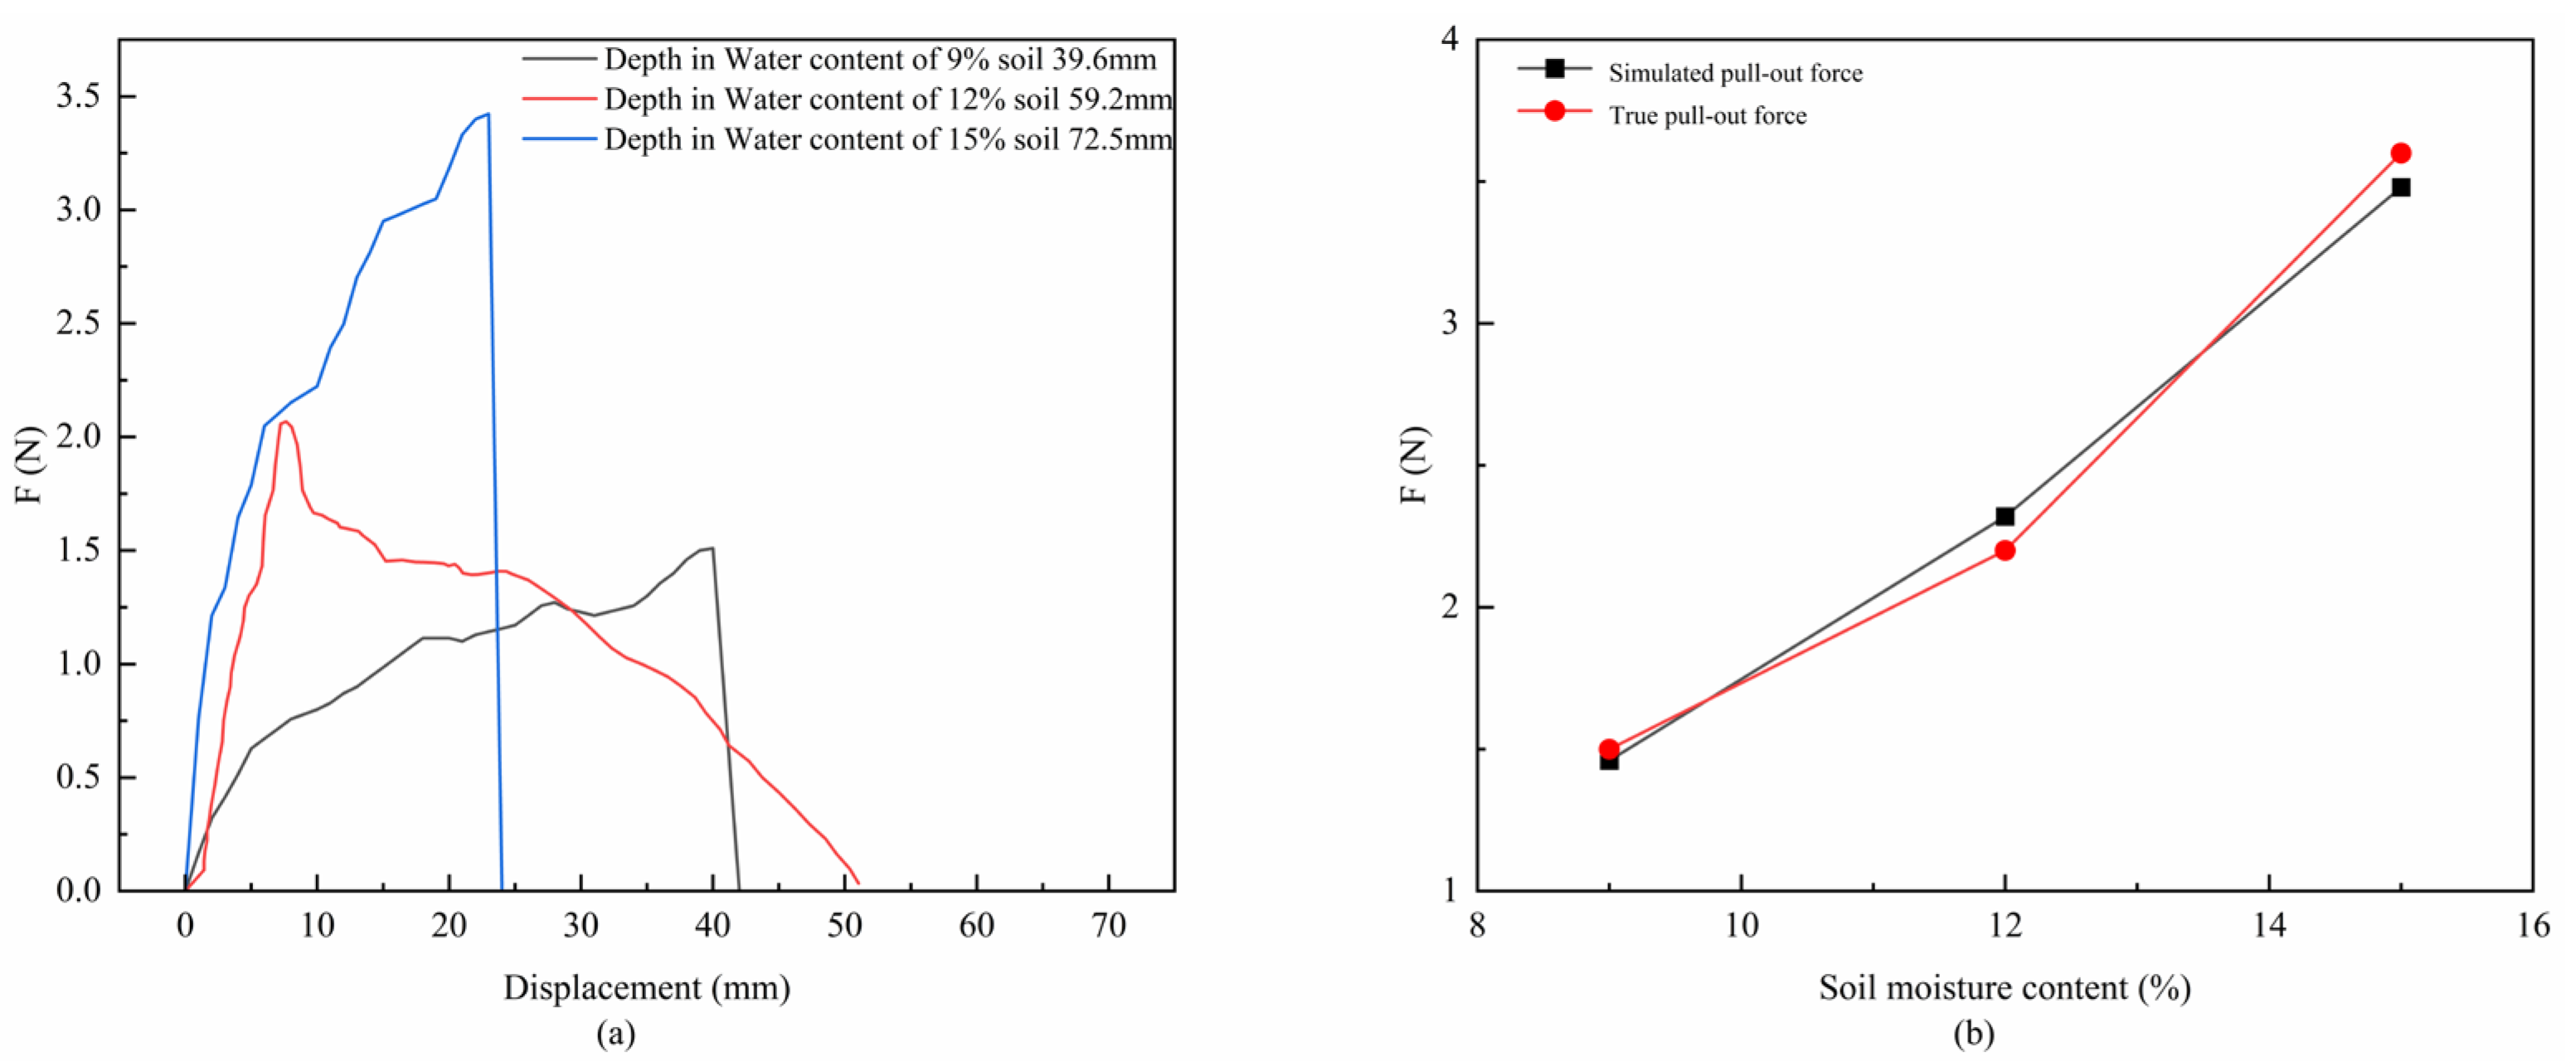
By processing the pull-out test data of single roots in soil, the relationship between displacement and pull-out force can be obtained. As presented in Figure 17, the displacement corresponding to root fracture during pull-out is relatively small, while the displacement required for complete extraction is larger.
Further analysis of Figure 15b and Figure 17a indicates that, under tensile loading, a single root gradually straightens and undergoes elastic deformation. As the tensile force increases, the static friction force at the root–soil interface simultaneously increases. When the pull-out force exceeds the maximum static friction, relative slip occurs between the root and the soil, marking the onset of the second stage of pull-out. At this stage, sliding friction develops at the root–soil interface. With increasing sliding displacement, the surrounding soil structure is progressively disrupted, the bonding effect between root and soil weakens, and the effective contact area decreases, leading to a gradual reduction in pull-out force.
As presented in Figure 15c and Figure 17a, the initial stage of fracture pull-out is consistent with that of complete extraction. However, in the second stage of fracture pull-out, when the deformation of the root reaches its limit, rupture occurs at a localized point, causing a sharp drop in pull-out force. This is mainly due to the increased overburden pressure from the upper soil layer as the embedding depth of the root increases. In addition, deeper soil layers typically exhibit higher density and greater compaction, resulting in stronger contact and adhesion between the root and soil. Moreover, within an appropriate moisture range, a moderate increase in soil water content enhances interparticle forces and effective stress, promoting closer contact at the root–soil interface. These combined factors increase the interfacial frictional resistance. Once the tensile force at a specific root segment exceeds its ultimate tensile strength, tensile fracture occurs, leading to a rapid decline in pull-out force.
The comparison between simulation and experimental results is presented in Figure 17b. The average maximum pull-out force of single roots in the simulation was found to be close to that observed in physical experiments. The relative error of the average maximum pull-out force was within 10%, indicating that the simulated adhesion among soil particles, as well as between soil and roots, was reasonably strong. This validates the accuracy of the measured and calibrated root–soil contact parameters and the bonding parameters of the root–soil model.

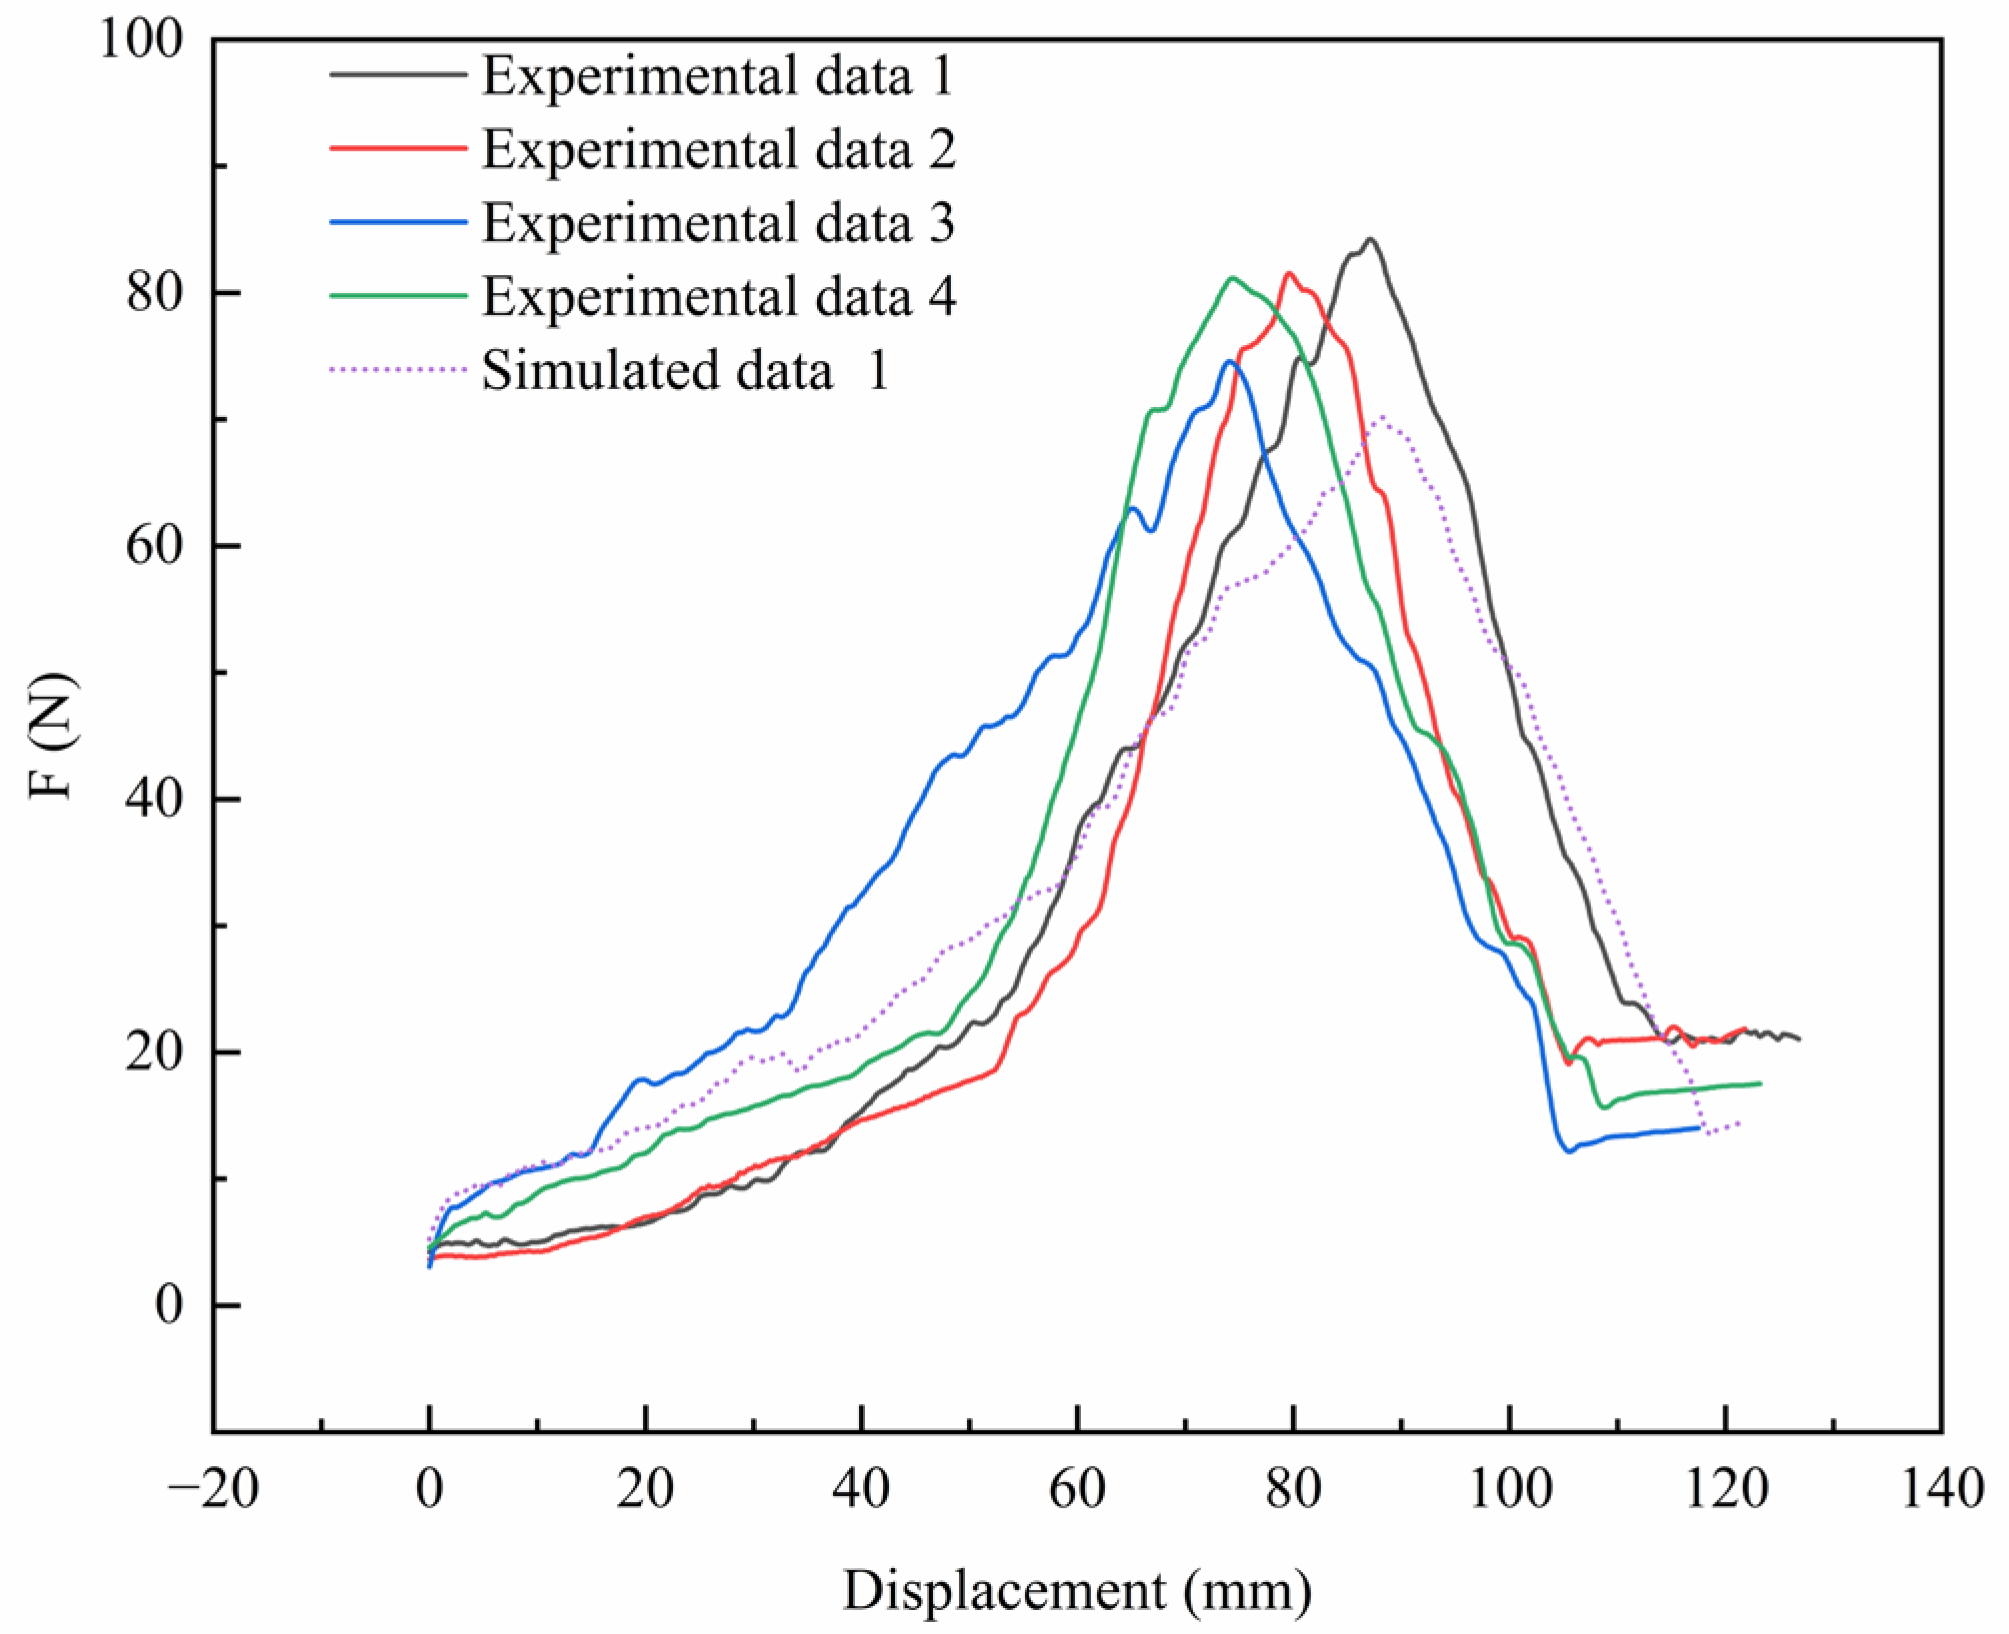
3.5.2. Comparative Analysis of Actual and Simulated Root System Pull-Out in Soil

The results of the actual root pull-out test and the simulation are presented in Figure 18. The variation trends of the maximum pull-out forces from both the actual and simulated tests are consistent. However, the simulated results are generally lower than the actual test results. This discrepancy arises because, in the simulation, the contact model used to simulate the soil–soil and root–soil interactions does not fully capture the real deformation and compaction of the soil, as well as the tight adhesion at the root–soil interface. Specifically, the JKR model does not account for physical phenomena such as plastic deformation caused by compression, which could affect the soil’s mechanical behavior under high compaction. Additionally, the model does not fully represent the variation in cohesion with changes in moisture content, which can significantly influence the bonding strength between the root and soil. These factors could lead to discrepancies between the simulated and real-world interactions, potentially affecting the predictive accuracy of the model. As a result, the model’s effective contact area is insufficient, leading to lower friction and cohesion values at the macro scale.
Additionally, to reduce model complexity, the simulation significantly simplified the wheat root system, neglecting the influence of lateral roots and root hairs.
Their presence could significantly influence the root–soil composite’s shear strength and pull-out resistance. Lateral roots and root hairs increase the contact area between the roots and the soil, which in turn increases friction and adhesion forces. A quantitative analysis suggests that including these structures could increase the pull-out force by 5–10%, improving the model’s prediction accuracy and better reflecting the complex root–soil interactions. The discrepancy between the simulated and actual pull-out forces may also stem from the use of spherical particles to model the soil. Spherical particles, while computationally efficient, do not capture the irregular shapes of real soil particles. This simplification can affect particle interlocking, friction, and shear behavior, which in turn influences the root–soil interaction. Non-spherical particles could more accurately represent the natural packing and shear properties of the soil, potentially leading to differences in the predicted pull-out resistance and contributing to the observed error between the simulation and real-world tests.
In summary, the simplifications in the simulation model regarding the contact model and root structure failed to fully replicate the complex root–soil interactions and adhesion observed in reality. Therefore, under the same conditions, pulling the root from the soil in the actual test requires greater force. The relative error between the actual test and simulation results is within 16%, confirming the accuracy of the wheat root model for the regreening stage.
Compared with recent DEM studies on wheat root–soil interaction [10,38], the overall trends of maximum pull-out force and root shear strength in this study are similar, although quantitative results differ, supporting the reliability of the parameters calibrated for regreening-stage wheat roots. Under similar soil moisture conditions, the maximum pull-out force measured here is lower than the 2.13 ± 0.12 N reported for roots with a burial depth of 63.2 mm, which may arise from morphological differences: the secondary roots in this study had a diameter of 1.0 ± 0.1 mm, whereas mature-stage roots reached approximately 1.4 mm and exhibited a higher degree of lignification. Likewise, the shear strength obtained in this study is lower than values reported for mature roots, likely due to differences in root diameter and moisture content. In terms of contact parameters, the static friction coefficient calibrated for regreening-stage roots is also lower, reflecting their higher moisture content and smoother surface. Overall, these comparisons indicate that while DEM models consistently capture the fundamental mechanics of root–soil interaction, developmental stage–related variations in root physical properties inevitably lead to quantitative differences, underscoring the need for stage-specific parameter calibration.
Several inherent DEM limitations may also explain the remaining differences between simulated and experimental pull-out forces. First, scale effects influence the mechanical response of the root–soil system: DEM outputs are sensitive to the ratio between particle size and structural dimensions. When soil particles become coarse relative to the root diameter, the effective contact area decreases, reducing frictional and bonding forces in the simulation. Second, simplifying the soil to spherical particles within a narrow size range (1–5 mm) improves computational efficiency but does not capture natural soil angularity, aggregation, or broad polydispersity. As a result, the simulated soil exhibits lower shear resistance and bonding strength than real soil. Third, computational constraints necessitated omitting lateral roots, root hairs, and micro-scale surface roughness, all of which substantially increase the real root–soil contact area. Excluding these features inevitably weakens the simulated bonding performance. Collectively, these factors explain the lower simulated pull-out forces despite consistent qualitative trends and highlight opportunities for future refinement through improved soil morphology, multi-scale modeling, and more detailed root architectural representation.

4. Conclusions

This study focuses on wheat plants during the regreening stage to develop an optimal DEM model and simulation parameters that reflect the structural characteristics of their root systems. The geometric morphology of the root system in soil was analyzed, which facilitated the development of both single-root and whole-plant root models. Model parameters for both the root system and soil were calibrated and validated through experiments and simulations.
  • Based on single-root tensile and shear mechanical tests, the maximum failure force of a single winter wheat root at the regreening stage was calculated, and the ultimate stress and elastic modulus were determined. Simultaneously, through root–steel–soil contact parameter measurement tests, the contact mechanical characteristics at the root–soil–steel interface were clarified, and the range of the contact parameters was determined.
  • Using the actual AOR as the target response variable, root segment AOR simulations were performed to validate the wheat root system contact parameters. Plackett–Burman simulation experiments based on single-root tensile tests indicated that the critical normal stress has a highly significant effect on the maximum tensile force, while the normal stiffness and tangential stiffness per unit area significantly affect the maximum tensile force. A Box–Behnken experimental design was utilized to optimize the regression model based on the experimental results, yielding the bonding parameters for the single root at different diameters.
  • Based on the experimentally measured range of soil model contact parameters and the factors influencing soil AOR, the actual AOR values were used as evaluation indicators. A Box–Behnken experimental design was conducted using Design-Expert software to construct and optimize a quadratic regression model for the key parameters influencing soil AOR. The optimal parameters for the soil model under varying moisture contents were determined.
  • Pull-out tests were conducted with single roots embedded in soil, along with pull-out tests and simulations of actual roots in soil. It was found that an increase in soil moisture content significantly enhanced the bonding performance between the wheat root system and soil, resulting in a greater pull-out force. The relative error in the maximum pull-out force between the experimental and simulation results was within 15%. These findings demonstrate the accuracy of the calibrated bonding model parameters for winter wheat roots at the regreening stage and the soil model parameters, and validate the effectiveness of the whole-plant root system model.
The results of this study provide an important reference for optimizing machinery used in root-pruning and topdressing operations during the regreening stage of winter wheat. By developing a discrete element model (DEM) for the root–soil interactions during this stage, this research lays the foundation for simulating and optimizing the mechanical structure of root-pruning tools. Specifically, the simulation model enables the optimization of cutting depth, geometric parameters, and operational speed of the root-pruning device, offering a clear visualization of the operation process. For topdressing machinery, the focus should be on ensuring even fertilizer distribution while minimizing soil disturbance. Future work could involve the development of multi-functional equipment that combines both root-pruning and topdressing capabilities, further enhancing operational efficiency and sustainability in agricultural production.

5. Future Work

Future work should extend the current DEM framework to overcome several identified limitations. First, the model was developed based on a single wheat variety; incorporating multiple cultivars with different root mechanical properties will enhance the generality of the calibrated parameters. Second, the soil was represented using spherical particles, which simplifies natural soil geometry. Introducing non-spherical or clumped particles in future studies will better capture realistic soil packing, friction, and shear behavior, thereby improving simulation accuracy. Additionally, all experiments were performed at a single field site. Conducting tests across different soil types and environmental conditions will help evaluate the robustness of the model and broaden its applicability.
Finally, the present model does not explicitly include lateral roots or root hairs, which contribute to friction and adhesion at the soil–root interface. Future research should incorporate more detailed root architecture to more accurately reflect the complexity of root–soil interactions and further refine predictions of pull-out resistance.

Author Contributions

Y.H.: Conceptualization, Methodology, Investigation, Data curation, Writing—original draft. L.L. (Lin Ling): Methodology, Formal analysis, Validation. B.Y.: Investigation, Data curation. R.L.: Software, Formal analysis. J.D.: Resources, Visualization. X.A.: Data curation, Validation. Y.Y.: Software, Writing—review and editing. Z.M.: Resources, Project administration. G.W.: Supervision, Funding acquisition, Writing—review and editing. L.L. (Liwei Li): Conceptualization, Supervision, Funding acquisition, Project administration. All authors have read and agreed to the published version of the manuscript. All authors have read and agreed to the published version of the manuscript.

Funding

The authors gratefully acknowledge the financial support provided by the National Agricultural Science and Technology Project (20221805), the Distinguished Scientist Team Program of Beijing Academy of Agriculture and Forestry Sciences (JKTD2025005), and the earmarked fund for CARS-03.

Institutional Review Board Statement

The study did not require ethical approval.

Data Availability Statement

The data presented in this study are available on request from the corresponding author. We have committed to providing all relevant data promptly upon the official publication of the article and ensuring that the data are accessible in accordance with the journal’s requirements. Thank you for your understanding and support. For further information about the data, please contact Yalei Han at 18039949282@163.com.

Acknowledgments

The authors would like to thank the anonymous reviewers for their constructive comments, which helped improve the quality of this paper.

Conflicts of Interest

The authors declare no conflicts of interest.

References

  1. Rezaei, E.E.; Webber, H.; Asseng, S.; Boote, K.; Durand, J.L.; Ewert, F.; Martre, P.; MacCarthy, D.S. Climate change impacts on crop yields. Nat. Rev. Earth Environ. 2023, 4, 831–846. [Google Scholar] [CrossRef]
  2. Lindblom, J.; Lundström, C.; Ljung, M.; Jonsson, A. Promoting sustainable intensification in precision agriculture: Review of decision support systems development and strategies. Precis. Agric. 2016, 18, 309–331. [Google Scholar] [CrossRef]
  3. Hu, C.; Sadras, V.O.; Lu, G.; Zhang, R.; Yang, X.; Zhang, S. Root pruning enhances wheat yield, harvest index and water-use efficiency in semiarid area. Field Crops Res. 2019, 230, 62–71. [Google Scholar] [CrossRef]
  4. Li, Q.; Dong, B.; Qiao, Y.; Liu, M.; Zhang, J. Root growth, available soil water, and water-use efficiency of winter wheat under different irrigation regimes applied at different growth stages in North China. Agric. Water Manag. 2010, 97, 1676–1682. [Google Scholar] [CrossRef]
  5. Ma, S.-C.; Xu, B.-C.; Huang, Z.-B.; Liu, L.; Zhang, X.-H.; Liu, W.-Z.; Li, F.-M. Effects of Partial Root Excision at the Re-Greening Stage of Winter Wheat on Root/Shoot Ratio, Yield and Water Use Efficiency in Loess Plateau Region, China. Chin. J. Plant Ecol. 2006, 30, 976–982. [Google Scholar] [CrossRef]
  6. Quist, J.; Evertsson, C.M. Cone crusher modelling and simulation using DEM. Miner. Eng. 2016, 85, 92–105. [Google Scholar] [CrossRef]
  7. Kodicherla, S.P.K. Discrete element modelling of granular materials incorporating realistic particle shapes. Int. J. Geo-Eng. 2023, 14, 15. [Google Scholar] [CrossRef]
  8. Karpman, E.; Kövecses, J.; Holz, D.; Skonieczny, K. Discrete element modelling for wheel-soil interaction and the analysis of the effect of gravity. J. Terramech. 2020, 91, 139–153. [Google Scholar] [CrossRef]
  9. Zhou, J.; Sun, W.; Liang, Z.-a. Construction of Discrete Element Flexible Model for Jerusalem Artichoke Root-Tuber at Harvest Stage. Trans. Chin. Soc. Agric. Mach. 2023, 54, 124–132. [Google Scholar] [CrossRef]
  10. Zhao, J.; Yu, J.; Sun, K.; Wang, Y.; Liang, L.; Sun, Y.; Zhou, L.; Yu, Y. A discrete element method model and experimental verification for wheat root systems. Biosyst. Eng. 2024, 244, 146–165. [Google Scholar] [CrossRef]
  11. Zhang, S.; Zhao, H.; Wang, X.; Dong, J.; Zhao, P.; Yang, F.; Chen, X.; Liu, F.; Huang, Y. Discrete element modeling and shear properties of the maize stubble-soil complex. Comput. Electron. Agric. 2023, 204, 107519. [Google Scholar] [CrossRef]
  12. Liu, Y.; Zhao, J.; Yin, B.; Ma, Z.; Hao, J.; Yang, X.; Feng, X.; Ma, Y. Discrete element modelling of the yam root–soil complex and its verification. Biosyst. Eng. 2022, 220, 55–72. [Google Scholar] [CrossRef]
  13. Ma, X.; Xie, J.; Yu, Z.; Su, Q.; Liu, W.; Zhao, D.; Zhang, J. Discrete element method simulation of corn root residue excavation for structural design and performance optimization. Smart Agric. Technol. 2025, 12, 101229. [Google Scholar] [CrossRef]
  14. Zhang, Z.; Xue, H.; Wang, Y.; Xie, K.; Deng, Y. Design and Experiment of Panax notoginseng Bionic Excavating Shovel Based on EDEM. Trans. Chin. Soc. Agric. Mach. 2022, 53, 100–111. [Google Scholar] [CrossRef]
  15. Adajar, J.B.; Alfaro, M.; Chen, Y.; Zeng, Z. Calibration of discrete element parameters of crop residues and their interfaces with soil. Comput. Electron. Agric. 2021, 188, 106349. [Google Scholar] [CrossRef]
  16. Cheng, J.; Zheng, K.; Xia, J.; Liu, G.; Jiang, L.; Li, D. Analysis of Adhesion between Wet Clay Soil and Rotary Tillage Part in Paddy Field Based on Discrete Element Method. Processes 2021, 9, 845. [Google Scholar] [CrossRef]
  17. Zhang, X.; Liu, Y.; Zhang, Z.; Liang, Q.; Wang, G. Soil moisture influences wheat yield by affecting root growth and the composition of microbial communities under drip fertigation. Agric. Water Manag. 2024, 305, 109102. [Google Scholar] [CrossRef]
  18. Zhang, S.; Zhang, C.; Jiang, R.; Jiang, J. Lignin addition enhances soil aggregate structure and root growth to promote shear strength of loess in China. Plant Soil 2025. [Google Scholar] [CrossRef]
  19. Xue, Q.; Zhu, Z.; Musick, J.T.; Stewart, B.A.; Dusek, D.A. Root growth and water uptake in winter wheat under deficit irrigation. Plant Soil 2003, 257, 151–161. [Google Scholar] [CrossRef]
  20. Fu, J.; Zhou, S.; Han, Y.; Guo, F.; Teng, Z.; Yang, J.; Yang, X.; He, D. Relationships Between Spatiotemporal Distribution of Root Main Morphological and Quantitative Traits and Contents of Soil Available Nutrients in Wheat (Triticum aestivum L.). J. Nucl. Agric. Sci. 2023, 37, 626–637. [Google Scholar] [CrossRef]
  21. Lin, J.; Huang, M.; Zhang, L.; Chen, Y.; Shi, Y.; Xu, Y.; Lin, J.; Huang, Y.; Jiang, F. Effects of Dicranopteris dichotoma Roots on Soil Shear Strength of Red Soil Layer in Benggang. J. Soil Water Conserv. 2020, 34, 159–165. [Google Scholar] [CrossRef]
  22. Han, D.; Tang, C.; Liu, B.; Li, W.; Wang, Y.; Xu, L. Hierarchical model acquisition and parameter calibration of the corncob based on the discrete element method. Adv. Powder Technol. 2025, 36, 104932. [Google Scholar] [CrossRef]
  23. Shi, Y.; Jiang, Y.; Wang, X.; Thuy, N.T.D.; Yu, H. A mechanical model of single wheat straw with failure characteristics based on discrete element method. Biosyst. Eng. 2023, 230, 1–15. [Google Scholar] [CrossRef]
  24. Zhang, C.-B.; Chen, L.-H.; Jiang, J. Why fine tree roots are stronger than thicker roots: The role of cellulose and lignin in relation to slope stability. Geomorphology 2014, 206, 196–202. [Google Scholar] [CrossRef]
  25. Li, P.; Pan, G.; Chen, L.; Zhang, S.; Zhang, R. Research on discrete element construction and parameter calibration of agglomerated particles in moist-mix shotcrete. Adv. Powder Technol. 2025, 36, 104971. [Google Scholar] [CrossRef]
  26. Schwarz, M.; Cohen, D.; Or, D. Root-soil mechanical interactions during pullout and failure of root bundles. J. Geophys. Res. Earth Surf. 2010, 115, F04035. [Google Scholar] [CrossRef]
  27. Yue, Y.; Xing, R.; Baikeli, Y.; Xu, H.; Ma, W.; Guo, L. Systematic Calibration and Validation of Discrete Element Model Parameters for Cotton Root Systems. Agriculture 2025, 15, 1827. [Google Scholar] [CrossRef]
  28. Sadrmanesh, V.; Chen, Y. Simulation of tensile behavior of plant fibers using the Discrete Element Method (DEM). Compos. Part A 2018, 114, 196–203. [Google Scholar] [CrossRef]
  29. Zhang, G.; Chen, L.; Liu, H.; Dong, Z.; Zhang, Q.; Zhou, Y. Calibration and experiments of the discrete element simulation parameters for water chestnut. Trans. Chin. Soc. Agric. Eng. 2022, 38, 41–50. [Google Scholar] [CrossRef]
  30. Shen, S.; Zhang, J.; Jiang, Y.; Wang, Y.; Liu, X.; Li, J.; Dong, W. Tensile Properties of Residual Film in Tillage Layer Based on Discrete Element Method. Trans. Chin. Soc. Agric. Mach. 2024, 55, 132–141. [Google Scholar] [CrossRef]
  31. Song, Z.; Li, H.; Yan, Y.; Tian, F.; Li, Y.; Li, F. Calibration Method of Contact Characteristic Parameters of Soil in Mulberry Field Based on Unequal-diameter Particles DEM Theory. Trans. Chin. Soc. Agric. Mach. 2022, 53, 21–33. [Google Scholar] [CrossRef]
  32. Schnepf, A.; Leitner, D.; Landl, M.; Lobet, G.; Mai, T.H.; Morandage, S.; Sheng, C.; Zörner, M.; Vanderborght, J.; Vereecken, H. CRootBox: A structural–functional modelling framework for root systems. Ann. Bot. 2018, 121, 1033–1053. [Google Scholar] [CrossRef] [PubMed]
  33. Shi, Y.; Wen, G.; Lu, L.; He, X. Calibration and verification of DEM parameters for particles in transfer chute from rapid flow to stable accumulation. Adv. Powder Technol. 2023, 34, 104237. [Google Scholar] [CrossRef]
  34. Zhao, Z.; Wu, M.; Xie, S.; Luo, H.; Li, P.; Zeng, Y.; Jiang, X. Parameter calibration for the discrete element simulation of soil-preceding rice stubble and its rotary tillage trajectory. Trans. Chin. Soc. Agric. Eng. 2024, 40, 72–82. [Google Scholar] [CrossRef]
  35. Ma, Y.; Song, C.; Xuan, C.; Wang, H.; Yang, S.; Wu, P. Parameters calibration of discrete element model for alfalfa straw compression simulation. Trans. Chin. Soc. Agric. Eng. 2020, 36, 22–30. [Google Scholar] [CrossRef]
  36. Li, Y.; Chen, Y.; Sun, X.; Lin, H.; He, J. Parameter calibration of the breakable flexible fiber model for maize stovers with different moisture contents. Trans. Chin. Soc. Agric. Eng. 2025, 41, 43–52. [Google Scholar] [CrossRef]
  37. Zhou, H.; Che, H.; Geng, D.; Chen, M.; Zhang, Y. Discrete Element Modeling and Parameter Calibration of Typical Soil in Maize Field Tillage Layer. Trans. Chin. Soc. Agric. Mach. 2023, 54, 49–60. [Google Scholar] [CrossRef]
  38. Zhao, J.; Yu, J.; Sun, K.; Sun, Y.; Wang, Y.; Liang, L.; Yu, Y. Modeling and verifying wheat roots using AgriDEM. Trans. Chin. Soc. Agric. Eng. 2025, 41, 63–72. [Google Scholar] [CrossRef]
  39. Xiang, W.; Wu, M.; Lü, J.; Quan, W.; Ma, L.; Liu, J. Calibration of simulation physical parameters of clay loam based on soil accumulation test. Trans. Chin. Soc. Agric. Eng. 2019, 35, 116–123. [Google Scholar] [CrossRef]
  40. Washino, K.; Chan, E.L.; Faroux, D.; Tsuji, T.; Takahashi, T.; Sasabe, S. On DEM simulation of loose packing behaviour of fine and cohesive particles. Adv. Powder Technol. 2025, 36, 104809. [Google Scholar] [CrossRef]
  41. Jia, X.; Zheng, X.; Chen, L.; Liu, C.; Song, J.; Zhu, C.; Xu, J.; Hao, S. Discrete element flexible modeling and experimental verification of rice blanket seedling root blanket. Comput. Electron. Agric. 2025, 233, 110155. [Google Scholar] [CrossRef]
  42. Shaikh, S.A.; Li, Y.; Ma, Z.; Chandio, F.A.; Tunio, M.H.; Liang, Z.; Solangi, K.A. Discrete element method (DEM) simulation of single grouser shoe-soil interaction at varied moisture contents. Comput. Electron. Agric. 2021, 191, 106538. [Google Scholar] [CrossRef]
  43. Wang, X.; Zhong, X.; Geng, Y.; Wei, Z.; Hu, H.; Geng, D.; Zhang, X. Construction and parameter calibration of the nonlinear elastoplastic discrete element model for no-tillage soil compaction. Trans. Chin. Soc. Agric. Eng. 2021, 37, 100–107. [Google Scholar] [CrossRef]
  44. Wu, T.; Huang, W.; Chen, X.; Ma, X.; Han, Z.; Pan, T. Calibration of discrete element model parameters for cohesive soil considering the cohesion between particles. J. South China Agric. Univ. 2017, 38, 93–98. [Google Scholar] [CrossRef]
  45. De Baets, S.; Denbigh, T.D.G.; Smyth, K.M.; Eldridge, B.M.; Weldon, L.; Higgins, B.; Matyjaszkiewicz, A.; Meersmans, J.; Larson, E.R.; Chenchiah, I.V.; et al. Micro-scale interactions between Arabidopsis root hairs and soil particles influence soil erosion. Commun. Biol. 2020, 3, 164. [Google Scholar] [CrossRef] [PubMed]
  46. Loades, K.W.; Bengough, A.G.; Bransby, M.F.; Hallett, P.D. Planting density influence on fibrous root reinforcement of soils. Ecol. Eng. 2010, 36, 276–284. [Google Scholar] [CrossRef]
  47. Rackl, M.; Hanley, K.J. A methodical calibration procedure for discrete element models. Powder Technol. 2017, 307, 73–83. [Google Scholar] [CrossRef]
Figure 1. Roots of wheat plant: (a) Wheat root system geometry; (b) Distribution of wheat root systems in the soil. Note: h is the depth of roots in the soil, mm; α is the angle of roots in the soil, °.
Agriculture 15 02427 g001
Figure 2. Experimental setups for single-root mechanical tests: (a) Tensile test. (b) Shear test.
Agriculture 15 02427 g002
Figure 3. Measurement setups for contact parameters: (a) Test bench for coefficient of static friction, (b) Test bench for coefficient of rolling friction, (c) Test bench for coefficient of restitution, (d) Material plate.
Agriculture 15 02427 g003
Figure 4. Schematic diagram of the bonding model.
Agriculture 15 02427 g004
Figure 5. DEM models of the wheat root system: (a) Whole-plant root system model, (b) 150 mm single root model.
Agriculture 15 02427 g005
Figure 6. Single-root segment models: (a) Root segment of 4 mm, (b) Root segment of 8 mm, (c) Root segment of 10 mm.
Agriculture 15 02427 g006
Figure 7. Validation of angle of repose test; n = 10, units: degrees. (a) Experimental angle of repose. (b) Simulated angle of repose.
Agriculture 15 02427 g007
Figure 8. Comparison of experimental and simulated results for single-root tensile behavior, n = 10, units: N: (a) single-root tensioning begins, (b) single-root tension simulation starts, (c) single-root tensile fractures, (d) single-root tensile simulation fractures.
Agriculture 15 02427 g008
Figure 9. Comparison of Shear Tests on a 150-mm Individual Root, n = 10, units: N. (a) Shear Test, (b) Shear Simulation Test.
Agriculture 15 02427 g009
Figure 10. Measurement of soil accumulation angle; n = 10, units: degrees. (a) Measurement of soil accumulation angle. (b) Edge profile of soil accumulation. (c) Binarization of soil accumulation. (d) Edge fitting to determine the angle of repose.
Agriculture 15 02427 g010
Figure 11. Simulation-based optimization results for the AOR, n = 10, units: degrees: (a) Verification process of soil model parameters, (b) Verification results.
Agriculture 15 02427 g011
Figure 12. Pull-out test of a single root buried in soil, n = 5, units: N, % for water content: (a) Pull-out process of a single root, (b) Complete pull-out, (c) Root tensile failure, (d) Soil under different water contents.
Agriculture 15 02427 g012
Figure 13. Simulation test of pull-out of a single root buried in soil: (a) Initiation of root pull-out, (b) Complete root pull-out, (c) Root pull-out failure. Green: Single wheat root; Blue arrow: Pulling direction; Gray particles: Soil grains; Gray solid: Fixture.
Agriculture 15 02427 g013
Figure 14. Pulling test of the actual root system in soil: (a) Pull-out test of wheat root system in soil, (b) Root tensile testing system, (c) Complete root system pull-out.
Agriculture 15 02427 g014
Figure 15. Simulation study of root system pull-out in soil: (a) Wheat root-soil complex, (b) Upward pulling, (c) Bonding state of soil and root after complete extraction. Note: the blue arrow indicates the pulling direction, the green structure represents the wheat root system, and the gray mass represents the soil.
Agriculture 15 02427 g015
Figure 16. Tensile and shear analysis of a single root through physical and simulation tests: (a) Tensile analysis, (b) Shear analysis.
Agriculture 15 02427 g016
Figure 17. Single root pull-out analysis: (a) Force–displacement curves of actual single root pull-out tests under different soil moisture contents, (b) Comparison of actual and simulated average maximum pull-out force for a single root under different soil water contents.
Agriculture 15 02427 g017
Figure 18. Analysis of root system pull-out simulation results in soil.
Agriculture 15 02427 g018
Table 1. Parameters for modeling the root system of winter wheat.
ClassDiameter/mmNumberDepth in Soil/mmAngle in Soil/°
Primary root0.8 ± 0.14.0 ± 1168.8 ± 20.0 ± 5
Secondary root1.0 ± 0.115.0 ± 1112.8 ± 245.0 ± 1
Table 2. Soil particle size ratio.
Particle size distribution>9 mm9–5 mm5–3 mm3–1 mm<1 mm
Ratio8.5%13.9%18.6%50.3%8.7%
Table 3. Basic physical properties of wheat roots and soil.
TargetsDensity (kg/m3)Moisture Content (%)
Root358.6 ± 1.046.2 ± 0.5
Soil2750.0 ± 1.09.0 ± 0.5~15.0 ± 0.5
Table 6. Soil and steel simulation parameters.
ParametersScopeSource
Soil Density (kg·m−3)2.75 × 10³Calibration
Soil Poisson’s ratio0.38[37]
Soil Shear modulus (Pa)1.15 × 10⁷[31,37]
Coefficient of restitution (Soil to Soil)0.1–0.5Demanding Calibration
Coefficient of static friction (Soil to Soil)0.2~0.7Demanding Calibration
Coefficient of rolling friction (Soil to Soil)0.1~0.4Demanding Calibration
Coefficient of restitution (Soil to steel)0.33[31]
Coefficient of static friction (Soil to steel)0.47Calibration
Coefficient of rolling friction (Soil to steel)0.26Calibration
Surface energy coefficients (J·m−2)0.25~1.5Demanding Calibration
Table 7. Simulation test factors and levels for soil accumulation angle.
LevelSurface
Energy Coefficients (J/m2) X1
Coefficient of Restitution
X2
Coefficient of Static Friction
X3
Coefficient of Rolling Friction
X4
−10.250.10.20.1
00.8750.30.450.25
11.50.50.70.4
Table 8. Ultimate stress and modulus of elasticity of single roots of different diameters.
Diameter/mmTensile Ultimate
Stress/kPa
Shear Ultimate
Stress/kPa
Elastic
Modulus/kPa
0.85.85 × 1034.28 × 1034.4 × 105
16.41 × 1035.6 × 1037.7 × 105
Table 9. Comparison of Physical Angle of Repose and Simulated Angle of Repose for Wheat Root Segments.
MeasurementPhysical AOR (°)Simulated AOR (°)Relative Error (%)
First 41.939.36.62
Second 44.342.54.24
Third 40.138.83.35
Fourth 44.841.77.43
Fifth 39.736.78.17
Mean (n = 5)42.239.86.03
Table 10. Plackett–Burman tensile test results.
KnKtKn2Kt2RrφMaximum Tension/N
+1+1−1−1−1−13.18
+1+1−1+1+1−13.15
+1+1+1−1−1+111.15
−1+1+1+1−1+16.82
+1−1−1−1+1+13.15
−1−1−1−1−1+11.62
−1+1+1−1+1−15.93
+1−1+1+1−1−16.87
−1+1−1+1+1+13.46
−1−1+1−1+1−13.86
+1−1+1+1+1+16.92
−1−1−1+1−1−11.62
Table 11. Significance analysis of the results of the Plackett–Burman test for root bonding parameters.
SourceSum of SquaresdfMean SquareF-Valuep-ValueR2Adjusted R2
Model79.63613.2711.440.00860.93210.8506
Kn10.29110.298.870.0309
Kt7.7617.766.690.0491
Kn253.64153.6446.230.0010
Kt20.000210.00020.00020.9898
Rr1.9111.911.650.2555
φ6.0416.045.200.0715
Note: (p < 0.01) indicates that the item is highly significant, (p < 0.05) indicates that the item is significant. The same applies below.
Table 12. Box–Behnken test factor coding table.
LevelKn (N/m3)Kt (N/m3)Kn2 (Pa)
−14.6 × 10102.4 × 1093.20 × 106
08.3 × 10105.5 × 1096.15 × 106
+11.2 × 10118.6 × 1099.10 × 106
Table 13. Box–Behnken test results.
Serial
Number
KnKtKn2Fn/N
1−1−106.86
2+1−107.49
3−1+104.58
4+1+107.42
5−10−12.78
6+10−12.88
7−10+16.28
8+10+111.68
90−1−15.73
100+1−12.98
110−1+112.16
120+1+19.26
130006.36
140004.99
150004.32
160004.83
170007.42
Table 14. Box–Behnken test ANOVA results.
SourceSum of SquaresdfMean SquareF-Valuep-ValueR2Adjusted R2
Model114.04912.6710.570.00260.93150.8434
Kn10.06110.068.390.0231
Kt8.0018.006.6380.0363
Kn278.19178.1965.24<0.0001
KnKt1.2211.221.020.3464
KnKn27.0217.025.860.0461
Kt Kn20.005610.00560.00470.9473
Kn2 20.409910.40990.34200.5770
Kt 27.2917.296.080.0431
Kn2 21.6911.691.410.2741
Residual8.3971.2
Lack of Fit1.9030.63250.38970.7676
Pure Error6.4941.62
Cor Total122.4316
Table 15. Parameters of the wheat root bonding model.
Diameter/mmKn (N/m3)Kt (N/m3)Kn2 (Pa)Kt 2(Pa)Rr (mm)φ
0.84.73 × 10106.05 × 1093.52 × 1062.9 × 1070.651.1
1.06.15 × 10108.55 × 1095.04 × 1062.9 × 1070.651.1
Table 16. Experimental design and results of the Box–Behnken simulation of soil accumulation angle.
Serial
Number
X1X2X3X4AOR (°)
1−1−10064.34
2+1−10052.36
3−1+10034.76
4+1+10056.70
500−1−160.40
600+1−149.30
700−1+147.30
800+1+135.80
9−100−156.17
10+100−136.03
11−100+137.13
12+100+141.74
130−1−1046.24
140+1−1028.33
150−1+1039.03
160+1+1051.47
17−10−1059.37
18+10−1041.93
19−10+1033.58
20+10+1032.04
210−10−165.90
220+10−153.42
230−10+133.73
240+10+143.63
25000026.76
26000052.06
27000047.71
28000044.01
29000061.67
Table 17. Analysis of Variance for Box–Behnken Experiment.
SourceSum of SquaresdfMean SquareF-Valuep-ValueR2Adjusted R2
Model3207.2314299.0913.6<0.00010.93150.8630
X1939.521939.5255.78<0.0001
X218.83118.831.120.3083
X3183.31183.310.880.0053
X41698.6111698.61100.84<0.0001
X1X214.33114.330.85050.3720
X1X30.072910.07290.00430.9485
X1X41.0711.070.06360.8046
X2X323.62123.621.40.2561
X2X40.324910.324960.01930.8915
X3X427.25127.251.620.2241
X121.1411.140.06790.7982
X2228.43128.431.690.2149
X32194.071194.0711.520.0044
X4242.81142.812.540.1332
Residual235.821416.84
Lack of Fit215.781021.584.310.0860
Pure Error20.0345.01
Cor Total3443.0428
Table 18. Calibration results for soil parameters.
Soil Moisture
Content/%
Surface
Energy
Coefficient of Static FrictionCoefficient of Static FrictionCoefficient of Rolling Friction
9.0 ± 0.50.670.540.540.11
12.0 ± 0.50.980.330.330.18
15.0 ± 0.51.320.360.400.21
Disclaimer/Publisher’s Note: The statements, opinions and data contained in all publications are solely those of the individual author(s) and contributor(s) and not of MDPI and/or the editor(s). MDPI and/or the editor(s) disclaim responsibility for any injury to people or property resulting from any ideas, methods, instructions or products referred to in the content.