Figure 1.
Roots of wheat plant: (a) Wheat root system geometry; (b) Distribution of wheat root systems in the soil. Note: h is the depth of roots in the soil, mm; α is the angle of roots in the soil, °.
Figure 1.
Roots of wheat plant: (a) Wheat root system geometry; (b) Distribution of wheat root systems in the soil. Note: h is the depth of roots in the soil, mm; α is the angle of roots in the soil, °.
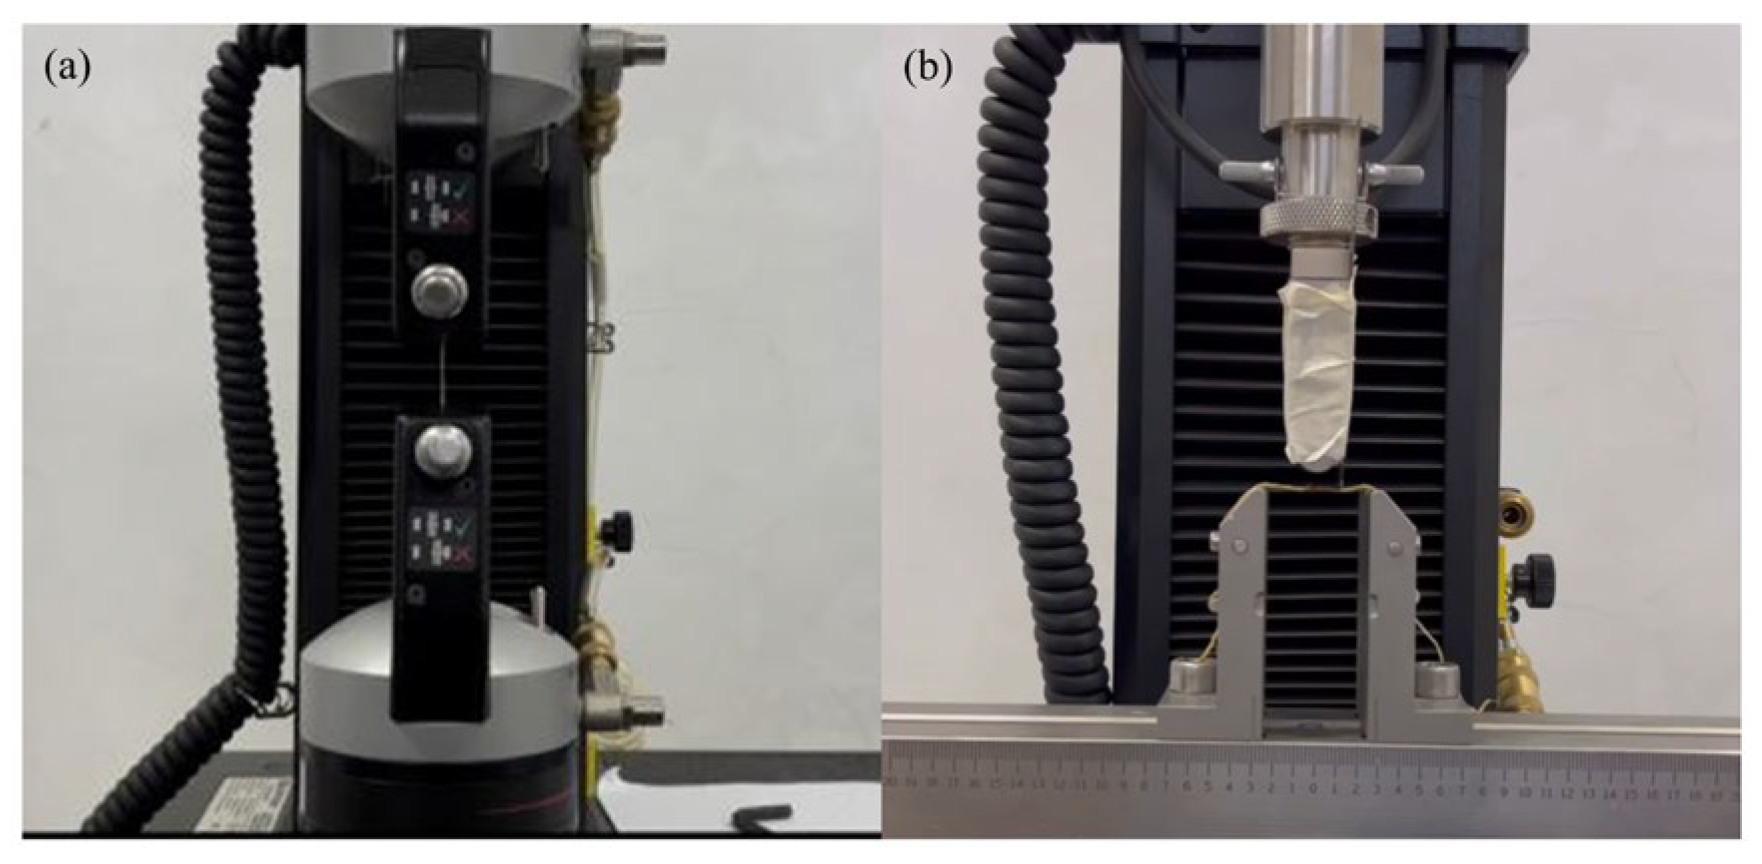
Figure 2.
Experimental setups for single-root mechanical tests: (a) Tensile test. (b) Shear test.
Figure 2.
Experimental setups for single-root mechanical tests: (a) Tensile test. (b) Shear test.
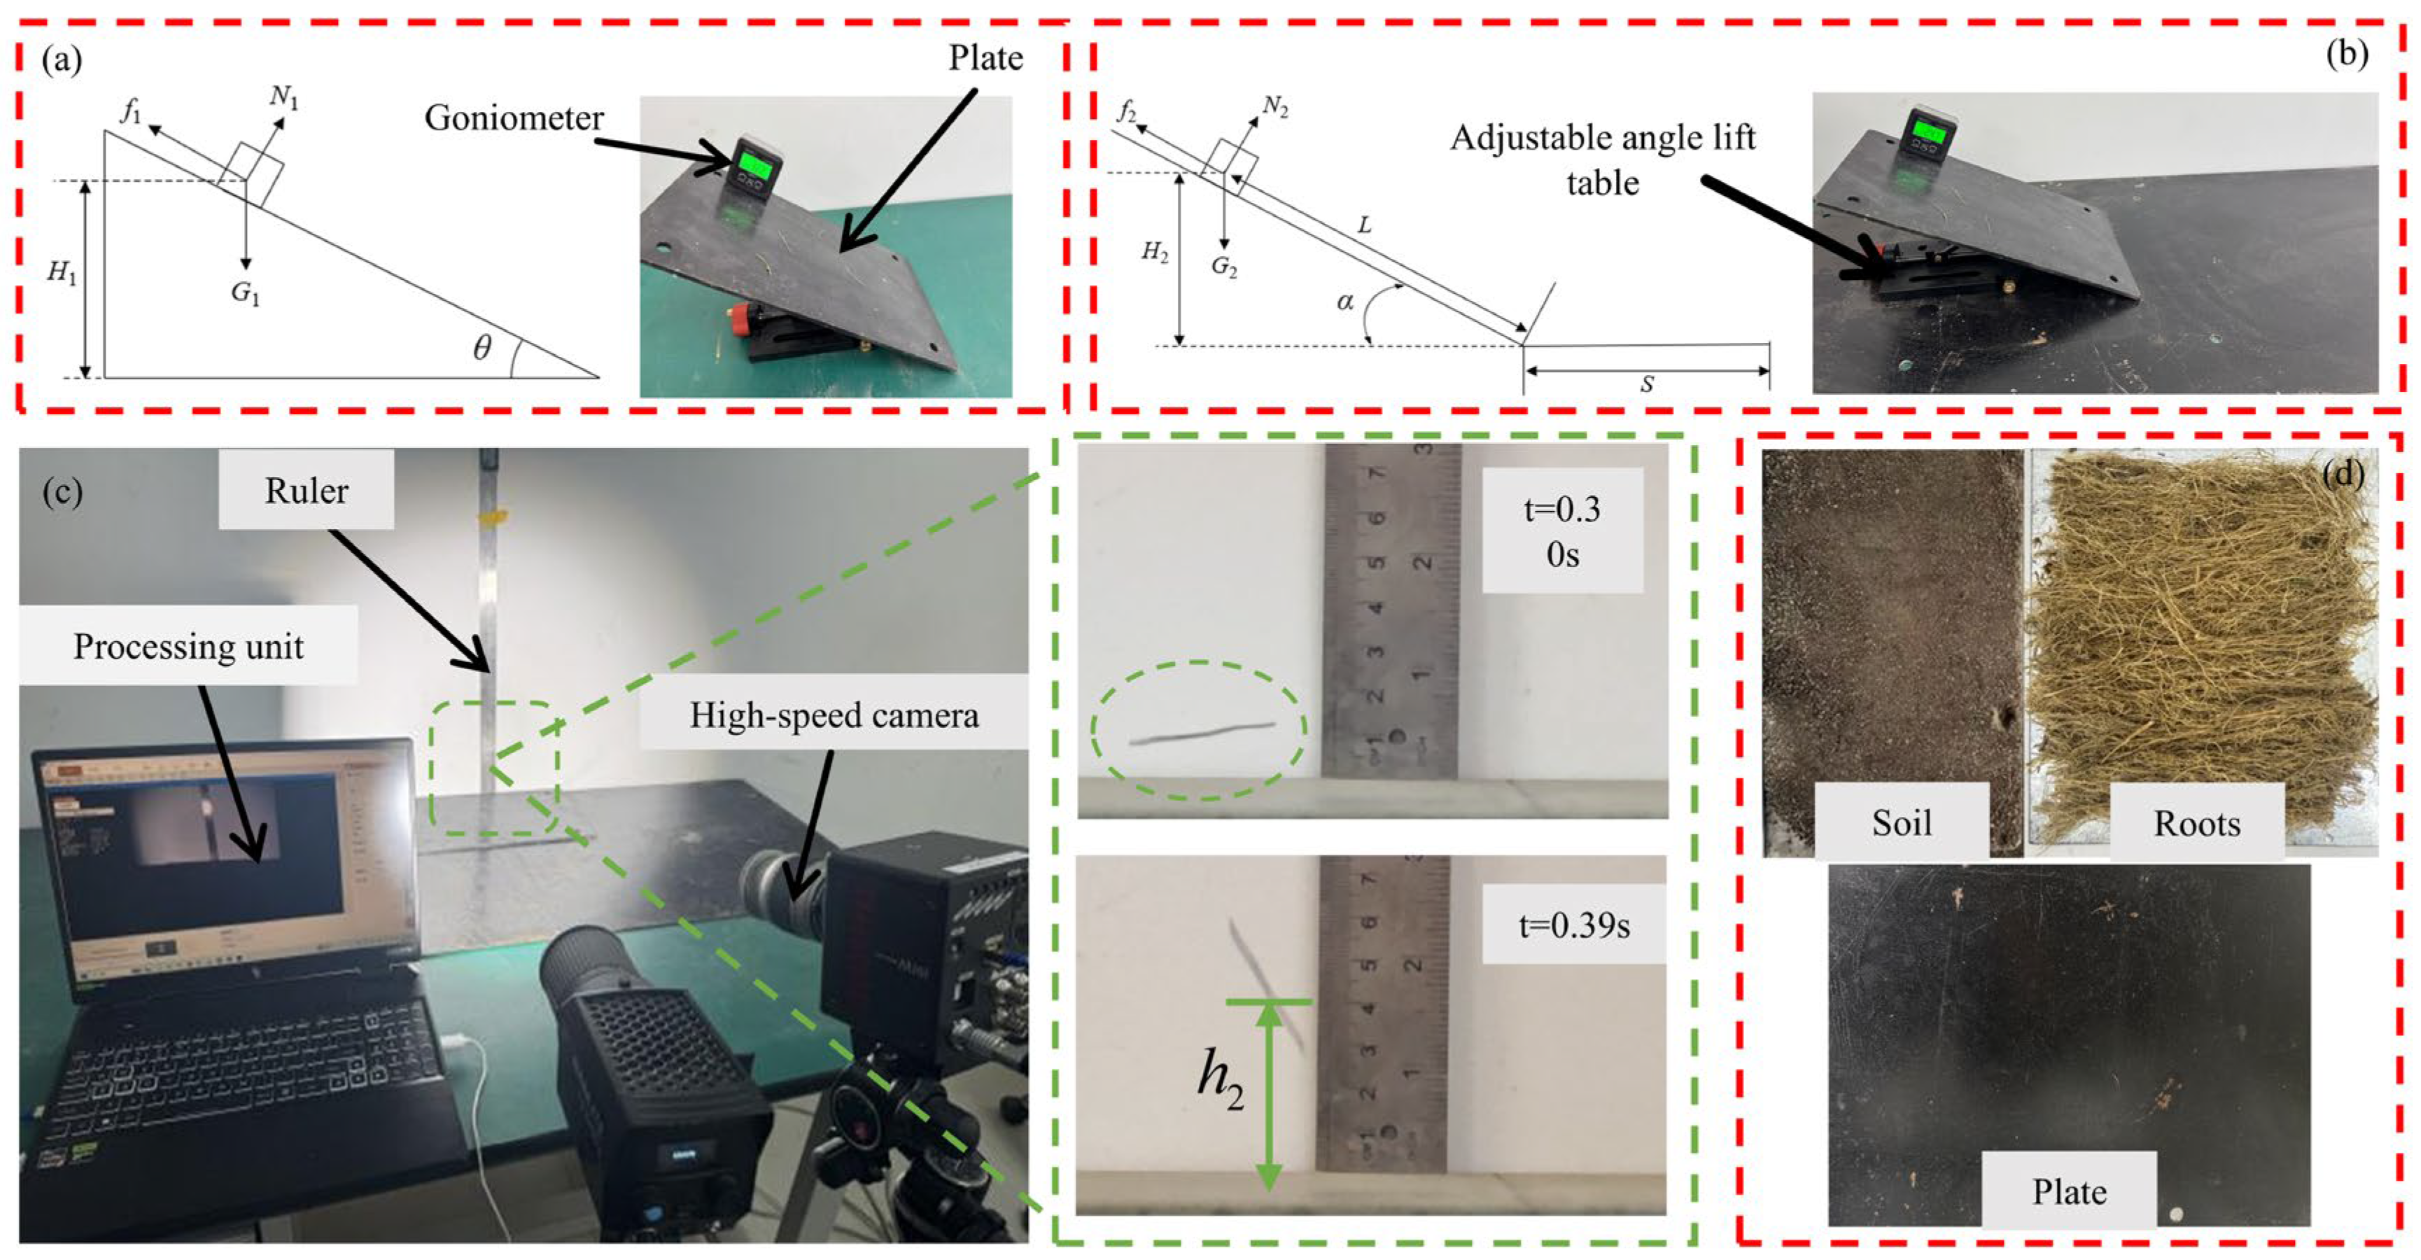
Figure 3.
Measurement setups for contact parameters: (a) Test bench for coefficient of static friction, (b) Test bench for coefficient of rolling friction, (c) Test bench for coefficient of restitution, (d) Material plate.
Figure 3.
Measurement setups for contact parameters: (a) Test bench for coefficient of static friction, (b) Test bench for coefficient of rolling friction, (c) Test bench for coefficient of restitution, (d) Material plate.
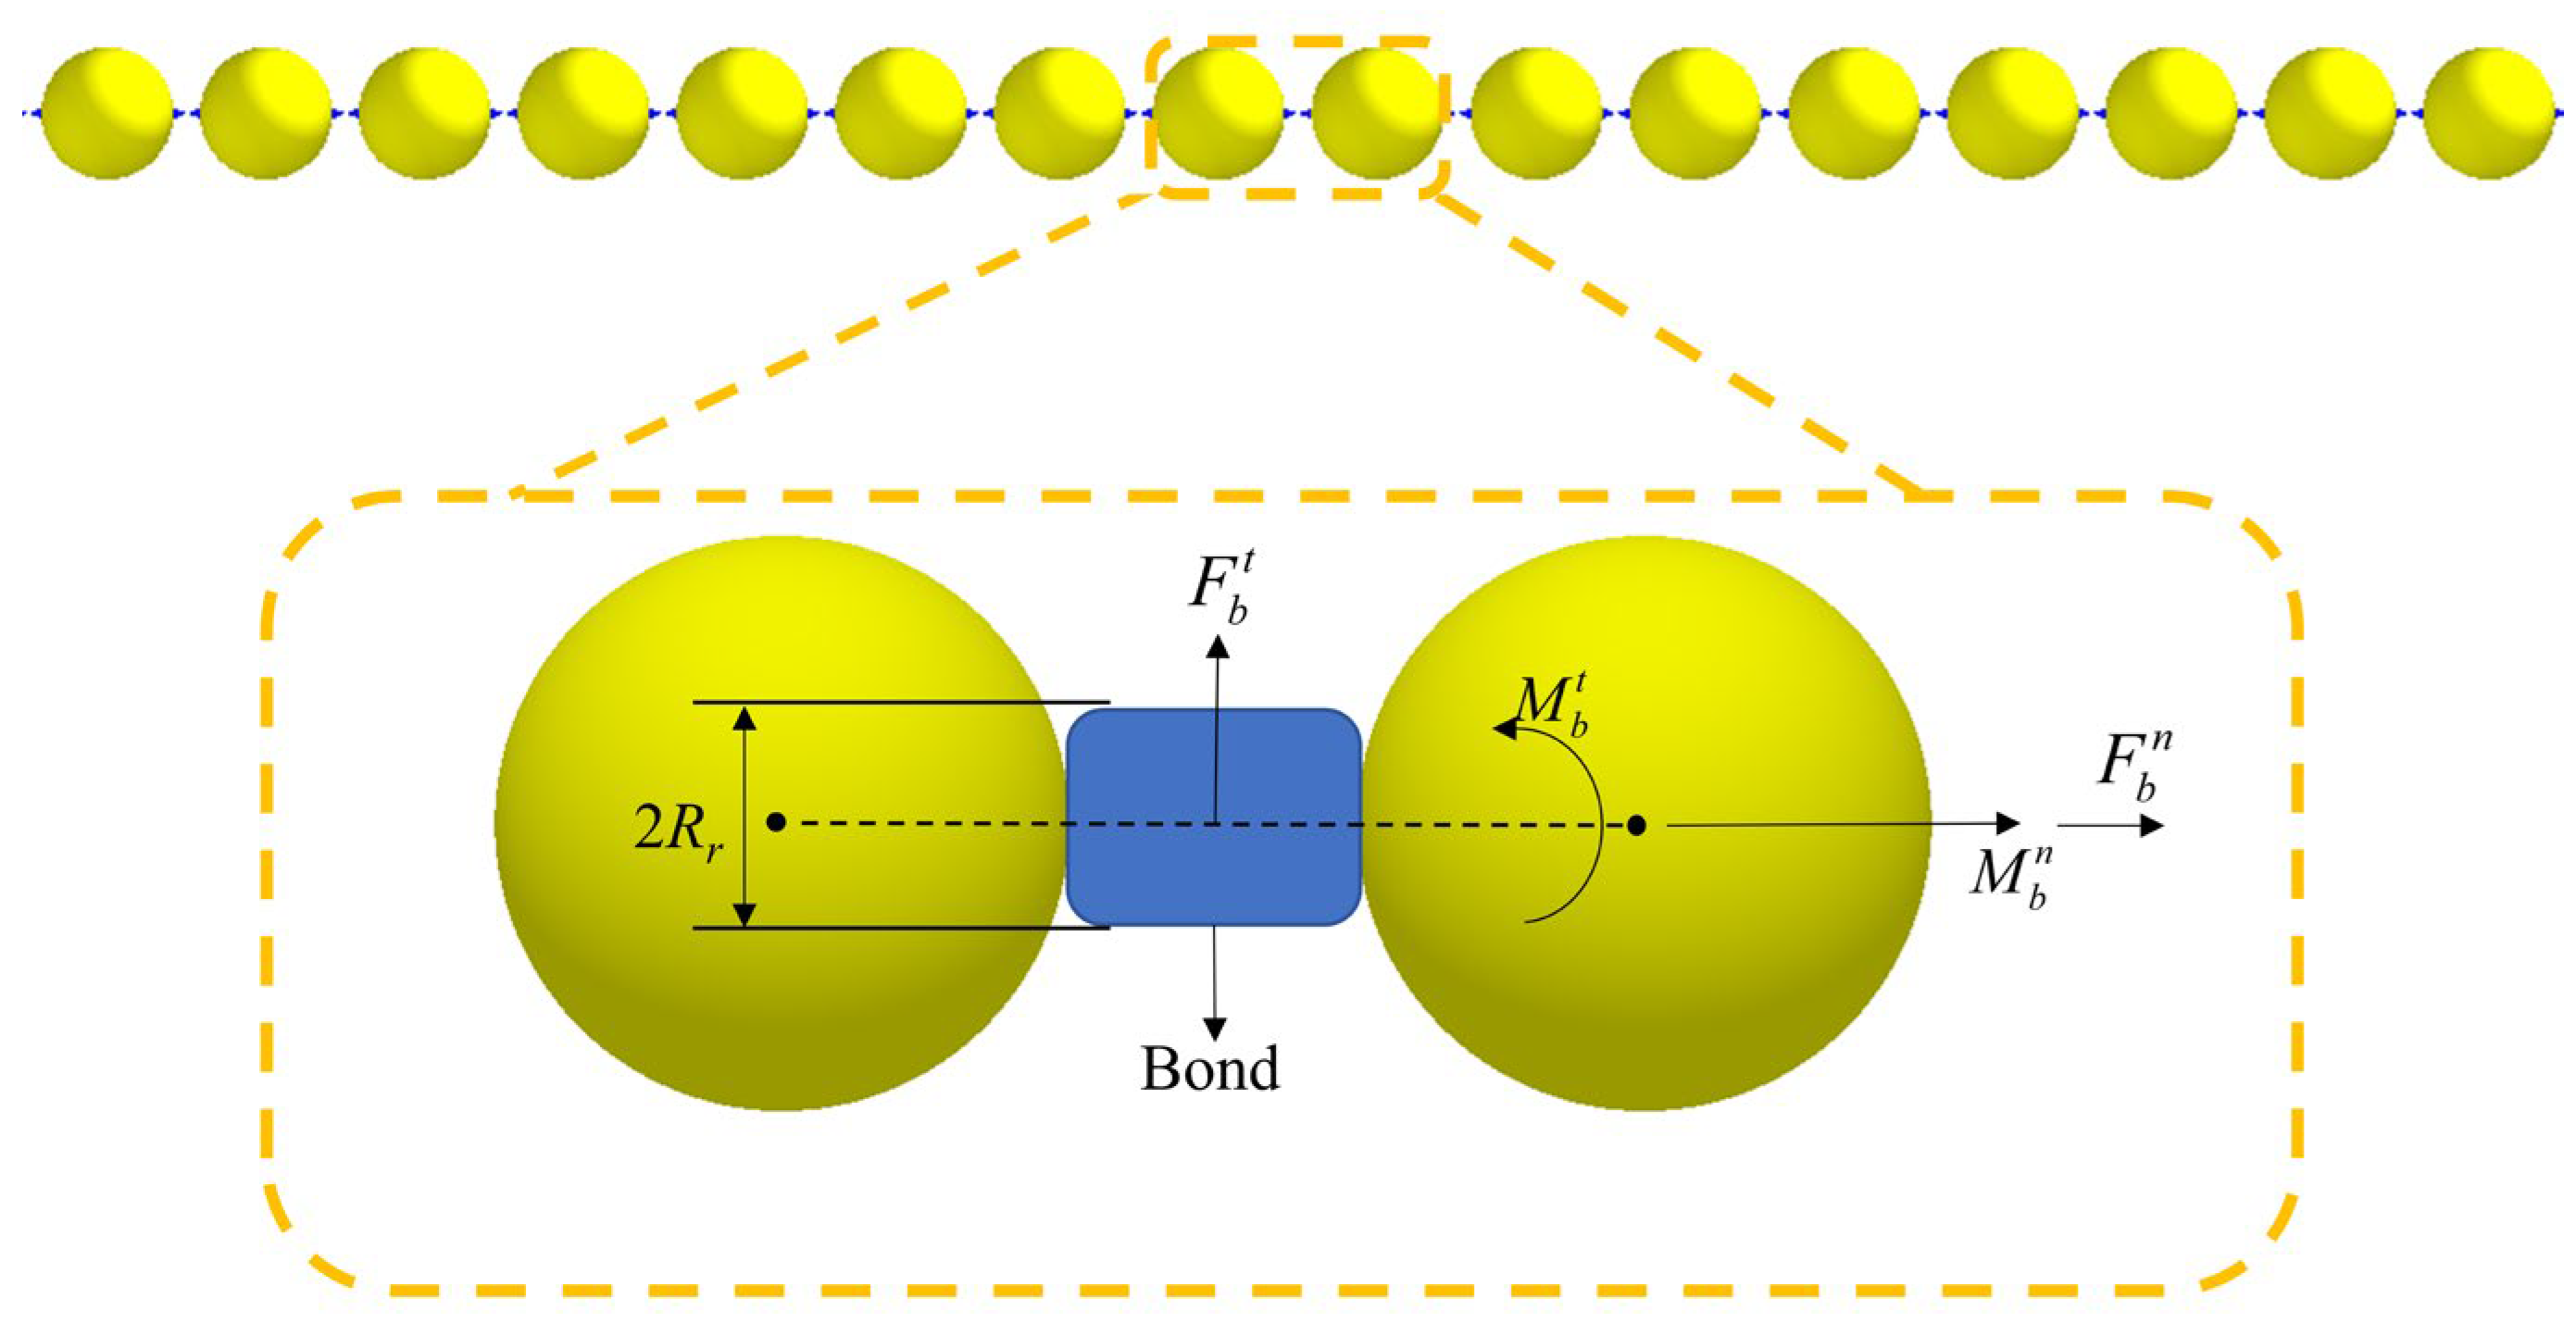
Figure 4.
Schematic diagram of the bonding model.
Figure 4.
Schematic diagram of the bonding model.
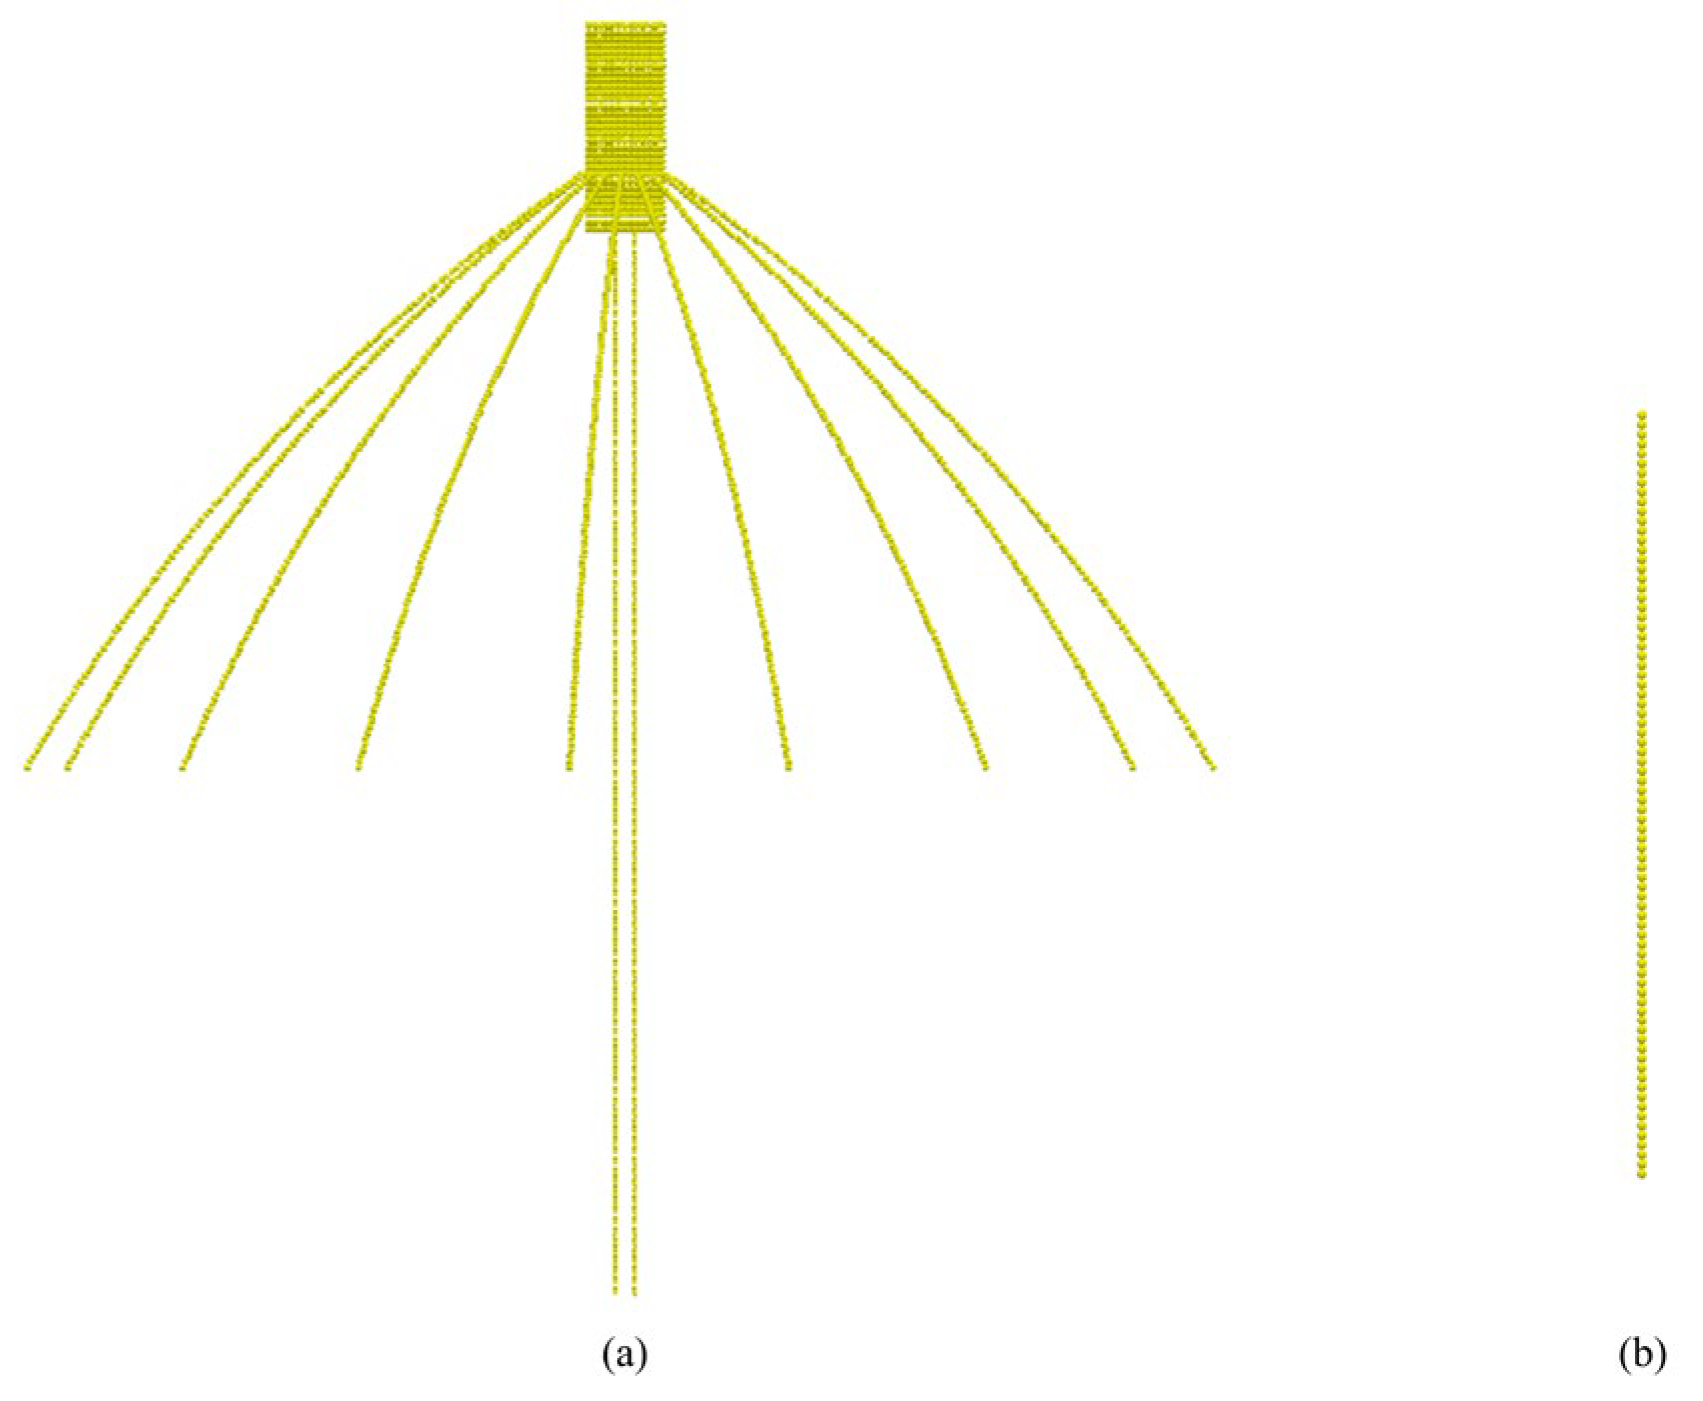
Figure 5.
DEM models of the wheat root system: (a) Whole-plant root system model, (b) 150 mm single root model.
Figure 5.
DEM models of the wheat root system: (a) Whole-plant root system model, (b) 150 mm single root model.
Figure 6.
Single-root segment models: (a) Root segment of 4 mm, (b) Root segment of 8 mm, (c) Root segment of 10 mm.
Figure 6.
Single-root segment models: (a) Root segment of 4 mm, (b) Root segment of 8 mm, (c) Root segment of 10 mm.
Figure 7.
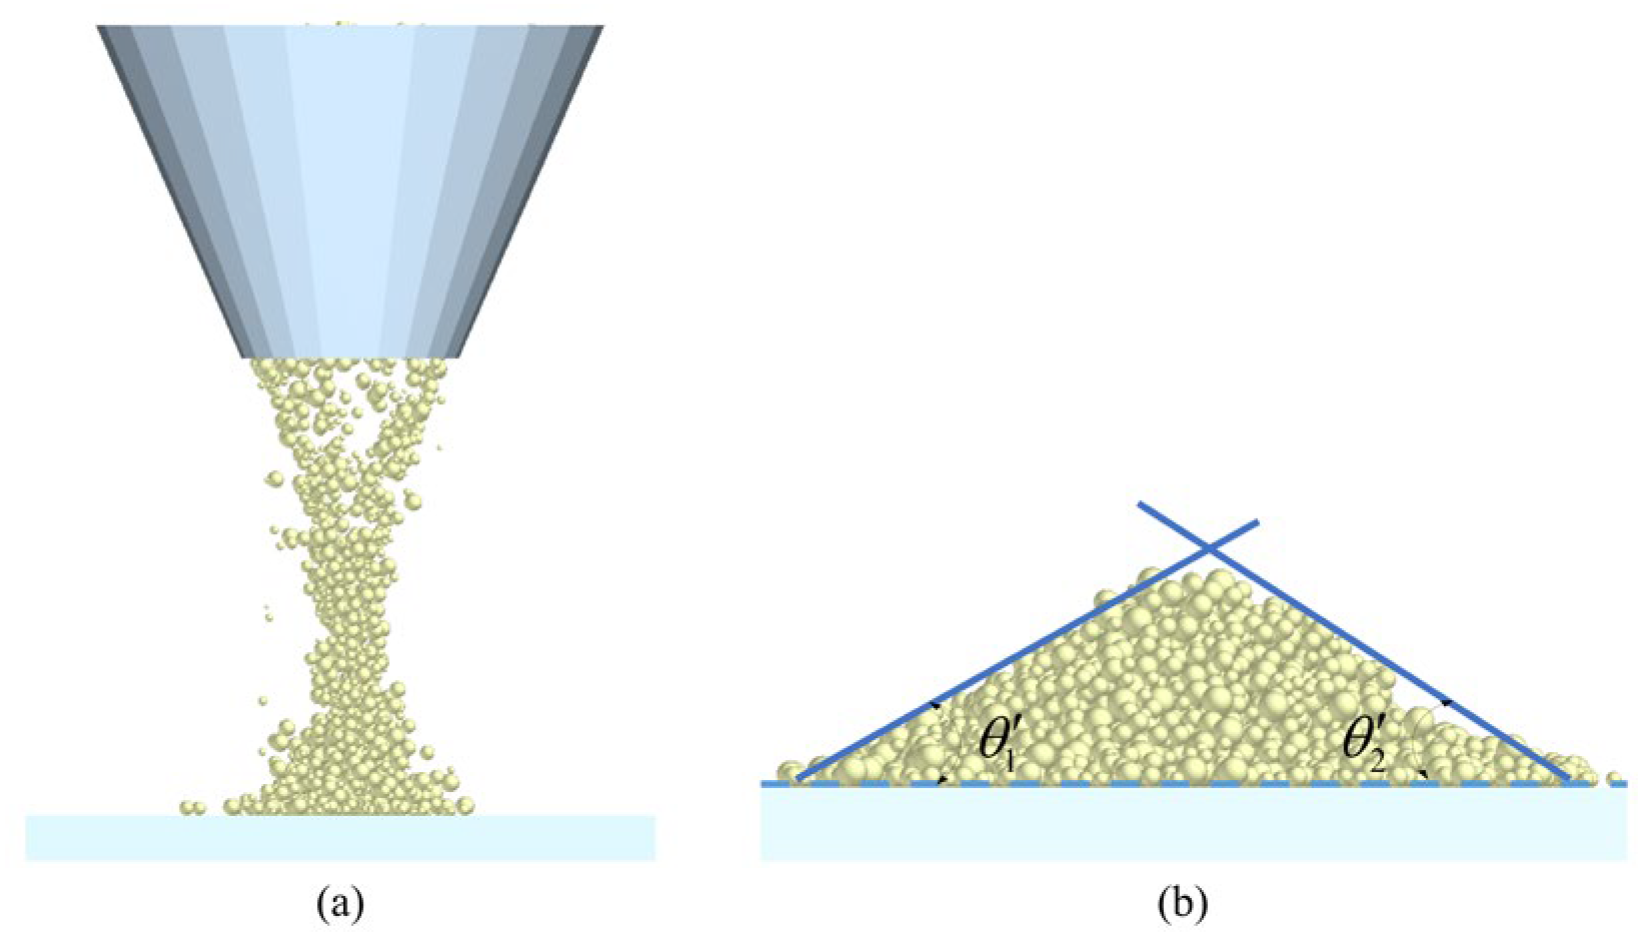
Validation of angle of repose test; n = 10, units: degrees. (a) Experimental angle of repose. (b) Simulated angle of repose.
Figure 7.
Validation of angle of repose test; n = 10, units: degrees. (a) Experimental angle of repose. (b) Simulated angle of repose.
Figure 8.
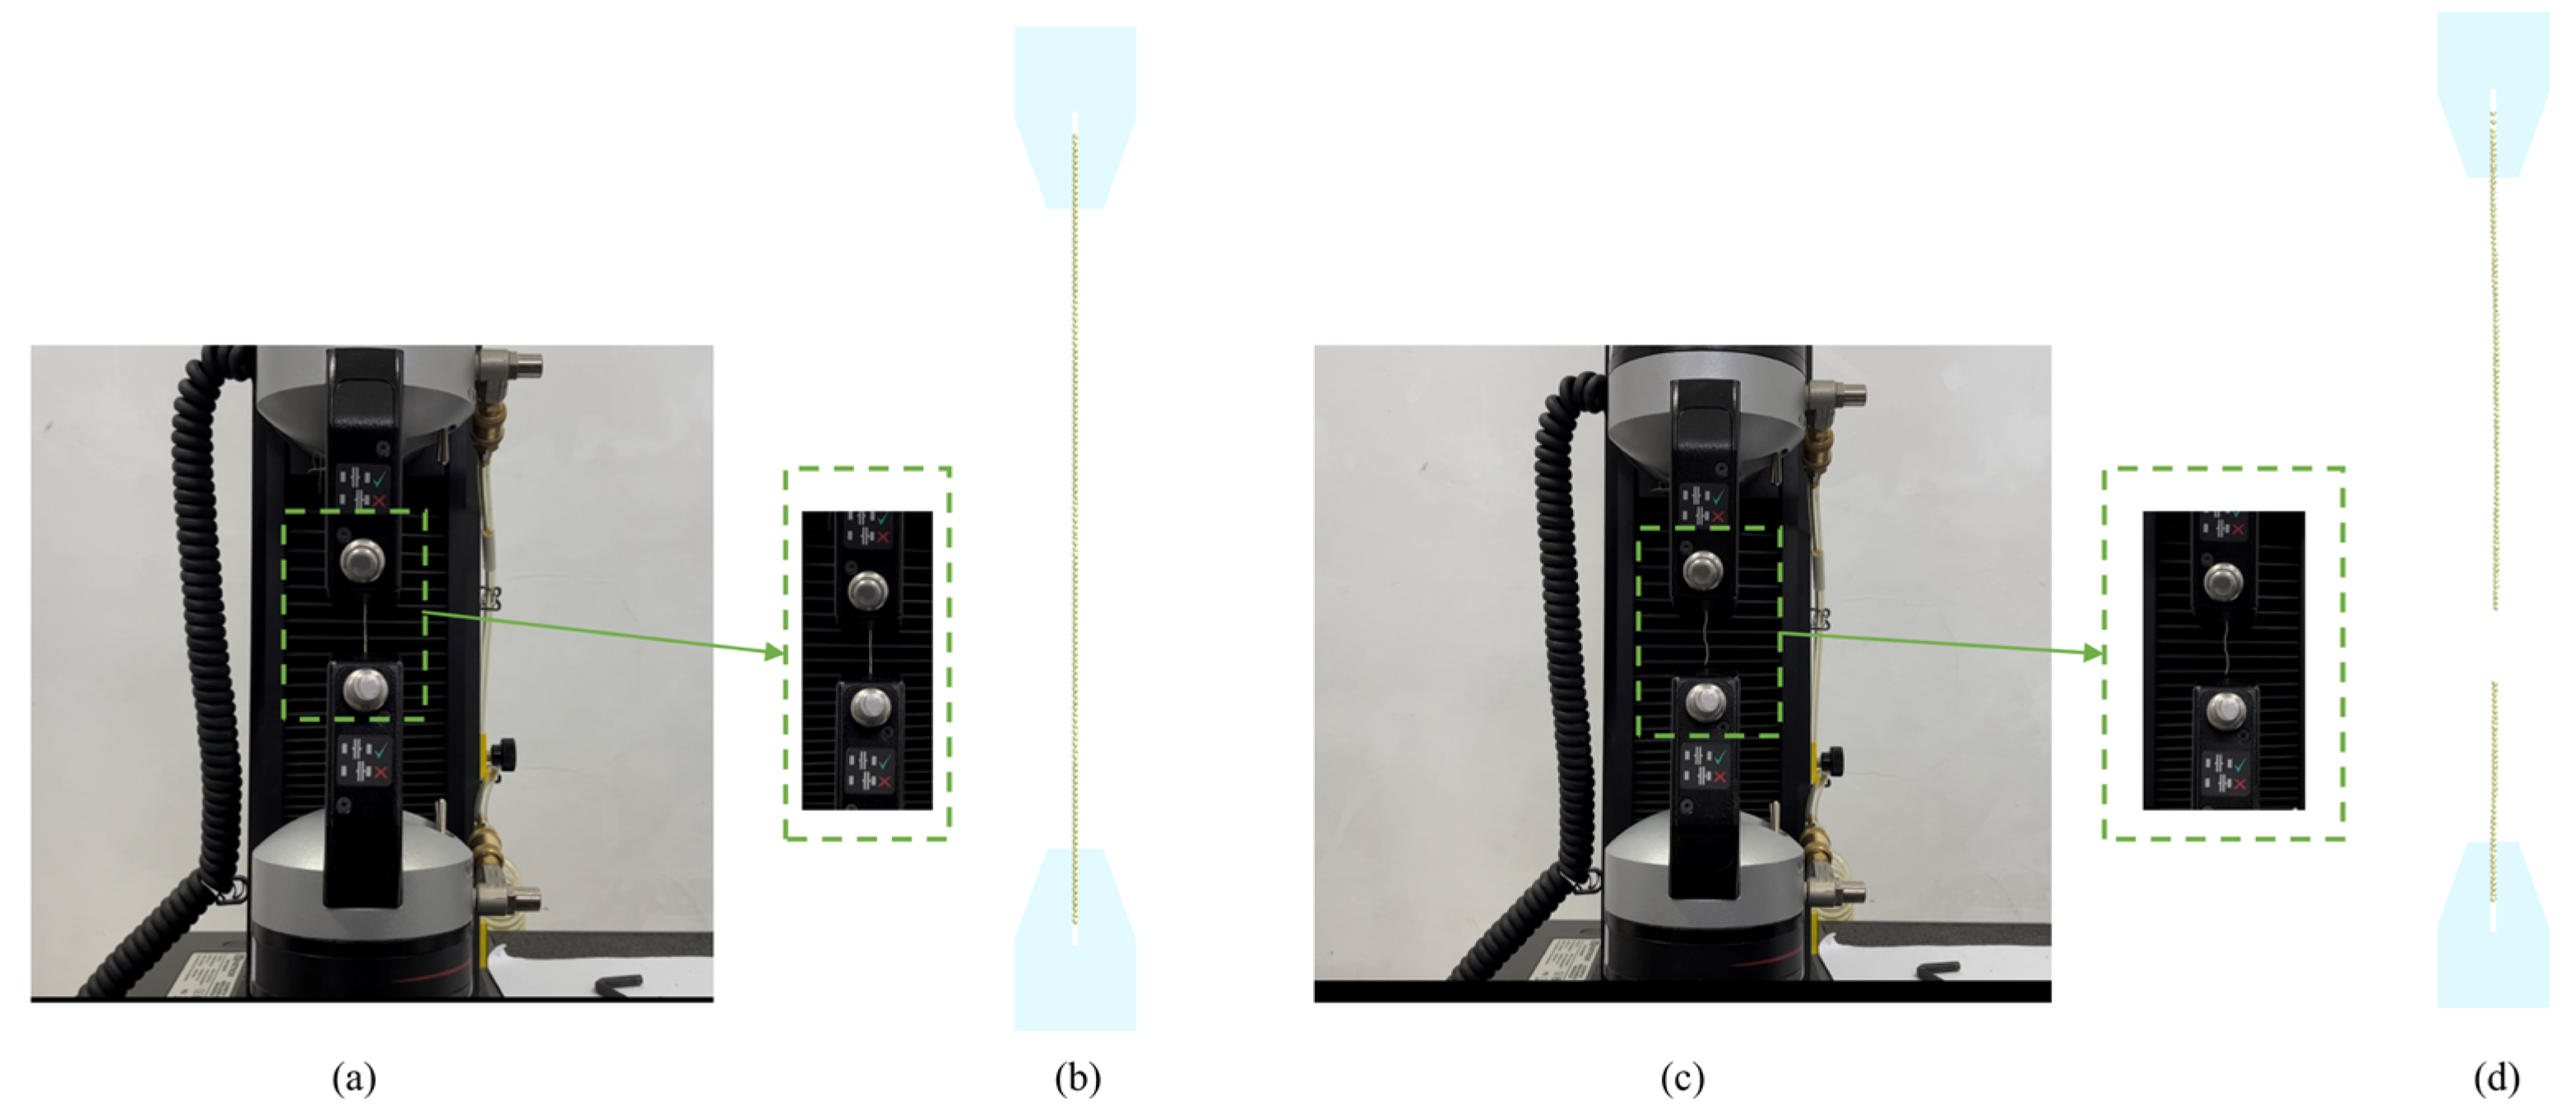
Comparison of experimental and simulated results for single-root tensile behavior, n = 10, units: N: (a) single-root tensioning begins, (b) single-root tension simulation starts, (c) single-root tensile fractures, (d) single-root tensile simulation fractures.
Figure 8.
Comparison of experimental and simulated results for single-root tensile behavior, n = 10, units: N: (a) single-root tensioning begins, (b) single-root tension simulation starts, (c) single-root tensile fractures, (d) single-root tensile simulation fractures.
Figure 9.
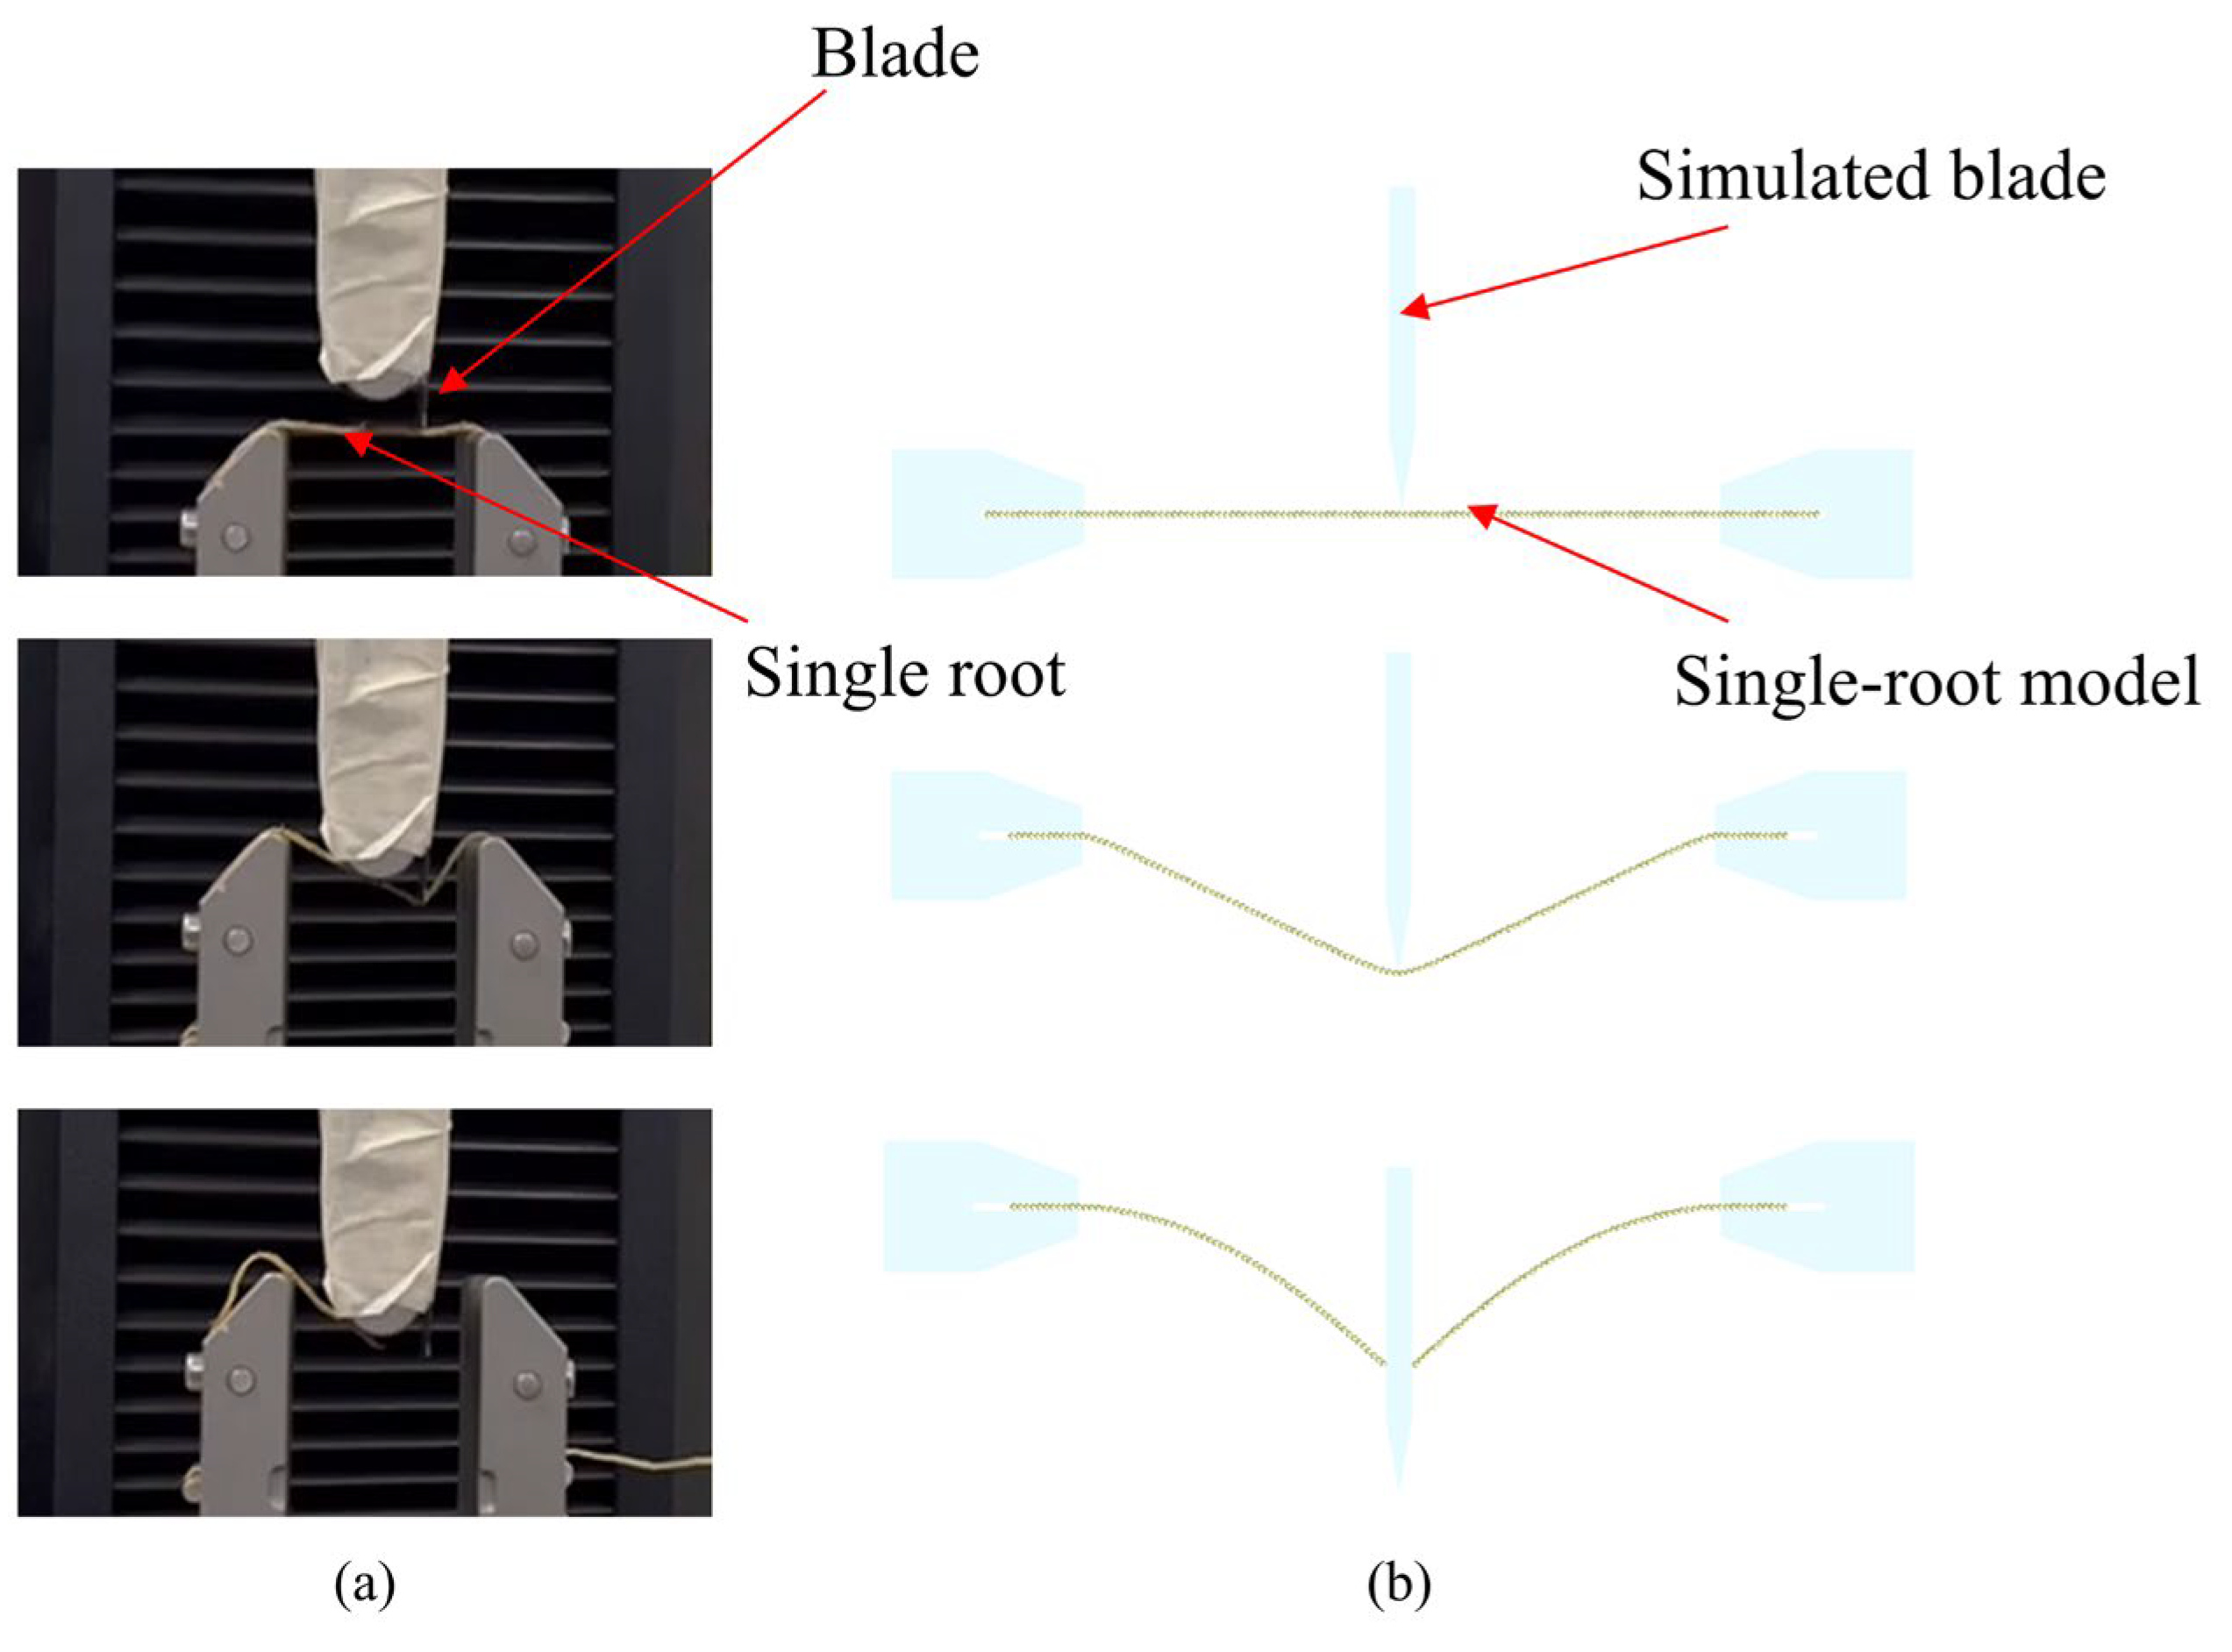
Comparison of Shear Tests on a 150-mm Individual Root, n = 10, units: N. (a) Shear Test, (b) Shear Simulation Test.
Figure 9.
Comparison of Shear Tests on a 150-mm Individual Root, n = 10, units: N. (a) Shear Test, (b) Shear Simulation Test.
Figure 10.
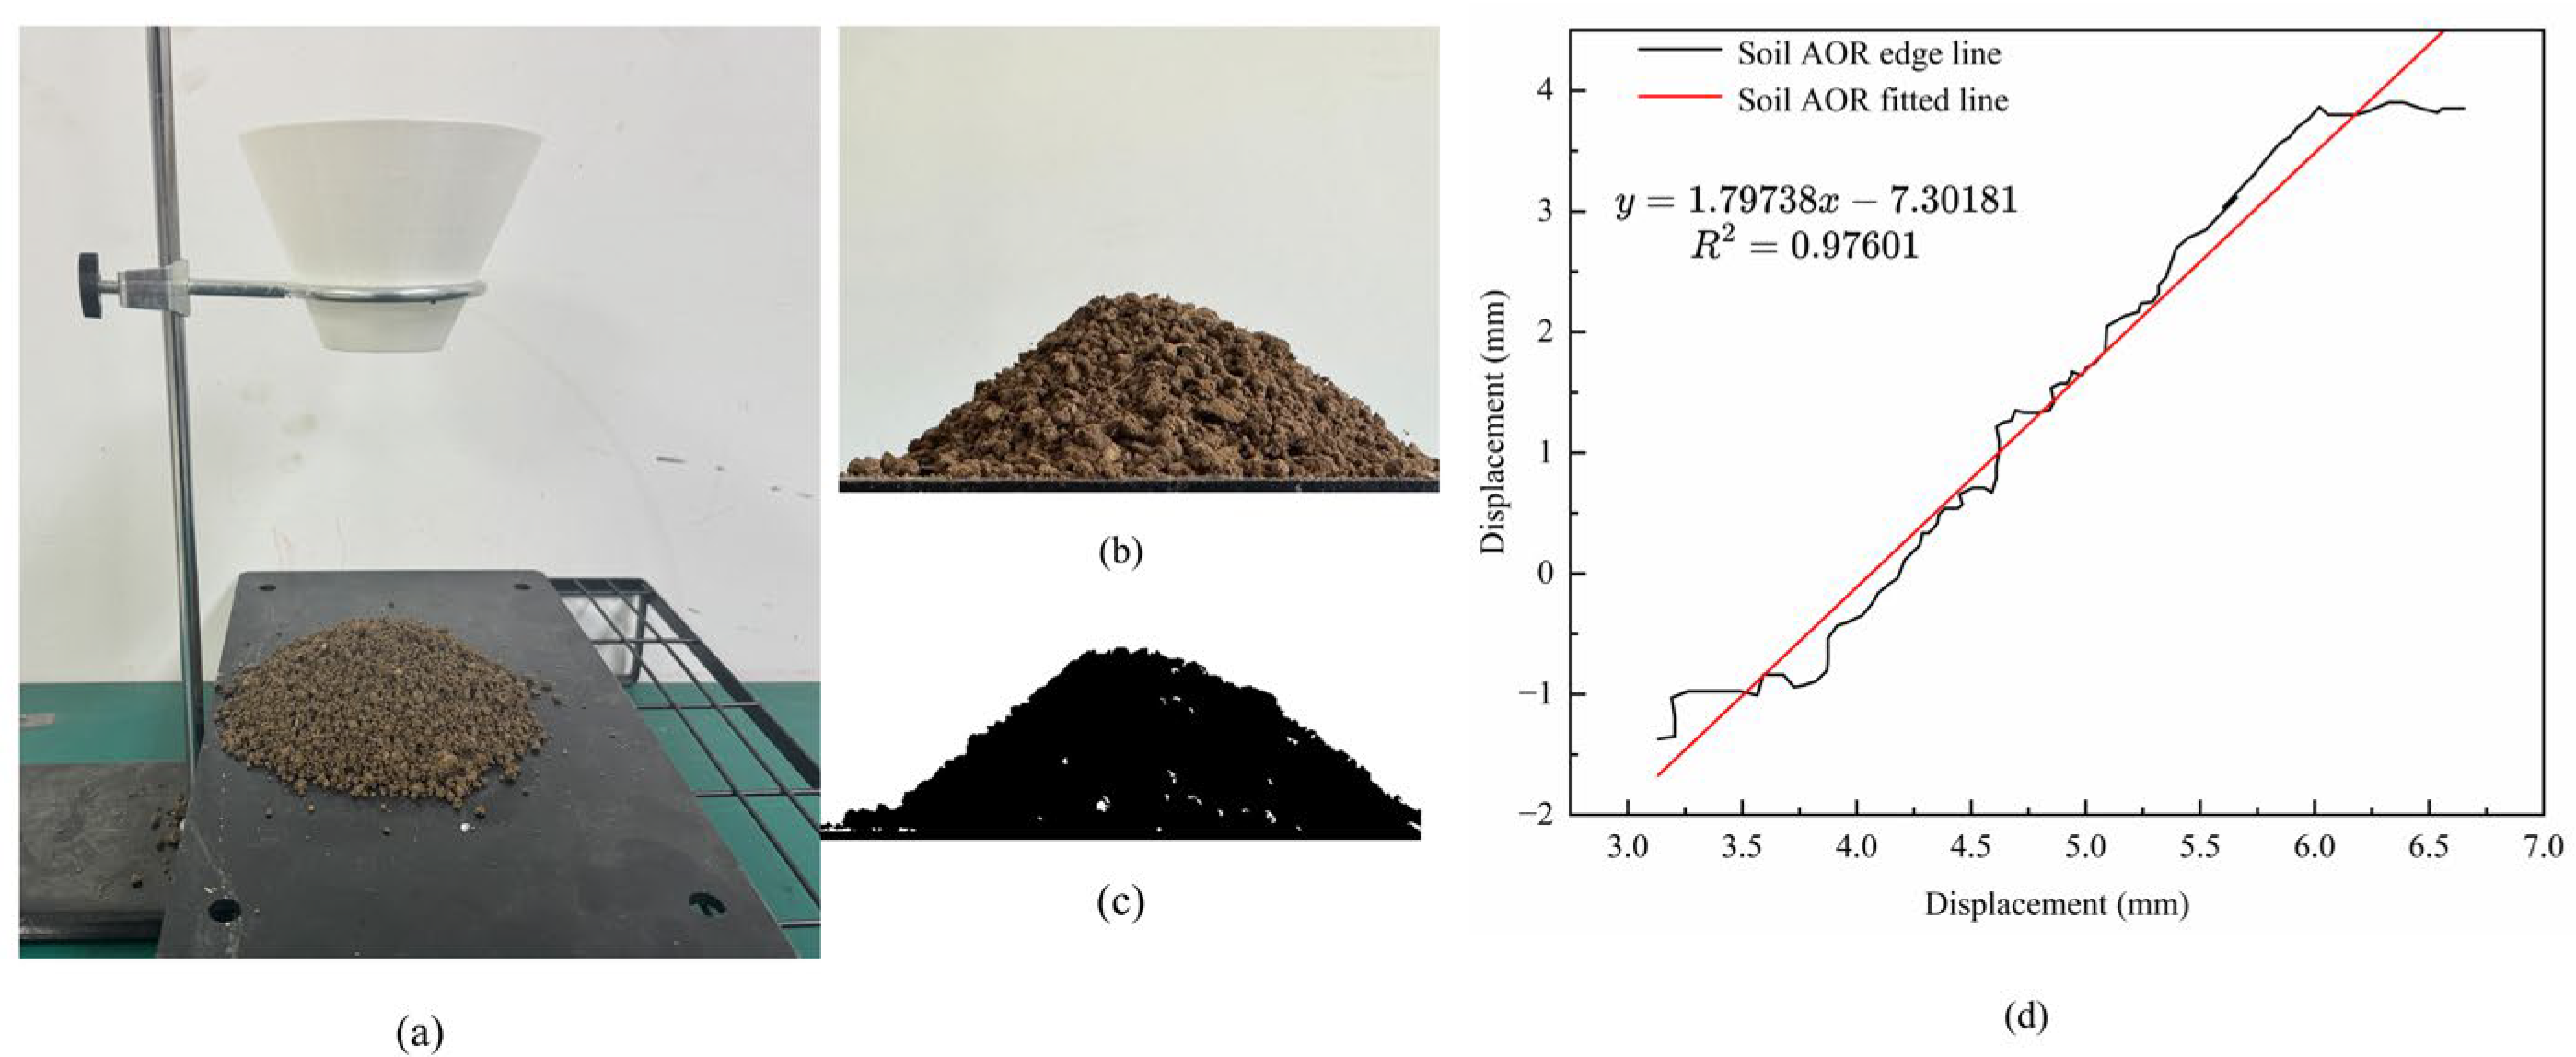
Measurement of soil accumulation angle; n = 10, units: degrees. (a) Measurement of soil accumulation angle. (b) Edge profile of soil accumulation. (c) Binarization of soil accumulation. (d) Edge fitting to determine the angle of repose.
Figure 10.
Measurement of soil accumulation angle; n = 10, units: degrees. (a) Measurement of soil accumulation angle. (b) Edge profile of soil accumulation. (c) Binarization of soil accumulation. (d) Edge fitting to determine the angle of repose.
Figure 11.
Simulation-based optimization results for the AOR, n = 10, units: degrees: (a) Verification process of soil model parameters, (b) Verification results.
Figure 11.
Simulation-based optimization results for the AOR, n = 10, units: degrees: (a) Verification process of soil model parameters, (b) Verification results.
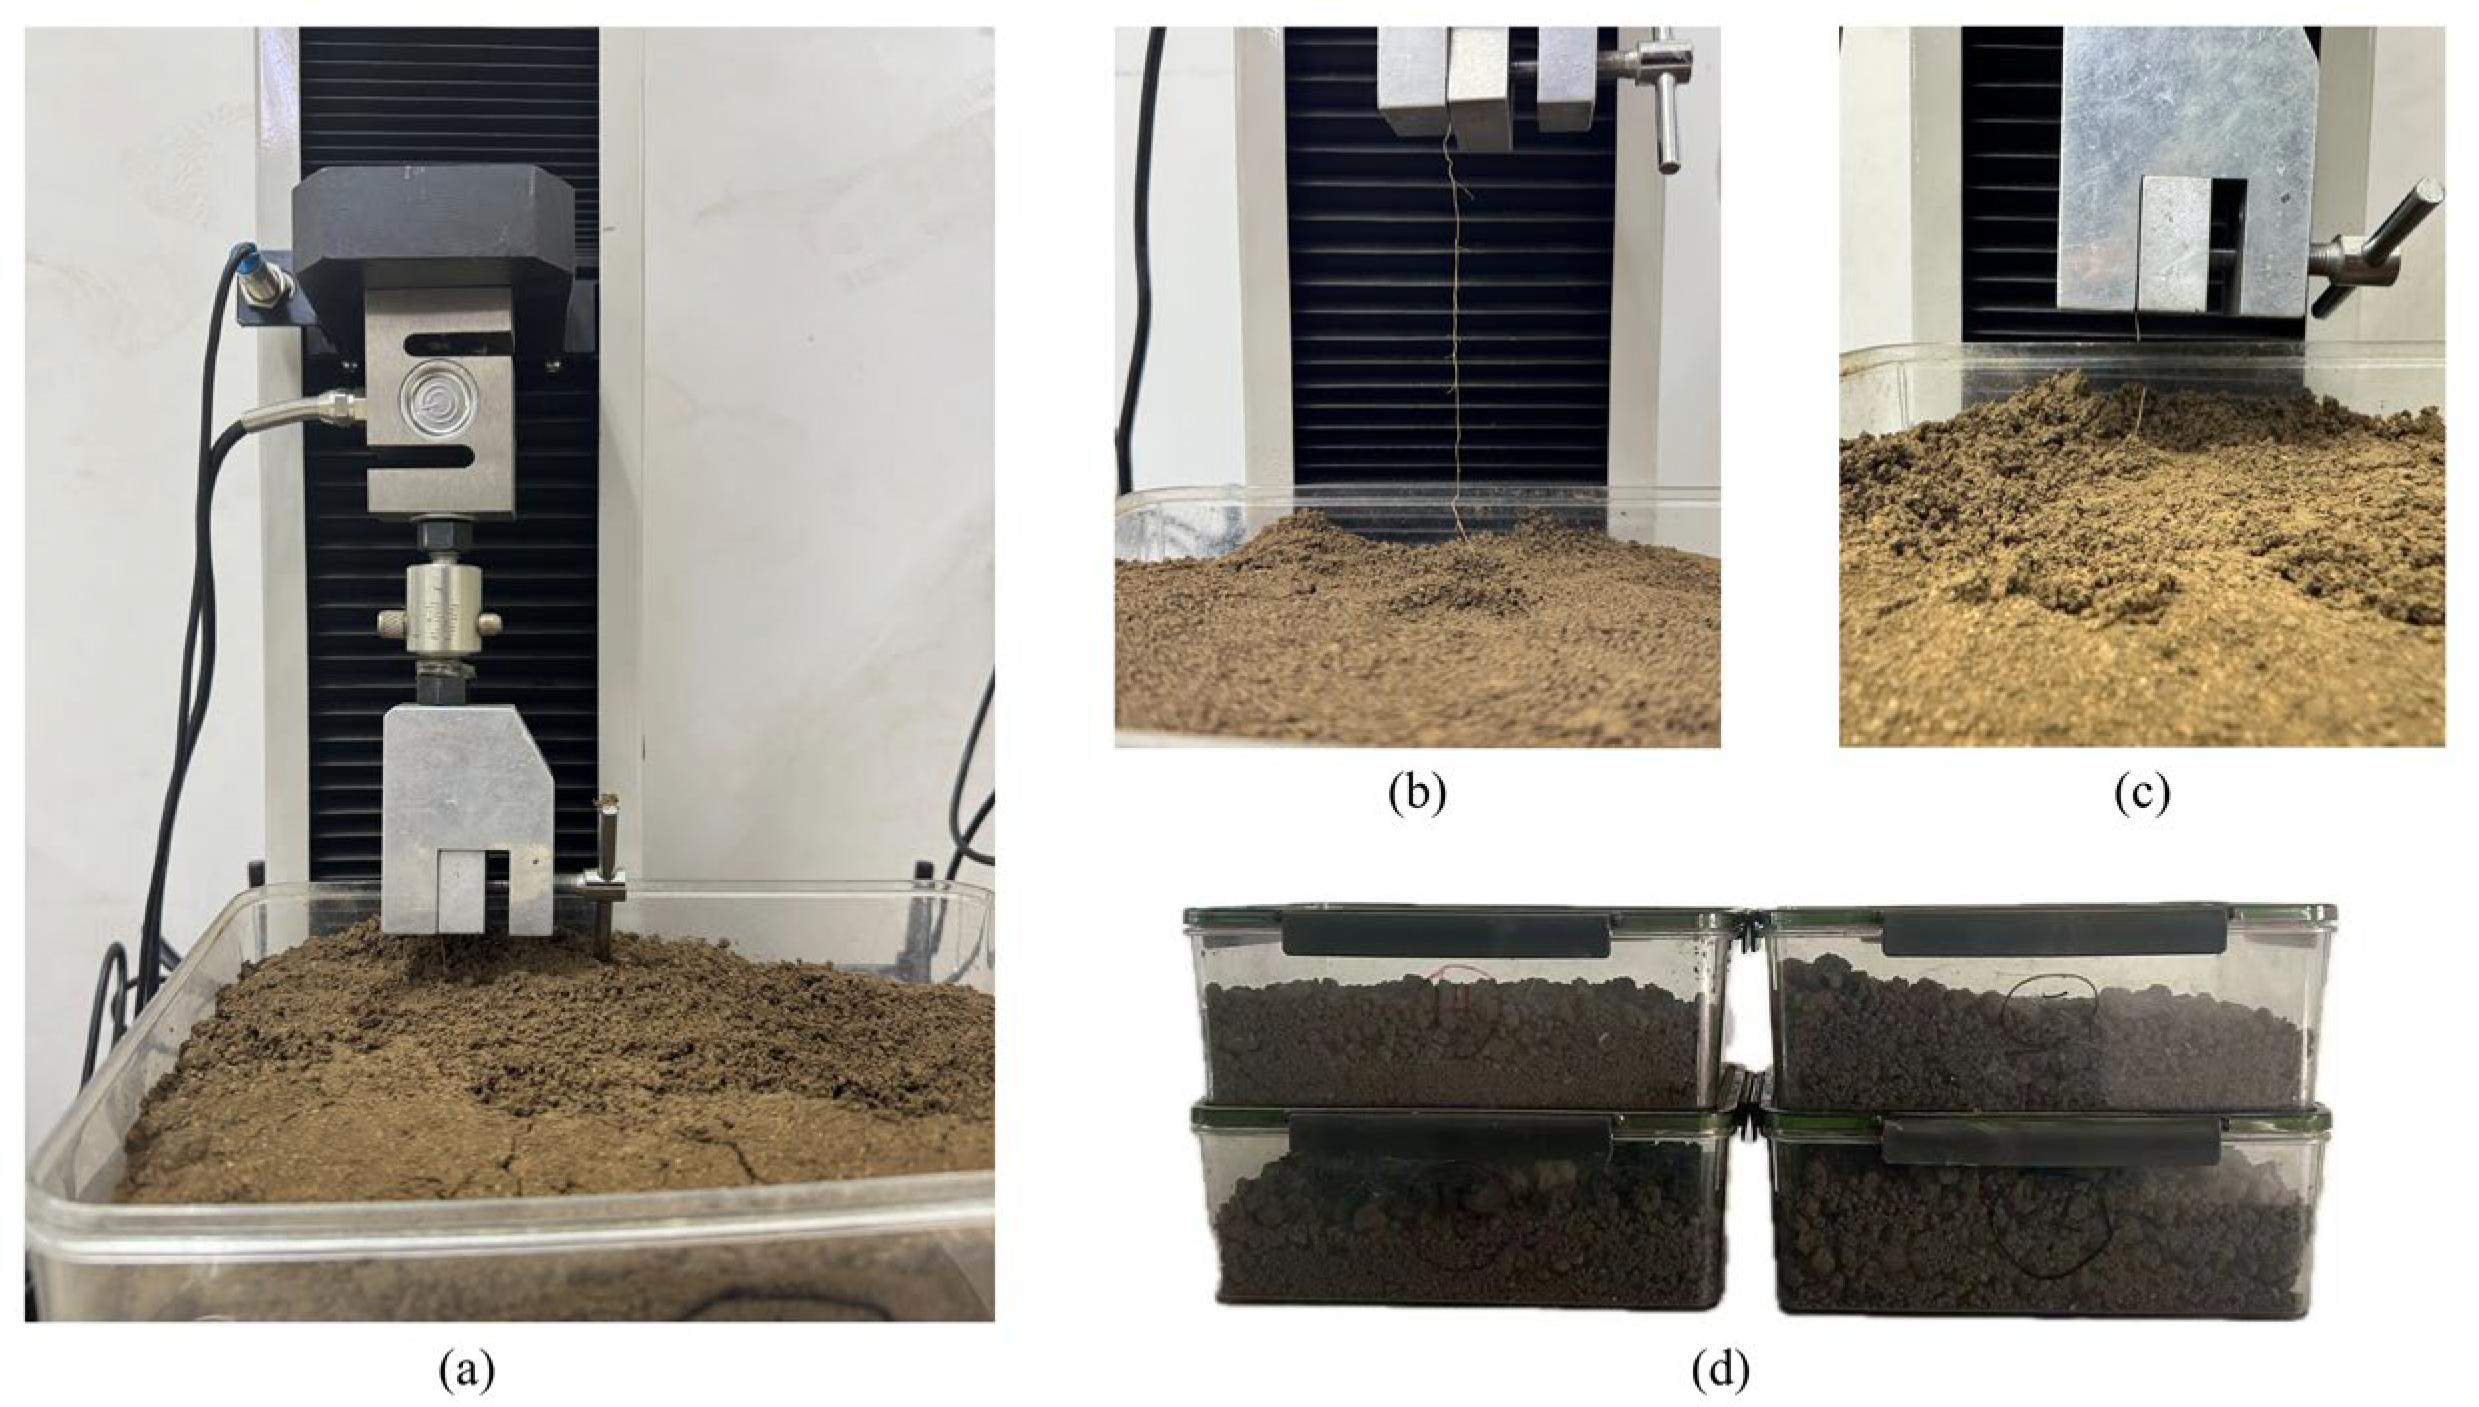
Figure 12.
Pull-out test of a single root buried in soil, n = 5, units: N, % for water content: (a) Pull-out process of a single root, (b) Complete pull-out, (c) Root tensile failure, (d) Soil under different water contents.
Figure 12.
Pull-out test of a single root buried in soil, n = 5, units: N, % for water content: (a) Pull-out process of a single root, (b) Complete pull-out, (c) Root tensile failure, (d) Soil under different water contents.
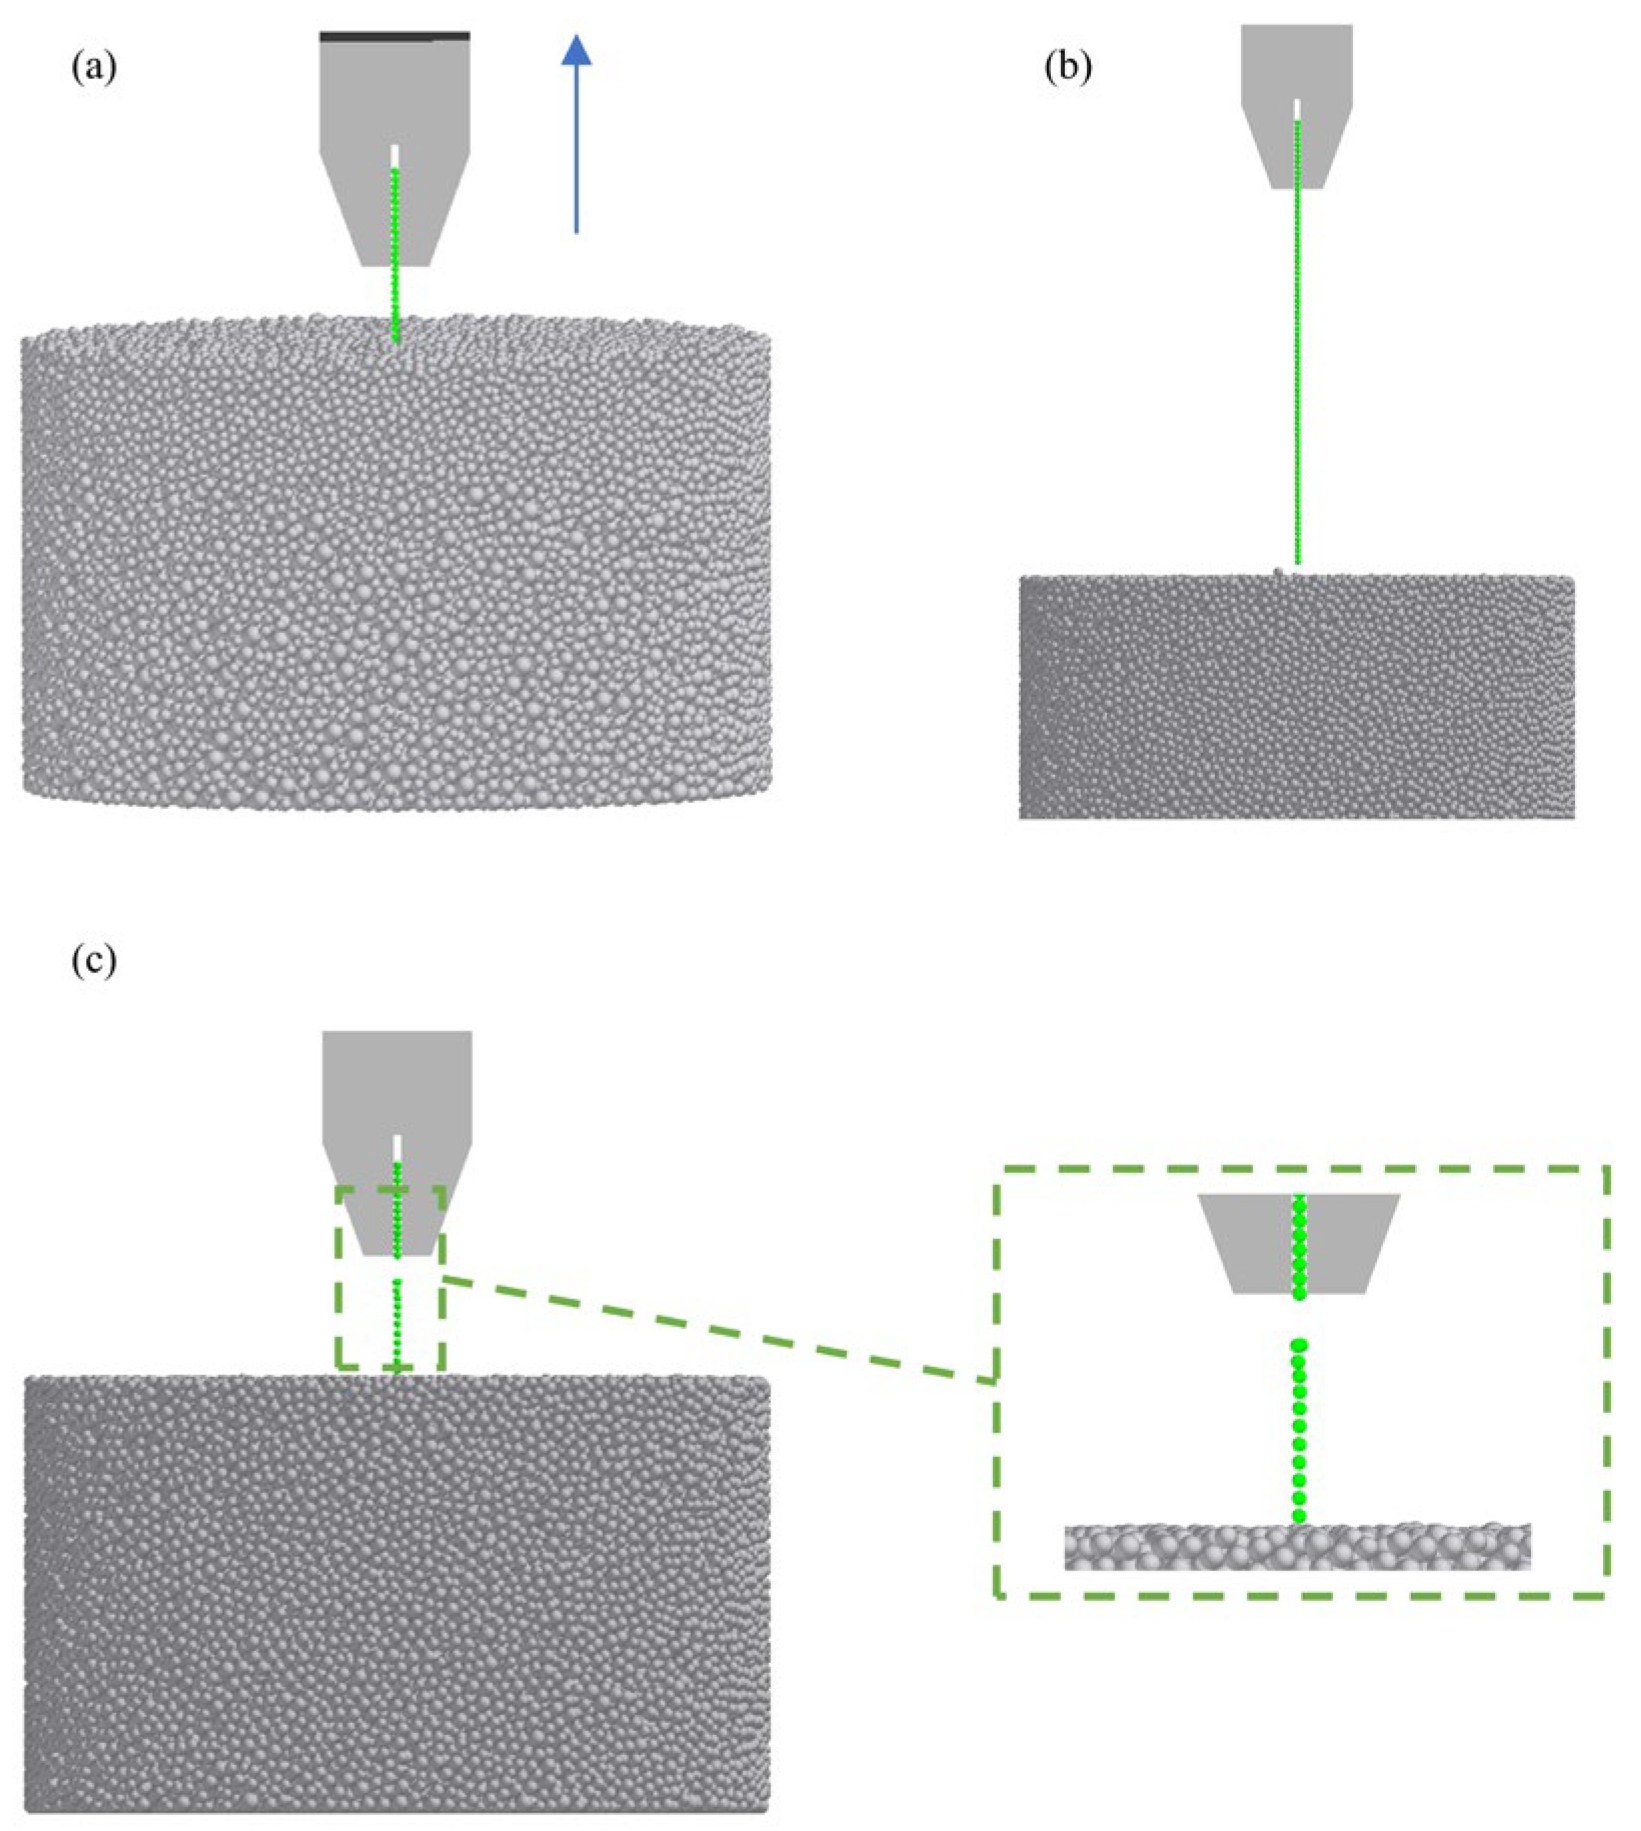
Figure 13.
Simulation test of pull-out of a single root buried in soil: (a) Initiation of root pull-out, (b) Complete root pull-out, (c) Root pull-out failure. Green: Single wheat root; Blue arrow: Pulling direction; Gray particles: Soil grains; Gray solid: Fixture.
Figure 13.
Simulation test of pull-out of a single root buried in soil: (a) Initiation of root pull-out, (b) Complete root pull-out, (c) Root pull-out failure. Green: Single wheat root; Blue arrow: Pulling direction; Gray particles: Soil grains; Gray solid: Fixture.
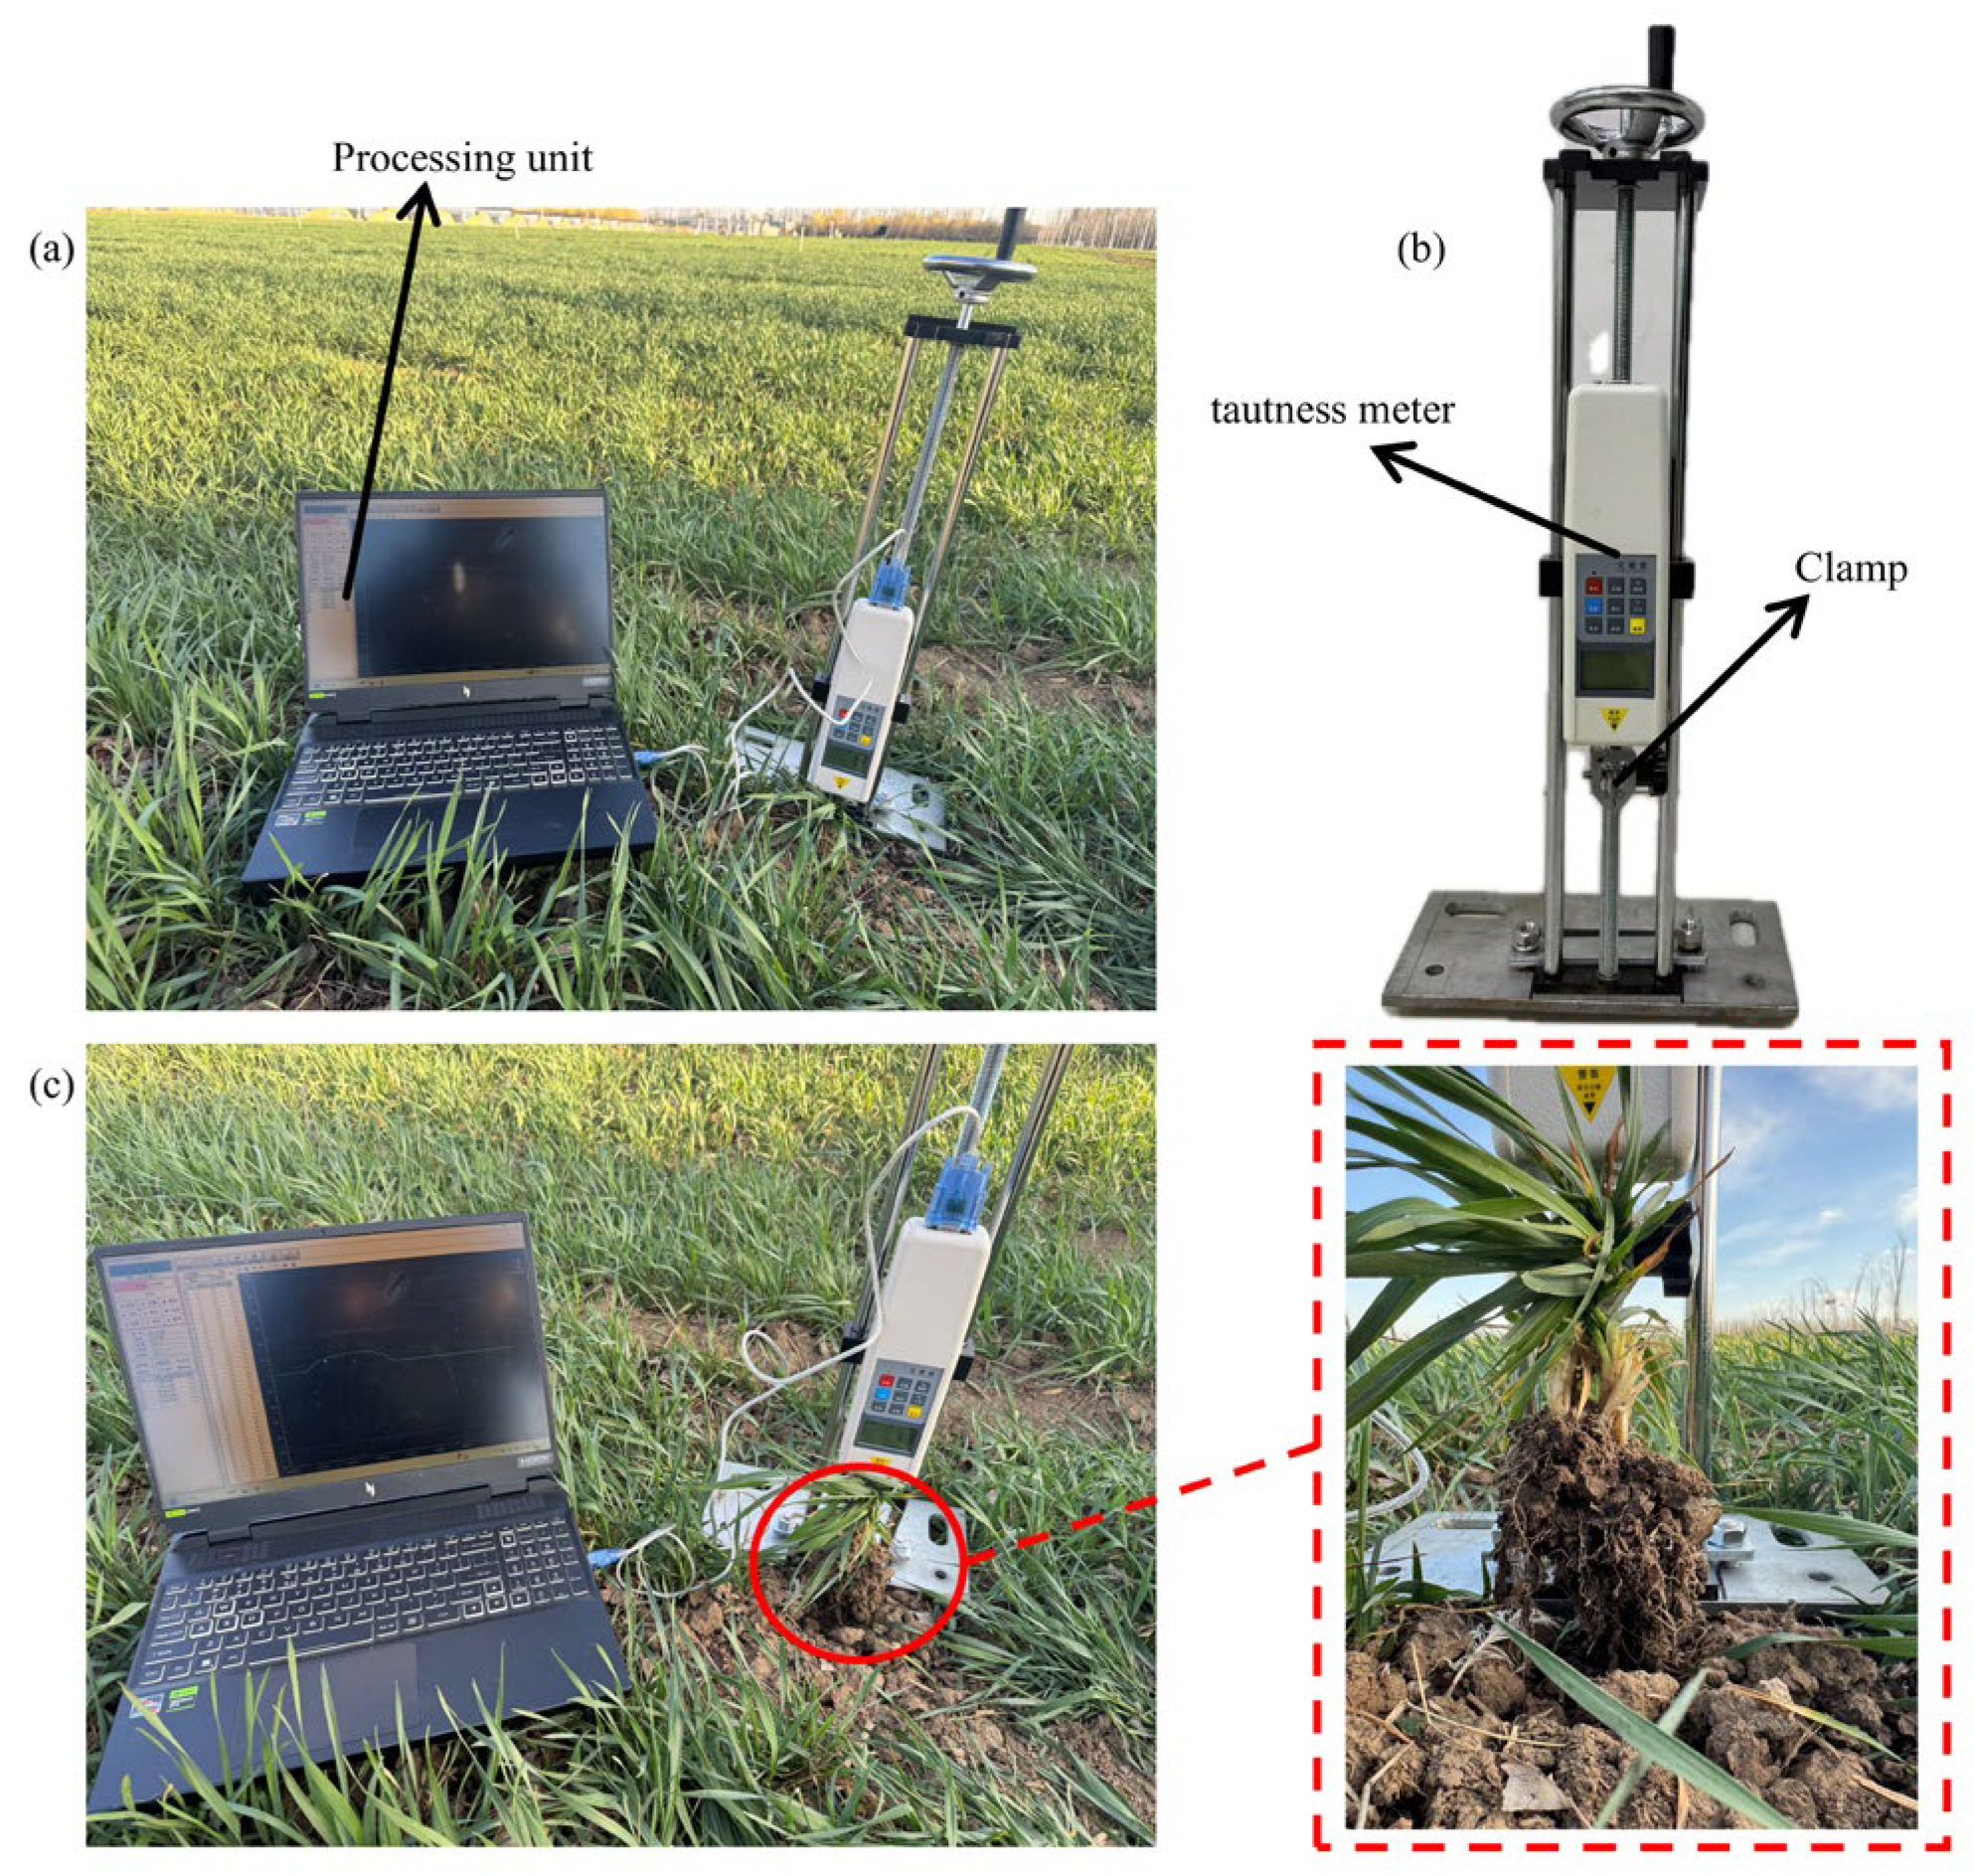
Figure 14.
Pulling test of the actual root system in soil: (a) Pull-out test of wheat root system in soil, (b) Root tensile testing system, (c) Complete root system pull-out.
Figure 14.
Pulling test of the actual root system in soil: (a) Pull-out test of wheat root system in soil, (b) Root tensile testing system, (c) Complete root system pull-out.
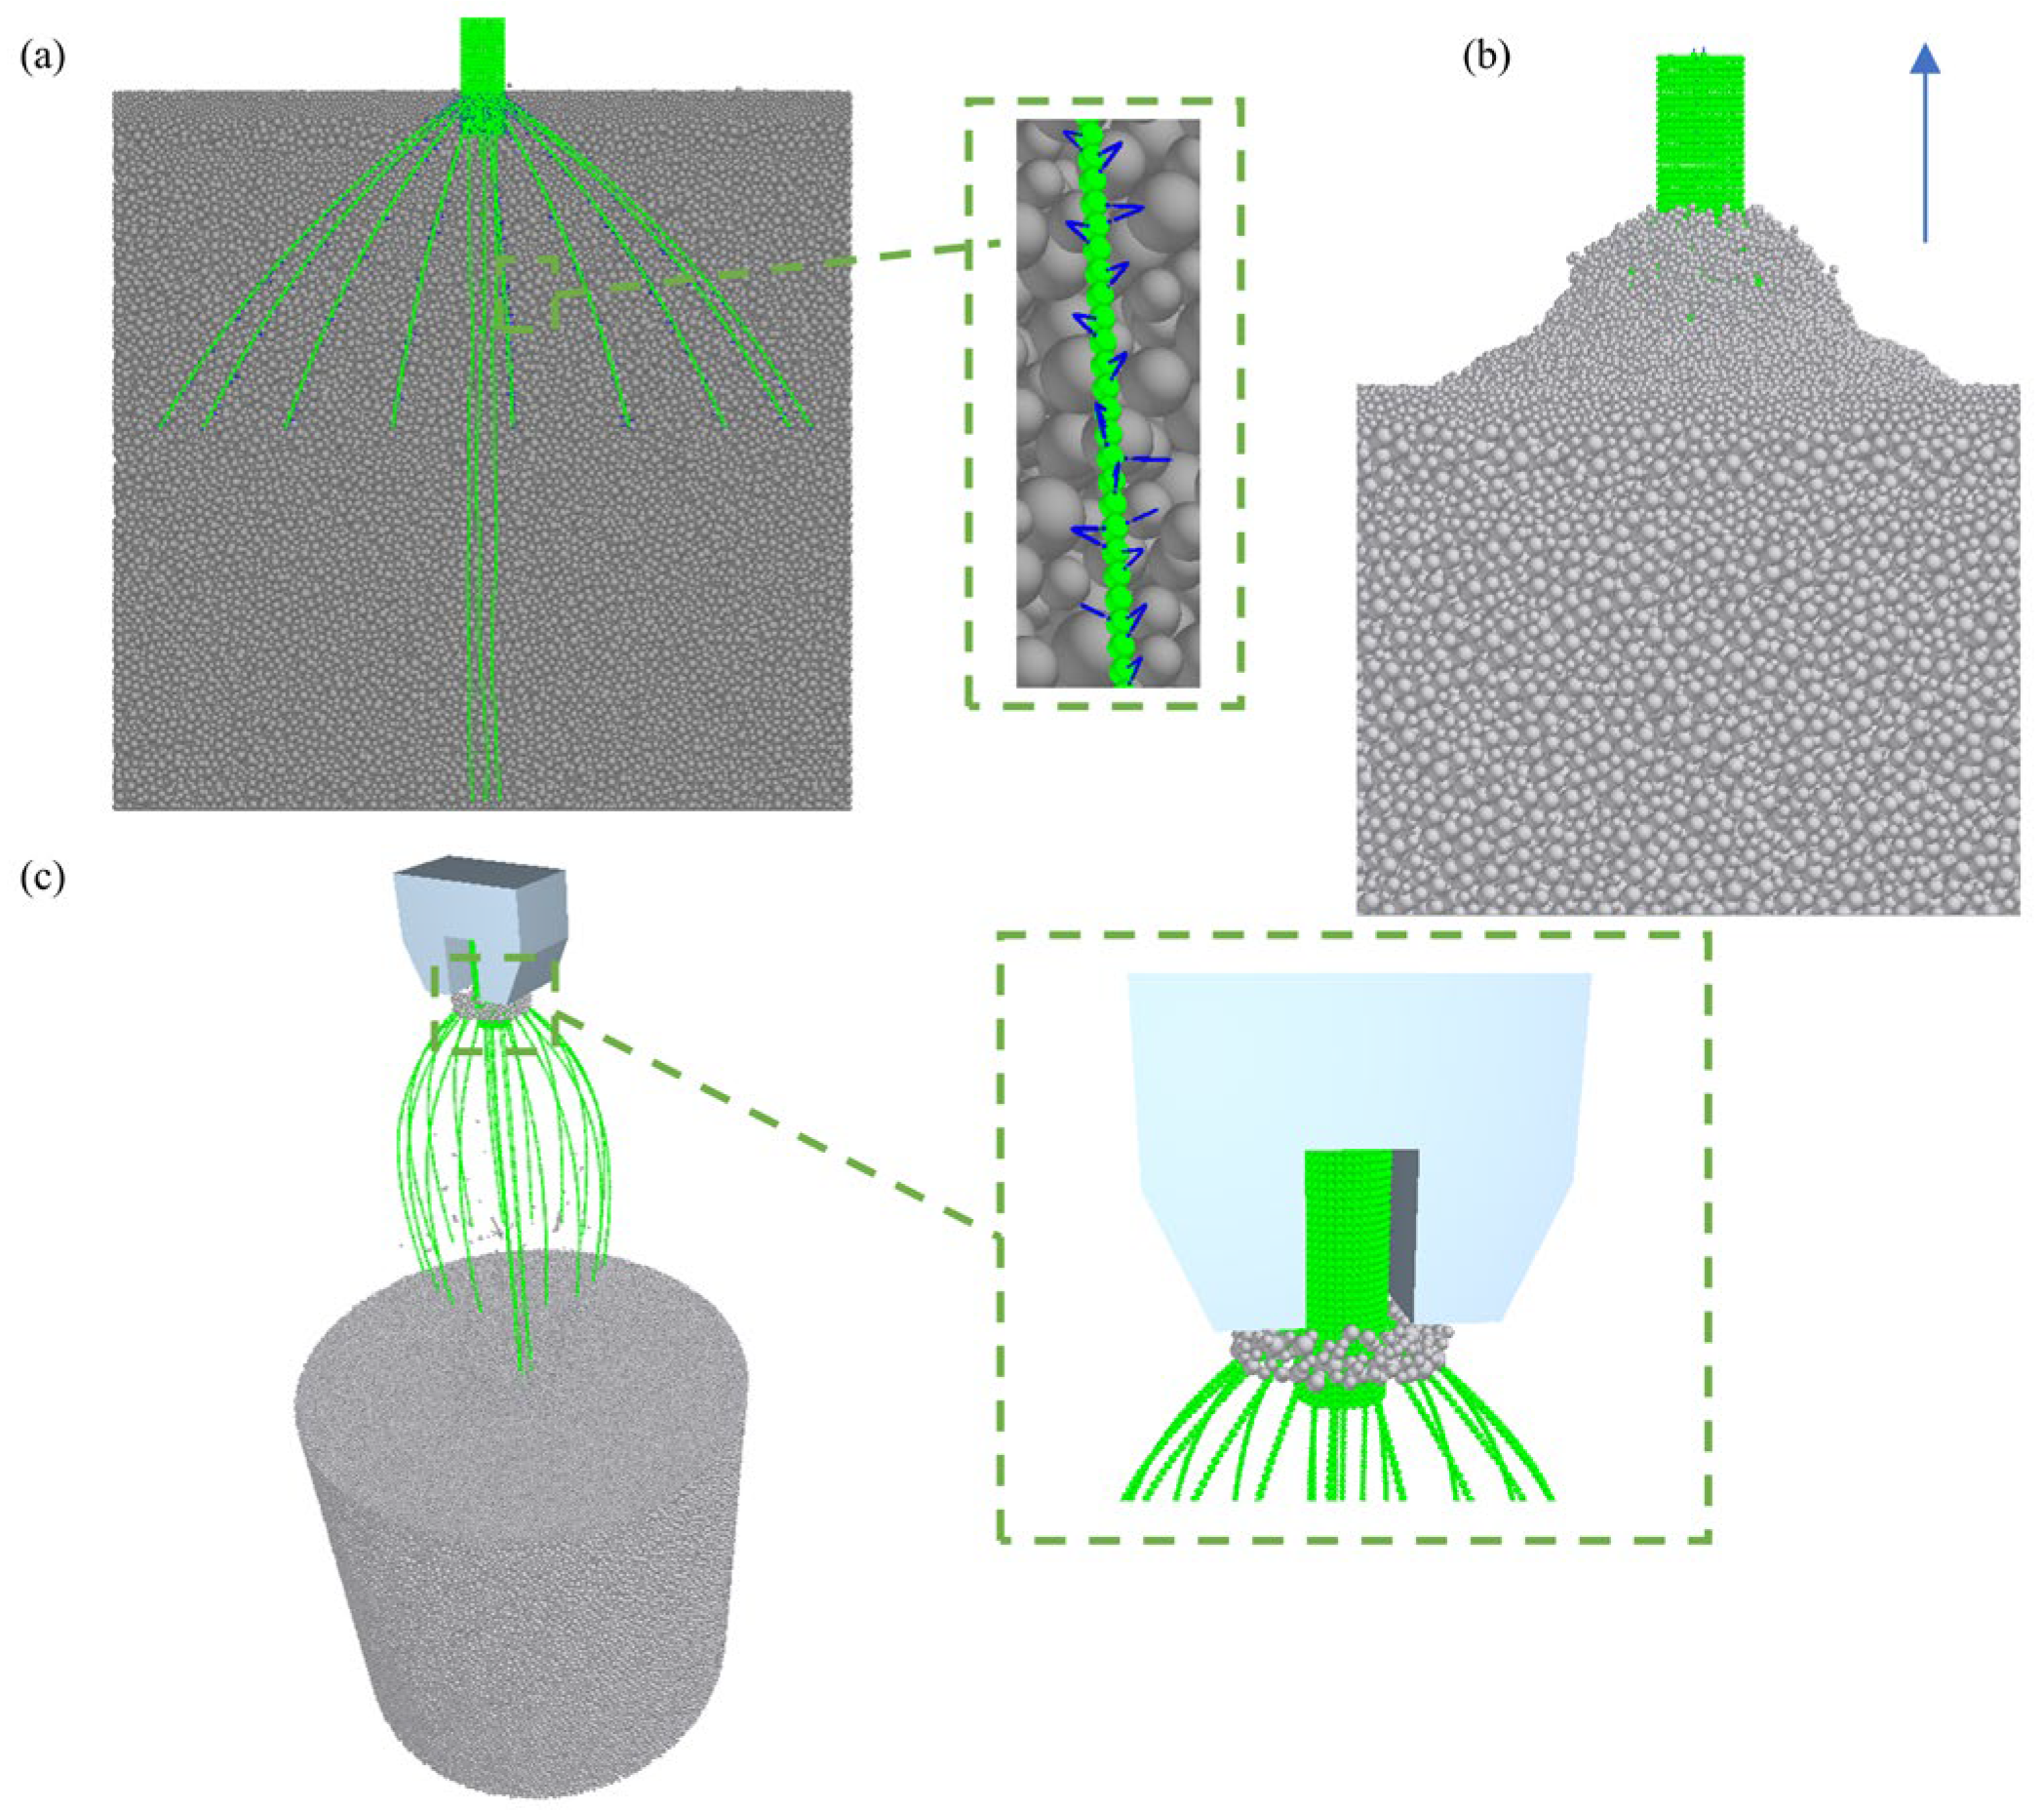
Figure 15.
Simulation study of root system pull-out in soil: (a) Wheat root-soil complex, (b) Upward pulling, (c) Bonding state of soil and root after complete extraction. Note: the blue arrow indicates the pulling direction, the green structure represents the wheat root system, and the gray mass represents the soil.
Figure 16.
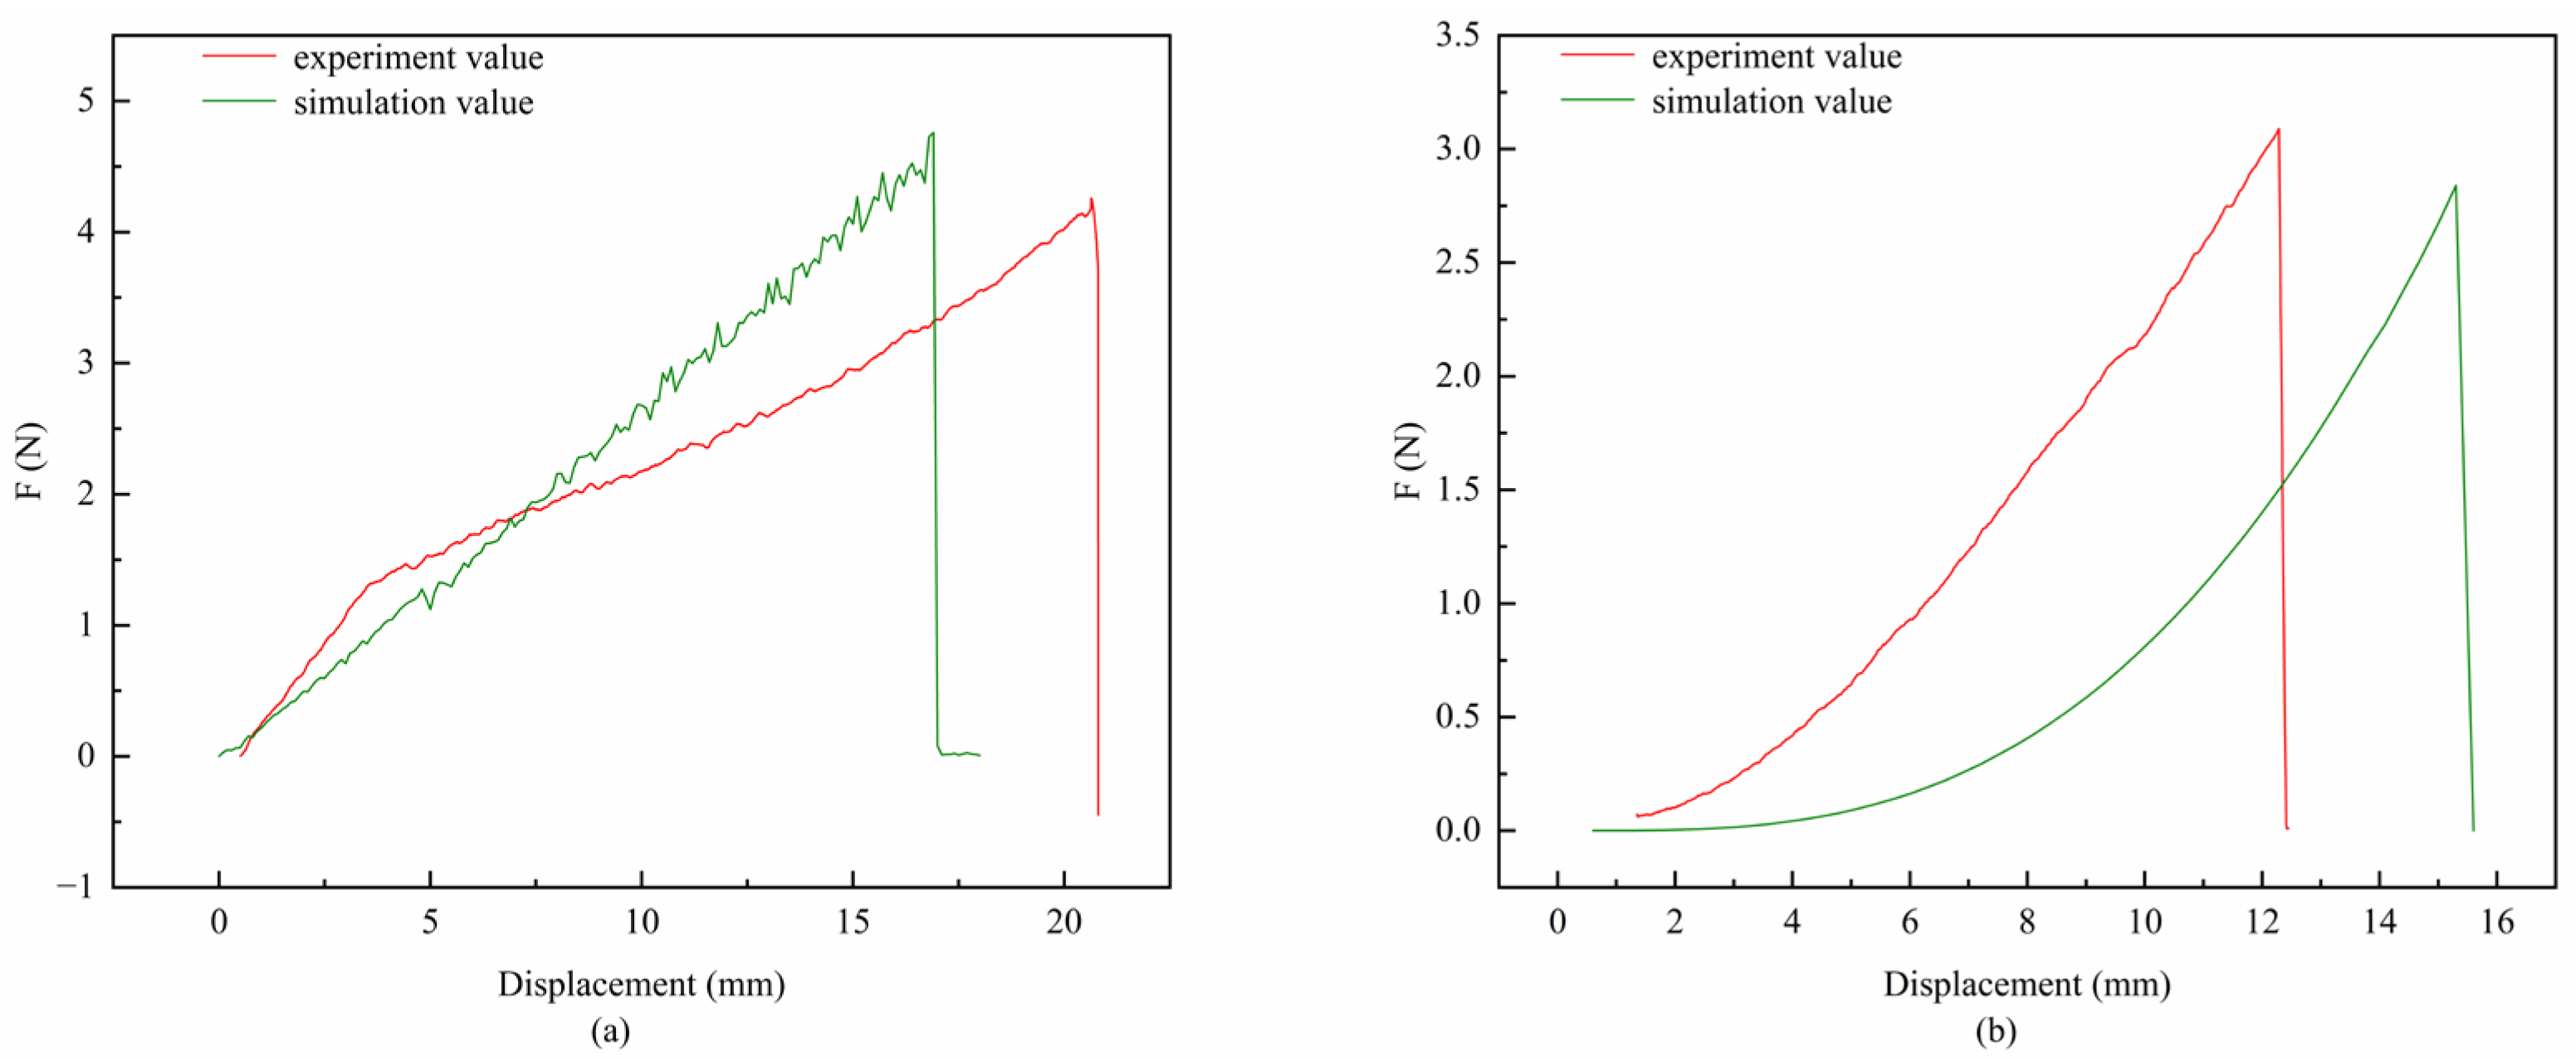
Tensile and shear analysis of a single root through physical and simulation tests: (a) Tensile analysis, (b) Shear analysis.
Figure 16.
Tensile and shear analysis of a single root through physical and simulation tests: (a) Tensile analysis, (b) Shear analysis.
Figure 17.
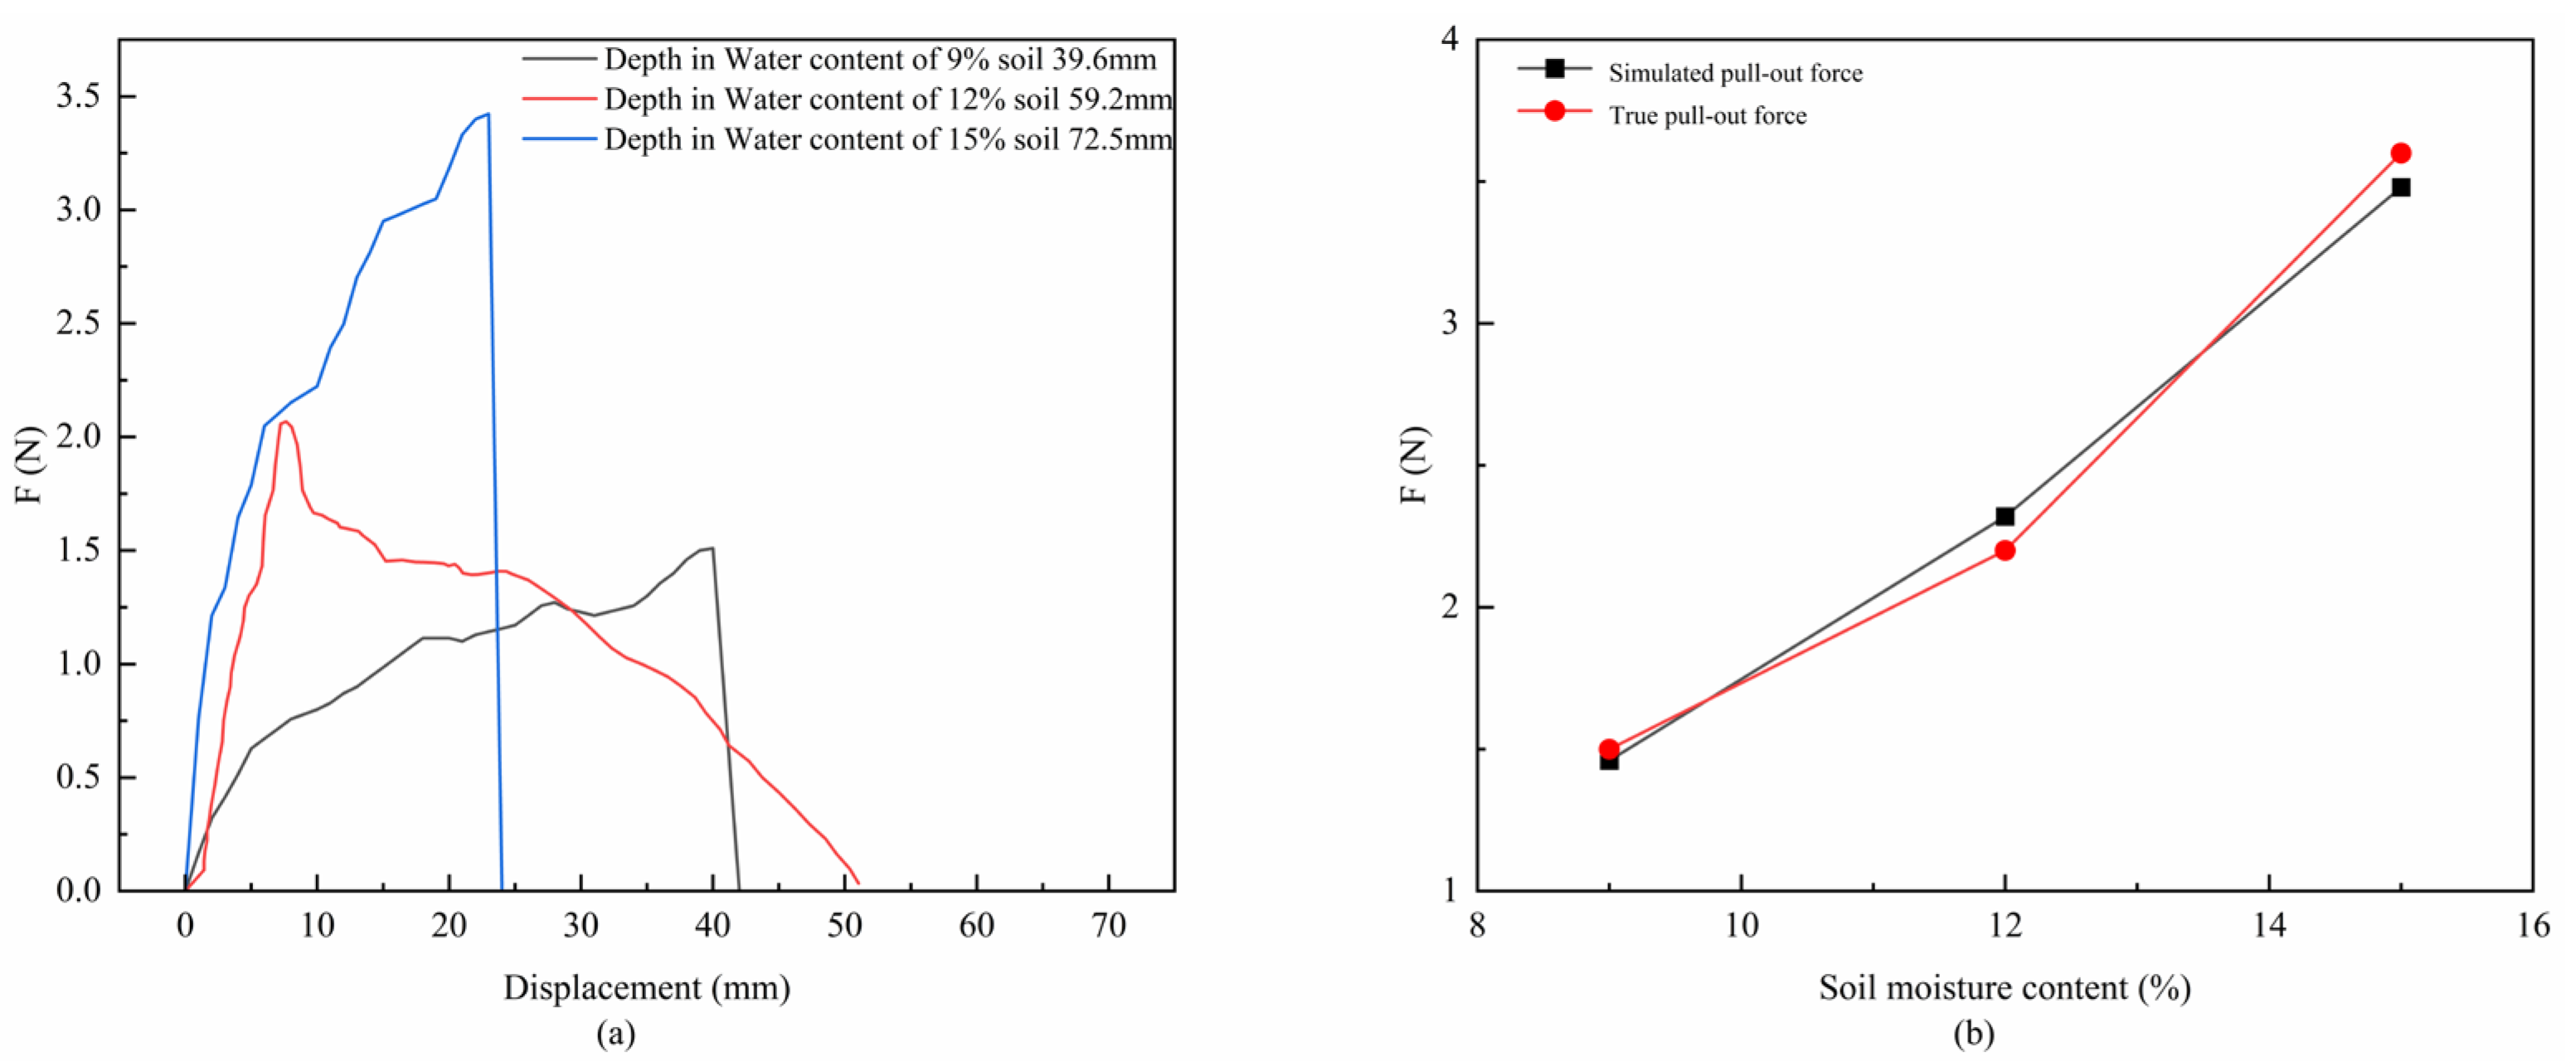
Single root pull-out analysis: (a) Force–displacement curves of actual single root pull-out tests under different soil moisture contents, (b) Comparison of actual and simulated average maximum pull-out force for a single root under different soil water contents.
Figure 17.
Single root pull-out analysis: (a) Force–displacement curves of actual single root pull-out tests under different soil moisture contents, (b) Comparison of actual and simulated average maximum pull-out force for a single root under different soil water contents.
Figure 18.
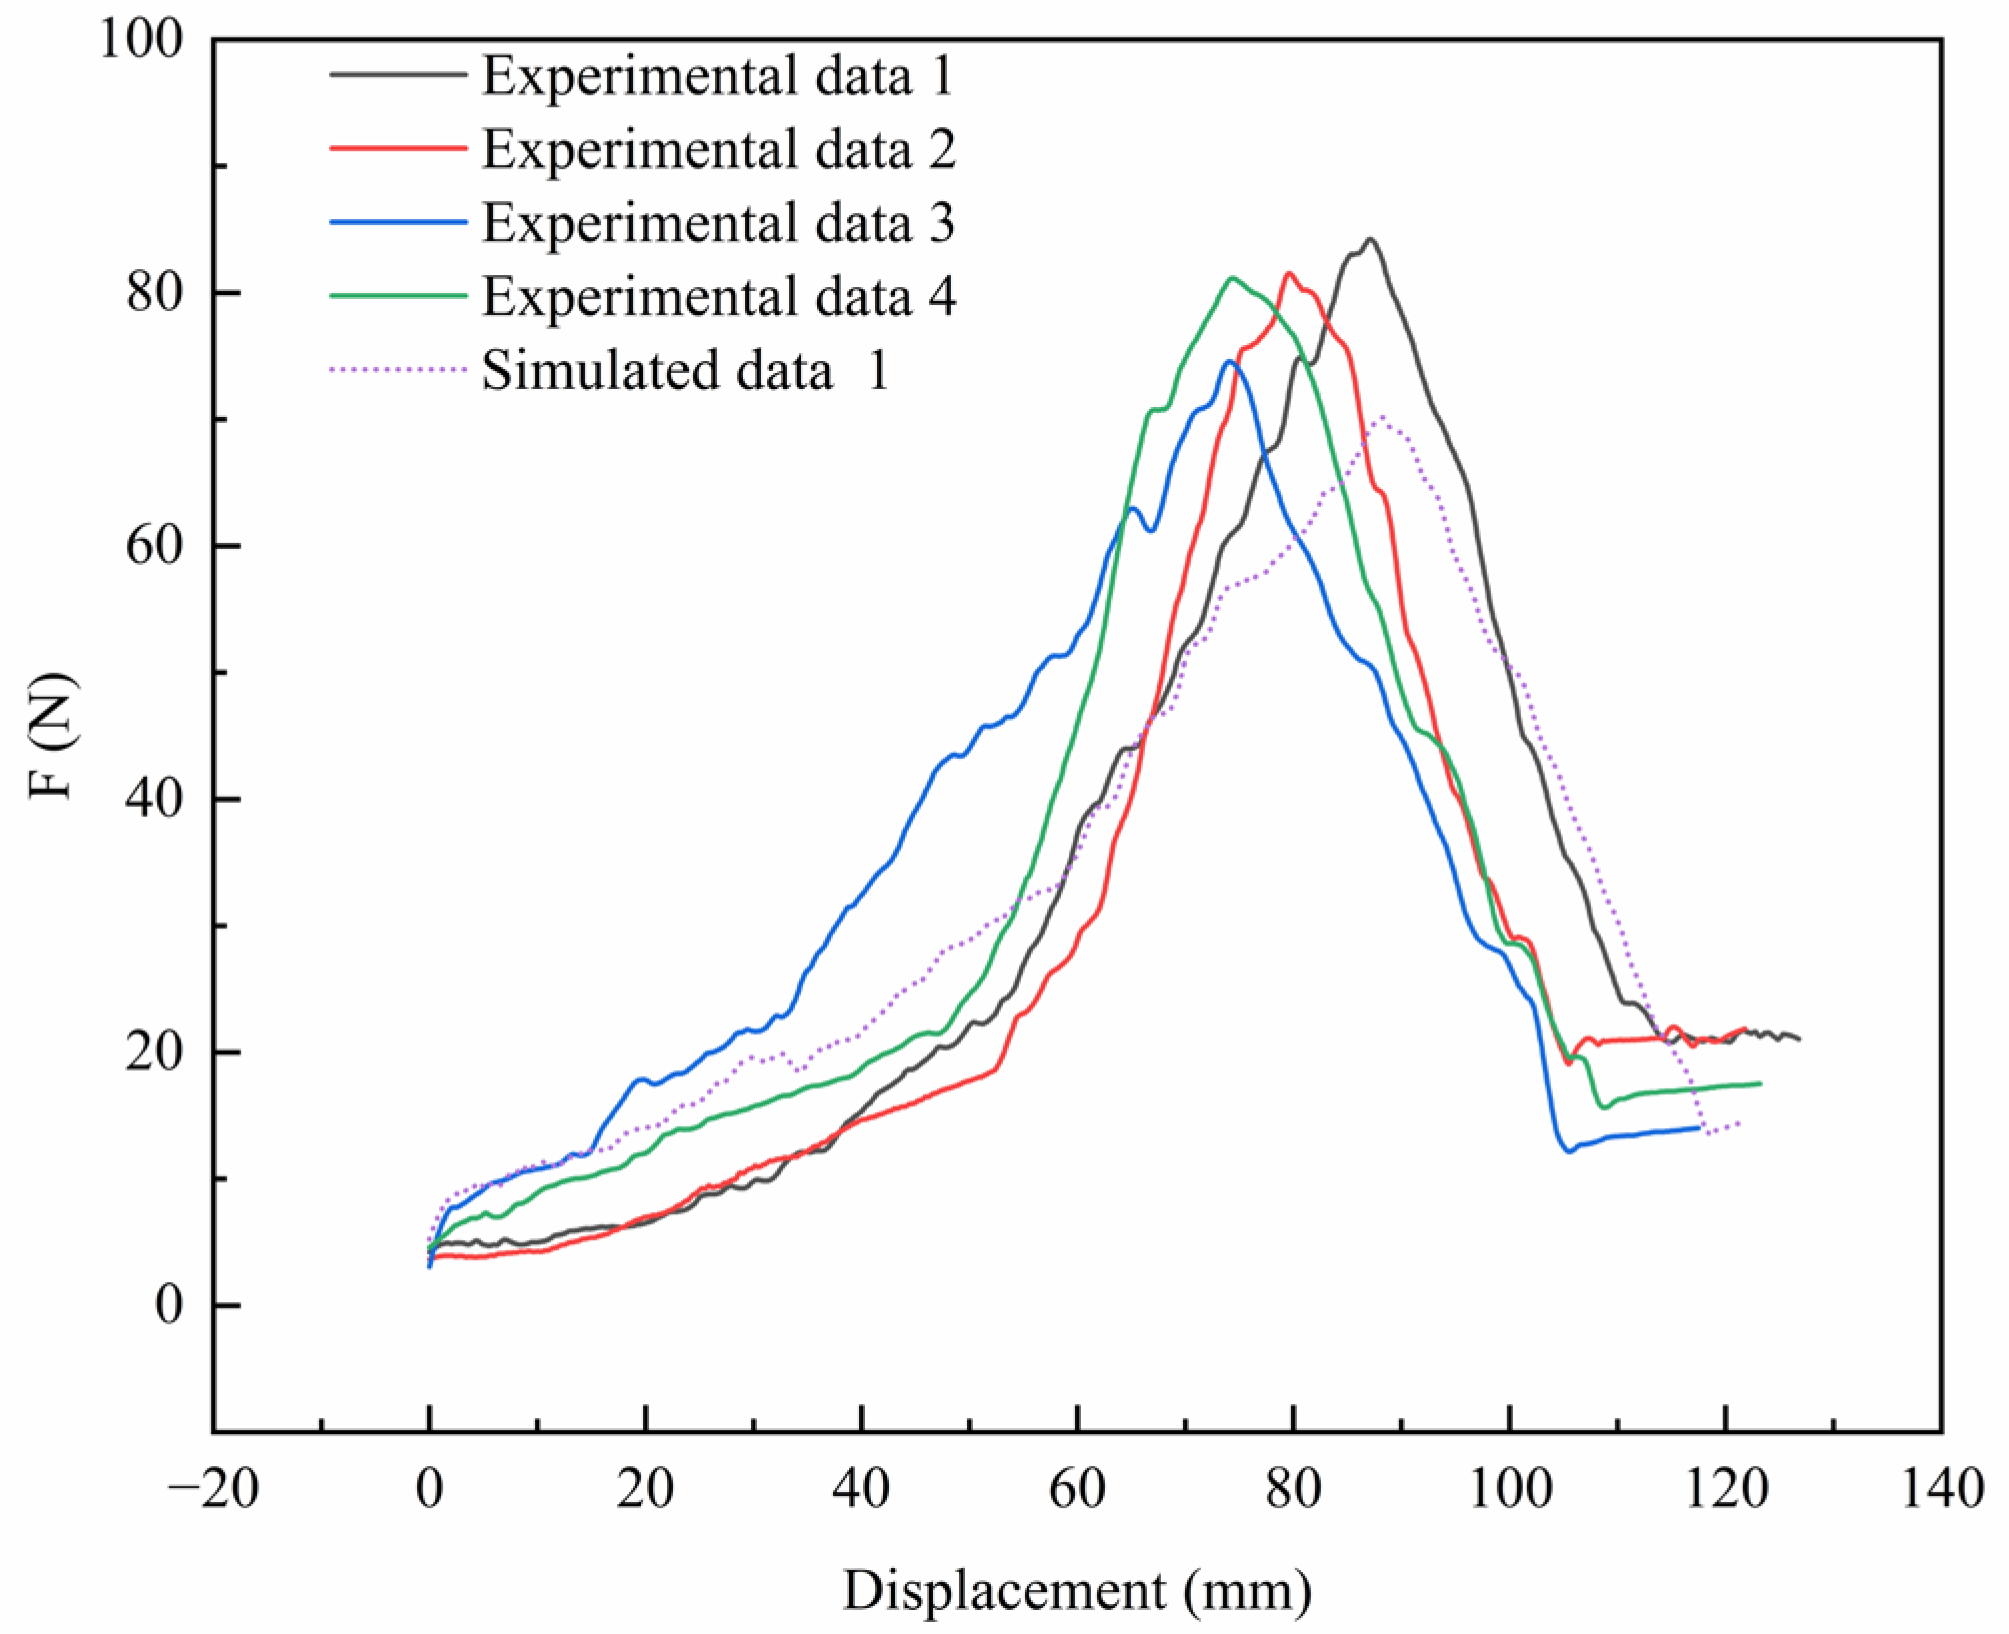
Analysis of root system pull-out simulation results in soil.
Figure 18.
Analysis of root system pull-out simulation results in soil.
Table 1.
Parameters for modeling the root system of winter wheat.
Table 1.
Parameters for modeling the root system of winter wheat.
| Class | Diameter/mm | Number | Depth in Soil/mm | Angle in Soil/° |
|---|
| Primary root | 0.8 ± 0.1 | 4.0 ± 1 | 168.8 ± 2 | 0.0 ± 5 |
| Secondary root | 1.0 ± 0.1 | 15.0 ± 1 | 112.8 ± 2 | 45.0 ± 1 |
Table 2.
Soil particle size ratio.
Table 2.
Soil particle size ratio.
| Particle size distribution | >9 mm | 9–5 mm | 5–3 mm | 3–1 mm | <1 mm |
| Ratio | 8.5% | 13.9% | 18.6% | 50.3% | 8.7% |
Table 3.
Basic physical properties of wheat roots and soil.
Table 3.
Basic physical properties of wheat roots and soil.
| Targets | Density (kg/m3) | Moisture Content (%) |
|---|
| Root | 358.6 ± 1.0 | 46.2 ± 0.5 |
| Soil | 2750.0 ± 1.0 | 9.0 ± 0.5~15.0 ± 0.5 |
Table 6.
Soil and steel simulation parameters.
Table 6.
Soil and steel simulation parameters.
| Parameters | Scope | Source |
|---|
| Soil Density (kg·m−3) | 2.75 × 10³ | Calibration |
| Soil Poisson’s ratio | 0.38 | [37] |
| Soil Shear modulus (Pa) | 1.15 × 10⁷ | [31,37] |
| Coefficient of restitution (Soil to Soil) | 0.1–0.5 | Demanding Calibration |
| Coefficient of static friction (Soil to Soil) | 0.2~0.7 | Demanding Calibration |
| Coefficient of rolling friction (Soil to Soil) | 0.1~0.4 | Demanding Calibration |
| Coefficient of restitution (Soil to steel) | 0.33 | [31] |
| Coefficient of static friction (Soil to steel) | 0.47 | Calibration |
| Coefficient of rolling friction (Soil to steel) | 0.26 | Calibration |
| Surface energy coefficients (J·m−2) | 0.25~1.5 | Demanding Calibration |
Table 7.
Simulation test factors and levels for soil accumulation angle.
Table 7.
Simulation test factors and levels for soil accumulation angle.
| Level | Surface
Energy Coefficients (J/m2) X1 | Coefficient of Restitution
X2 | Coefficient of Static Friction
X3 | Coefficient of Rolling Friction
X4 |
|---|
| −1 | 0.25 | 0.1 | 0.2 | 0.1 |
| 0 | 0.875 | 0.3 | 0.45 | 0.25 |
| 1 | 1.5 | 0.5 | 0.7 | 0.4 |
Table 8.
Ultimate stress and modulus of elasticity of single roots of different diameters.
Table 8.
Ultimate stress and modulus of elasticity of single roots of different diameters.
| Diameter/mm | Tensile Ultimate
Stress/kPa | Shear Ultimate
Stress/kPa | Elastic
Modulus/kPa |
|---|
| 0.8 | 5.85 × 10³ | 4.28 × 10³ | 4.4 × 10⁵ |
| 1 | 6.41 × 10³ | 5.6 × 10³ | 7.7 × 10⁵ |
Table 9.
Comparison of Physical Angle of Repose and Simulated Angle of Repose for Wheat Root Segments.
Table 9.
Comparison of Physical Angle of Repose and Simulated Angle of Repose for Wheat Root Segments.
| Measurement | Physical AOR (°) | Simulated AOR (°) | Relative Error (%) |
|---|
| First | 41.9 | 39.3 | 6.62 |
| Second | 44.3 | 42.5 | 4.24 |
| Third | 40.1 | 38.8 | 3.35 |
| Fourth | 44.8 | 41.7 | 7.43 |
| Fifth | 39.7 | 36.7 | 8.17 |
| Mean (n = 5) | 42.2 | 39.8 | 6.03 |
Table 10.
Plackett–Burman tensile test results.
Table 10.
Plackett–Burman tensile test results.
| Kn | Kt | Kn2 | Kt2 | Rr | φ | Maximum Tension/N |
|---|
| +1 | +1 | −1 | −1 | −1 | −1 | 3.18 |
| +1 | +1 | −1 | +1 | +1 | −1 | 3.15 |
| +1 | +1 | +1 | −1 | −1 | +1 | 11.15 |
| −1 | +1 | +1 | +1 | −1 | +1 | 6.82 |
| +1 | −1 | −1 | −1 | +1 | +1 | 3.15 |
| −1 | −1 | −1 | −1 | −1 | +1 | 1.62 |
| −1 | +1 | +1 | −1 | +1 | −1 | 5.93 |
| +1 | −1 | +1 | +1 | −1 | −1 | 6.87 |
| −1 | +1 | −1 | +1 | +1 | +1 | 3.46 |
| −1 | −1 | +1 | −1 | +1 | −1 | 3.86 |
| +1 | −1 | +1 | +1 | +1 | +1 | 6.92 |
| −1 | −1 | −1 | +1 | −1 | −1 | 1.62 |
Table 11.
Significance analysis of the results of the Plackett–Burman test for root bonding parameters.
Table 11.
Significance analysis of the results of the Plackett–Burman test for root bonding parameters.
| Source | Sum of Squares | df | Mean Square | F-Value | p-Value | R2 | Adjusted R2 |
|---|
| Model | 79.63 | 6 | 13.27 | 11.44 | 0.0086 | 0.9321 | 0.8506 |
| Kn | 10.29 | 1 | 10.29 | 8.87 | 0.0309 | | |
| Kt | 7.76 | 1 | 7.76 | 6.69 | 0.0491 | | |
| Kn2 | 53.64 | 1 | 53.64 | 46.23 | 0.0010 | | |
| Kt2 | 0.0002 | 1 | 0.0002 | 0.0002 | 0.9898 | | |
| Rr | 1.91 | 1 | 1.91 | 1.65 | 0.2555 | | |
| φ | 6.04 | 1 | 6.04 | 5.20 | 0.0715 | | |
Table 12.
Box–Behnken test factor coding table.
Table 12.
Box–Behnken test factor coding table.
| Level | Kn (N/m3) | Kt (N/m3) | Kn2 (Pa) |
|---|
| −1 | 4.6 × 10¹⁰ | 2.4 × 10⁹ | 3.20 × 10⁶ |
| 0 | 8.3 × 10¹⁰ | 5.5 × 10⁹ | 6.15 × 10⁶ |
| +1 | 1.2 × 10¹¹ | 8.6 × 10⁹ | 9.10 × 10⁶ |
Table 13.
Box–Behnken test results.
Table 13.
Box–Behnken test results.
Serial
Number | Kn | Kt | Kn2 | Fn/N |
|---|
| 1 | −1 | −1 | 0 | 6.86 |
| 2 | +1 | −1 | 0 | 7.49 |
| 3 | −1 | +1 | 0 | 4.58 |
| 4 | +1 | +1 | 0 | 7.42 |
| 5 | −1 | 0 | −1 | 2.78 |
| 6 | +1 | 0 | −1 | 2.88 |
| 7 | −1 | 0 | +1 | 6.28 |
| 8 | +1 | 0 | +1 | 11.68 |
| 9 | 0 | −1 | −1 | 5.73 |
| 10 | 0 | +1 | −1 | 2.98 |
| 11 | 0 | −1 | +1 | 12.16 |
| 12 | 0 | +1 | +1 | 9.26 |
| 13 | 0 | 0 | 0 | 6.36 |
| 14 | 0 | 0 | 0 | 4.99 |
| 15 | 0 | 0 | 0 | 4.32 |
| 16 | 0 | 0 | 0 | 4.83 |
| 17 | 0 | 0 | 0 | 7.42 |
Table 14.
Box–Behnken test ANOVA results.
Table 14.
Box–Behnken test ANOVA results.
| Source | Sum of Squares | df | Mean Square | F-Value | p-Value | R2 | Adjusted R2 |
|---|
| Model | 114.04 | 9 | 12.67 | 10.57 | 0.0026 | 0.9315 | 0.8434 |
| Kn | 10.06 | 1 | 10.06 | 8.39 | 0.0231 | | |
| Kt | 8.00 | 1 | 8.00 | 6.638 | 0.0363 | | |
| Kn2 | 78.19 | 1 | 78.19 | 65.24 | <0.0001 | | |
| KnKt | 1.22 | 1 | 1.22 | 1.02 | 0.3464 | | |
| KnKn2 | 7.02 | 1 | 7.02 | 5.86 | 0.0461 | | |
| Kt Kn2 | 0.0056 | 1 | 0.0056 | 0.0047 | 0.9473 | | |
| Kn2 2 | 0.4099 | 1 | 0.4099 | 0.3420 | 0.5770 | | |
| Kt 2 | 7.29 | 1 | 7.29 | 6.08 | 0.0431 | | |
| Kn2 2 | 1.69 | 1 | 1.69 | 1.41 | 0.2741 | | |
| Residual | 8.39 | 7 | 1.2 | | | | |
| Lack of Fit | 1.90 | 3 | 0.6325 | 0.3897 | 0.7676 | | |
| Pure Error | 6.49 | 4 | 1.62 | | | | |
| Cor Total | 122.43 | 16 | | | | | |
Table 15.
Parameters of the wheat root bonding model.
Table 15.
Parameters of the wheat root bonding model.
| Diameter/mm | Kn (N/m3) | Kt (N/m3) | Kn2 (Pa) | Kt 2(Pa) | Rr (mm) | φ |
|---|
| 0.8 | 4.73 × 10¹⁰ | 6.05 × 10⁹ | 3.52 × 10⁶ | 2.9 × 10⁷ | 0.65 | 1.1 |
| 1.0 | 6.15 × 10¹⁰ | 8.55 × 10⁹ | 5.04 × 10⁶ | 2.9 × 10⁷ | 0.65 | 1.1 |
Table 16.
Experimental design and results of the Box–Behnken simulation of soil accumulation angle.
Table 16.
Experimental design and results of the Box–Behnken simulation of soil accumulation angle.
Serial
Number | X1 | X2 | X3 | X4 | AOR (°) |
|---|
| 1 | −1 | −1 | 0 | 0 | 64.34 |
| 2 | +1 | −1 | 0 | 0 | 52.36 |
| 3 | −1 | +1 | 0 | 0 | 34.76 |
| 4 | +1 | +1 | 0 | 0 | 56.70 |
| 5 | 0 | 0 | −1 | −1 | 60.40 |
| 6 | 0 | 0 | +1 | −1 | 49.30 |
| 7 | 0 | 0 | −1 | +1 | 47.30 |
| 8 | 0 | 0 | +1 | +1 | 35.80 |
| 9 | −1 | 0 | 0 | −1 | 56.17 |
| 10 | +1 | 0 | 0 | −1 | 36.03 |
| 11 | −1 | 0 | 0 | +1 | 37.13 |
| 12 | +1 | 0 | 0 | +1 | 41.74 |
| 13 | 0 | −1 | −1 | 0 | 46.24 |
| 14 | 0 | +1 | −1 | 0 | 28.33 |
| 15 | 0 | −1 | +1 | 0 | 39.03 |
| 16 | 0 | +1 | +1 | 0 | 51.47 |
| 17 | −1 | 0 | −1 | 0 | 59.37 |
| 18 | +1 | 0 | −1 | 0 | 41.93 |
| 19 | −1 | 0 | +1 | 0 | 33.58 |
| 20 | +1 | 0 | +1 | 0 | 32.04 |
| 21 | 0 | −1 | 0 | −1 | 65.90 |
| 22 | 0 | +1 | 0 | −1 | 53.42 |
| 23 | 0 | −1 | 0 | +1 | 33.73 |
| 24 | 0 | +1 | 0 | +1 | 43.63 |
| 25 | 0 | 0 | 0 | 0 | 26.76 |
| 26 | 0 | 0 | 0 | 0 | 52.06 |
| 27 | 0 | 0 | 0 | 0 | 47.71 |
| 28 | 0 | 0 | 0 | 0 | 44.01 |
| 29 | 0 | 0 | 0 | 0 | 61.67 |
Table 17.
Analysis of Variance for Box–Behnken Experiment.
Table 17.
Analysis of Variance for Box–Behnken Experiment.
| Source | Sum of Squares | df | Mean Square | F-Value | p-Value | R2 | Adjusted R2 |
|---|
| Model | 3207.23 | 14 | 299.09 | 13.6 | <0.0001 | 0.9315 | 0.8630 |
| X1 | 939.52 | 1 | 939.52 | 55.78 | <0.0001 | | |
| X2 | 18.83 | 1 | 18.83 | 1.12 | 0.3083 | | |
| X3 | 183.3 | 1 | 183.3 | 10.88 | 0.0053 | | |
| X4 | 1698.61 | 1 | 1698.61 | 100.84 | <0.0001 | | |
| X1X2 | 14.33 | 1 | 14.33 | 0.8505 | 0.3720 | | |
| X1X3 | 0.0729 | 1 | 0.0729 | 0.0043 | 0.9485 | | |
| X1X4 | 1.07 | 1 | 1.07 | 0.0636 | 0.8046 | | |
| X2X3 | 23.62 | 1 | 23.62 | 1.4 | 0.2561 | | |
| X2X4 | 0.3249 | 1 | 0.32496 | 0.0193 | 0.8915 | | |
| X3X4 | 27.25 | 1 | 27.25 | 1.62 | 0.2241 | | |
| X12 | 1.14 | 1 | 1.14 | 0.0679 | 0.7982 | | |
| X22 | 28.43 | 1 | 28.43 | 1.69 | 0.2149 | | |
| X32 | 194.07 | 1 | 194.07 | 11.52 | 0.0044 | | |
| X42 | 42.81 | 1 | 42.81 | 2.54 | 0.1332 | | |
| Residual | 235.82 | 14 | 16.84 | | | | |
| Lack of Fit | 215.78 | 10 | 21.58 | 4.31 | 0.0860 | | |
| Pure Error | 20.03 | 4 | 5.01 | | | | |
| Cor Total | 3443.04 | 28 | | | | | |
Table 18.
Calibration results for soil parameters.
Table 18.
Calibration results for soil parameters.
Soil Moisture
Content/% | Surface
Energy | Coefficient of Static Friction | Coefficient of Static Friction | Coefficient of Rolling Friction |
|---|
| 9.0 ± 0.5 | 0.67 | 0.54 | 0.54 | 0.11 |
| 12.0 ± 0.5 | 0.98 | 0.33 | 0.33 | 0.18 |
| 15.0 ± 0.5 | 1.32 | 0.36 | 0.40 | 0.21 |

