Article

Experiment and Calibration of Finite Element Parameters of Pineapple Based on Cohesive Zone Model

1
School of Mechanical and Automotive Engineering, South China University of Technology, Guangzhou 510641, China
2
Agricultural Machinery Research Institute, Chinese Academy of Tropical Agricultural Sciences, Zhanjiang 524013, China
3
Key Laboratory of Tropical Agricultural Machinery, Ministry of Agriculture and Rural Affairs, Zhanjiang 524091, China
4
National Key Laboratory of Agricultural Equipment Technology, South China Agricultural University, Guangzhou 510642, China
*
Authors to whom correspondence should be addressed.
These authors contributed equally to this work.
Agriculture 2025, 15(23), 2422; https://doi.org/10.3390/agriculture15232422
Submission received: 13 October 2025 / Revised: 3 November 2025 / Accepted: 18 November 2025 / Published: 25 November 2025
(This article belongs to the Section Agricultural Technology)

Abstract

In view of the lack of research on the extrusion of pineapple caused by the overall stress response of pineapple at the present stage of pineapple automatic harvesting, the finite element model of pineapples can be studied by constructing such a model. At present, there is still a lack of research on the mechanical properties of the pineapple stem. In this research, the mechanical properties of a pineapple stem were determined by a three-point bending test, a compression test, and a theoretical calculation. Based on the cohesive zone model (CZM), the relevant parameters of the pineapple fruit–stem junction were determined by the fracture test. The overall finite element model of pineapple was established, and then the verification test of the finite element model was carried out. In the validation test, the correlation between sample size parameters and results was analyzed, and the validity of the test sample selection was demonstrated. By substituting the simulation results into the derivation formula, the maximum traction strength and maximum displacement error values were calculated to be 4.3% and 2.9%, respectively, which verified the accuracy of the cohesive zone model parameters. By comparing the maximum load force and load displacement of the load point in the test and simulation, the error of the load force at the fracture point relative to the average value was 3.6%, and the error of the load displacement relative to the average value was 1.4%. The numerical results showed that the model reflected the accuracy of the process of pineapple plant fracture. This study provides a reliable finite element model for future research on pineapple automatic harvesting.

1. Introduction

As a tropical economic crop, pineapples are widely cultivated around the world. According to the World Food and Agriculture Organization (FAO) data, the planting area for pineapples reached 1.0555 million hectares in 2023, and the total output exceeded 29.6366 million tons. In the past two years, the global export volume of pineapples has reached more than 3 million tons. Among them, the total export volume in 2024 reached 3.3 million tons, an increase of 120,000 tons from the previous year [1]. According to this development trend, it is evident that the pineapple planting industry plays an important role in the global economy and trade.
Harvesting is the key link of pineapple production. At present, fruit harvesting still relies on manual operation. Pineapple automatic harvesting equipment is still in the stage of theoretical and experimental research. At present, most of the research on the automatic harvesting of pineapple is aimed at the identification and positioning of pineapple fruit [2,3,4,5] and the structural design of a pineapple harvesting machine itself [6,7,8,9,10]. However, there is a lack of research on the response of pineapple to the action of the harvesting mechanism as a whole. In particular, the lack of mechanical characteristic parameters of the stem of the pineapple and the brittle separation layer at the junction of stem and fruit, which is extremely thin, make it difficult to measure its characteristic parameters. The existing research on harvesting mechanisms only considers the problem of fruit harvesting without damage; it ignores the research on the fracturing of stems in the harvesting process, and lacks a protection strategy for the whole pineapple plant. By constructing the finite element model of the whole pineapple plant, the response of the whole pineapple plant under different harvesting methods can be studied, which can guide the optimal design of the efficient and non-destructive harvesting mechanism of pineapple fruit and realize the protection of pineapple stem and offspring buds.
The algorithm and visualization function of the finite element model have enhanced the application of finite element analysis biomechanics and prove its effectiveness in the study of damage prediction and dynamic response processes [11]. In order to establish the finite element model, it is necessary to measure and obtain the mechanical characteristic parameters of each component and clarify the method of model construction. The finite element study of pineapple mainly focuses on the construction of the finite element model of pineapple fruit and lacks the study of the mechanical properties of the fruit stem and its response under different harvesting actions during harvesting. For the whole field of agricultural materials, many scholars have studied this. In terms of obtaining the mechanical properties of materials, Li et al. (2023) [12] measured the characteristic parameters related to the fracture of the pineapple fruit stem by designing a pineapple plant fixation and torsion test bench, and analyzed the fracture mechanism. Xue et al. (2024) [13] measured the mechanical properties of different varieties of pineapple fruit by using a universal test bench. Carter et al. (2024) [14] proposed a test method for obtaining the longitudinal shear modulus of dry corn stalks by means of laser measurement and image segmentation, which also has certain applicability for the measurement of material characteristic parameters of cylindrical plant tissues such as sugarcane and sorghum. Liu et al. (2015) [15] measured 12 elastic parameters of larch wood by electro-shrinkage method. In addition, with the help of a universal test bench, Li et al. (2023) [16] measured the mechanical properties of passion fruit vines, Wang et al. (2018) [17] determined the mechanical properties of fresh corn straw, Al-Zube et al. (2018) [18] determined the elastic modulus of corn stalk, Liu et al. (2018) [19] determined the elastic modulus of citrus wood, Shi (2018) [20] determined the mechanical properties of each component of cotton stalk, Hu (2020) [21] determined the mechanical properties of apple stem, and Li et al. (2023) [22] determined the parameters of green Sichuan pepper strips by three-point bending test to construct a finite element model. In the aspect of finite element model construction method, Ji et al. (2019) [23] analyzed the damage state of apple fruit during the grasping interaction during harvesting process by establishing the viscoelastic finite element model of the apple. Li et al. (2013) [24] predicted the mechanical damage of tomato fruit during extrusion at multiple scales by constructing a finite element model of tomato with multi-ovary structure. Yousefi et al. (2016) [25] studied the drop damage of pear fruit at different heights and different postures by constructing the finite element model of pear fruit. Most of these studies only consider the prediction and analysis of fruit damage, while there are few studies on branches, stems, and other parts. Based on the cohesive zone model, Bu et al. (2021) [26] proposed a finite element model construction method for the fruit–stem–branch connection of apples and studied the fracture behavior of apple fruits separated from stems in response to external forces. The method of obtaining the mechanical properties of the above materials and constructing the finite element model can provide a reference for the construction of the finite element model of pineapples. However, the existing research on pineapple mainly focuses on pineapple fruit, and the characteristic parameters of the pineapple stem and the brittle separation layer at the stem–fruit junction need to be further studied.
Overall, existing research mainly focuses on the design of harvesting mechanisms, and studies on crop attributes generally only consider the properties of the fruit. In the case of pineapples, current research lacks studies on the relevant attributes of components other than the pineapple fruit.
Based on the determination of the finite element constitutive parameters of the pineapple stem, this study proposes a finite element model construction method of the brittle stem–fruit separation layer of the pineapple based on a cohesive force model. Through the calibration and verification of finite element parameters, the finite element model of the brittle stem–fruit separation layer of the pineapple is established to intuitively predict the fracture response of the stem during harvesting. This enables the exploration of the extrusion of pineapple by different picking actions and provides a reference for the design of pineapple harvesting robots in the future. This study fills the gap in existing research on the mechanical characteristic parameters of pineapple peduncles and investigates the properties of the brittle separation layer in mature pineapples.

2. Test Materials and Methods

2.1. Material Collection

The sample was taken from Xuwen, Guangdong, China, and the sample variety was Tainong 16. The test samples were selected from plants with a normal growth and maturity of C2 (yellow fruit surface accounted for 25–50% [7]).

2.2. Analysis of Structure Composition of Pineapple

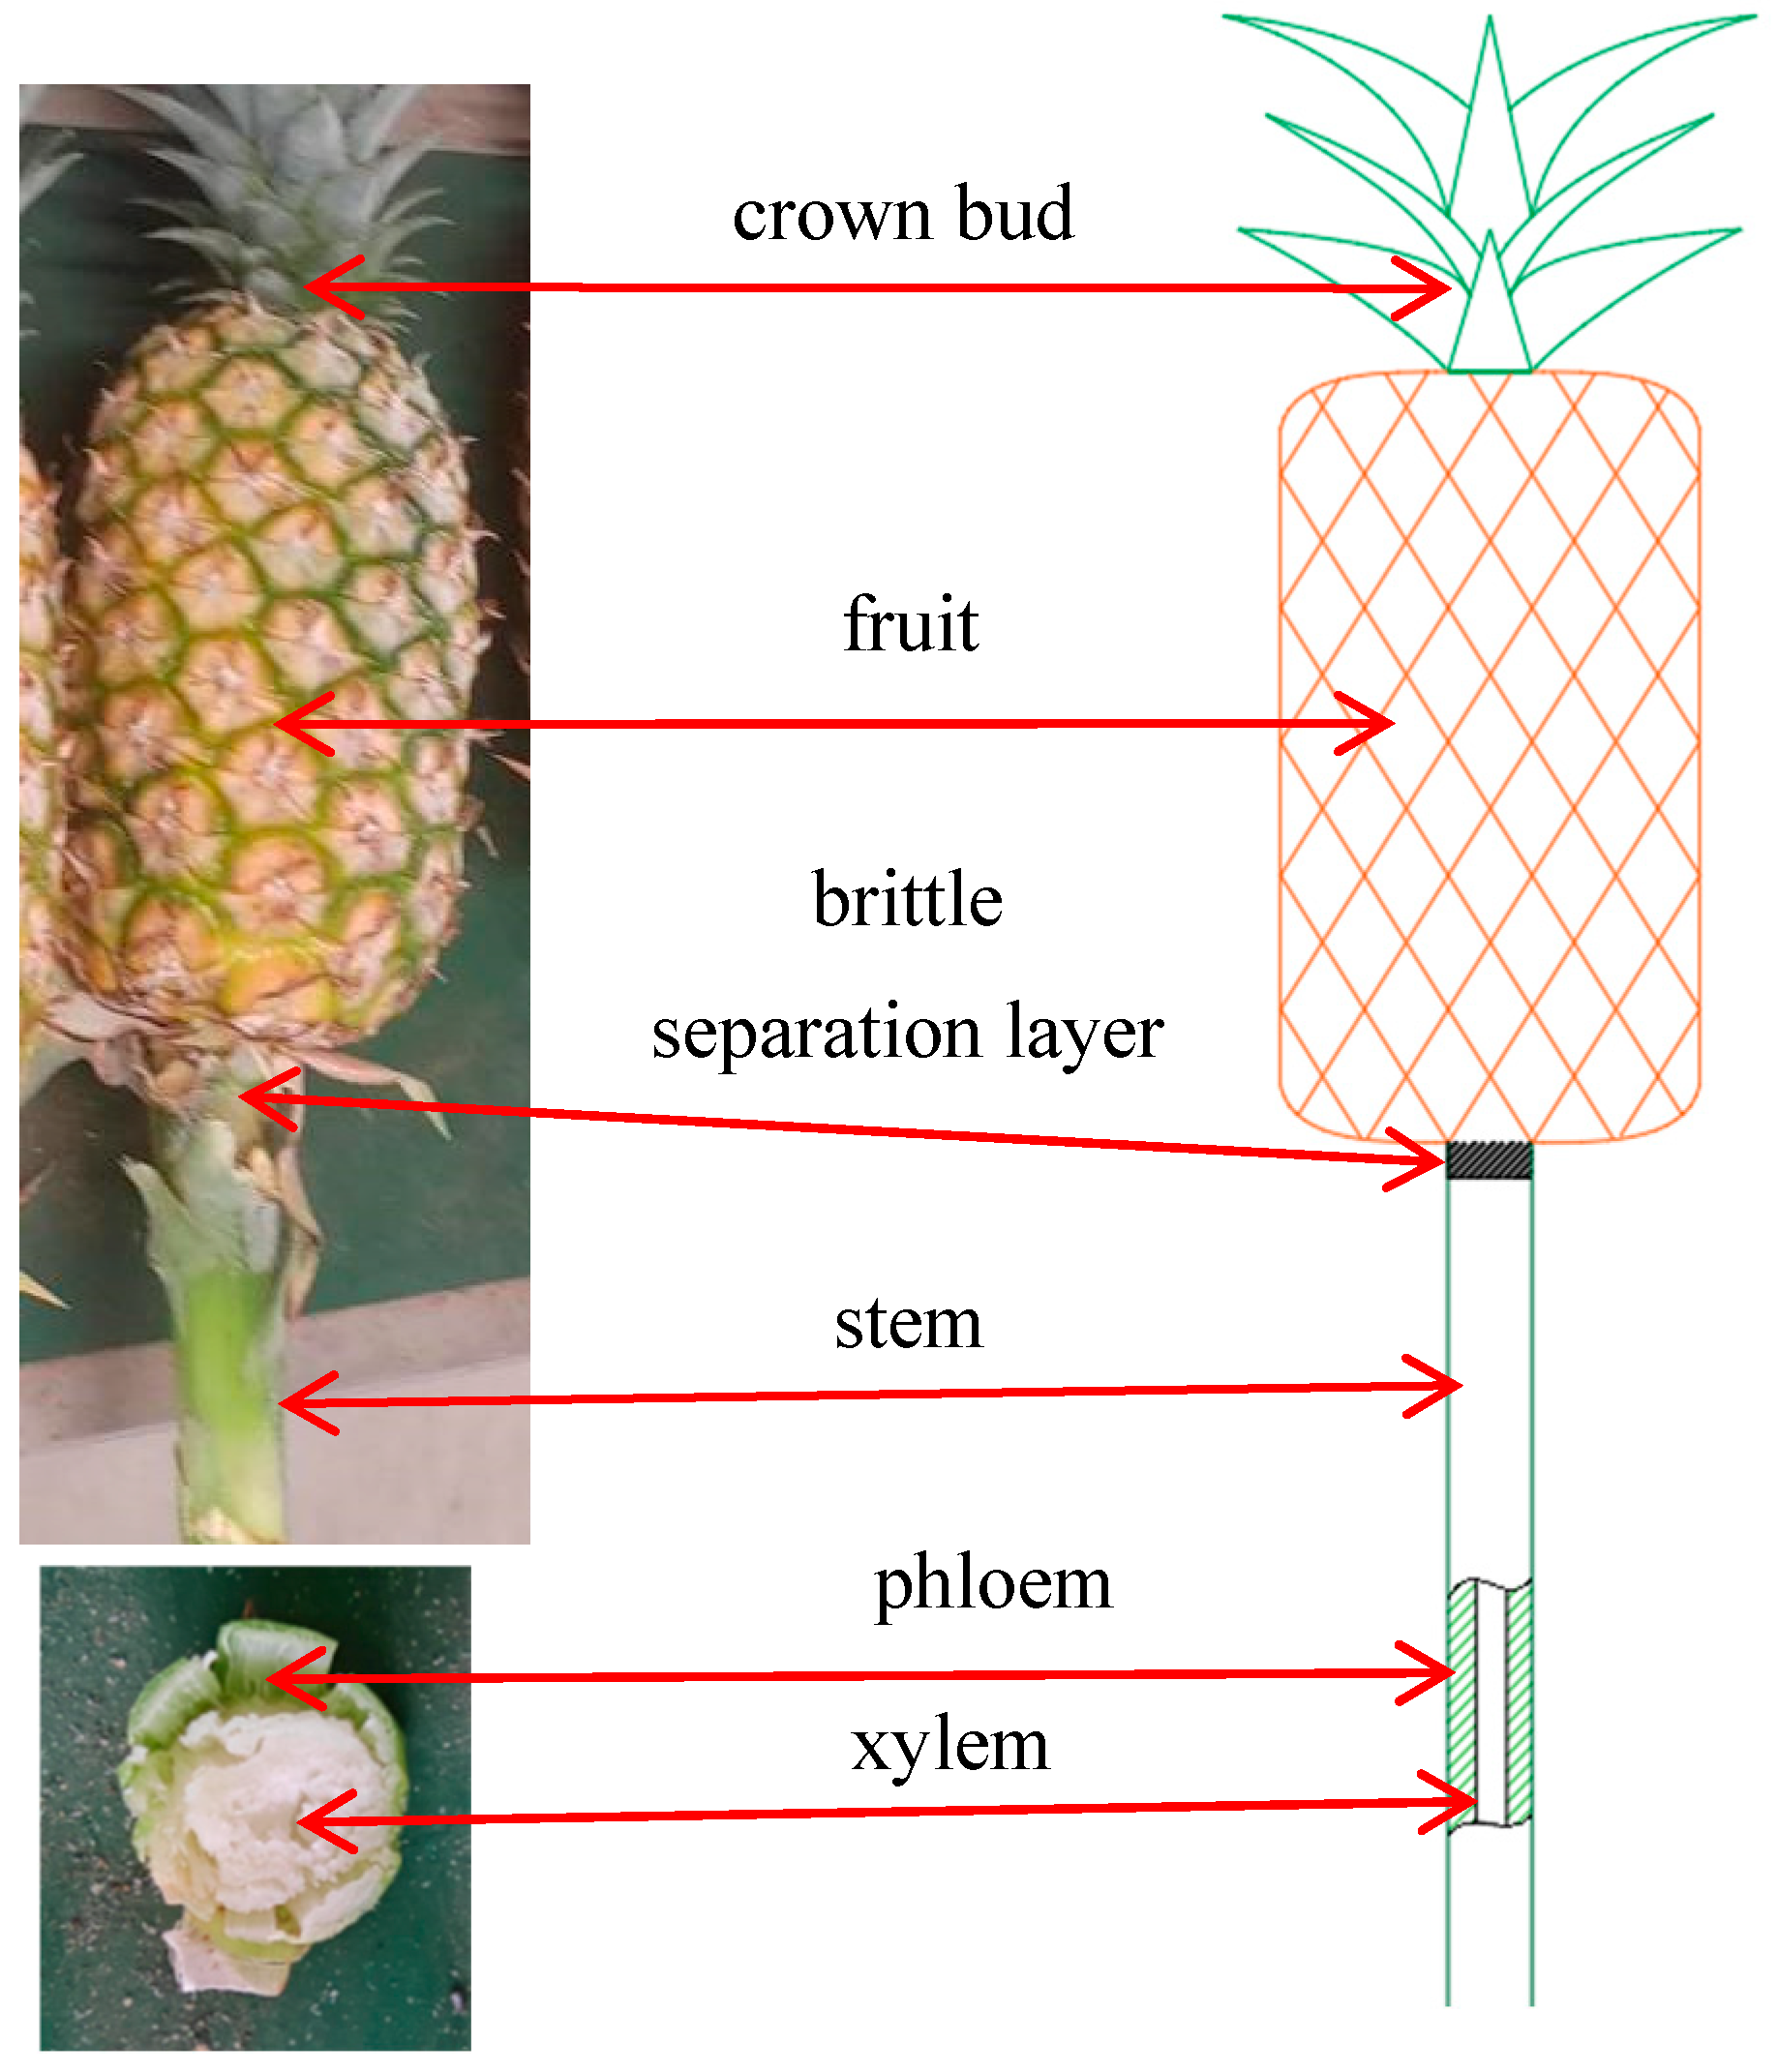
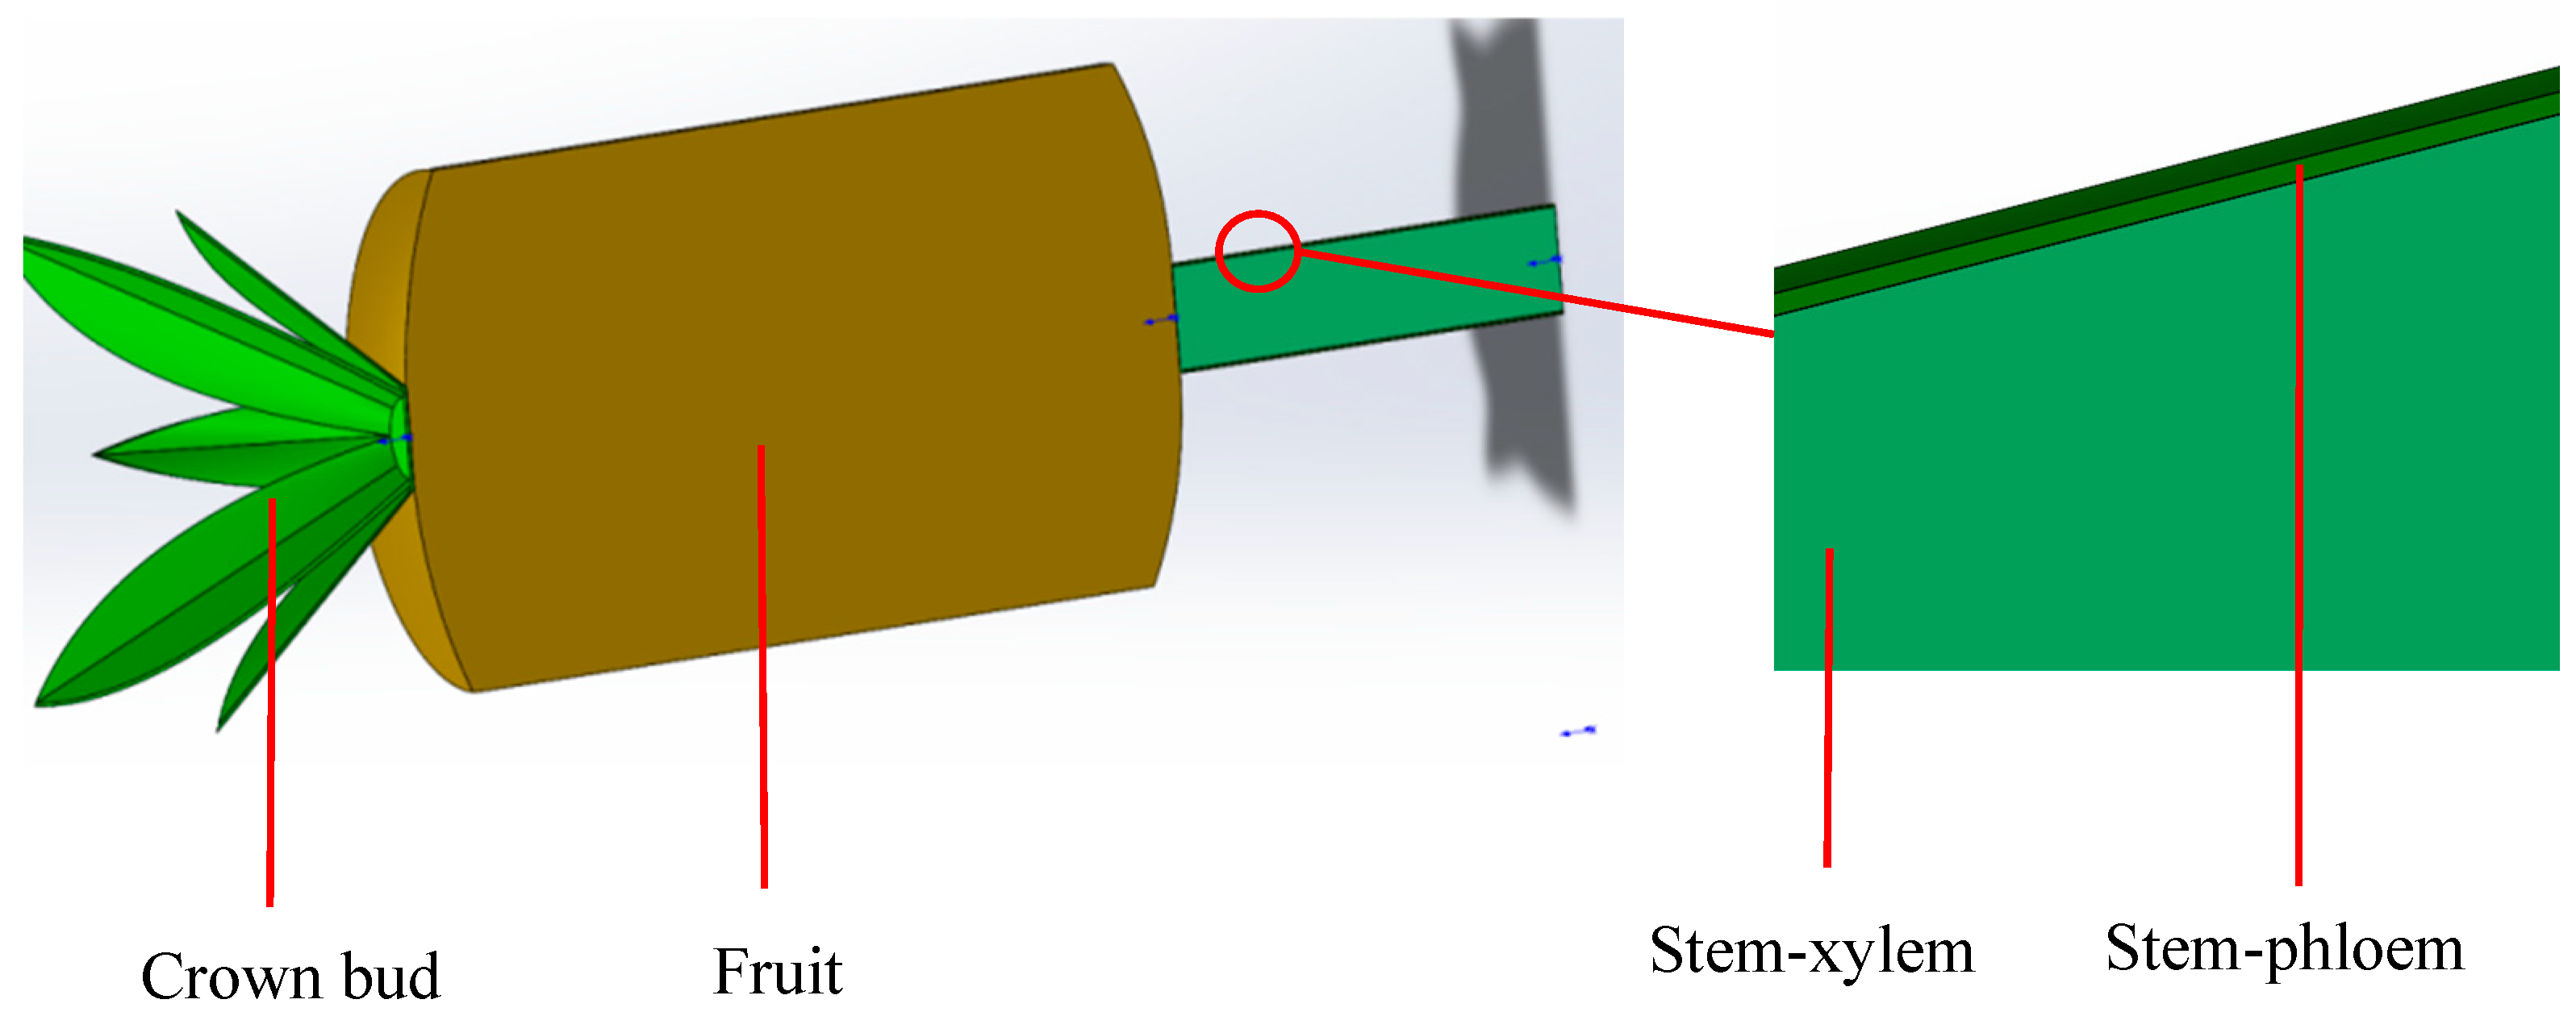
The pineapple is composed of the crown bud, fruit, stem, offspring bud, and leaf, as shown in Figure 1. The fruit stem is composed of phloem and xylem. After the fruit enters the mature period, the stem will gradually age, and its cell wall will gradually become thinner and fragile. In addition, the fruit will produce ethylene, which will not only stimulate the fruit to accelerate maturity, but will also accelerate the aging process of the stem, making the connection between the fruit and the stem become fragile, diminishing its toughness, and forming a brittle separation layer. Therefore, in the mature period of the pineapple, the brittle separation layer is also an important part of the pineapple. In the modeling of pineapples, the main part of force during harvesting is mainly considered. Hence, the stem, brittle separation layer, and fruit are chosen as the primary components of the pineapple model. The feature extraction is shown in Figure 2.

2.3. Pineapple Fruit Mechanical Properties Parameters

Pineapple fruit is the main carrier of external force in the harvesting process and basically does not deform. The primary objective of this study is to investigate the response of pineapple under external force through a finite element model. Therefore, pineapple fruit can be simplified as a whole, and the mechanical characteristic parameters are selected according to the existing research literature [13].

2.4. Physical Parameters of Brittle Separation Layer

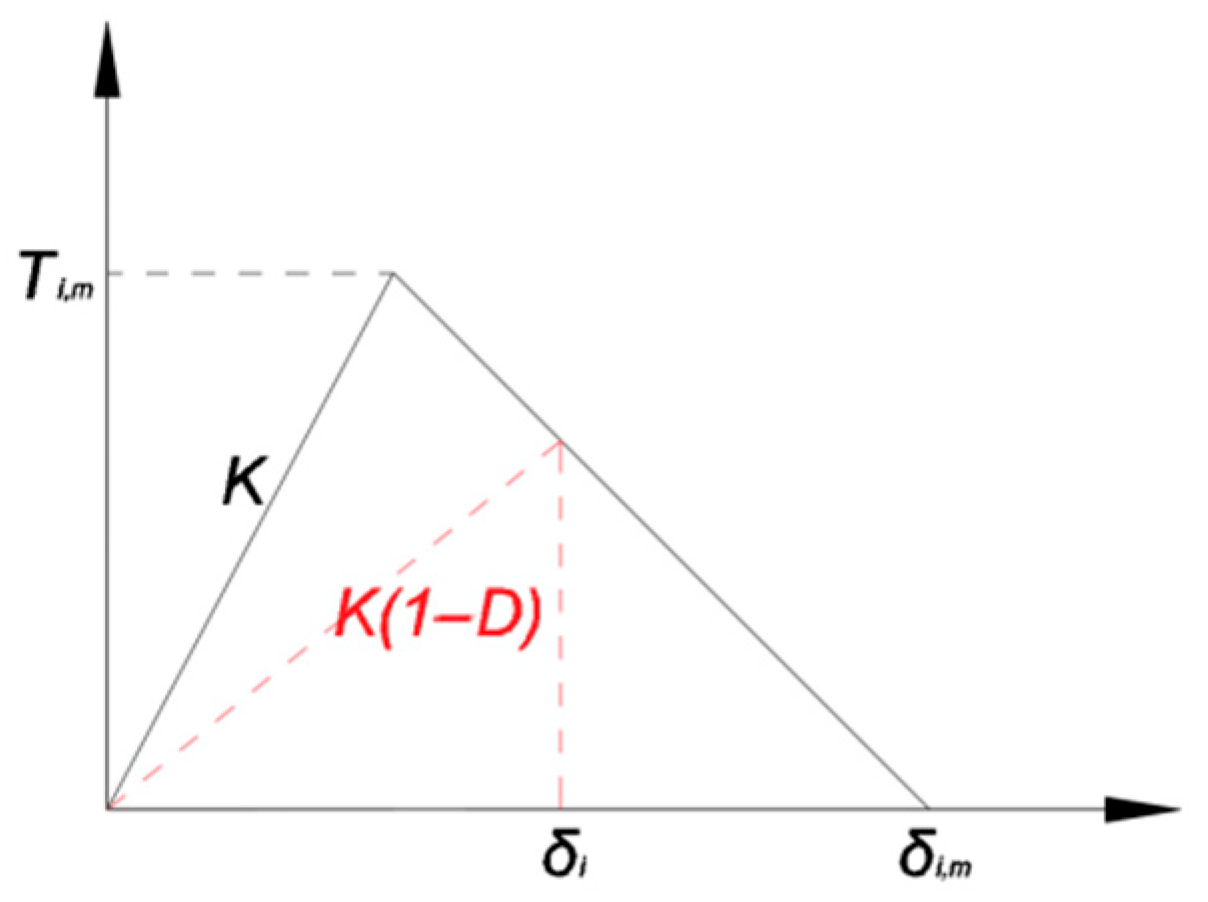
The thickness of the brittle separation layer in the connection area between the pineapple fruit and stem is extremely thin, and as a special area on the stem, the range is also difficult to define. The cohesive zone model is widely used in the simulation of interface failure separation [27,28,29,30]. The brittle separation layer of pineapple can be regarded as a special cohesive layer, which can be described and expressed in the simulation through the cohesive zone model. The cohesive zone model is defined by a single-layer cohesive element in the simulation, which includes a bi-linear model and an exponential model. In this paper, the brittle separation layer is simulated by a bi-linear model. As shown in Figure 3, the parameters associated with the model mainly include the traction stress intensity T i and traction displacement δ i of the connection surface. The initial stiffness in the model is K. When the traction stress intensity reaches the peak, the model enters the damage stage. At this time, the relationship between the traction stress intensity and the traction displacement satisfies Equation (1) [30].
T i = K ( 1 D ) δ i
Among them, Ti is the traction stress intensity at a certain point in the damage stage (MPa), K is the initial stiffness (N/mm3), D is the damage variable (0 ≤ D ≤ 1), δ i is traction displacement (mm).
The related derivative parameters also include the fraction energy release rate GiC represented by the closed graphic area enclosed by the curve, which satisfies the relationship between the interface traction stress intensity Ti and the traction displacement δ i like Equation (2).
G i C = 1 2 T i , m δ i , m
Among them, GiC is the fraction energy release rate (kj/m2), Ti,m is the maximum value of the traction stress intensity of the joint surface (MPa), δ i,m is the maximum traction displacement (mm).
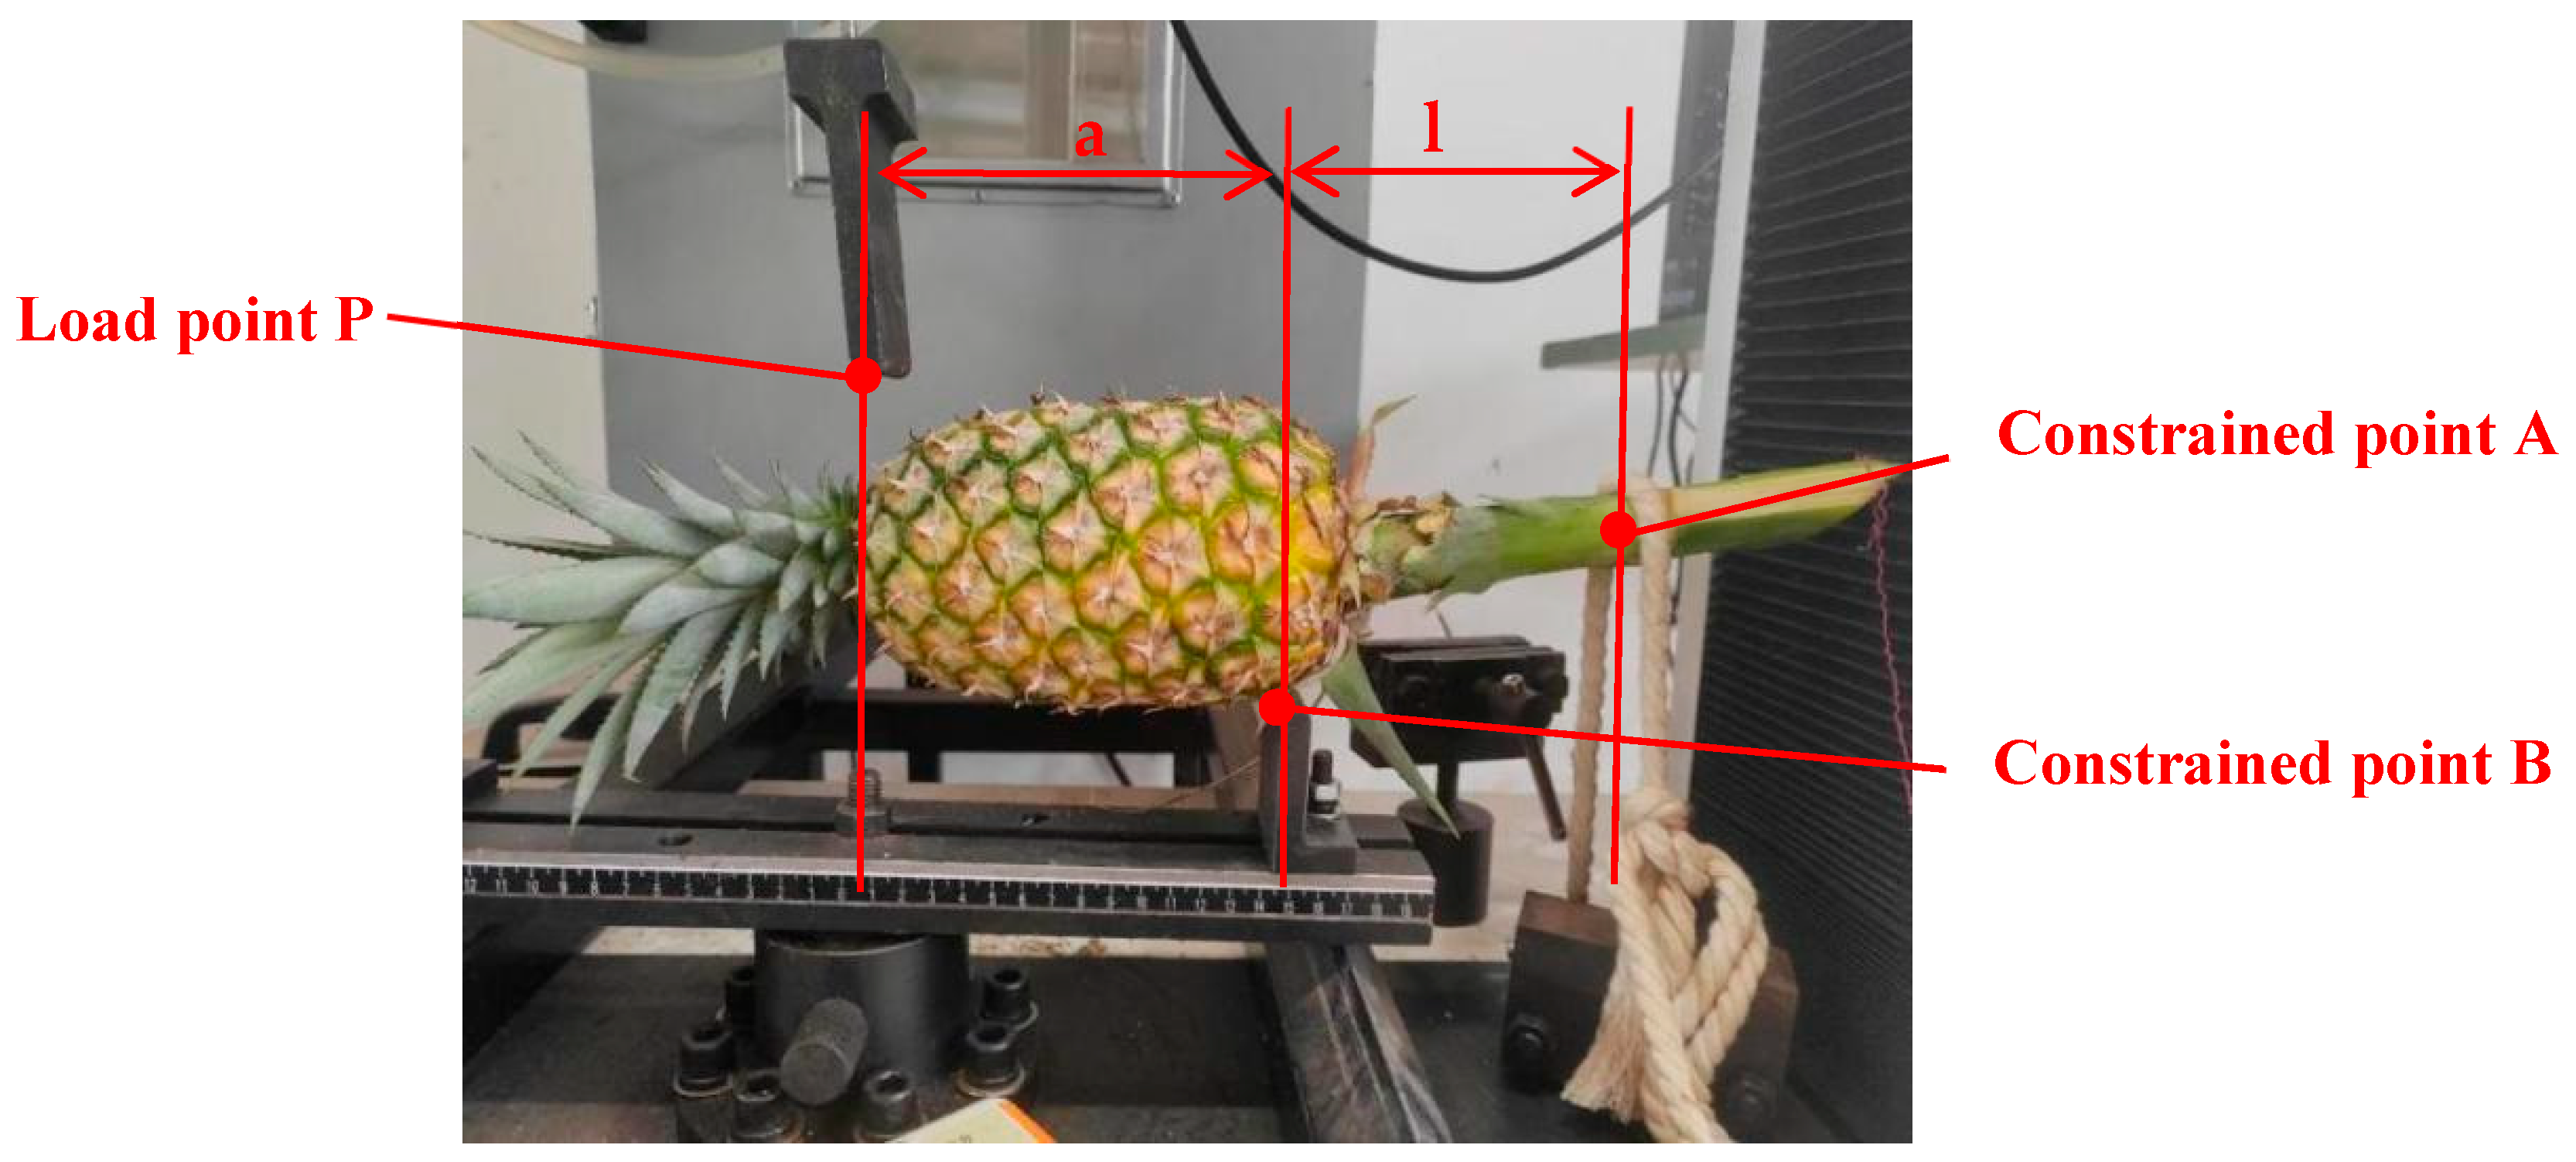
In the test, the traction stress intensity and displacement of the connection surface need to be measured. During the test, it is necessary to ensure that the sample has undergone a fracture process correctly and completely. The most direct measurement method is to use a universal test bench to perform a tensile test on the pineapple. However, due to the large diameter of the pineapple fruit and stem, it is difficult to clamp and slippage could easily occur during the test. Therefore, this study designed a test that can produce a complete fracture process. In this experiment, a constrained bending harvesting action in the process of pineapple harvesting was simulated, and the Kane universal test bench (KNWN-100 K, 1–100 KN, Precision ± 1%, Jinan Cain Testing Machine Manufacturing Co., Ltd. (Jinan, China)) was used for experimental design. As shown in Figure 4, the end of the stem was provided with one end constraint by hemp rope and manual assistance. At the same time, the lower support seat also provided a constraint for the plant. The upper pressure head applied the load at a speed of 50 mm/min until the pineapple plant broke. The load force and displacement data were obtained by the host computer, and then the traction stress intensity and displacement of the connecting surface were calculated according to Equations (3) and (4). This experiment set up ten samples.
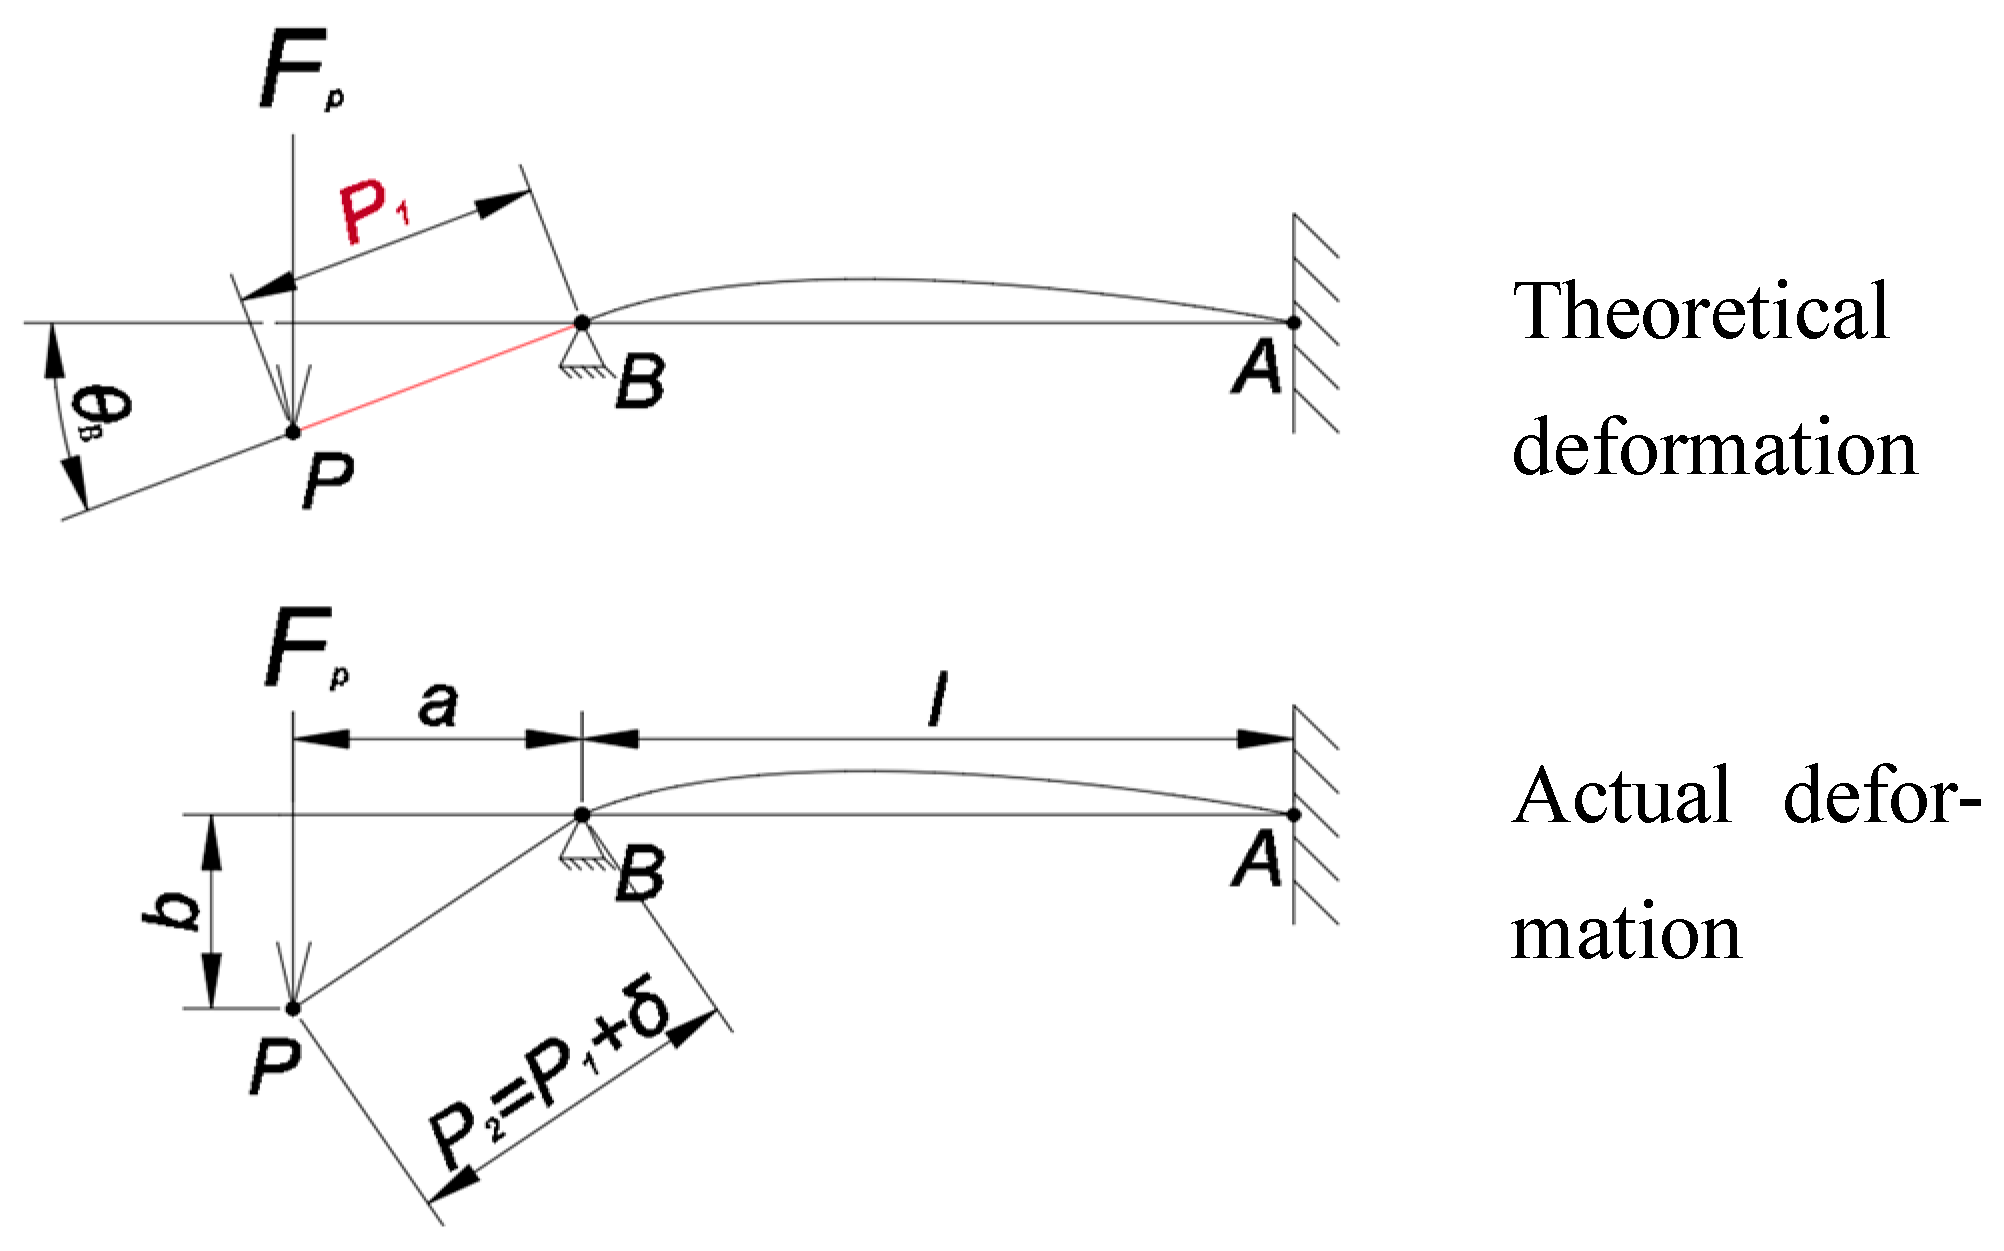
The stem of pineapple is a flexible material. Compared with the stem, the fruit can be regarded as rigid. Therefore, the force model in the test can be simplified as a flexible and rigid extended beam model, as shown in Figure 5. Ignoring the small proportion of the rigid body part in section AB, the rotation angle at point B can be obtained by the calculation formula of the rotation angle of the extended beam. Owing to the displacement δ of the connecting surface, the length of the PB section after the load is applied in the actual test is greater than the length of the PB section in the theoretical calculation. Based on this, the displacement of the connecting surface can be calculated. The traction stress intensity can be calculated by the stress formula of transverse force bending and the three-dimensional stress state formula.
The displacement of the connecting surface is calculated as Equation (3).
δ = P 2 P 1 P 1 = a c o s θ B = a c o s F p a l 3 E s t I P 2 = a 2 + b 2
Among them, δ is the displacement of the connection surface (mm), P1 is the theoretical length of the extended part of the overhanging beam after loading (mm), P2 is the actual length of the protruding part after loading (mm), Fp is the loading force on the plant (N), a is the distance from the loading force to point B (mm), l is the distance between points A and B (mm), Est is the elastic modulus of the stem (MPa), I is the moment of inertia of the stem (mm4), and b is the distance from the end point of the extended part to the original position after the force is applied (mm).
Traction stress intensity calculation Equation (4).
T = σ x 2 c o s 2 θ B θ B = F p a l 3 E s t I σ x = 32 F p a π d 3
Among them, T is the traction stress strength of the joint surface (MPa), σ x is the transverse tensile stress of the dangerous point of the connecting surface (MPa), θ B is the rotation angle of point B (°), Fp is the loading force on the plant (N), a is the distance from the loading force to point B (mm), l is the distance between points A and B (mm), Est is the elastic modulus of the stem (MPa), I is the moment of inertia of the stem (mm4), and d is the diameter of stem (mm).
When simulating the brittle separation layer based on the cohesive zone model, the cohesive element properties are created in ABAQUS, and the maximum traction strength and maximum displacement are calculated from the previous test. In order to ensure that the stiffness between the two connection interfaces is sufficient to generate a reliable rigid connection, the interface stiffness Kt is set to 10,000 [31].

2.5. Mechanical Characteristic Parameters of Stem

The measurement of mechanical properties is mainly aimed at the pineapple stem. Due to the growth characteristics of the pineapple stem, it can be regarded as having axial rotation characteristics and regarded as a special material in orthotropic materials, that is, a transversely isotropic material [12,17]. The key constitutive parameters of the proposed model are axial elastic modulus EZ, isotropic surface shear modulus Gxy, isotropic surface Poisson’s ratio μ xy, radial elastic modulus Er (Er = Ex = Ey), anisotropic surface shear modulus Gr (Gr = Gxz = Gyz), and anisotropic surface Poisson’s ratio μ r ( μ r= μ xz= μ yz).
The test utilizes the Kane universal test bench. By changing the support seat and fixture, the test bench can complete compression, tension, bending, and other tests. According to the required parameters in this paper, the required tests are axial compression, radial compression, and three-point bending tests. The axial elastic modulus E z, the radial elastic modulus E r, and the shear modulus G r of the anisotropic surface are obtained, respectively, and other required parameters are calculated by the formula. The load loading speed and sampling frequency in the test are controlled by the upper computer connected to the test bench.
In order to measure the parameters of the two components of the stem, each test in this paper is set up to compare the peeling group and the non-peeling group. The material parameters of the xylem and the whole steam are directly measured, and the material parameters of the phloem are calculated by the formula [22,27].
The mechanical characteristic parameters of the whole pineapple stem can be obtained through testing the non-peeling group, while those of the xylem can be obtained by testing the peeling group. From these test results, the mechanical parameters of the phloem of the pineapple stem can be calculated. The calculation relationship among the three is shown in Equation (5).
E 3 = v 2 E 2 E 1 E 2 v 3 E 1
Among them, E1 is the modulus measured by the whole test of the stem (MPa), E2 is the modulus measured by the test of the xylem of the stem (MPa), v2 is the volume fraction of the xylem of the stem to the whole (%), E3 is the modulus of phloem of stem (MPa), v3 is the volume fraction of the phloem of the stem for the whole (%).
The formula for calculating the volume fraction of each part is shown in Equation (6).
v i = S i L s t S 1 L s t × 100 % ( i = 2 ,   3 )
Among them, S1 is the cross-sectional area of the whole stem (mm2), S2 is the cross-sectional area of the xylem of the stem (mm2), S3 is the cross-sectional area of the phloem of stem (mm2), Lst is the length of the stem (mm).
(1) Measurement of Elastic Modulus
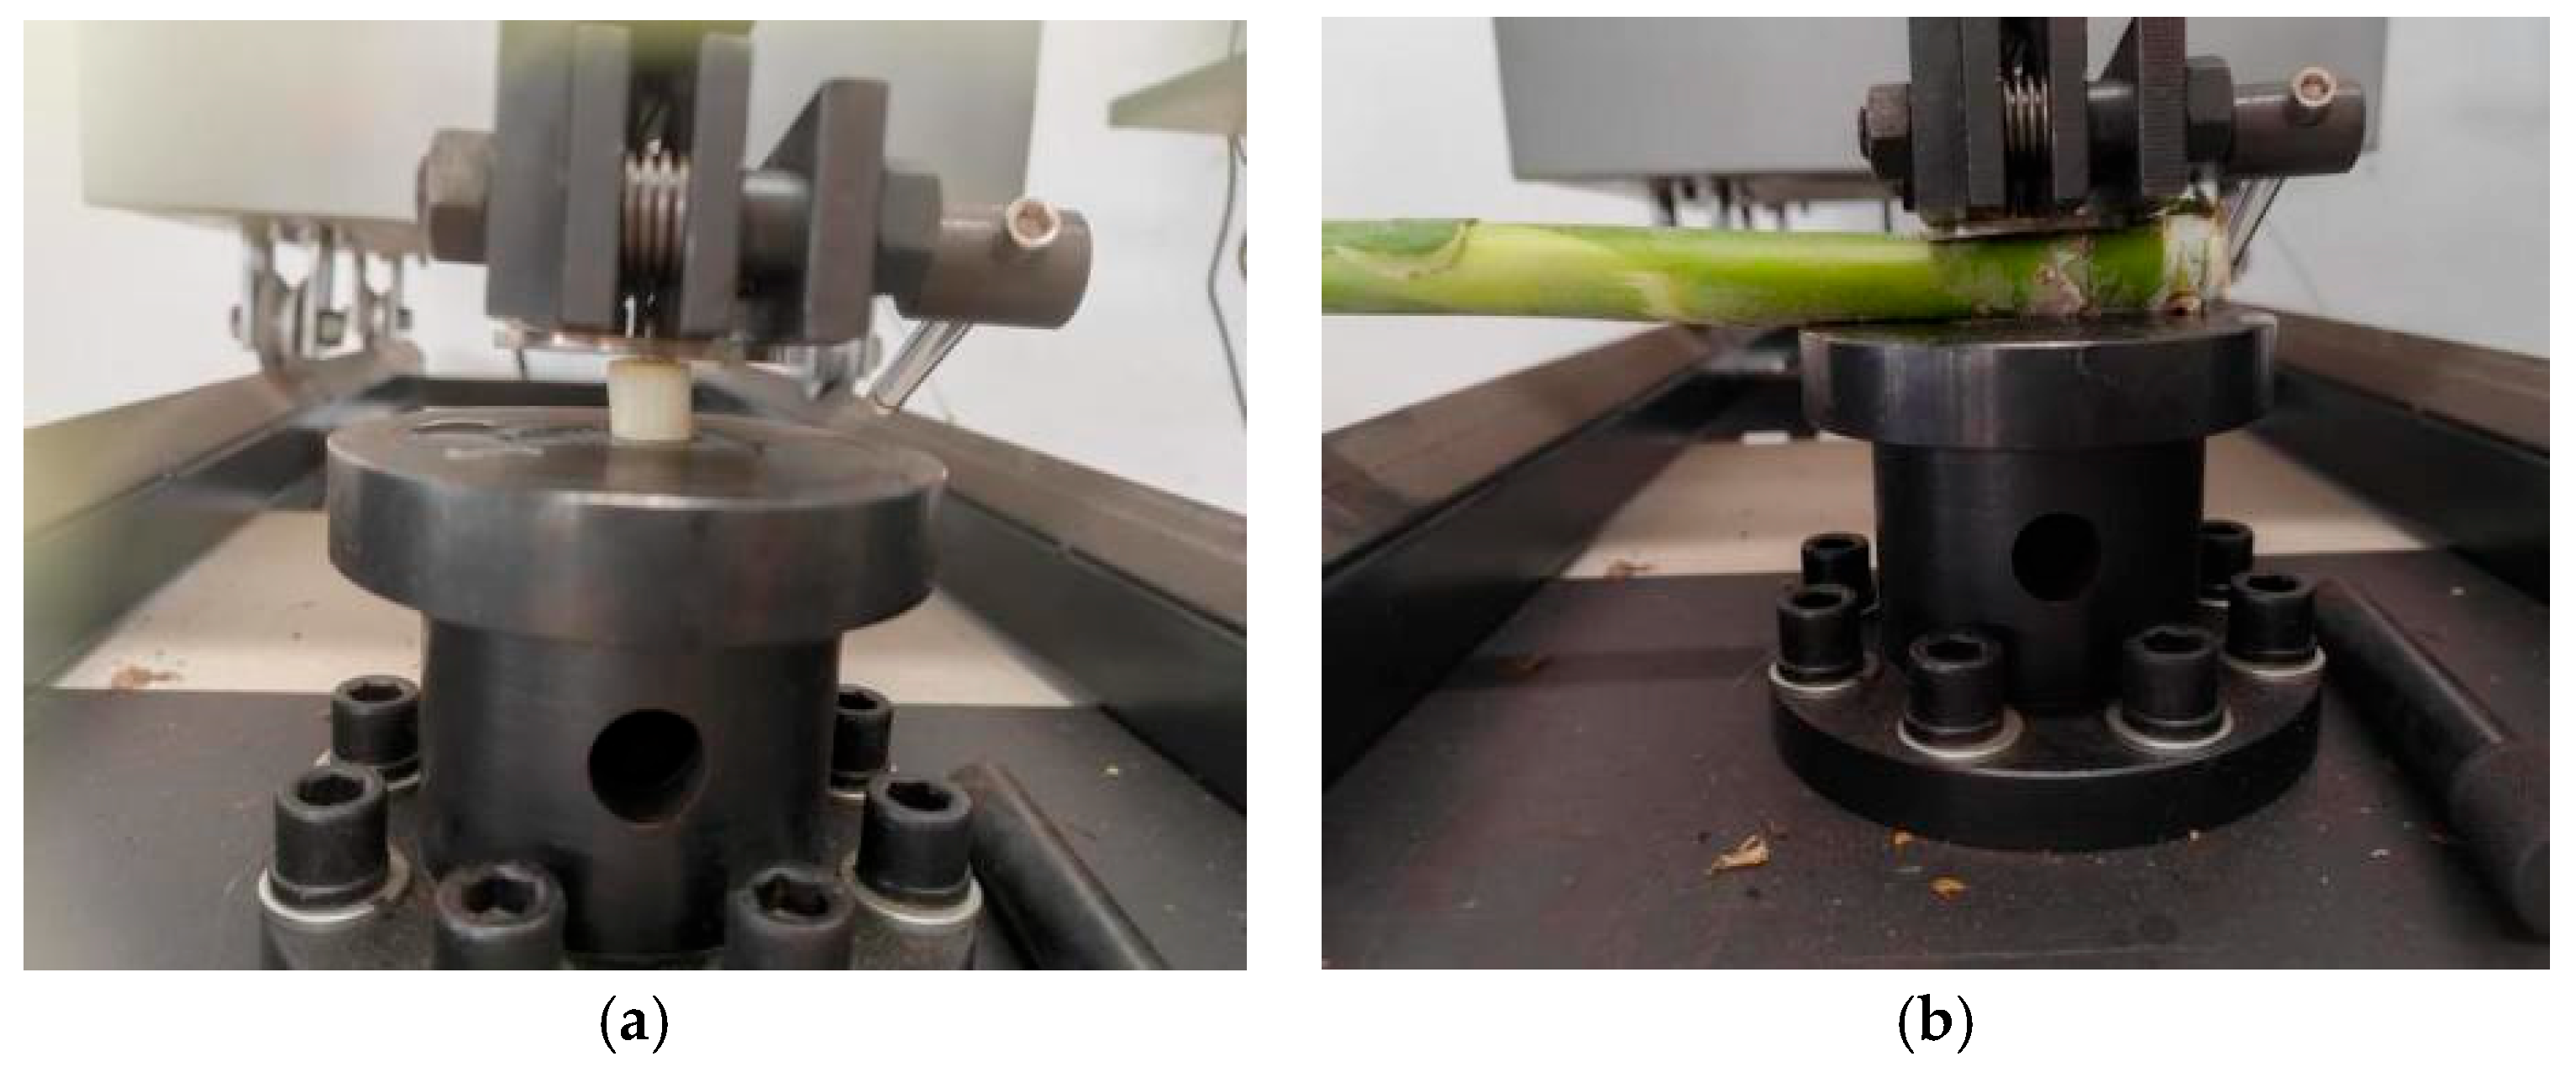
The elastic modulus was measured by compression test. In the test, a total of four groups of samples from two tests were placed on the support seat. In the axial compression test, the samples were placed in an axial direction perpendicular to the support seat. In the radial compression test, the samples were placed in a radial direction perpendicular to the support seat. The upper pressure head is controlled by the host computer and moves downward at a speed of 50 mm/min to apply a load to the sample. The load displacement and load force are obtained by the host computer through the sensor, and then the compression area is obtained through the cross-section of the sample and the size of the fixture, so as to calculate the axial and radial elastic modulus of the stem. The test is shown in Figure 6. Each experimental group is set with ten samples.
The test samples were divided into peeling group and non-peeling group. The elastic modulus of the xylem of the stem can be measured by the peeling group test, and the calculation formulas are shown in Equations (7) and (8).
E r 2 = F l r S r l r
E z 2 = F l a S a l a
Among them, Er2 is the radial elastic modulus of stem xylem (MPa), S r is the radial compression area of the sample (mm2), l r is the radial length variation in the sample (mm), l r is the original radial length of the sample (mm), Ez2 is the axial elastic modulus of the stem xylem (MPa), S a is the axial compression area of the specimen (mm2), l a is the axial length variation in the sample (mm), l a is the axial original length of the sample (mm), F is the load force on the sample (N).
The elastic modulus of the whole stem can be calculated by Equations (9) and (10) through the non-peeling group test.
E r 1 = F l r S r l r
E z 1 = F l a S a l a
Among them, Er1 is the overall radial elastic modulus of the stem (MPa), S r is the radial compression area of the sample (mm2), l r is the radial length variation in the sample (mm), l r is the original radial length of the sample (mm), Ez1 is the overall axial elastic modulus of the stem (MPa), S a is the axial compression area of the specimen (mm2), l a is the axial length variation in the sample (mm), l a is the axial original length of the sample (mm), F is the load force on the sample (N).
From the calculation results of the two sets of tests and Equations (5) and (6), the elastic modulus of the phloem can be calculated from Equations (11) and (12) [20].
E r 3 = v 2 E r 2 E r 1 E r 2 v 3 E r 1
E z 3 = v 2 E z 2 E z 1 E z 2 v 3 E z 1
Among them, Er1 is the overall radial elastic modulus of the stem (MPa), Er2 is the radial elastic modulus of the stem xylem (MPa), Er3 is the radial elastic modulus of the stem phloem (MPa), v2 is the volume fraction of the xylem of the stem to the whole (%), v3 is the volume fraction of the phloem of the stem to the whole (%), Ez1 is the overall axial elastic modulus of the stem (MPa), Ez2 is the axial elastic modulus of the stem xylem (MPa), Ez3 is the axial elastic modulus of the stem phloem (MPa).
(2) Measurement of Shear Modulus
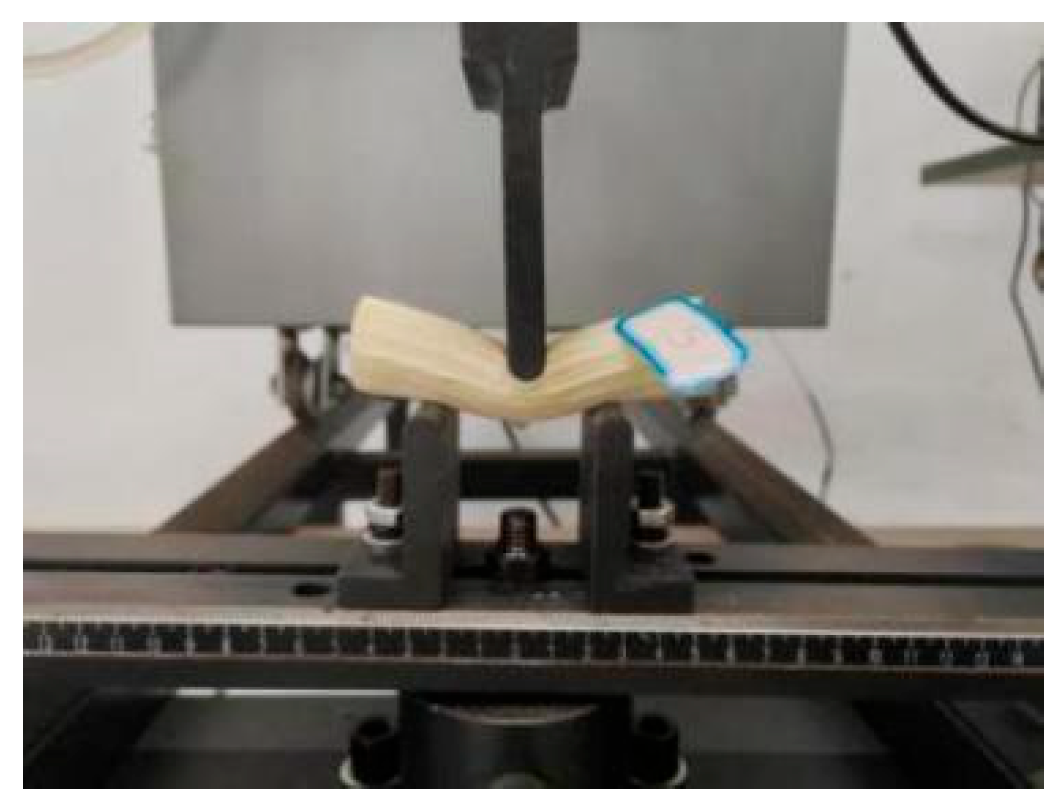
In the three-point bending test, the support seat and the pressure head are replaced, and the prepared sample is placed on the support seat. The pressure head is controlled by the upper computer, and the load is loaded at a speed of 50 mm/min until the sample is destroyed, and the relevant data in the failure process is outputted. The experiment is shown in Figure 7.
The test samples were divided into peeling group and non-peeling group. The anisotropic surface shear modulus of the xylem of the stem can be measured by the peeling group test. The calculation formula is shown in Equation (13). Each experimental group is set with ten samples.
G r 2 = F l s 3 48 I 2 δ s
Among them, Gr2 is the anisotropic surface shear modulus of the xylem of the stem (MPa), F is the load force on the sample (N), l s is the span of the support seat (mm), I2 is the moment of inertia of the peeling group sample (mm), δ s is the loading displacement (mm).
Through the non-peeling group test, shear modulus of the anisotropic surface of the whole stem can be calculated from Equation (14).
G r 1 = F l s 3 48 I 1 δ s
Among them, Gr1 is the shear modulus of the whole anisotropic surface of the stem (MPa), F is the load force on the sample (N), l s is the span of the support seat (mm), I 1 is the moment of inertia of the non-peeling group sample (mm), δ s is the loading displacement (mm).
The elastic modulus of the phloem can be calculated from the calculation results of the two groups of tests and Equations (5) and (6), and the elastic modulus of the phloem can be calculated from Equation (15).
G r 3 = v 2 G r 2 G r 1 G r 2 v 3 G r 1
Among them, Gr1 is the shear modulus of the whole anisotropic surface of the stem (MPa), Gr2 is the anisotropic surface shear modulus of the xylem of the stem (MPa), Gr3 is the shear modulus of the phloem of the stem (MPa), v2 is the volume fraction of the xylem of the stem to the whole (%), v3 is the volume fraction of the phloem of the stem to the whole (%).
(3) Acquisition of Other Parameters
In addition to the parameters directly obtained by test and result processing, there are several parameters that need to be obtained by formula calculation. The Poisson’s ratio of most agricultural bio-materials is between 0.2 and 0.5 [11]. The Poisson’s ratio μ xy of the isotropic surface can be determined by the analogy method, and the value in this paper is 0.3. For the isotropic surface shear modulus G xy and the anisotropic surface Poisson’s ratio μ r can be calculated by Equation (16) [27].
G xy = E r 2 ( 1 + μ x y ) μ r < E r E Z 2 μ x y
Among them, Gxy is the shear modulus of the isotropic surface (MPa), μ xy is the Poisson’s ratio of the isotropic surface, Er is the radial elastic modulus (MPa), Ez is the axial elastic modulus (MPa), μ r is the Poisson’s ratio of the anisotropic surface.

2.6. Establishment and Verification of the Finite Element Model of Pineapple

2.6.1. Establishment of Finite Element Model

With the help of Solidworks (2022), the pineapple plant model is constructed. As shown in Figure 8, the constructed solid model is imported into ABAQUS (2024), and the constitutive material is based on the test and calculation results. The pineapples were meshed; the crown bud was divided into 595 C3D4 elements, the fruit was divided into 15,846 C3D10 elements, the xylem of the stem was divided into 20,250 C3D8 elements, the phloem of the stem was divided into 3770 SC8R elements, and the brittle separation layer was divided into 667 COH3D8 elements. Among them, the cohesive units of the brittle separation layer are single layers, which are divided by ‘sweeping’ along the thickness direction.

2.6.2. Validation Test of Finite Element Model

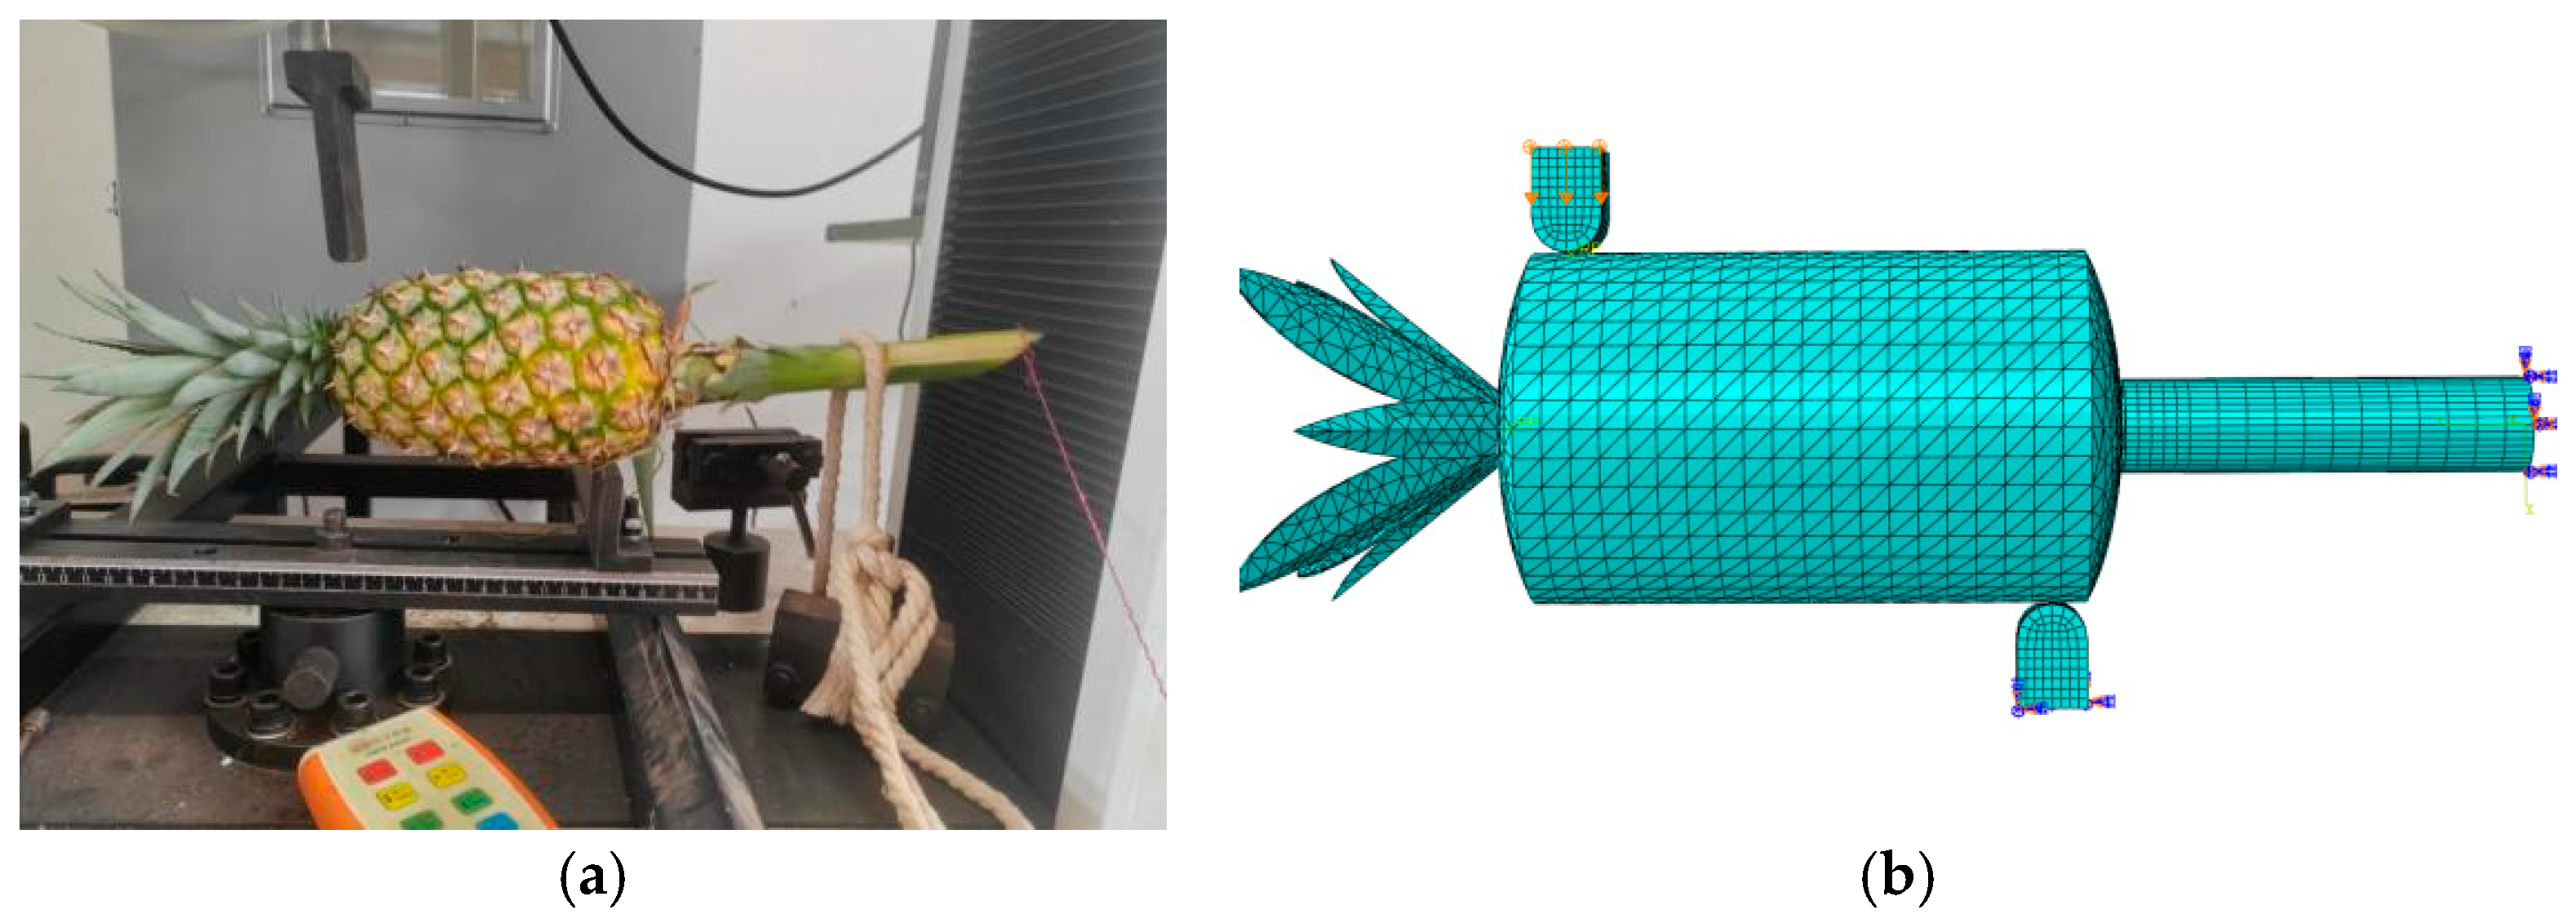
In order to verify the accuracy of the finite element model of pineapple based on the cohesive zone model, it is necessary to conduct a plant fracture test. Based on the test operating conditions, the simulation boundary conditions are established. As shown in Figure 9, a fixed constraint is applied to the lower end of the stem and the lower support seat, and a load displacement of 50 mm/min is applied through the upper pressure head. At the same time, the pineapple fruit remains undamaged during the test, and a rigid body constraint for the pineapple fruit could be applied in ABAQUS to improve the calculation efficiency.
Ten groups of tests were carried out, and there were some differences between the maximum load force and the maximum load displacement among different samples. The determination coefficient is calculated by Equation (17), and the linear correlation between fruit length, fruit diameter, stem diameter, stem length (the distance from the specimen connection surface to the lower constraint point) and the maximum load force, and the maximum load displacement can be analyzed to verify the rationality of the sample selection.
R 2 = ( ( x x - ) ( y y - ) ) 2 ( x x - ) 2 ( y y - ) 2
Among them, R2 is the determination coefficient, x is the independent variable, x - is the independent variable mean, y is the dependent variable, y - is the dependent variable mean. The closer R2 is to 1, the stronger the correlation between the two variables is. Based on this, the rationality of sample selection can be analyzed. The size parameters, maximum load force and maximum load displacement of different samples are shown in Table 1.
Further analysis can be carried out after verifying the rationality of sample selection.
Through the parameters of the cohesive zone model used to obtain Equations (3) and (4) in the test, the theoretical values of the parameters of the cohesive zone model in the simulation results can be calculated. The error analysis between Equation (18) and the actual value verifies the accuracy of the parameter acquisition.
ε = X S X T X T × 100 %
Among them, ε is the relative error value (%), XS is the theoretical value, XT is the actual value.
While comparing the simulation outcomes with the force-load displacement trend of the plant fracture process observed in the actual tests, a numerical analysis of the peak load force and the corresponding load displacement at the fracture point is conducted, using Equation (18) to validate the accuracy of the modeling.
In the post-processing, with the help of finite element analysis software, the stress changes before and after the fracture can also be analyzed by visual results.

3. Result and Discussion

3.1. Parameters of Each Component in the Finite Element Model

In the previous article, the feature extraction of pineapple has been carried out. Now the pineapples are modeled. The establishment of the solid model is completed with the help of SolidWorks (2022) software, and then the established model is imported into ABAQUS (2024) finite element analysis software. The relevant parameters of the fruit are obtained by referring to the existing literature [13], as shown in Table 2.
The relevant parameters of the cohesive zone model can be obtained from the fracture test obtaining the physical parameters of the brittle separation layer, as shown in Table 3.
The relevant parameters of the stem can be obtained from the axial compression, radial compression, and three-point bending tests, as shown in Table 4.

3.2. Experimental Results by Comparison

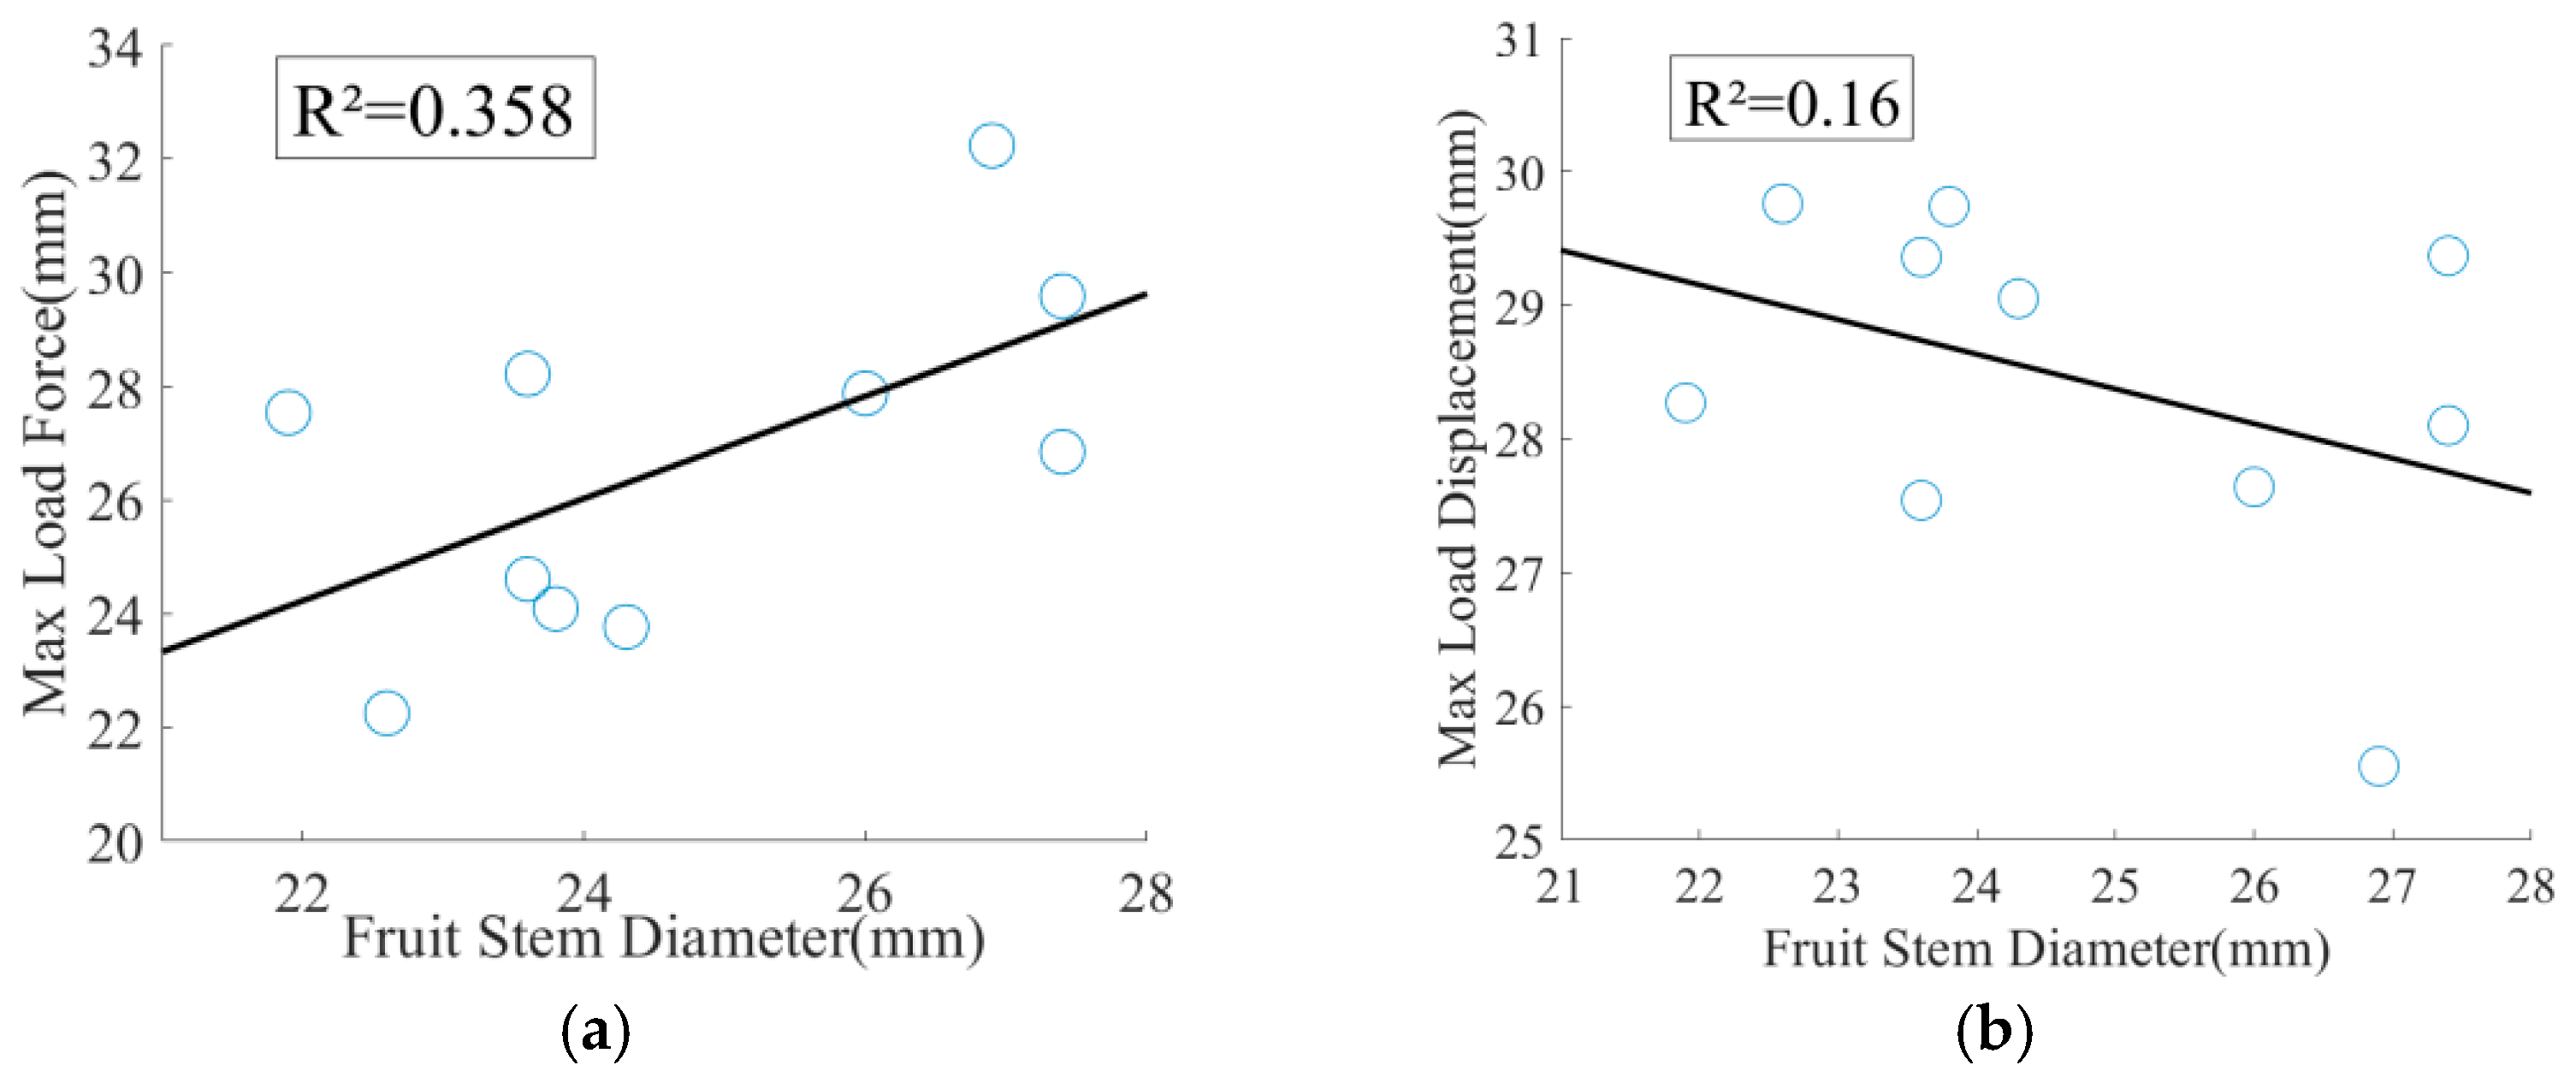
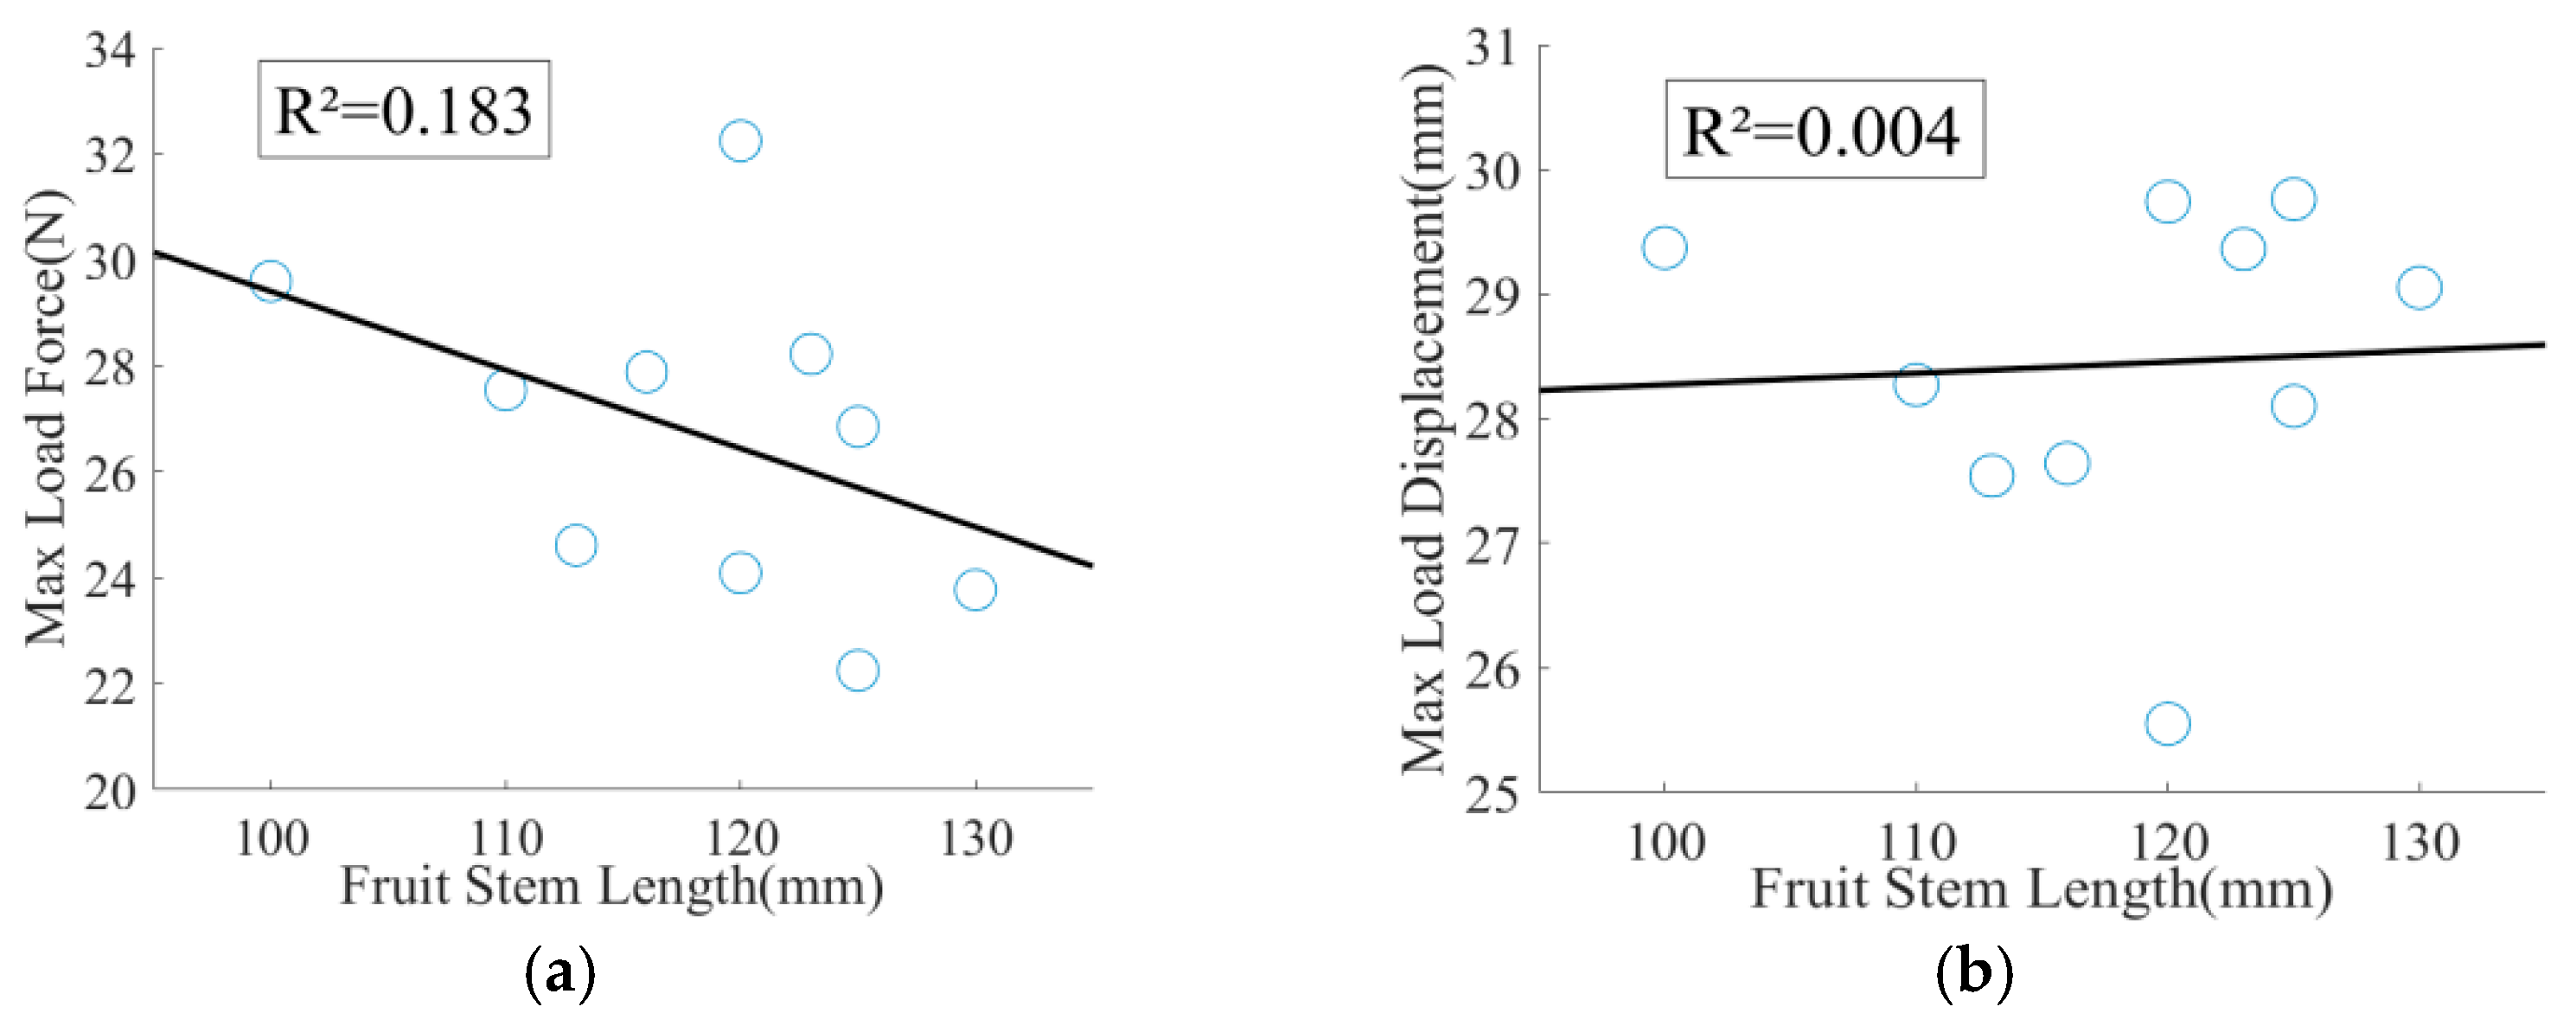
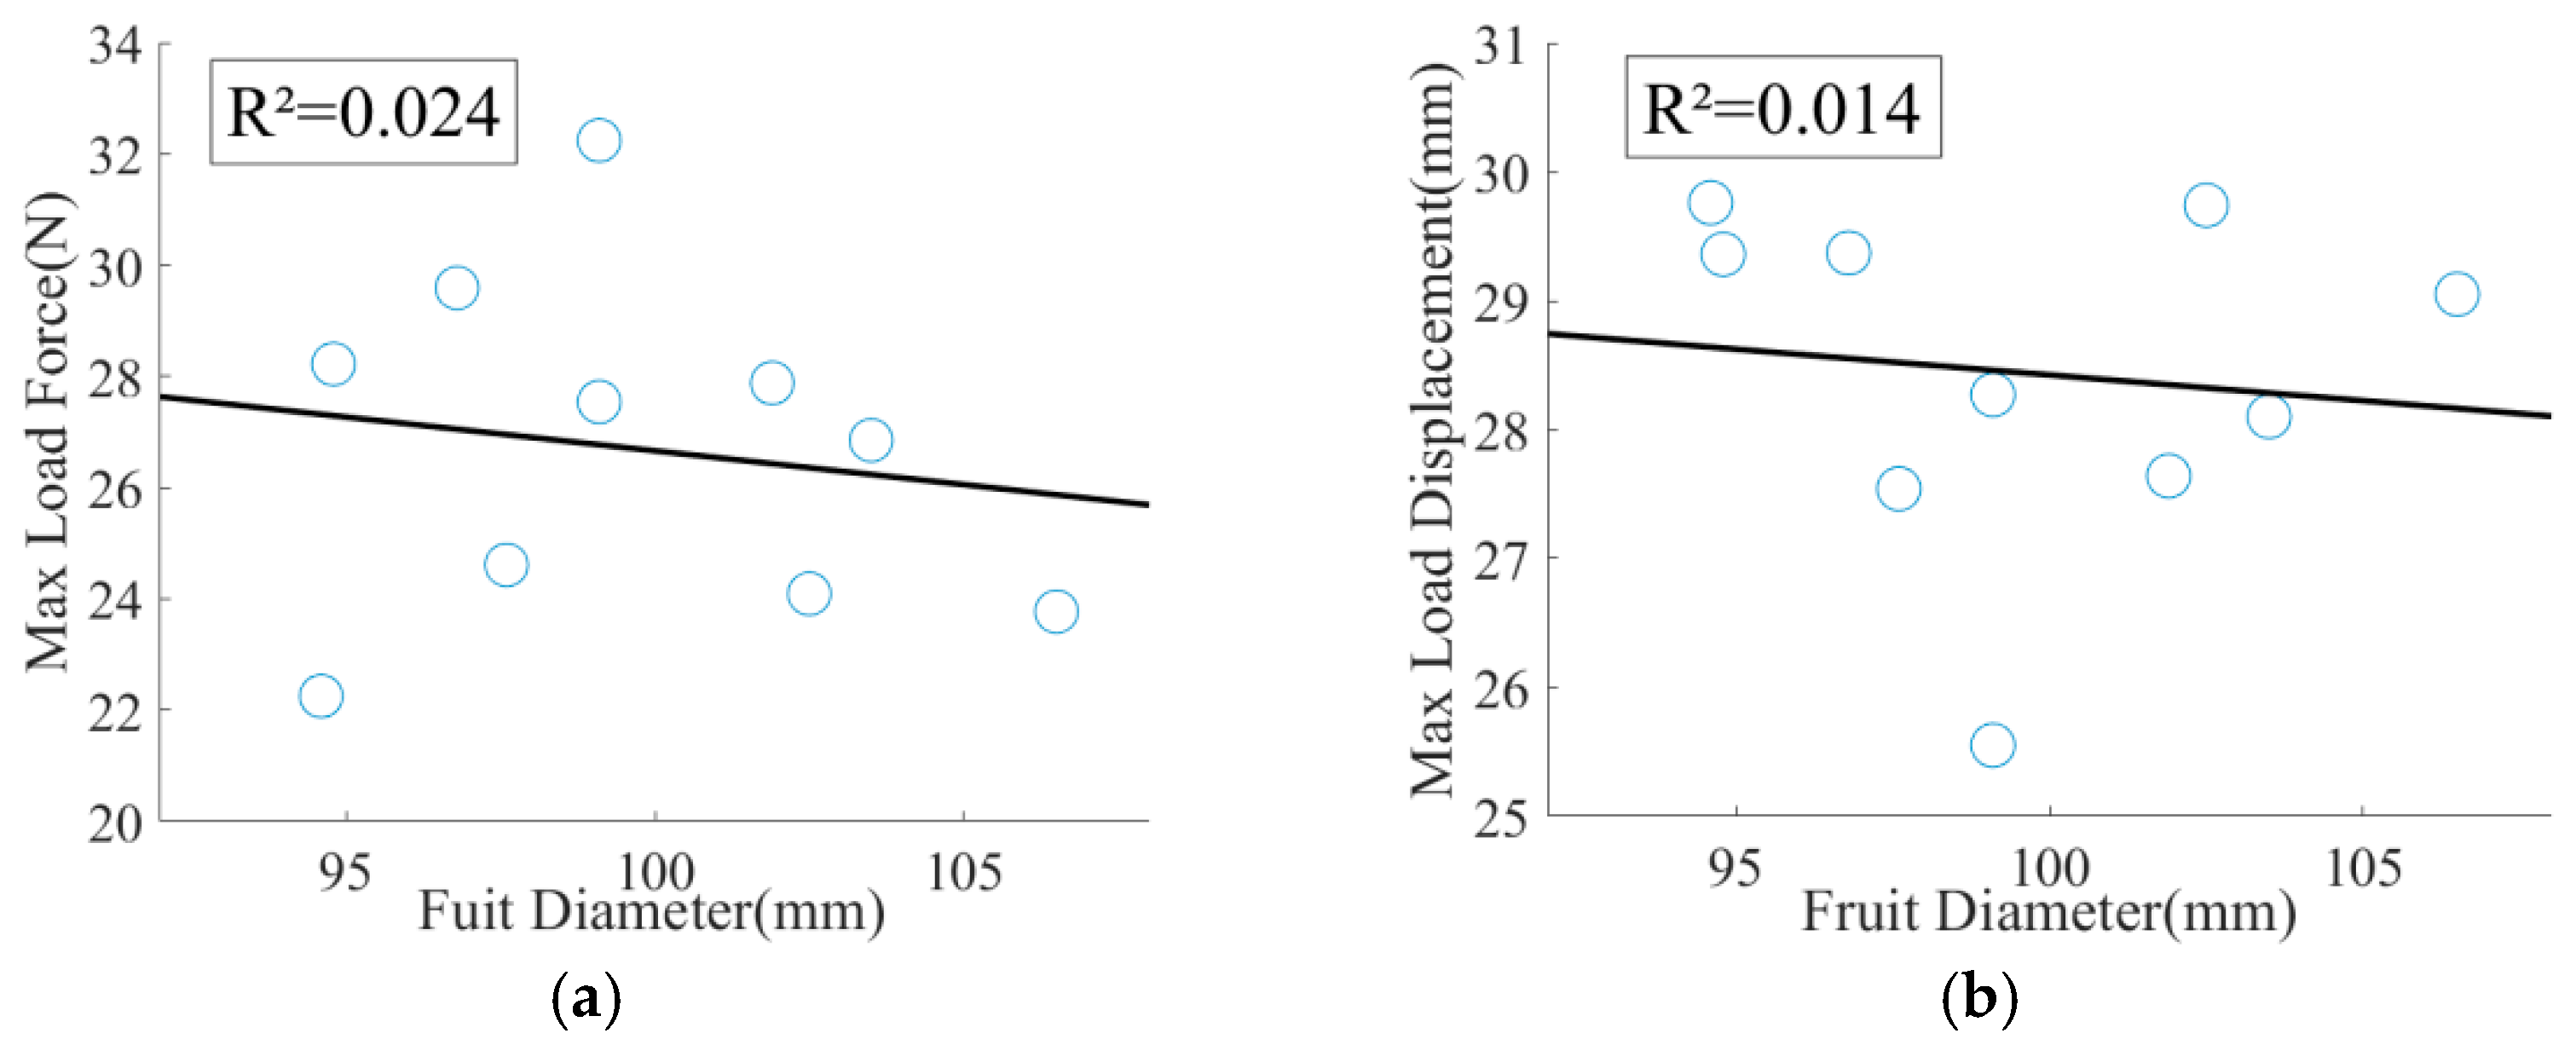
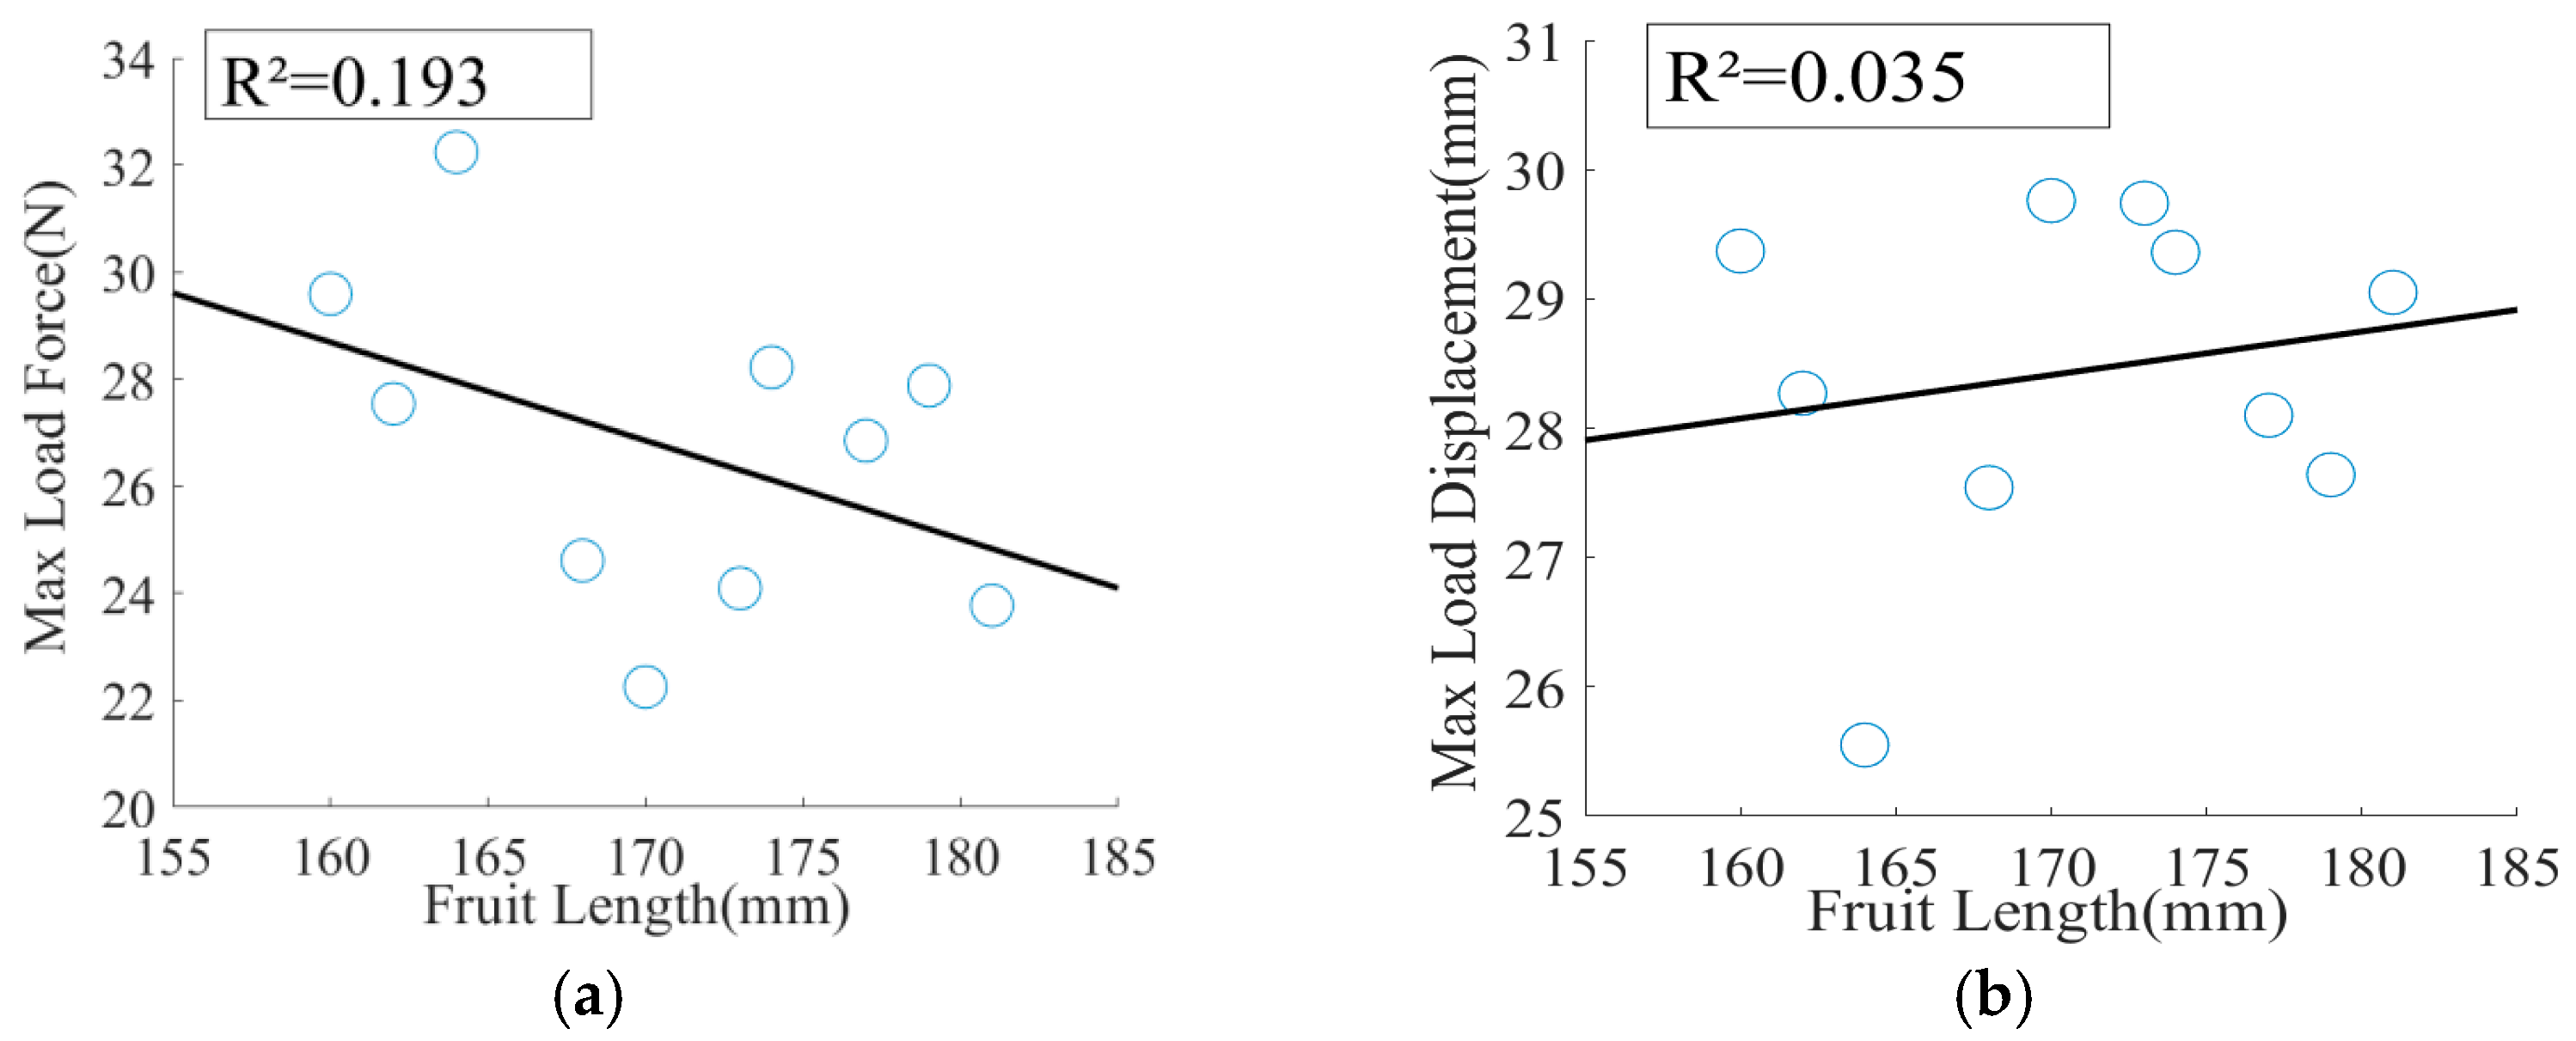
Through the determination of coefficient R2, the influence of the stem diameter, stem length, fruit diameter, and fruit length on the maximum load force, the maximum load force was analyzed, and the rationality of the test sample selection was verified.
The correlation between the diameter of the stem and the maximum load force and the maximum load displacement is shown in Figure 10. The correlation between stem length and maximum load force and maximum load displacement is shown in Figure 11.
The correlation between the fruit diameter and maximum load force and maximum load displacement is shown in Figure 12. The correlation between the fruit length and maximum load force and maximum load displacement is shown in Figure 13.
Through the correlation analysis, the correlation between the size parameters of pineapple and the maximum load force and the maximum load displacement is weak, and the sample selection is reasonable, which can be further analyzed.
From the torque values during the pineapple fracture process [12], for the ‘Bali’ variety of pineapple, the separating torque required for fracture varies between 2.78 and 10.51 N·m depending on the position of the fixed point at the fruit stem. When the stem fixed point is at 100 mm, the separating torque required for fracture is 3.79 N·m. In this study, the average stem length of the sample fruits used in the verification experiment was 118.2 mm, and the average fracture torque was 3.16 N·m, which is consistent with the magnitude of existing research findings. The numerical values are similar, and the discrepancy may be due to differences in the variety and ripeness of the fruits studied.
According to the fracture test obtaining the physical parameters of the brittle separation layer, the maximum traction strength of the connection surface is 1.809 MPa and the maximum displacement is 2.208 mm when the pineapple plant is broken under the vertex load. The maximum traction strength of the theoretical value calculated by Equations (3) and (4) is 1.887 MPa, and the maximum displacement is 2.145 mm. The error with the actual value is 4.3% and 2.9%, respectively. The correctness of the parameter acquisition method can be verified.
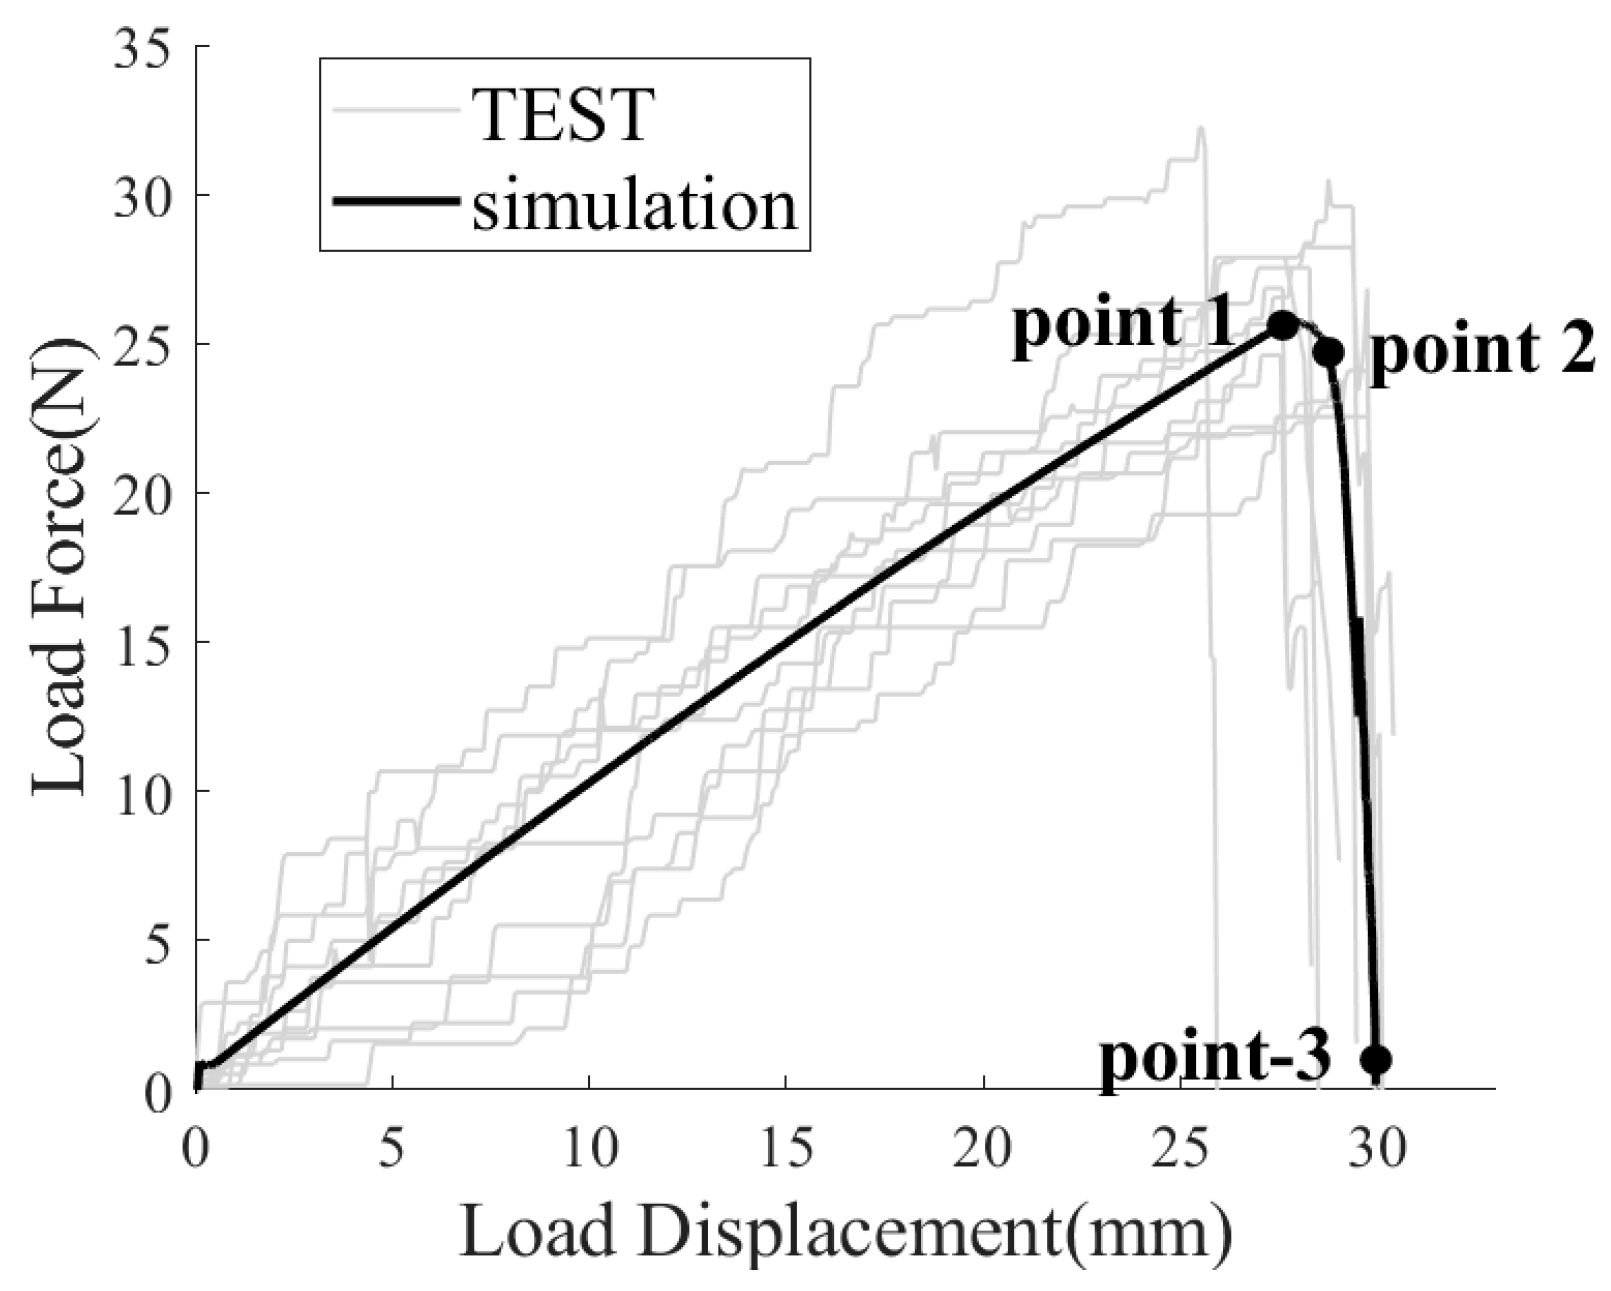
By comparing the values of load force and load displacement during fracture in the test and simulation results, the correctness of the finite element model of pineapple based on the cohesive zone model can also be verified numerically. According to the test conditions, the load and boundary conditions of the simulation model are set up, and the simulation results can be obtained by the solver. Figure 14 compares the data of the simulation and the test, and the change trend of the force-displacement curve is basically the same. With the increase in load displacement, the load force also increases continuously until it reaches the limit and breaks. The average value of the maximum load force in the ten repeated tests is 26.704 N, the simulation result is 25.73 N, and the error relative to the average value is 3.6%. In the ten repeated tests, the average load displacement corresponding to the peak load force is 28.438 mm, the simulation result is 28.02 mm, and the error relative to the average value is 1.4%. The correctness of the finite element model of pineapple based on the cohesive zone model was verified by numerical comparison. In the simulation test, three points near the fracture on the curve are selected to observe the dynamic response of the fracture, as shown in Figure 15.
The trend in the force-displacement curve indicates that as the load displacement increases, the applied force continues to rise, and the stress at the connection surface between the pineapple fruit and the stem also increases continuously until it reaches the load-bearing limit and begins to fracture. Once fracturing commences, the contact area between the fruit and stem decreases, accelerating crack propagation. Consequently, once fracturing begins, it progresses rapidly to completion.
By comparing with the existing literature results [26], the trend of crack propagation is generally consistent from the visualization results, with both completing the fracture rapidly after the brittle separation layer reaches the critical tensile strength limit. Numerically, the error between the simulation and experimental average values in existing studies is also within 5%. Therefore, simulating the plant brittle separation layer using the cohesive zone model is feasible.

4. Conclusions

In this study, the component analysis and feature extraction of pineapples were conducted, and the research subject was clearly defined. Based on compression tests, three-point bending tests and formula calculations, the mechanical characteristic parameters of each component of the pineapple stem were obtained. Focusing on the brittle separation layer with a very small thickness, this study utilizes the cohesive zone model, and the relevant parameters of the cohesive zone model were determined through fracture tests.
In this study, the solid model of pineapple was constructed based on the material parameters obtained from the experiment. The mechanical properties of the pineapple stem and brittle separation layer were described by the orthogonal anisotropic material constitutive and cohesive zone model. The finite element analysis was carried out after the simulation conditions were configured. In the model validation testing, the correlation between dimensional parameters and results was analyzed, and the rationality of sample selection in the validation testing was verified. At the same time, the relative error between the theoretical value and the actual value is calculated by the simulation results. The maximum traction strength error is 4.3%, and the maximum displacement error is 2.9%, which verifies the accuracy of the cohesive zone model-related parameter acquisition method. After that, by comparing the verification test results with the simulation results, the error of the load force relative to the average value is 3.6%, and the error of the load displacement relative to the average value is 1.4%, which verifies the feasibility of constructing the pineapple simulation model based on the cohesive zone model to simulate the brittle separation layer. Based on this, the subsequent simulation analysis of different harvesting actions can be carried out, and the theoretical optimal pineapple non-destructive harvesting method in the target can be obtained in combination with experimental verification, so as to guide the design of pineapple automatic harvesting equipment. At the same time, this study is limited to ‘Tainong’ pineapple varieties within a certain range of maturity, and there is room for further research on pineapples of different varieties and maturities.

Author Contributions

Conceptualization, D.P., F.H., Q.Z., and G.D.; Methodology, D.P., F.H., Q.Z., and G.D.; Software, D.P. and F.H.; Validation, F.H., Q.Z., G.D., G.L., Z.C., and P.C.; Data acquisition, D.P., F.H., Z.C., and P.C.; Resources, D.P., Z.C., and P.C.; Visualization, D.P., Z.C., and P.C.; Writing—original draft preparation, D.P., F.H., and P.C.; Writing—review and editing, F.H., Q.Z., G.D., G.L., Z.C., and J.L.; Supervision, Q.Z., G.D., and G.L.; Project administration, Q.Z., G.D., G.L., Z.C., and J.L.; Funding acquisition, F.H., Q.Z., G.D., G.L., Z.C., and J.L. All authors have read and agreed to the published version of the manuscript.

Funding

This research was funded by the Central Public-interest Scientific Institution Basal Research Fund(Grant number 1630012025402), the National Natural Science Foundation of China (Grant number 52405300), Guangzhou Key Research and Development Program (Grant number 2025B03J0072), Guangdong Science and Technology Program (Grant number 2025B0202010036), Guangdong High-Level Talents Special Support Program (Grant number 2024TQ08Z107), and the Hainan Province Science and Technology Special Fund (Grant Number ZDYF2024XDNY180).

Data Availability Statement

The raw data supporting the conclusions of this article will be made available by the authors on request.

Acknowledgments

We gratefully acknowledge the foundations for their financial support of this study, our supervisors for their invaluable guidance and continuous support throughout the research, and our researchers and collaborators for their valuable contributions to this work.

Conflicts of Interest

The authors declare that the research was conducted in the absence of any commercial or financial relationships that could be construed as a potential conflicts of interest.

References

  1. FAO. Major Topical Fruits Market Review Preliminary Results. 2024. Available online: https://www.fao.org/faostat/en/#data/QCL (accessed on 23 August 2025).
  2. Chen, P.; Yan, B.; Deng, G.; Li, G.; Cui, Z.; Zheng, S.; He, F.; Li, L.; Wang, X.; Zhou, S.; et al. Pose detection and localization of pineapple fruit picking based on improved litehrnet. Front. Plant Sci. 2025, 16, 1577312. [Google Scholar] [CrossRef]
  3. Li, J.; Li, C.; Luo, X.; Chen, C.L.; Chen, W. Real-time pineapple detection for agricultural robot via lightweight YOLOV7-Tiny Model. Procedia Comput. Sci. 2023, 226, 92–98. [Google Scholar] [CrossRef]
  4. He, D.; Zhang, L.; Li, X.; Li, P.; Wang, T. Design of automatic pineapple harvesting machine based on binocular machine vision. J. Anhui Agric. Sci. 2019, 47, 207–210. [Google Scholar]
  5. Lin, G.; Wu, Z.; Yan, M.; Liang, R.; Wu, Y.; Yan, F.; Wu, T.; Deng, G.; Yao, J.; Zhang, Y. Design and Testing of a Multi-arm Pineapple Picking Robot Based on Machine Vision. Mech. Electr. Eng. Technol. 2023, 52, 141–144+154. [Google Scholar]
  6. Guo, A.F.; Li, J.; Guo, L.Q.; Jiang, T.; Zhao, Y.P. Structural design and analysis of an automatic pineapple picking and collecting straddle machine. J. Phys. Conf. Ser. 2021, 1777, 012029. [Google Scholar] [CrossRef]
  7. Liu, T.; Liu, W.; Zeng, T.; Qi, L.; Zhao, W.; Cheng, Y.; Zhang, D. Working principle and design of the multi-flexible fingered roller pineapple harvesting mechanism. Trans. Chin. Soc. Agric. Eng. 2022, 38, 21–26. [Google Scholar]
  8. Liu, T.; Cheng, Y.; Li, J.; Chen, S.; Lai, J.; Liu, Y.; Qi, L.; Yang, X. Feeding-type harvesting mechanism with the rotational lever for pineapple fruit. Trans. Chin. Soc. Agric. Eng. 2023, 39, 27–38. [Google Scholar]
  9. Wang, H.; Chen, Z.; Zhang, X.; Sun, H.; Zou, H.; Yu, Z.; Wang, C.; Li, H. Design and Experimental Study of Differential Speed Comb Type Pineapple Harvesting Machine. J. Agric. Mech. Res. 2024, 46, 115–120+127. [Google Scholar] [CrossRef]
  10. Fu, M.; Li, C.; Zheng, Z. Design and analysis of semi-automatic screw type pineapple picking-collecting machine. Chin. J. Eng. Des. 2020, 27, 487–497. [Google Scholar]
  11. Zulkifli, N.; Hashim, N.; Harith, H.; Mohamad Shukery, M.F. Finite element modelling for Fruit Stress Analysis—A Review. Trends Food Sci. Technol. 2019, 97, 29–37. [Google Scholar] [CrossRef]
  12. Li, M.; He, L.; Yue, D.; Wang, B.; Li, J. Fracture mechanism and separation conditions of pineapple fruit-stem and calibration of physical characteristic parameters. Int. J. Agric. Biol. Eng. 2023, 16, 248–259. [Google Scholar] [CrossRef]
  13. Xue, Z.; Zhang, X.; Chen, R. Experimental Study on Morphology and Mechanical Properties of Pineapple. J. Agric. Mech. Res. 2024, 46, 170–174. [Google Scholar] [CrossRef]
  14. Carter, J.; Hoffman, J.; Fjeldsted, B.; Ogilvie, G.; Cook, D.D. Measurement of maize stalk shear moduli. Plant Methods 2024, 20, 152. [Google Scholar] [CrossRef] [PubMed]
  15. Liu, F.; Jiang, F.; Zhang, J.; Zhang, H.; Wang, X.; Yang, Z. Twelve Elastic Constant Values of Larch Forest. J. Northwest For. Univ. 2015, 30, 227–231. [Google Scholar]
  16. Li, J.; He, P.; Wang, Y.; Zhang, D.; Zheng, W.; He, J. Determination of Mechanical Property of Goldenpassion Fruit Vine. J. Agric. Mech. Res. 2023, 45, 181–190. [Google Scholar] [CrossRef]
  17. Wang, S.; Zhang, B.; Li, X.; Sheng, C.; Tian, K.; Huang, J. Experimental Study on Mechanical Properties of Fresh Corn Straw. J. Agric. Mech. Res. 2018, 40, 171–175+180. [Google Scholar] [CrossRef]
  18. Al-Zube, L.; Sun, W.; Robertson, D.; Cook, D. The elastic modulus for maize stems. Plant Methods 2018, 14, 11. [Google Scholar] [CrossRef] [PubMed]
  19. Liu, T.; Luo, G.; Ehsani, R.; Toudeshki, A.; Zou, X.; Wang, H. Simulation study on the effects of tine-shaking frequency and penetrating depth on fruit detachment for citrus canopy-shaker harvesting. Comput. Electron. Agric. 2018, 148, 54–62. [Google Scholar] [CrossRef]
  20. Shi, N. Peeling Method of Cotton Stalk and Development of Rubbing Peeling Machine. Ph.D. Thesis, Northwest A & F University, Xianyang, China, 2018. [Google Scholar]
  21. Hu, G. Key Technology of Apple Harvest Using Combing Brushing. Master’s Thesis, Northwest A & F University, Xianyang, China, 2020. [Google Scholar] [CrossRef]
  22. Li, Y.; Zhou, P.; Jiao, H.; Wang, P.; Wang, L.; Li, C.; Qi, N. Construction of constitutive model and parameter determination of green Sichuan Pepper (Zanthoxylum armatum) branches. Biosyst. Eng. 2023, 227, 147–160. [Google Scholar] [CrossRef]
  23. Ji, W.; Qian, Z.; Xu, B.; Chen, G.; Zhao, D. Apple Viscoelastic Complex Model for bruise damage analysis in constant velocity grasping by Gripper. Comput. Electron. Agric. 2019, 162, 907–920. [Google Scholar] [CrossRef]
  24. Li, Z.; Li, P.; Yang, H.; Liu, J. Internal mechanical damage prediction in tomato compression using multiscale finite element models. J. Food Eng. 2013, 116, 639–647. [Google Scholar] [CrossRef]
  25. Yousefi, S.; Farsi, H.; Kheiralipour, K. Drop test of Pear Fruit: Experimental measurement and finite element modelling. Biosyst. Eng. 2016, 147, 17–25. [Google Scholar] [CrossRef]
  26. Bu, L.; Chen, C.; Hu, G.; Zhou, J.; Sugirbay, A.; Chen, J. Investigating the dynamic behavior of an Apple branch-stem-fruit model using experimental and simulation analysis. Comput. Electron. Agric. 2021, 186, 106–224. [Google Scholar] [CrossRef]
  27. Sheng, C.; Li, X.; Tian, K.; Zhang, B.; Huang, J.; Chen, Q. Experimental analysis on mechanical model of ramie stalk. Trans. Chin. Soc. Agric. Eng. 2015, 31, 26–33. [Google Scholar]
  28. Malachanne, E.; Jebli, M.; Jamin, F.; Garcia-Diaz, E.; El Youssoufi, M.-S. A cohesive zone model for the characterization of adhesion between cement paste and aggregates. Constr. Build. Mater. 2018, 193, 64–71. [Google Scholar] [CrossRef]
  29. She, Y.; Dai, Y.; Zhang, L.; Li, L. Construction and verification of parameters based on wire rope cohesion model. Coal Eng. 2024, 56, 172–178. [Google Scholar]
  30. Ezzine, M.C.; Amiri, A.; Tarfaoui, M. Experimental and numerical investigation of the fracture behavior of adhesive shear tests single lap joints. J. Braz. Soc. Mech. Sci. Eng. 2018, 40, 382. [Google Scholar] [CrossRef]
  31. Turon, A.; Dávila, C.G.; Camanho, P.P.; Costa, J. An engineering solution for mesh size effects in the simulation of delamination using cohesive zone models. Eng. Fract. Mech. 2007, 74, 1665–1682. [Google Scholar] [CrossRef]
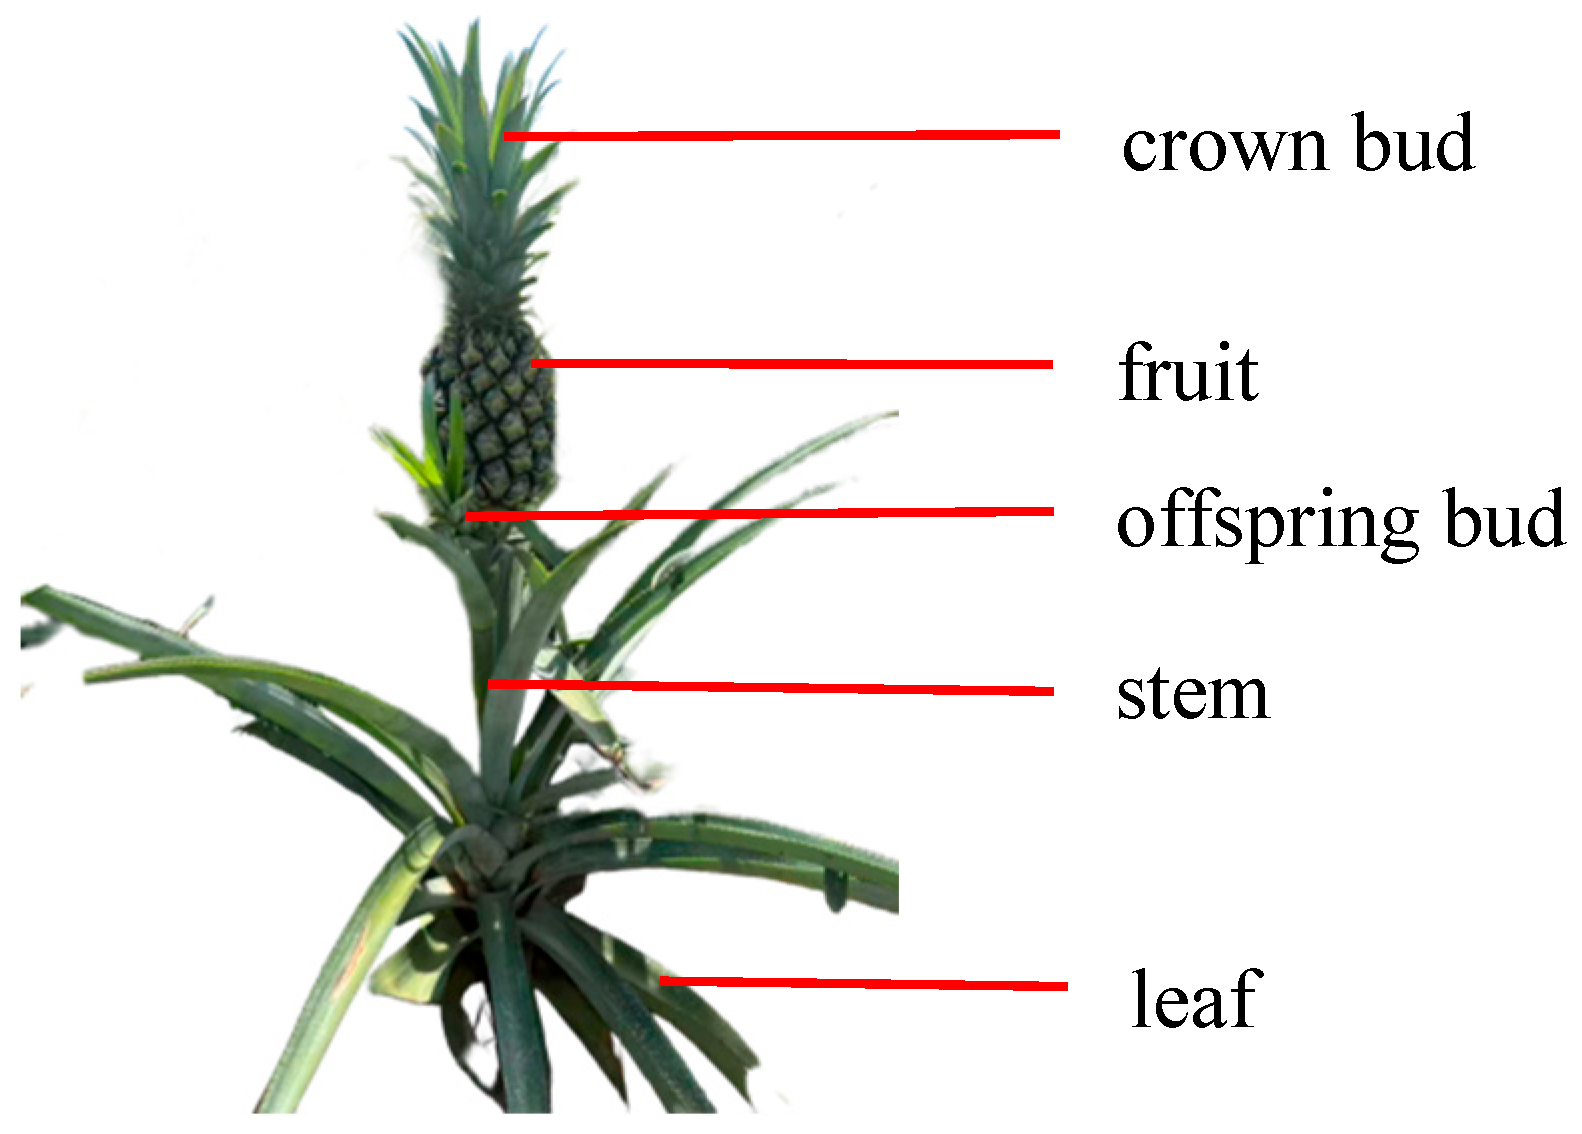
Figure 1. Composition of pineapple.
Agriculture 15 02422 g001
Figure 2. The main components and feature extraction diagram of pineapple.
Agriculture 15 02422 g002
Figure 3. Bi-linear constitutive model of cohesive zone model.
Agriculture 15 02422 g003
Figure 4. Pineapple fracture test.
Agriculture 15 02422 g004
Figure 5. Comparison of plant deformation between theoretical calculation and actual test.
Agriculture 15 02422 g005
Figure 6. Pineapple stem compression test. (a) Axial compression test; (b) Radial compression test.
Agriculture 15 02422 g006
Figure 7. Three-point bending test.
Agriculture 15 02422 g007
Figure 8. Solid model component diagram.
Agriculture 15 02422 g008
Figure 9. Boundary condition setting. (a) Test operating condition; (b) Simulation operating condition.
Agriculture 15 02422 g009
Figure 10. Correlation analysis of stem diameter. (a) Stem Diameter–Maximum Load Force; (b) Stem Diameter–Maximum Load Displacement.
Agriculture 15 02422 g010
Figure 11. Correlation analysis of stem length. (a) Stem Length–Maximum Load Force; (b) Stem Length–Maximum Load Displacement.
Agriculture 15 02422 g011
Figure 12. Correlation analysis of fruit diameter. (a) Fruit Diameter–Maximum Load Force; (b) Fruit Diameter–Maximum Load Displacement.
Agriculture 15 02422 g012
Figure 13. Correlation analysis of fruit length. (a) Fruit Length–Maximum Load Force; (b) Fruit Length–Maximum Load Displacement.
Agriculture 15 02422 g013
Figure 14. Trend comparison between simulation and test results.
Agriculture 15 02422 g014
Figure 15. Response stress cloud diagram of stem fracture. (a) Point 1; (b) Point 2; (c) Point 3.
Agriculture 15 02422 g015
Table 1. Size parameters and load results of different samples.
NumberStem Diameter (mm)Stem Length (mm)Fruit Diameter (mm)Fruit Length (mm)Maximum Load Force (N)Maximum Load Displacement (mm)
121.911099.116227.5428.27
227.410096.816029.5929.37
322.612594.617022.2529.76
423.8120102.517324.0929.74
524.3130106.518123.7729.05
626116101.917927.8827.64
723.611397.616824.6127.54
827.4125103.517726.8528.1
923.612394.817428.2229.36
1026.912099.116432.2425.55
Table 2. Parameters required for fruit construction.
ComponentElastic Modulus (MPa)Shear Modulus (MPa)Poisson’s RatioDensity (kg·m−3)Fruit Length (mm)Fruit Diameter (mm)
Fruit2.450.940.3950.5180100
Table 3. Relevant parameters of cohesive zone model of brittle separation layer.
ComponentInterface Stiffness Kt (N·mm−3)Maximum Traction Stress Strength (MPa)Maximum Displacement (mm)
Brittle separation layer10,0001.8092.208
Table 4. Parameters required for stem.
ComponentStem-XylemStem-Phloem
Anisotropic surface shear modulus Gr (MPa)5.7066.02
Isotropic surface shear modulus Gxy (MPa)1.1031.111
Radial elastic modulus Er (MPa)2.8672.889
Axial elastic modulus Ez (MPa)8.76415.594
Anisotropic surface Poisson’s ratio μ r0.40.2
Isotropic surface Poisson’s ratio μ xy0.30.3
Density ρ (kg·m−3)313.4313.4
Diameter/thickness (mm)22.20.5
Length (mm)120120
Disclaimer/Publisher’s Note: The statements, opinions and data contained in all publications are solely those of the individual author(s) and contributor(s) and not of MDPI and/or the editor(s). MDPI and/or the editor(s) disclaim responsibility for any injury to people or property resulting from any ideas, methods, instructions or products referred to in the content.