Article

Comparative Analysis of Evapotranspiration from METRIC (Landsat 8/9), AquaCrop, and FAO-56 in a Hyper-Arid Olive Orchard, Southern Peru

by
José Huanuqueño-Murillo
1,
David Quispe-Tito
1,
Javier Quille-Mamani
2,
German Huayna-Felipe
3,
Carolina Cruz-Rodriguez
4,
Bertha Vera-Barrios
5,
Lia Ramos-Fernández
6,* and
Edwin Pino-Vargas
3,*
1
Departament of Water Resources, National Agrarian University La Molina, Lima 15024, Peru
2
Geo-Environmental Cartography and Remote Sensing Group (CGAT), Universitat Politècnica de València, Camí de Vera s/n, 46022 Valencia, Spain
3
Departament of Civil Engineering, Jorge Basadre Grohmann National University, Tacna 23000, Peru
4
Doctoral Program in Water Resources, Jorge Basadre Grohmann National University, Tacna 23000, Peru
5
Faculty of Mining Engineering, National University of Moquegua, Moquegua 18001, Peru
6
Doctoral Program in Water Resources, Graduate School, National Agrarian University La Molina, Lima 15024, Peru
*
Authors to whom correspondence should be addressed.
Agriculture 2025, 15(23), 2423; https://doi.org/10.3390/agriculture15232423
Submission received: 5 November 2025 / Revised: 18 November 2025 / Accepted: 21 November 2025 / Published: 25 November 2025
(This article belongs to the Section Artificial Intelligence and Digital Agriculture)

Abstract

Accurate estimation of evapotranspiration (ET) is critical for precision irrigation in hyper-arid perennial systems. This study quantified ET in an 8 ha olive orchard in La Yarada–Los Palos (Tacna, Peru) by integrating the METRIC satellite-based energy-balance model (Landsat 8/9, Google Earth Engine) with the process-based AquaCrop model, using ETFAO-56 as an empirical benchmark. Sixteen cloud-free Landsat scenes from two contrasting seasons—2021–2022 (high-yield) and 2023–2024 (water-limited)—were processed to derive daily ET maps and model simulations aligned with satellite overpasses. Results revealed marked intra-parcel heterogeneity and clear seasonal dynamics. METRIC detected local ET peaks of ~6–7 mm d−1 in densely vegetated central blocks and orchard-mean values up to 4.25 ± 1.76 mm d−1. During the high-yield season, ETMETRIC and ETAQUACROP showed excellent agreement (R2 = 0.94; RMSE = 0.21 mm d−1; bias μ = 0.11 mm d−1), whereas FAO-56 consistently underestimated ET (R2 = 0.88; RMSE = 0.82 mm d−1). Under water-limited conditions, model correspondence remained strong but attenuated (ETMETRIC–ETAQUACROP: R2 = 0.75; RMSE = 0.64 mm d−1; ETMETRIC–ETFAO-56: R2 = 0.95; RMSE = 0.59 mm d−1), with METRIC exhibiting a persistent positive bias (μ = 0.43–0.56 mm d−1) attributable to localized soil evaporation and micro-advection. Overall, METRIC provided high-resolution spatial diagnostics of canopy stress, while AquaCrop offered daily continuity and explicit evaporation/transpiration (E/Tr) partitioning, enabling a coherent multiscale assessment of ET. The integrated framework enhances operational monitoring of water use and supports deficit-irrigation optimization in hyper-arid olive systems.

1. Introduction

Accurate estimation of evapotranspiration (ET) is a key component for sustainable irrigation management and climate change adaptation, particularly in arid regions where water availability remains the main limiting factor for agricultural production. In areas such as Tacna (Peru), characterized by severe water scarcity, it is essential to rely on robust, scalable, and cost-effective methodologies capable of quantifying the actual crop water consumption [1].
Traditional methods, such as weighing lysimeters, provide high accuracy but are constrained by high costs, intensive maintenance requirements, and limited spatial representativeness. The FAO-56 Penman–Monteith model remains widely used to estimate reference evapotranspiration (ETo) at the regional scale; however, its application in heterogeneous agricultural systems fails to adequately capture spatial variability and microclimatic conditions at the crop level [2].
Integrating remote sensing with surface energy balance models—particularly the METRIC algorithm (Mapping Evapotranspiration at High Resolution with Internalized Calibration)—represents a significant advancement in ETMETRIC estimation. METRIC combines surface energy balance principles with an internal calibration using hot and cold pixels, enabling the generation of ETMETRIC maps at 30 m resolution from Landsat imagery [3]. The model has shown strong performance in arid and semi-arid regions and has been validated against field measurements and other modeling approaches [4,5,6,7]. Nevertheless, its application to perennial crops under desert environments remains limited, with few documented experiences in olive orchards and other woody fruit crops. Recent studies, however, have reported promising results using METRIC or TSEB for such systems [1,8,9,10].
In recent years, these approaches have been extended to high-resolution platforms, integrating satellite data, multispectral and thermal UAV imagery, and cloud-based systems such as Google Earth Engine (GEE). Such advances have improved the spatio-temporal scaling of evapotranspiration and enabled the estimation of daily crop coefficients, as demonstrated by Liu et al. [11], who derived highly accurate Kc_act values using multispectral and thermal UAV data. Likewise, recent studies have confirmed the capability of hybrid and fused datasets (e.g., Sentinel–UAV or Landsat–MODIS) to enhance ET resolution and consistency in arid environments [12,13]. More recently, hybrid machine-learning frameworks have also been incorporated into ET modeling, combining spectral and physical information to improve spatio-temporal upscaling [14]. However, the applicability of these approaches in perennial crops under desert conditions has not yet been broadly validated.
Complementarily, crop simulation models such as AquaCrop explicitly represent soil–plant–atmosphere interactions by separating soil evaporation from plant transpiration. This capability is essential for analyzing water-use efficiency (WUE) and evaluating the impacts of water deficit on agricultural productivity. Several studies have validated AquaCrop in arid and semi-arid environments for extensive crops such as sugarcane, maize, cotton, and potato, demonstrating high accuracy in simulating biomass, yield, and evapotranspiration [15,16,17]. More recently, its application to woody perennial crops such as grapevine and olive has shown promising results for irrigation planning and water-management strategies in arid and Mediterranean environments [18,19]. However, direct comparisons between satellite-based ET estimates and AquaCrop simulations for perennial crops remain scarce, highlighting a relevant gap for integrating physical and remote sensing-based models to support efficient irrigation management [17,20].
The combination of surface energy balance models with crop simulation models has emerged as a robust methodological strategy to estimate evapotranspiration with high accuracy and optimize water management. In particular, integrating METRIC with AquaCrop leverages the strengths of both approaches: METRIC provides the spatial resolution required to characterize intra-field variability of water consumption, whereas AquaCrop offers temporal continuity and functional partitioning of evaporation and transpiration, both of which are critical under localized irrigation systems [2,17,21,22]. Recent studies indicate that this integration can reduce uncertainty in ET estimation, improve the spatio-temporal characterization of water fluxes, and strengthen decision-making under water-scarcity scenarios [20,23,24].
Beyond their implementation differences, AquaCrop and METRIC rely on fundamentally different physical principles to estimate evapotranspiration. AquaCrop represents the soil–plant–atmosphere continuum through a daily root-zone water balance, where total crop evapotranspiration (ETc) is partitioned into soil evaporation (E) and plant transpiration (Tr). Transpiration is driven by canopy cover development and reference evapotranspiration (ETo) and is reduced by water and salinity stress coefficients when soil depletion exceeds critical thresholds, whereas soil evaporation depends on the fraction of exposed soil and near-surface moisture conditions. In contrast, METRIC retrieves ET from the surface energy balance at satellite overpass time, solving LE = Rn−G−H, where net radiation (Rn), soil heat flux (G), and sensible heat flux (H) are derived from radiative forcing and land surface temperature (LST) using an internal calibration between hot (dry bare soil) and cold (well-irrigated vegetation) pixels. Thus, AquaCrop provides a process-based, temporally continuous representation of ET driven by root-zone water dynamics, whereas METRIC offers spatially explicit ET estimates derived from instantaneous energy partitioning at the land surface. Their combined use enables a physically consistent assessment of water use and irrigation performance under hyper-arid olive systems.
In this context, the present study analyzes and compares three evapotranspiration modeling approaches in a hyper-arid olive orchard in Tacna, Peru: the METRIC energy-balance model applied to Landsat 8/9 imagery, daily ET simulations from a field-calibrated AquaCrop model, and the FAO-56 formulation as an empirical benchmark. This integrated framework is designed to improve the reliability and spatial representativeness of ET estimation in perennial cropping systems under extreme water scarcity. By jointly leveraging METRIC’s spatial diagnostics and AquaCrop’s temporal continuity, the study tests the hypothesis that combining satellite-based energy-balance modeling with process-based soil–water balance simulations yields a more physically consistent and operationally relevant characterization of ET dynamics than either model alone, thereby strengthening the scientific basis for precision irrigation, water-use optimization, and sustainable orchard management in hyper-arid environments.

2. Materials and Methods

2.1. Overview

The methodological framework integrates the METRIC energy balance model and the AquaCrop process-based crop model (FAO) to estimate and compare olive evapotranspiration under hyper-arid conditions in southern Peru.
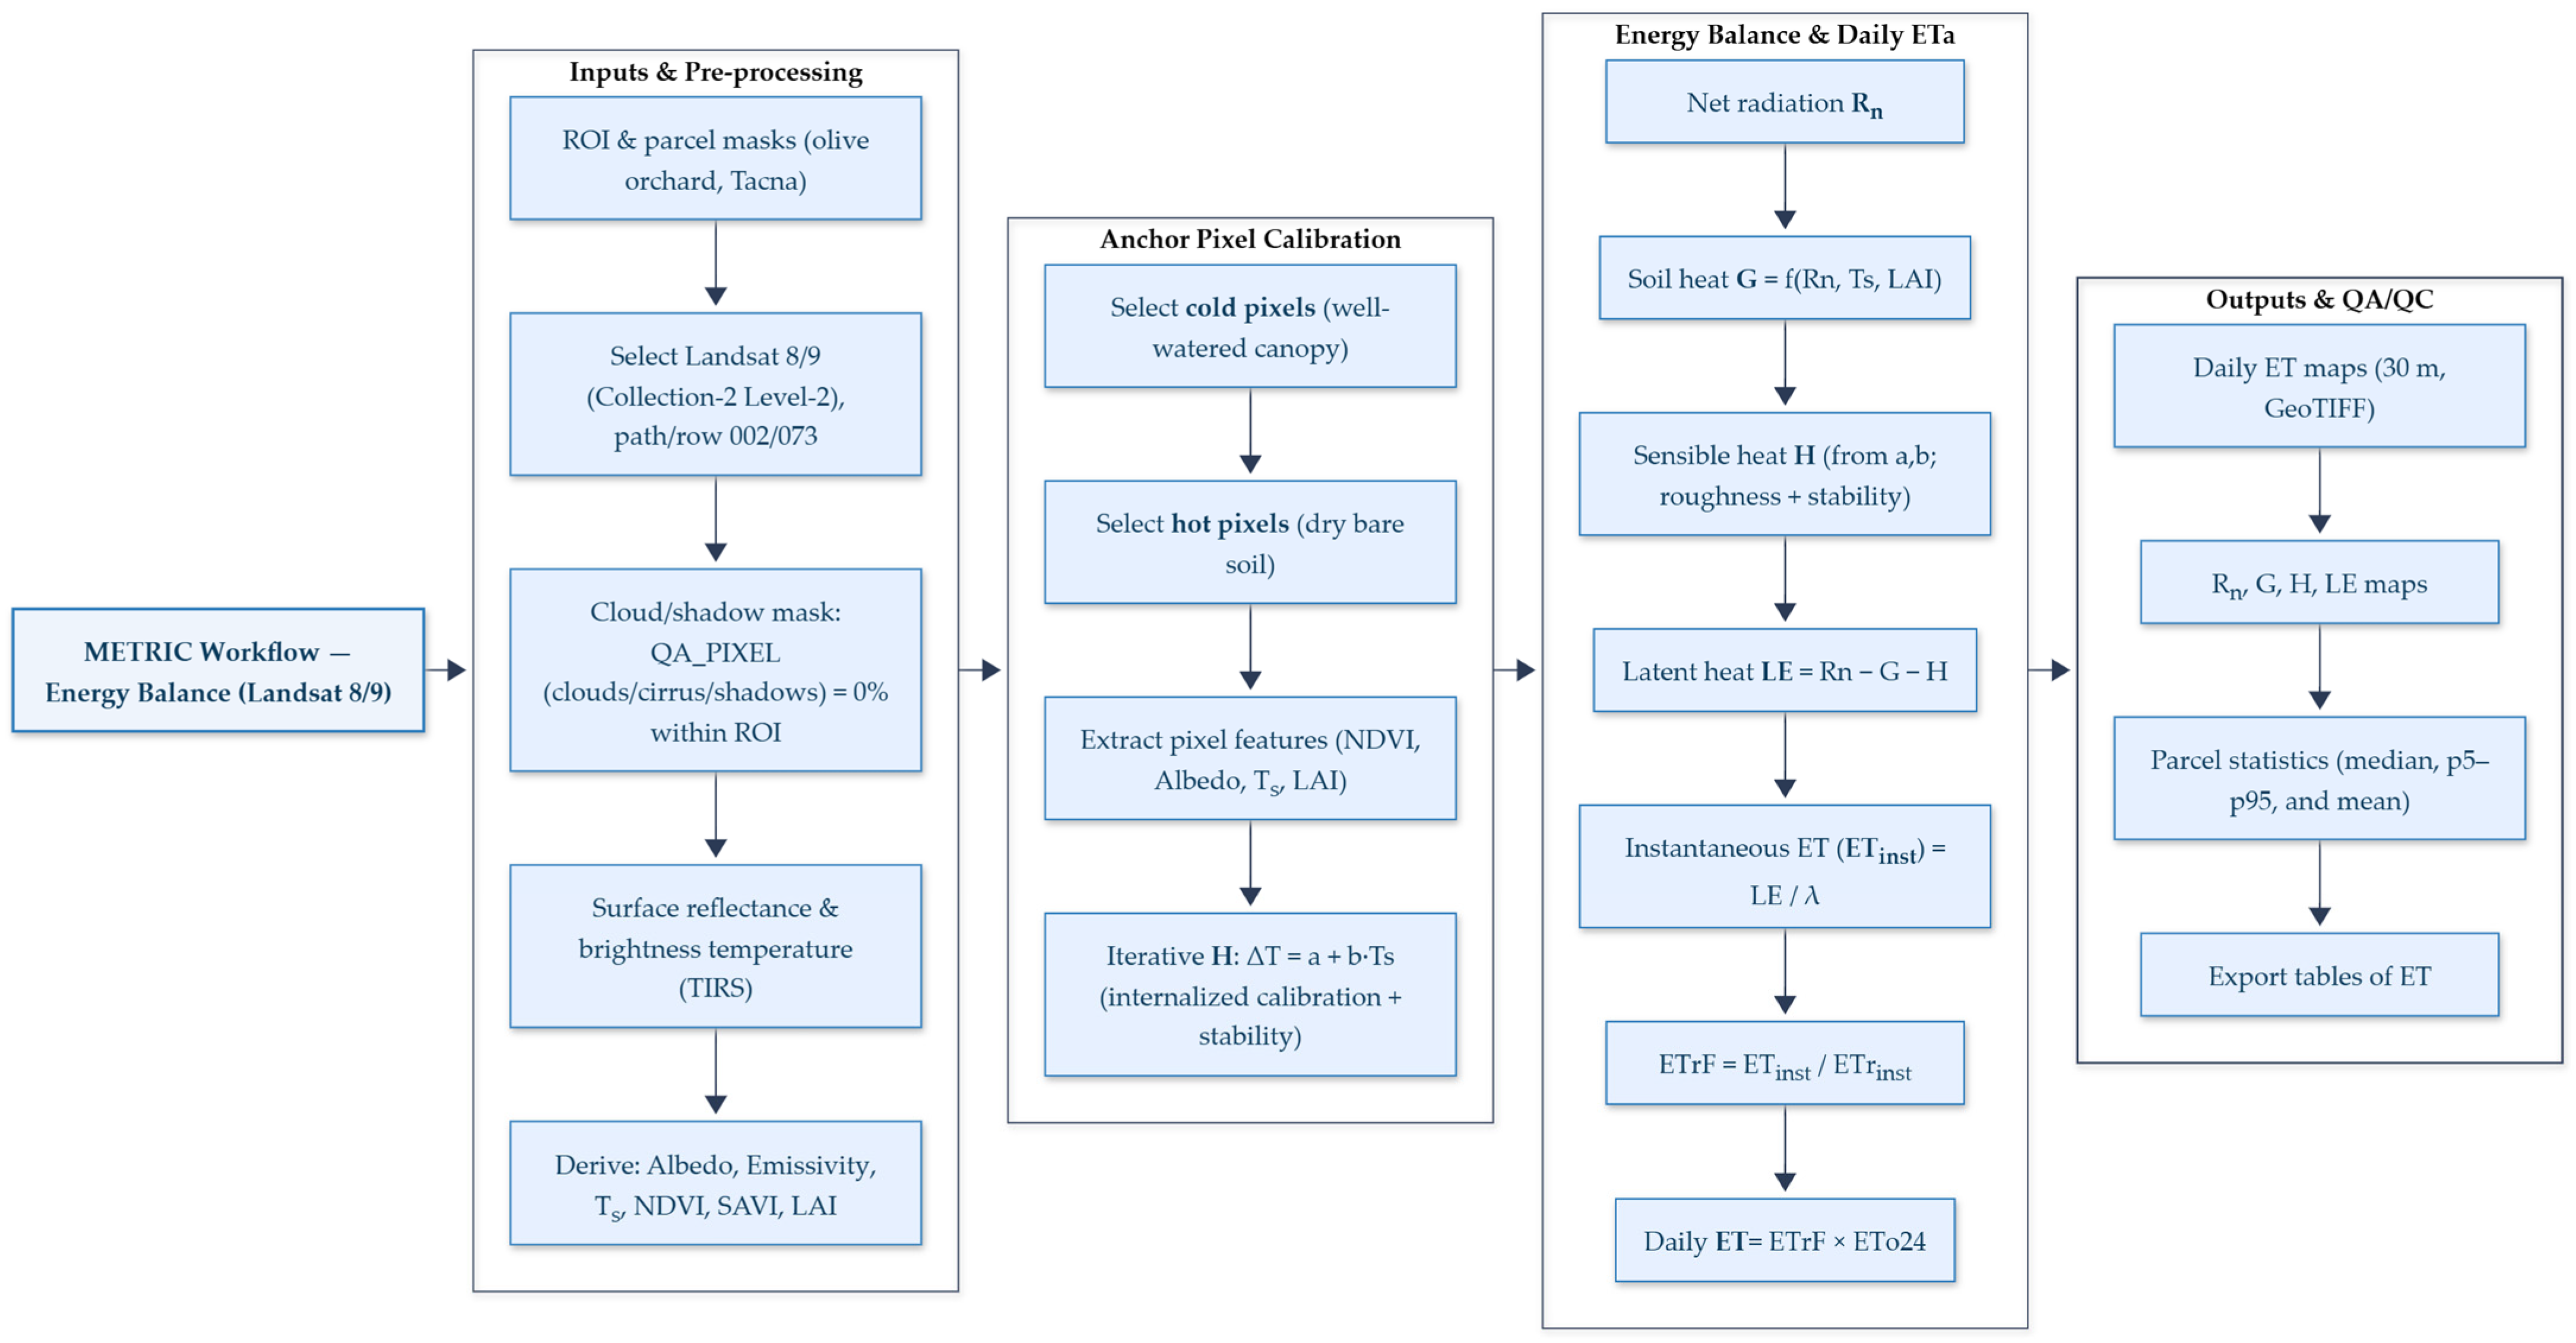
As illustrated in Figure 1, the workflow combines Landsat 8/9 multispectral and thermal imagery (Collection 2, Level 2) with in situ meteorological data from a Davis Vantage Pro2 automatic weather station (Davis Instruments Corp., Hayward, CA, USA) and field agronomic measurements, all processed in Google Earth Engine (GEE).
Within the METRIC framework, surface reflectance and thermal bands are used to derive spectral variables (albedo, Ts, NDVI, LAI). Internal calibration is achieved through the selection of cold and hot anchor pixels, followed by iterative estimation of the sensible heat flux (H) to obtain the empirical coefficients a and b. From the surface energy balance components (Rn, G, H, LE), the model generates ETMETRIC maps at 30 m resolution.
In parallel, AquaCrop simulates the soil–plant–atmosphere water balance using site-specific soil, crop, and management parameters. The reference evapotranspiration (ETo), computed via the FAO-56 Penman–Monteith equation, serves as the main forcing variable. The model outputs daily crop evapotranspiration (ETc = E + Tr), which were temporally matched with Landsat overpass dates.
A complementary FAO-56 series was calculated using a monthly Kc curve adapted to local phenological stages, providing an empirical baseline for intermodel comparison. All outputs were temporally aligned with Landsat acquisition dates and spatially aggregated using the median within the 8 ha olive orchard.
Model performance was assessed through R2, RMSE, MAE, and rRMSE, ensuring a robust evaluation of temporal coherence and model sensitivity in estimating evapotranspiration and water-use efficiency (WUE) under extreme aridity.

2.2. Study Area and Irrigation Management

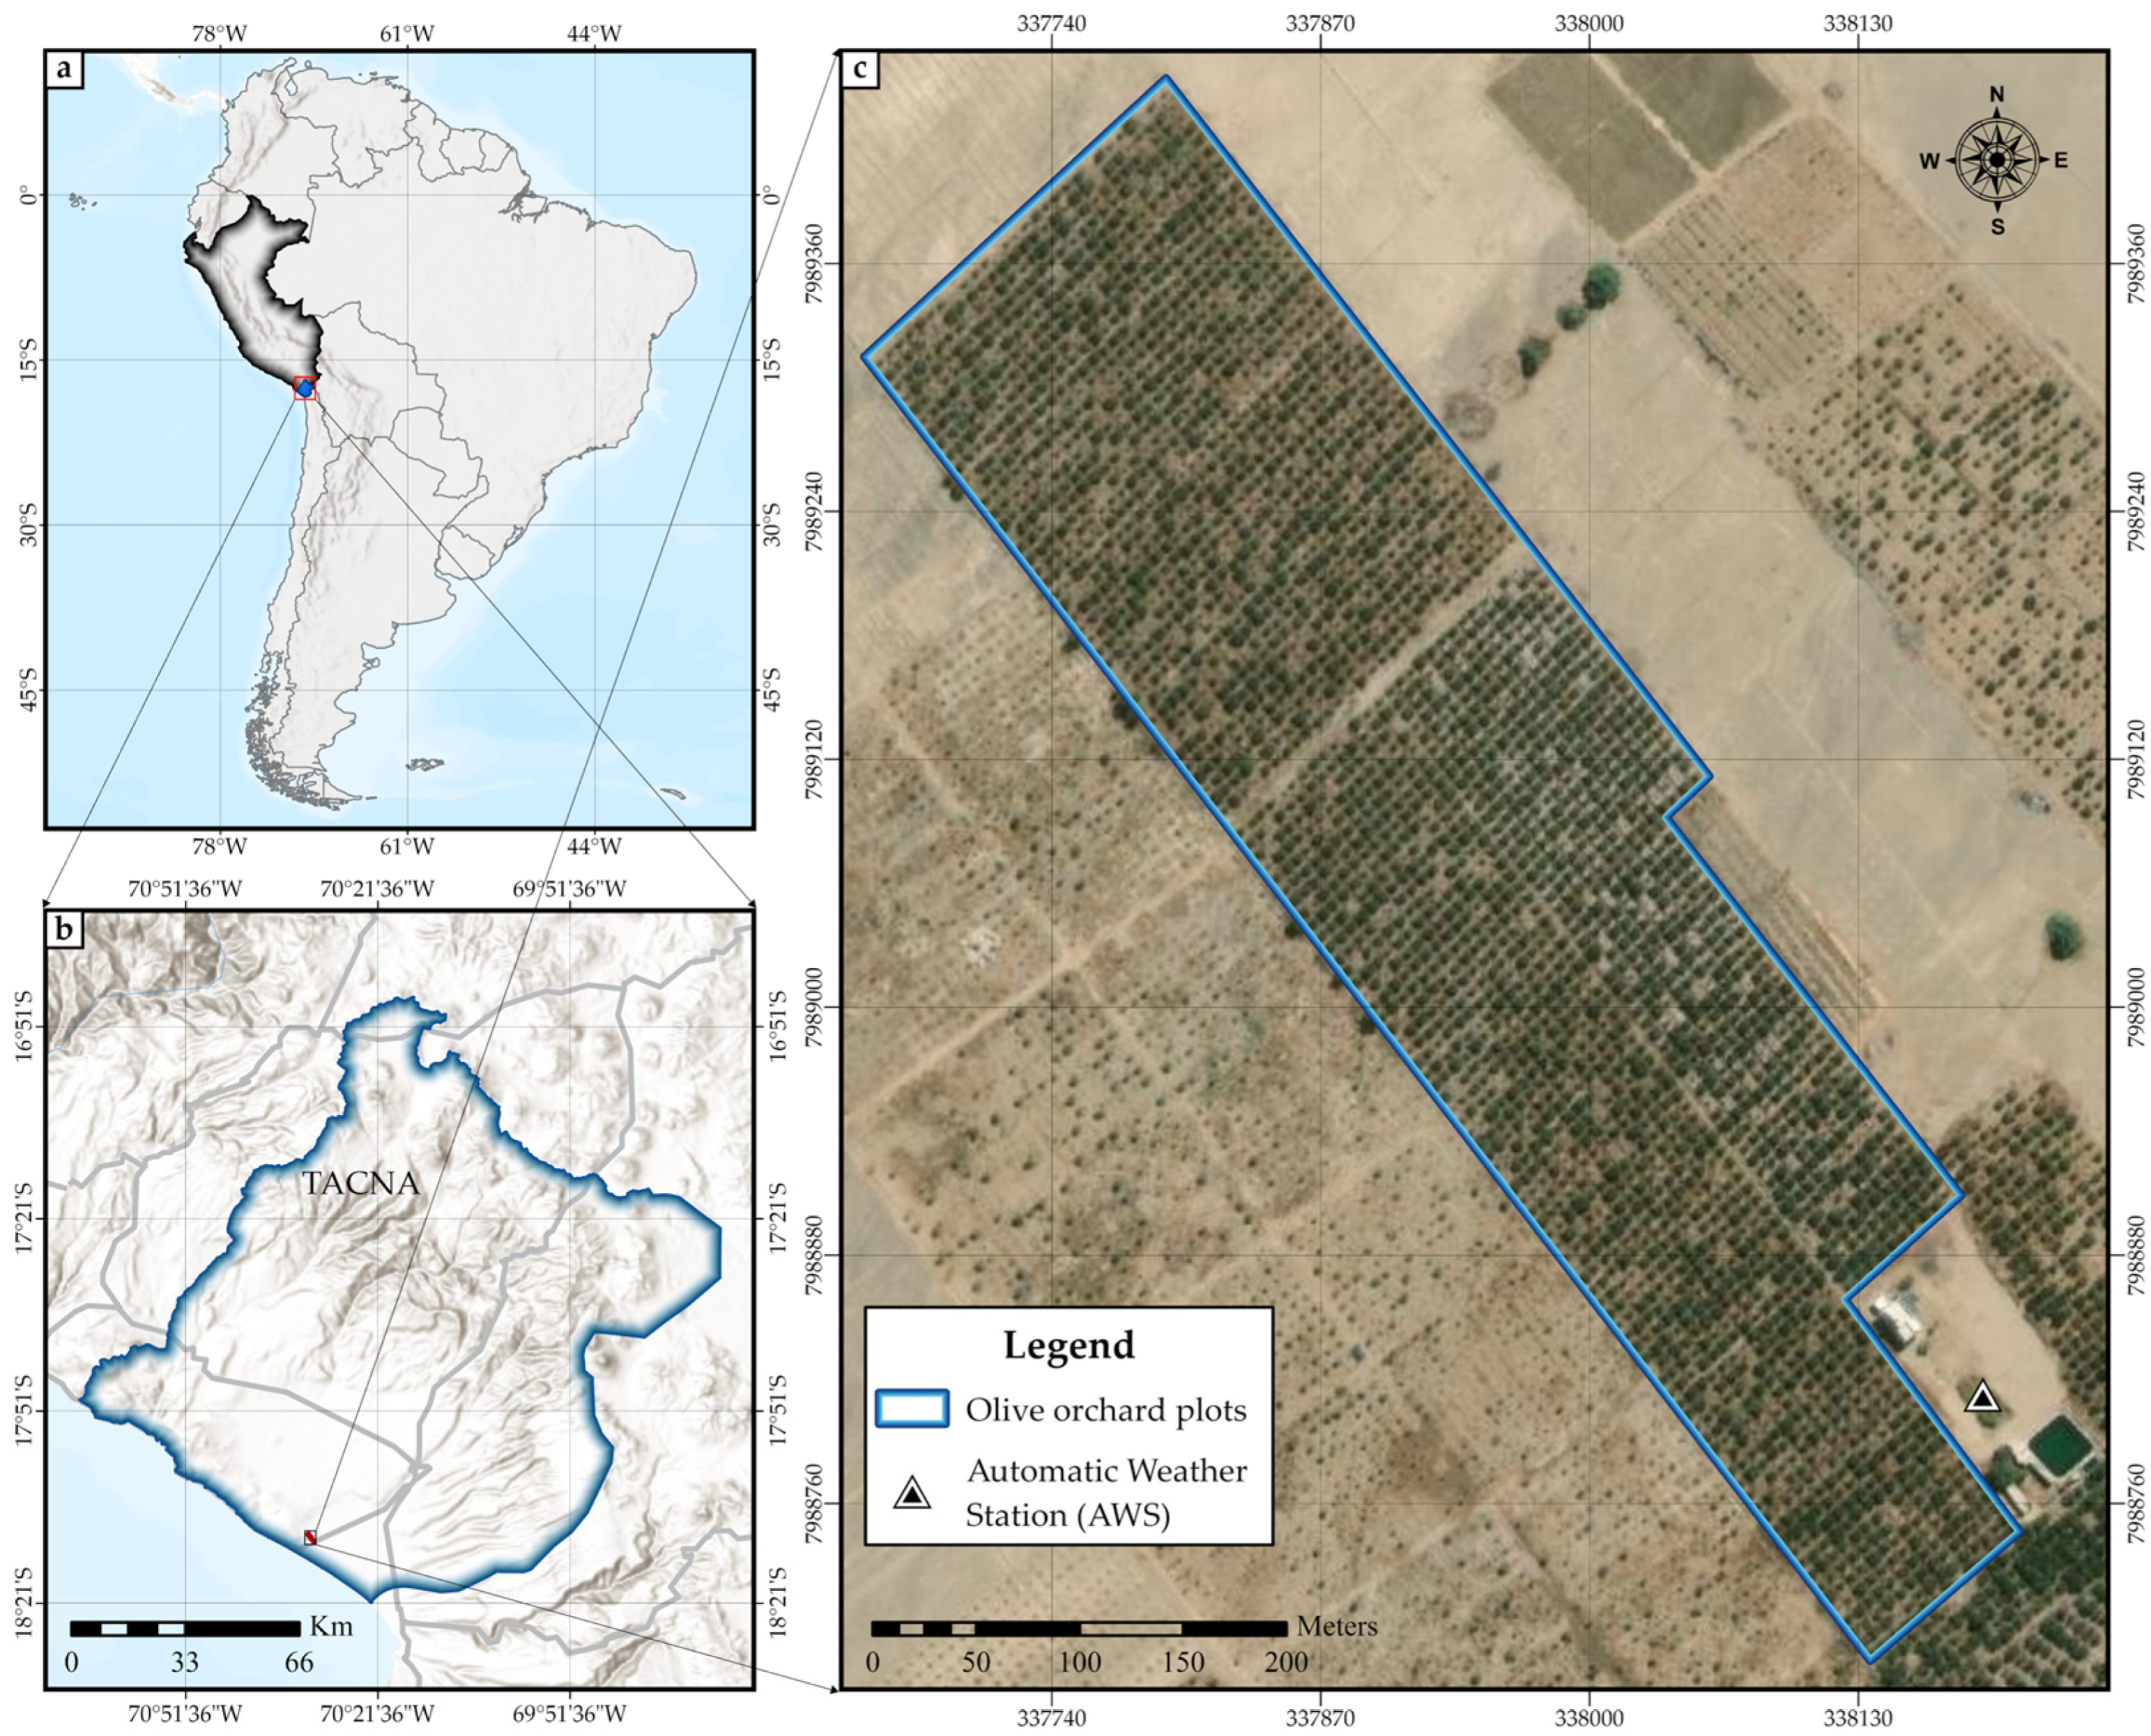
The study was carried out in an experimental olive orchard (Olea europaea L., cv. ‘Sevillana’) covering approximately 8 ha, located in the district of La Yarada–Los Palos, Tacna region, southern Peru (18°10′55″ S, 70°31′52″ W) (Figure 2). The site lies within an extremely arid coastal plain characterized by mean annual precipitation below 35 mm and strong thermal seasonality, with average temperatures of 13–15 °C in winter and 23–25 °C in summer. Relative humidity exceeds 70% during winter months due to the camanchaca (coastal fog), while solar radiation remains high year-round, surpassing 18 MJ m−2 d−1 during summer.
Soils are classified as sandy loam to loamy sand according to the USDA Soil Taxonomy, based on laboratory-determined particle size fractions (sand, silt, and clay). They exhibit a field capacity of approximately 11% and a permanent wilting point of 5.3%, consistent with previously reported values for coarse-textured alluvial soils in La Yarada [22]. These hydraulic properties indicate a limited water-holding capacity and high infiltration rates characteristic of sandy and sandy loam soils in arid and hyper-arid environments [25,26]. The orchard consists predominantly of the ‘Sevillana’ cultivar (~96%), with ‘Ascolana’ (~4%) as pollinator. Trees are 22 years old and spaced at 7 × 7 m (~200 trees ha−1). Irrigation is supplied through a pressurized drip system with two laterals per row; emitters have a nominal discharge of 1.5 L h−1 and are spaced at 0.40 m. Irrigation water is moderately saline (C3S3; EC = 1.35 dS m−1; pH = 7.1), requiring careful management to prevent salt accumulation under hyper-arid conditions.
Irrigation scheduling followed a weekly interval (~2–3 days) from October to April in both agricultural campaigns. The single irrigation quota, calculated from measured irrigation duration and emitter discharge, averaged 17–20 mm per event in 2021–2022 and 12–15 mm per event in 2023–2024. These values were incorporated into the AquaCrop Irrigation Management module as fixed irrigation depths.
In the high-yield 2021–2022 campaign, the combination of a stable weekly interval and higher irrigation depths maintained full root-zone replenishment during mid-season, preventing water stress. In contrast, in the 2023–2024 campaign, although the irrigation interval remained unchanged, the ~25–30% reduction in irrigation depth limited soil-water recharge during periods of peak evaporative demand (January–March), producing the observed seasonal water limitation. This clarification demonstrates that water stress in 2023–2024 was caused primarily by reduced irrigation depth, rather than by changes in irrigation frequency.
Meteorological data were recorded by an automatic weather station (AWS; 18°15′34″ S, 70°24′00″ W) installed immediately adjacent to the southeastern boundary of the experimental orchard (Figure 2c). The station is located on the same flat, hyper-arid coastal plain as the olive block and is free of obstructions, so that measured radiation, temperature, humidity, and wind speed are representative of the microclimatic forcing acting on the 8 ha study area. The AWS records air temperature, relative humidity, solar radiation, and wind speed at 30 min intervals. These variables were used to compute the reference evapotranspiration (ETo) using the FAO-56 Penman–Monteith method, providing the principal climatic forcing for both the AquaCrop and METRIC models.

2.3. Data Collection and Preprocessing

Two contrasting agricultural campaigns were analyzed: 2021–2022, characterized by high productivity, and 2023–2024, marked by a significant yield reduction. For each campaign, eight cloud-free Landsat 8 and 9 (OLI/TIRS) scenes (Collection 2, Level 2) were selected, from which surface reflectance, albedo, emissivity, and land surface temperature (LST) were derived.
Daily reference evapotranspiration (ETo) was computed using the FAO-56 Penman–Monteith equation based on meteorological data recorded by the local automatic weather station. All comparisons between ETMETRIC, ETAQUACROP, and ETFAO-56 were aligned with the corresponding Landsat overpass dates. The spatial aggregation of METRIC outputs was performed using the median within the region of interest (ROI) to minimize the influence of outlier pixels.
Model performance was assessed using standard statistical indicators, including the coefficient of determination (R2), root mean square error (RMSE), mean absolute error (MAE), mean bias error (MBE), and Nash–Sutcliffe efficiency (NSE). Both ordinary least squares (OLS) and Deming regression were applied, and results were visualized through 1:1 scatter plots with confidence intervals.
Model calibration and validation were conducted across two contrasting agricultural campaigns, providing a robust experimental framework for model evaluation: one representing optimal physiological performance (2021–2022; yield = 11.57 t ha−1) and the other reflecting yield-limiting conditions (2023–2024; yield = 6.84 t ha−1). This contrast enabled a rigorous assessment of the coherence, sensitivity, and stability of the METRIC and AquaCrop models under distinct agronomic and climatic conditions.
Field data collection included soil characterization (texture, bulk density, field capacity, and permanent wilting point across 0–80 cm profiles), phenological observations, canopy cover (CC) estimation, and irrigation volume monitoring per plot. These datasets were essential for AquaCrop parameterization and calibration, as well as for the cross-validation of METRIC-derived evapotranspiration (ETMETRIC) estimates.

2.3.1. Meteorological Conditions

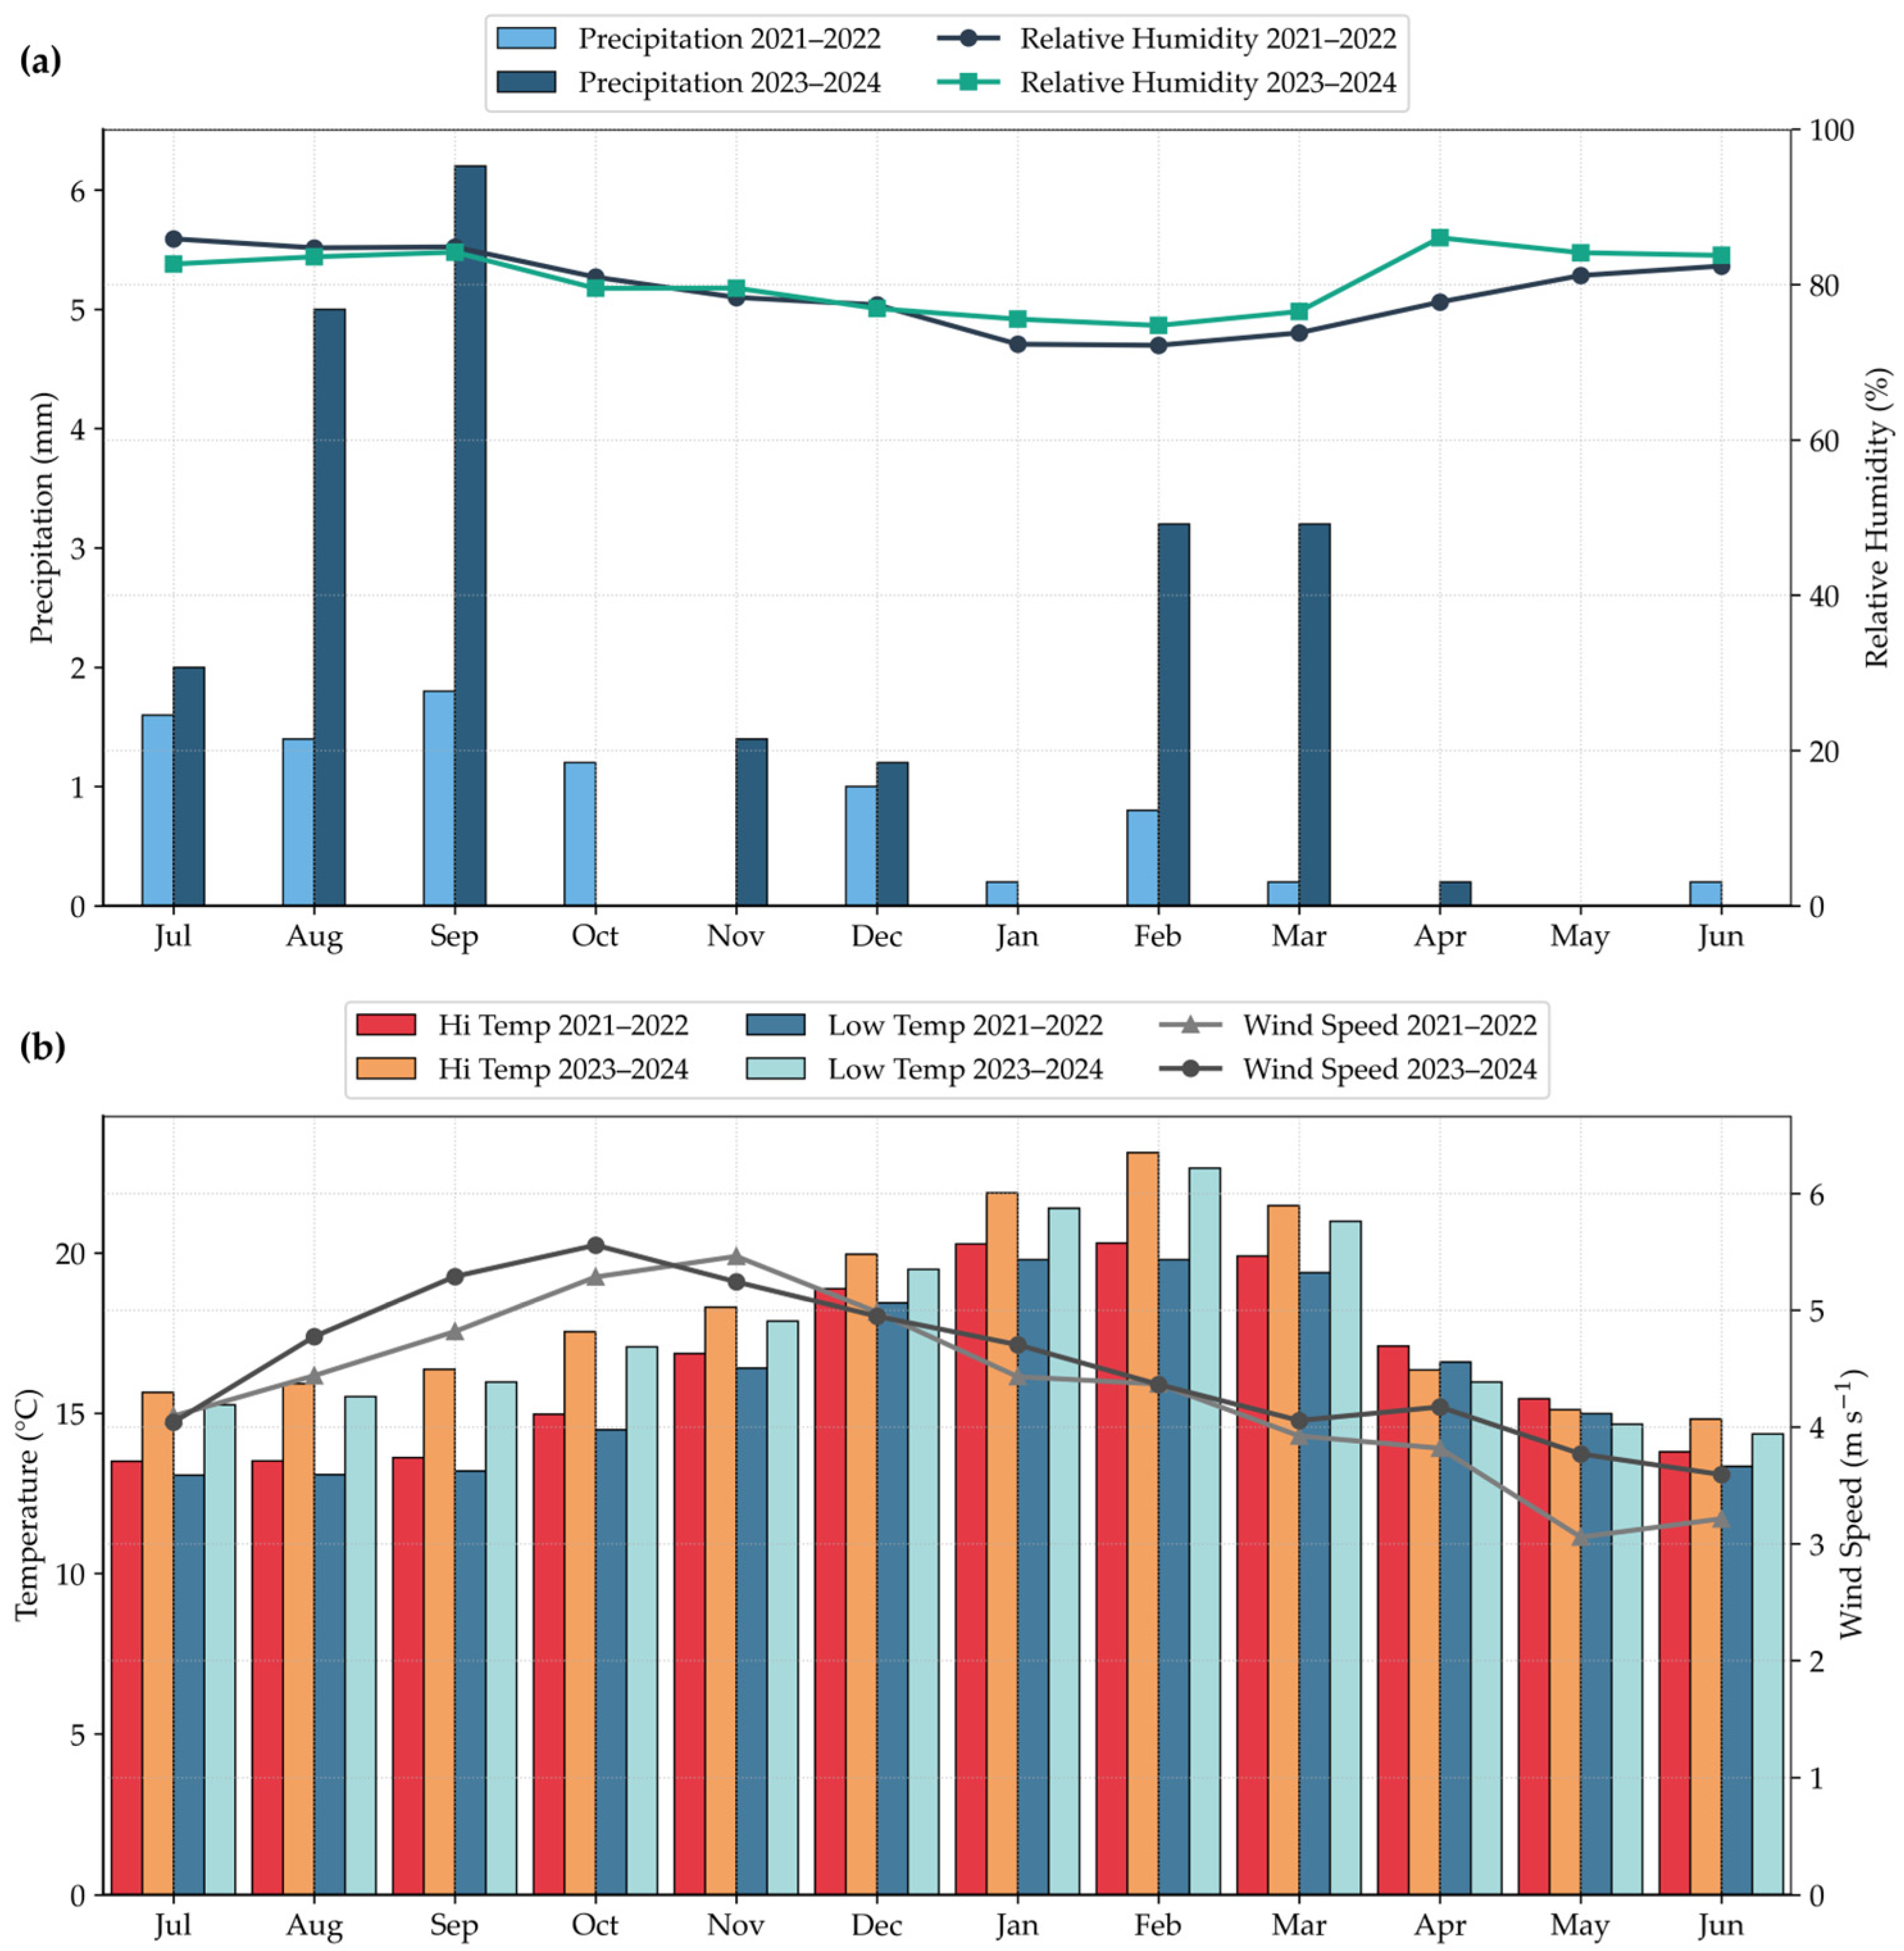
Meteorological data were recorded using an automatic weather station installed near the experimental olive orchard. The station measured air temperature (Tmax, Tmin; °C), relative humidity (%), solar radiation (W m−2), and wind speed at 2 m height (m s−1) at 30 min intervals. All records underwent quality control to ensure consistency and completeness and were subsequently aggregated to daily and monthly scales for computation and visualization (Figure 3).
Daily reference evapotranspiration (ETo) was computed using the FAO-56 Penman–Monteith equation based on these meteorological variables. The resulting ETo(24) series served as the climatic forcing for AquaCrop and as the temporal scaling factor for METRIC-derived ET via the reference evapotranspiration fraction (ETrF), ensuring coherence between ground observations and satellite-based estimates.
Both seasons exhibited the typical seasonality of a hyper-arid climate, characterized by negligible rainfall, high winter humidity associated with coastal fog (camanchaca), intense summer thermal peaks in January–February, and a gradual decline in wind speed toward the end of the warm period. These meteorological patterns directly controlled reference evapotranspiration (ETo) and provided the climatic basis for its integration into the AquaCrop and METRIC models.

2.3.2. Field Measurements and Yield Assessment

Agronomic monitoring and yield evaluation were conducted during two contrasting agricultural campaigns of the experimental olive orchard: a high-yield season (2021–2022; yield = 11.57 t ha−1) and a water-limited season (2023–2024; yield = 6.84 t ha−1). This marked reduction in productivity reflects the combined effects of restricted water availability, high evaporative demand, and soil salinity stress, providing a robust experimental framework to evaluate the response of the orchard under contrasting physiological and environmental conditions.
In both campaigns, irrigation volumes, phenological stages, and management practices were systematically monitored and incorporated into the AquaCrop simulations and METRIC-derived ET estimations for cross-validation. The pronounced interannual variability in yield highlights the strong sensitivity of olive trees to water availability and canopy dynamics in arid environments, underscoring the relevance of integrating process-based and energy-balance models to enhance water-use efficiency (WUE) and improve irrigation management under hyper-arid conditions.

2.4. Model Framework

2.4.1. AquaCrop Configuration and Calibration

AquaCrop estimates daily crop evapotranspiration (ETc) by combining a root-zone soil–water balance with a simplified representation of canopy development and biomass production. At each time step, ET is computed as the sum of soil evaporation (E) and crop transpiration (Tr). Transpiration is driven by reference evapotranspiration (ETo) and green canopy cover, and it is reduced by multiplicative stress coefficients when water or salinity constraints occur. Soil evaporation is controlled by the fraction of exposed soil, surface wetness, and upper soil-layer depletion. Biomass accumulation is proportional to cumulative transpiration through a conservative water productivity parameter, and yield is derived from biomass via a harvest index further reduced under stress. In this framework, ET emerges from the interaction between climatic forcing, soil hydraulic properties, and management practices (irrigation and salinity), providing a process-based reference for evaluating ET dynamics and water-use efficiency.
The AquaCrop (FAO) model was configured and calibrated to simulate the soil–water balance, canopy dynamics, and productivity of the experimental olive orchard located in La Yarada–Los Palos (Tacna, Peru), cultivated under drip irrigation and hyper-arid climatic conditions. AquaCrop has been widely validated for its ability to reproduce the biophysical responses of crops under contrasting water regimes, particularly in perennial and woody systems [27,28,29].
Calibration was based on two contrasting agricultural campaigns of the experimental olive orchard: a high-yield season (2021–2022; yield = 11.57 t ha−1) and a water-limited season (2023–2024; yield = 6.84 t ha−1). This interannual contrast provided a robust experimental framework for evaluating model performance under both optimal and deficit irrigation scenarios characteristics of hyper-arid environments.
Daily meteorological inputs included maximum and minimum air temperature, relative humidity, solar radiation, wind speed, and atmospheric pressure, recorded at 30 min intervals by an automatic weather station located adjacent to the experimental site. These data were aggregated to daily values and used to compute reference evapotranspiration (ETo) using the FAO-56 Penman–Monteith equation, which served as the primary climatic driver for the simulations.
Soil characterization (0–80 cm depth) included measurements of texture, bulk density, field capacity (FC), permanent wilting point (PWP), and porosity—parameters essential for defining the soil hydraulic balance. The orchard consisted primarily of the ‘Sevillana’ cultivar (~96%) with ‘Ascolana’ (~4%) as pollinator, planted at 7 × 7 m spacing (~200 trees ha−1). Irrigation water was classified as C3S3 (EC = 1.35 dS m−1; pH ~ 7.1), requiring careful management to mitigate salinity buildup and maintain water-use efficiency.
Irrigation inputs in AquaCrop were parameterized using field-measured irrigation schedules, consisting of a fixed weekly interval (~2–3 days) and single irrigation depths of 17–20 mm in 2021–2022 and 12–15 mm in 2023–2024. These values were implemented as fixed irrigation depths in the Irrigation Management module. This parametrization accurately reproduced the contrasting soil–water regimes observed in the orchard. Notably, although the irrigation interval remained unchanged between campaigns, the ~25–30% reduction in irrigation depth during 2023–2024 generated cumulative soil-moisture depletion during mid-season (January–March). As a result, AquaCrop was able to simulate the onset, progression, and magnitude of water stress consistently with field observations and with the reductions in ETMETRIC detected from satellite energy-balance modeling.
Canopy cover (CC, %) was derived from 24 PlanetScope scenes (3 m spatial resolution; 12 per campaign) selected for minimal cloud cover. Each image was atmospherically corrected and classified using a supervised Random Forest (RF) algorithm to discriminate olive canopy from bare soil. Training samples were collected in the field and labeled into two classes—vegetation (olive) and bare soil—based on georeferenced reference points. The eight PlanetScope spectral bands (coastal blue, blue, green I, green, yellow, red, red edge, and near-infrared) were used as predictor variables. The RF classifier was trained with an 80/20 split between training and validation datasets, achieving high overall accuracy and minimal confusion between spectrally similar classes. The resulting monthly classification maps were exported as GeoTIFFs and integrated into QGIS 3.44. for spatial analysis. This procedure, applied to both agricultural campaigns, provided reliable canopy-cover estimates supporting AquaCrop calibration and cross-validation of METRIC-derived ET.
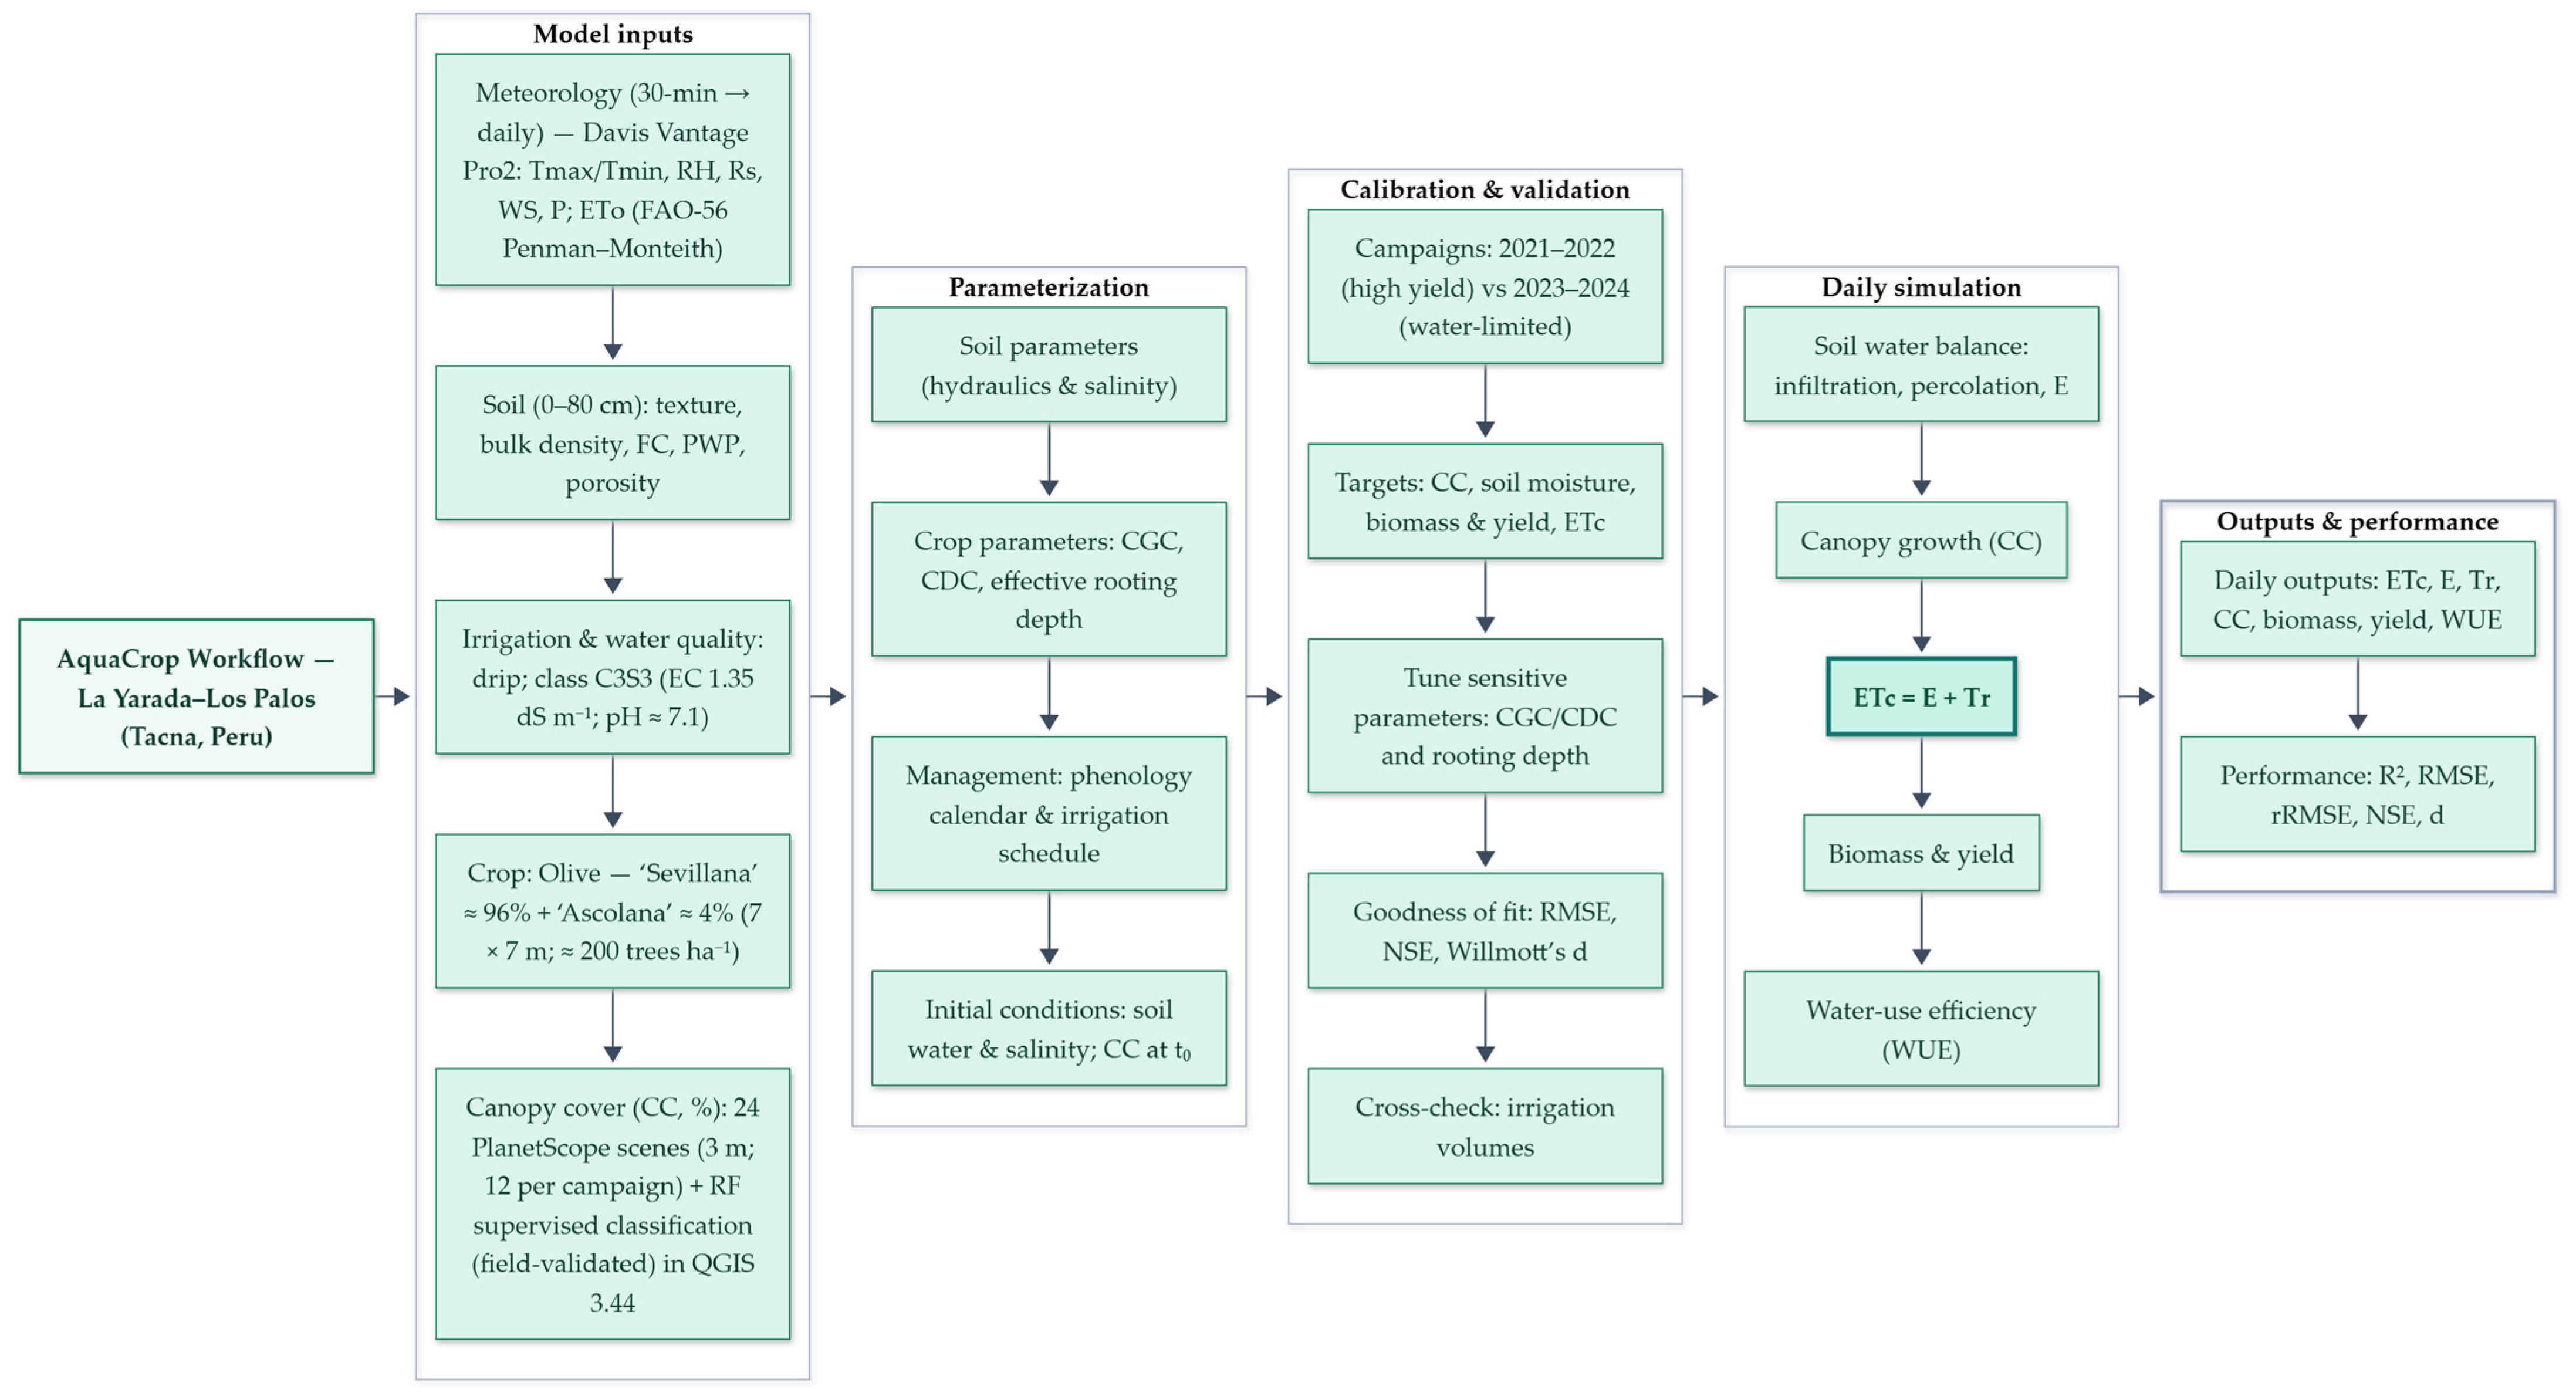
Model calibration focused on adjusting key physiological and management parameters—such as the canopy growth coefficient (CGC), canopy decline coefficient (CDC), and effective rooting depth—until convergence was achieved between simulated and observed canopy cover, soil moisture, biomass, and yield. Model performance was evaluated using the Root Mean Square Error (RMSE), Nash–Sutcliffe Efficiency (NSE), and Willmott’s index of agreement (d). Once calibrated, AquaCrop simulated daily fluxes of soil evaporation (E), crop transpiration (Tr), and total evapotranspiration, as well as biomass accumulation, final yield, and water-use efficiency (WUE). The resulting daily ETc series were temporally matched with METRIC-derived ET and FAO-56 estimates for cross-validation and intermodel comparison (Figure 4).

2.4.2. Modelo METRIC

(a) Satellite Image Processing
Satellite data preprocessing was conducted in Google Earth Engine (GEE) using Landsat 8 OLI/TIRS and Landsat 9 OLI-2/TIRS-2 imagery from Collection 2, Level 2, which provides surface reflectance and brightness temperature products already atmospherically corrected.
For each agricultural season (2021–2022 and 2023–2024), eight cloud-free Landsat scenes were selected to capture the main phenological stages of olive growth, including budburst, flowering, fruit set, pit hardening, and ripening [30]. These temporal snapshots ensured comprehensive coverage of canopy development and water-demand dynamics throughout the crop cycle.
Images were filtered by path/row 002/073 and by the region of interest (ROI) corresponding to the experimental olive orchard in La Yarada–Los Palos, Tacna, Peru. Scene identification was based on the official LANDSAT_PRODUCT_ID, ensuring 0% cloud cover within the ROI, verified using the QA_PIXEL bitmask (clouds, cirrus, and cloud shadows).
From each image, the input variables required by the METRIC model were derived, including surface reflectance, albedo, emissivity, and land surface temperature (LST). Additionally, complementary spectral indices such as NDVI, SAVI, and LAI were computed and used in energy balance parameterization.
Table 1 summarizes the characteristics of the 16 Landsat scenes used in the study, specifying the sensor, acquisition date, day of year (DOY), local overpass time (UTC–5), path/row, product identifier, and cloud cover percentage within the ROI. All selected scenes exhibited suitable radiometric and geometric quality for the application of the METRIC model within GEE.
All METRIC processing scripts used in Google Earth Engine (GEE), including the adapted functions for olive orchards in hyper-arid environments, are openly available in the project repository (https://github.com/JLHM1998/METRIC-Olive-HyperArid-Peru (accessed on 17 September 2025)). This repository contains the full implementation of image preprocessing, anchor-pixel selection, energy-balance computation, and temporal upscaling, ensuring full transparency and reproducibility of the METRIC workflow applied in this study.
(b) Energy and Water Use Efficiency Balance
In METRIC, actual evapotranspiration is retrieved from the surface energy balance at the time of the satellite overpass. The model assumes that net radiation (Rn) is partitioned into sensible heat flux (H), soil heat flux (G), and latent heat flux (LE). Net radiation is estimated from incoming and outgoing shortwave and longwave radiation computed from surface albedo, emissivity, and atmospheric forcing. Soil heat flux is parameterized as a fraction of Rn modulated by leaf area index (LAI) and land surface temperature (LST), while sensible heat flux is derived from the near-surface air temperature gradient and aerodynamic resistance, using an internal calibration of the Ts–ΔT relationship based on hot (dry bare soil) and cold (well-watered vegetation) anchor pixels. Latent heat flux is then converted into instantaneous ET, which is scaled to daily values using the reference evapotranspiration fraction (ETrF = ETinst/ETrinst). This physically based approach links the spatial structure of radiative and thermal fields to actual evapotranspiration, enabling high-resolution mapping of water consumption and energy partitioning at the field scale.
Evapotranspiration (ET) was estimated using the METRIC model, implemented in Google Earth Engine (GEE) from Landsat 8 OLI/TIRS and Landsat 9 OLI-2/TIRS-2 imagery (Collection 2, Level 2) combined with in situ meteorological data (Figure 3).
The approach integrates surface available energy, local atmospheric conditions, and crop spectral dynamics, enabling the estimation of ET at 30 m spatial resolution.
The surface energy balance was solved according to the fundamental equation:
LE = Rn − G − H
where LE is the latent heat flux (evaporation + transpiration), Rₙ is the net radiation, G is the soil heat flux, and H is the sensible heat flux.
Net radiation (Rₙ) was calculated considering incoming and reflected shortwave radiation as well as incoming and outgoing longwave radiation [3,31].
The soil heat flux (G) was estimated as a fraction of Rₙ dependent on the leaf area index (LAI) and land surface temperature (LST), following parameterizations developed for arid environments [32,33].
The sensible heat flux (H) was determined from the air temperature gradient (ΔT) and Ts, calibrated through the internal selection of cold and hot pixels, representing well-irrigated vegetation and dry bare soil, respectively [10,34].
From LE, the instantaneous evapotranspiration (ETinst) was derived, and subsequently, the reference evapotranspiration fraction (ETrF) was computed as the ratio between ETinst and the reference evapotranspiration (ETr) calculated using the FAO Penman–Monteith equation from data collected by the automatic weather station.
This fraction allowed the scaling of instantaneous ET to daily ET using the relation:
ETMETRIC = ETrF × ETo24
The procedure generated daily ET maps at 30 m spatial resolution, further integrated into monthly and seasonal composites. These products explicitly describe the spatial variability of water consumption within the olive orchard and provide the basis for intercomparison with AquaCrop simulations and the assessment of water use efficiency (WUE) under arid conditions.
A total of sixteen Landsat 8/9 (Collection 2, Level 2) scenes were selected to cover the main phenological stages across the 2021–2022 and 2023–2024 campaigns (Table 1). Each image was atmospherically corrected and pre-processed in Google Earth Engine (GEE) to derive surface reflectance, albedo, emissivity, and land surface temperature (LST) layers, which served as inputs to the METRIC workflow described above to obtain instantaneous LE and temporally upscaled daily ETMETRIC (Equation (2)) for both seasons.
The overall METRIC workflow implemented in Google Earth Engine (GEE) is summarized in Figure 5. The process begins with image selection, atmospheric correction, and derivation of key surface parameters (albedo, emissivity, LST, NDVI, SAVI, and LAI) from Landsat 8/9 (Collection 2, Level 2) data. Subsequently, internal calibration is performed through the identification of cold and hot anchor pixels, representing well-watered canopy and dry bare soil, respectively, from which the empirical coefficients a and b are derived to solve the H–ΔT relationship. Once calibration is completed, the surface energy balance is computed by estimating net radiation (Rn), soil heat flux (G), and sensible heat flux (H), allowing the determination of latent heat flux and instantaneous evapotranspiration (ETinst = LE/λ). Temporal upscaling is achieved using the reference evapotranspiration fraction (ETrF = ETinst/ETrinst), which enables the generation of daily ET maps (ET = ETrF × ETo24) at 30 m spatial resolution. The final outputs include ETMETRIC, Rn, G, H, and LE maps, along with parcel-level statistics and consistency checks against ETAQUACROP and ETFAO-56 benchmarks, providing a physically consistent framework for assessing water-use efficiency in arid olive systems.
(c) Multiscale Evaluation and Cross-Model Validation between AquaCrop and METRIC
The consistency between the AquaCrop and METRIC models was assessed through a multiscale methodological framework designed to analyze their performance in estimating evapotranspiration (ET) under arid conditions. Both the temporal and spatial dimensions were jointly addressed to ensure coherence between simulations and satellite-based observations.
The Landsat 8/9 overpass dates were aligned with the daily simulations of ETAQUACROP and the corresponding estimates of ETMETRIC, applying a ±1 day temporal window when necessary to minimize temporal discrepancies. In the spatial domain, ETMETRIC values were aggregated at the experimental plot level using the spatial median, thereby reducing the influence of outlier pixels, while the AquaCrop outputs were resampled to the same resolution to ensure compatibility between both datasets.
Cross-validation between models was performed using widely recognized performance indicators, including the coefficient of determination (R2), root mean square error (RMSE), mean absolute error (MAE), Nash–Sutcliffe efficiency (NSE), and mean bias error (MBE). These metrics provided a robust quantitative basis to assess the degree of agreement and accuracy between the process-based soil–water balance approach (AquaCrop) and the satellite-driven energy balance model (METRIC).
Finally, the ETMETRIC, ETAQUACROP, and ETFAO-56 series were integrated into a multiscale comparative framework that incorporated temporal alignment, linear regression, and residual analysis, whose results are presented in the corresponding section of this study.

2.4.3. Reference ETc Computation (FAO-56 Penman–Monteith)

In this study, ETFAO-56 provides an empirical benchmark against which both the energy-balance estimates (METRIC) and the process-based soil–water balance simulations (AquaCrop) can be evaluated, allowing the comparison between a coefficient-based formulation and physically based approaches.
The reference evapotranspiration (ETo) was computed on a daily basis using the standard FAO-56 Penman–Monteith formulation, based on hourly meteorological records of air temperature (Ta), relative humidity (RH), wind speed (WS), and global solar radiation (SR) obtained from the automatic weather station installed at the experimental site.
The daily ETo(24) values were subsequently used to estimate the reference crop evapotranspiration (ETc) following the relationship:
ETc = Kc × ETo24
where Kc represents the crop coefficient for olive, adjusted to the local phenological calendar according to the stages of budburst, flowering, fruit set, and ripening.
The Kc curve was calibrated based on previous studies conducted in olive orchards under arid and semi-arid conditions [1,35], and further adapted to the microclimatic and management conditions of the study site.
To ensure full reproducibility, the monthly Kc values used in this study were: January = 0.65, February = 0.66, March = 0.62, April = 0.58, May = 0.54, June = 0.48, July = 0.47, August = 0.48, September = 0.52, October = 0.62, November = 0.80, and December = 0.64. This curve was constructed by adapting Kc values reported for Mediterranean and semi-arid olive orchards [1,35,36], aligning them with the phenological stages observed in the orchard and with the seasonal dynamics of ETo. The mid-season maximum (Kc ~ 0.80) corresponds to the period of full canopy development, whereas lower winter Kc values (~0.47–0.54) reflect reduced transpiring surface and a higher fraction of exposed soil.
The resulting ETFAO-56 time series served as an independent baseline reference to evaluate the consistency of the estimates derived from ETMETRIC and ETAQUACROP, providing a comparative framework for validating the hydrological coherence between the energy balance and soil–water balance approaches.

3. Results

3.1. Calibration and Performance of AquaCrop Canopy Cover Simulations

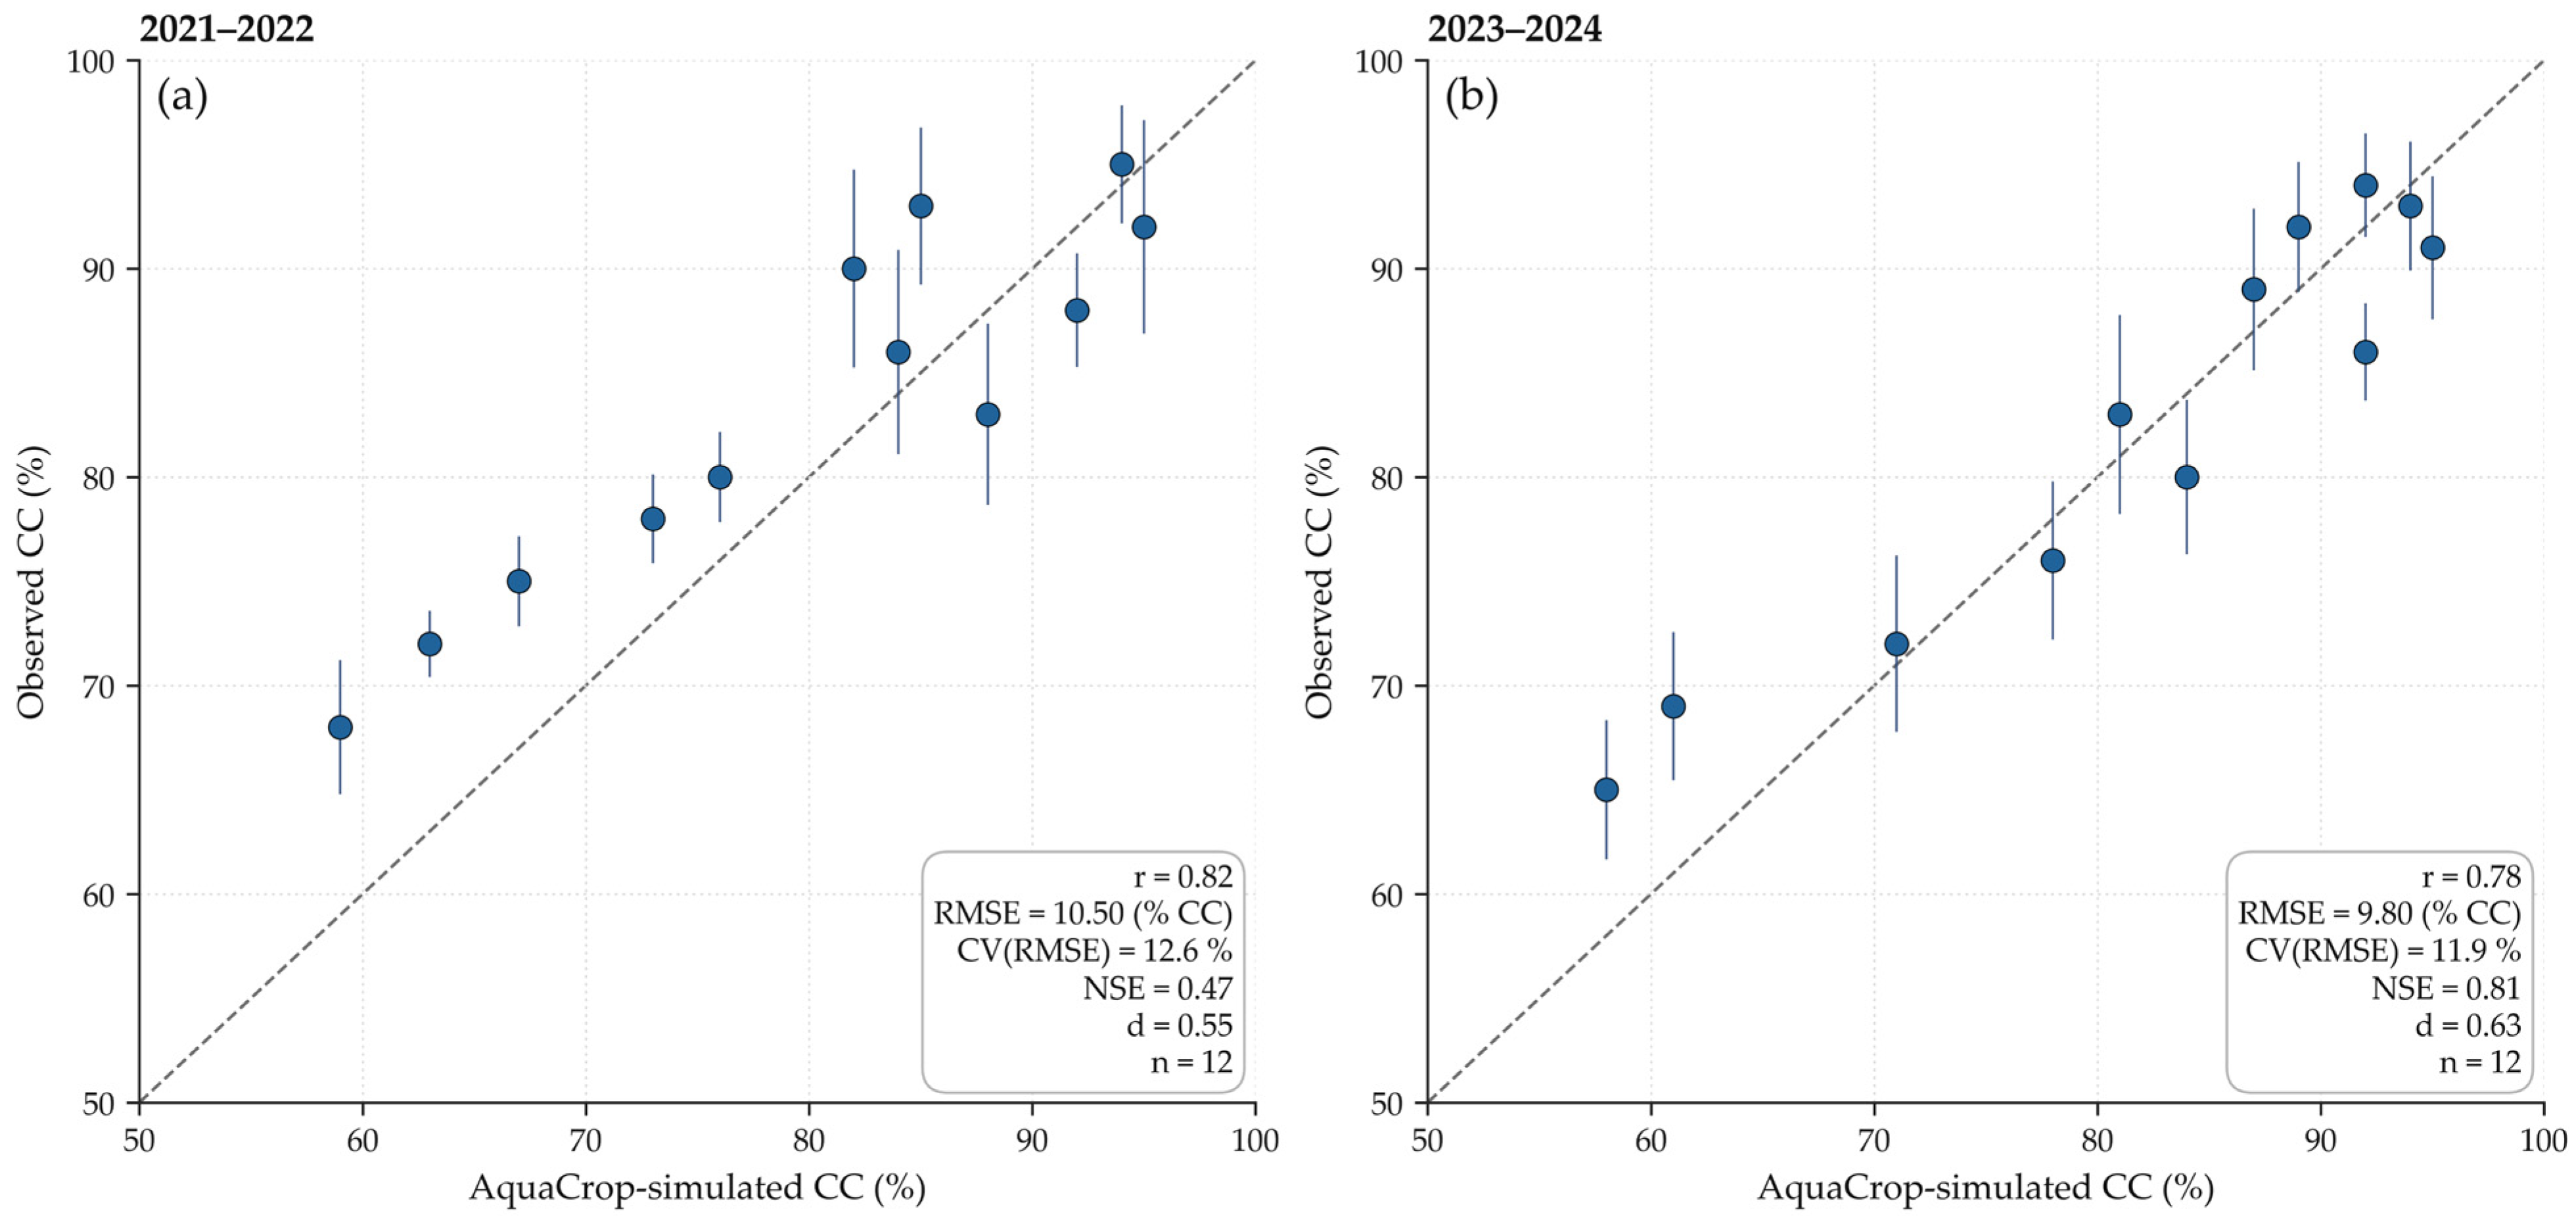
The calibration of AquaCrop against observed green canopy cover (CC, %) showed a high level of agreement and moderate relative errors in both growing seasons (Figure 6a,b). Overall, the observed–simulated scatterplots exhibited strong correlations (r = 0.82 and 0.78), with CV(RMSE) values of 12.6% and 11.9%, and absolute RMSEs of 10.5 and 9.8 CC percentage points, respectively. The Nash–Sutcliffe efficiency (NSE) reached 0.47 in the first campaign and 0.81 in the second, while Willmott’s agreement index (d) ranged between 0.55 and 0.63, indicating a satisfactory representation of canopy growth dynamics.
To ensure temporal consistency and minimize short-term field variability, canopy cover was measured three times per month, and the resulting measurements were averaged to obtain 12 monthly canopy-cover observations per campaign. This corresponds to 36 raw field measurements per growing season and a total of 24 aggregated monthly observations (72 individual measurements) across the two campaigns. All field observations were collected from georeferenced sub-plots and aligned with Landsat overflight dates whenever possible.
Visually, data points aligned closely with the 1:1 line, with a slight underestimation of CC at higher values—consistent with a conservative canopy growth coefficient (CGC) and/or a smoother canopy decline coefficient (CDC) in the model parameterization. Practically, these results support the use of AquaCrop as a reliable reference for canopy dynamics in the multiscale comparison with ETMETRIC and ETFAO-56 developed in the following sections.

3.2. Landsat Sampling and Temporal Scaling of METRIC-Derived Fluxes

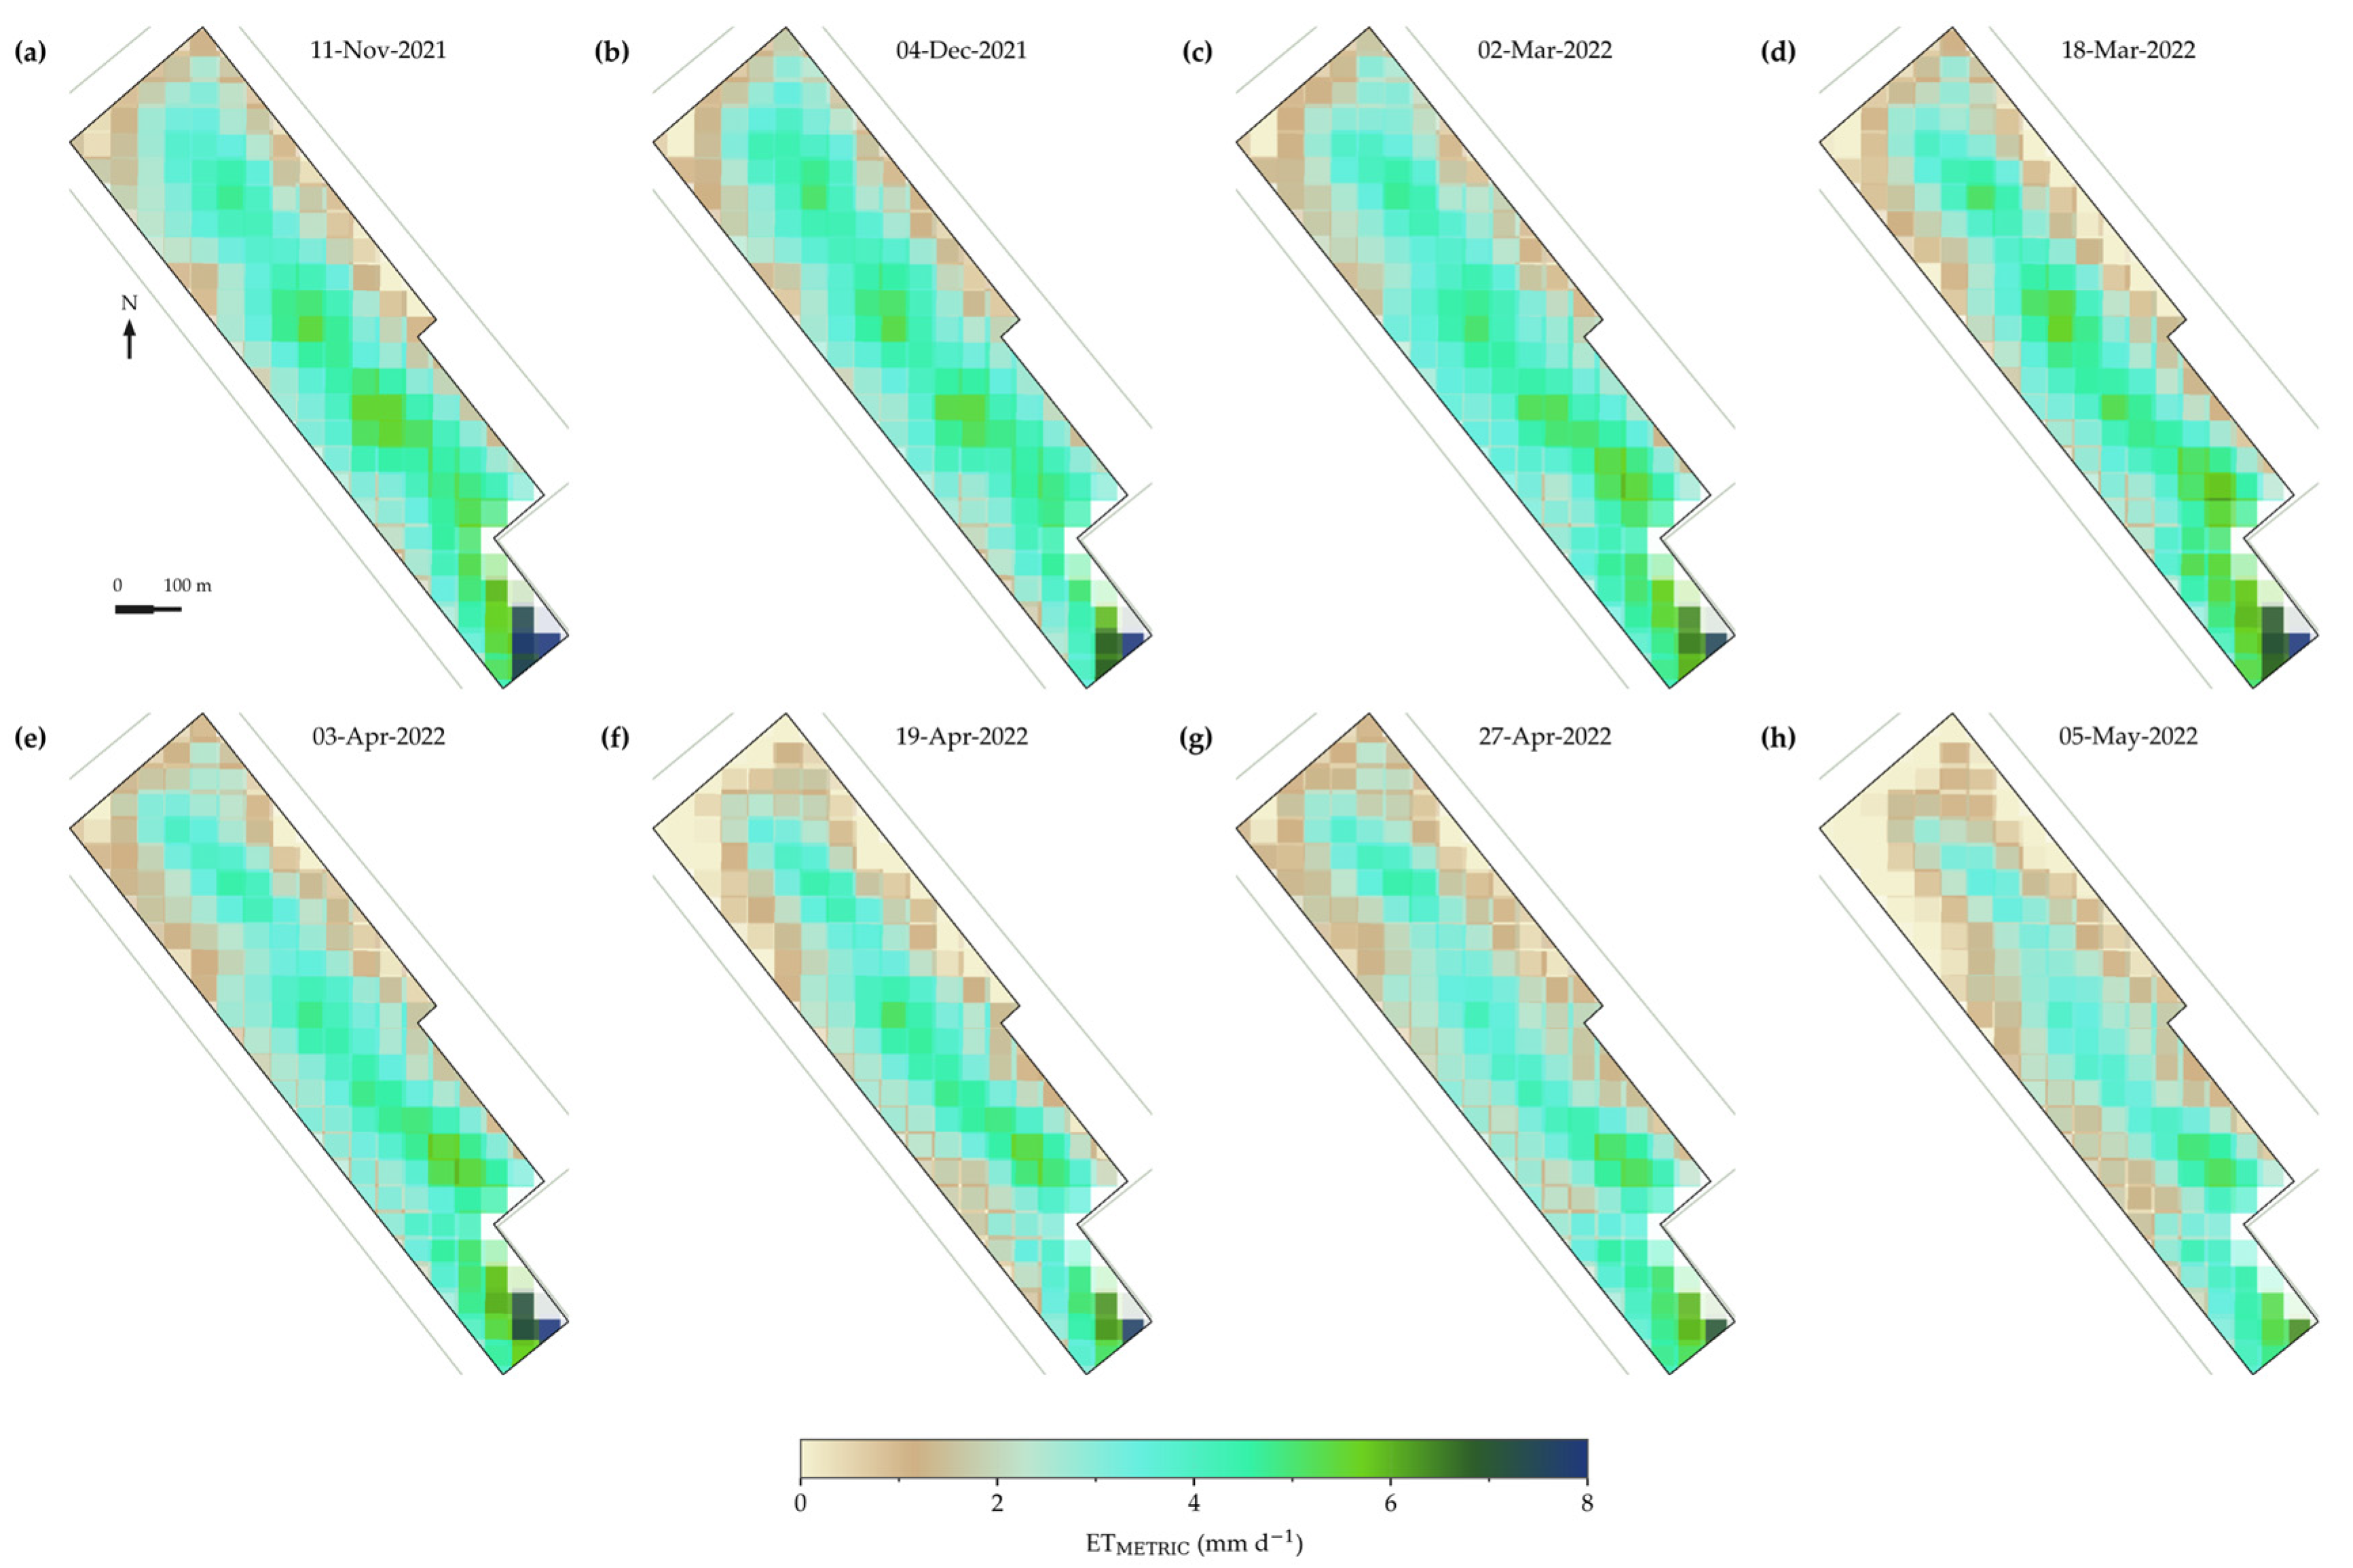
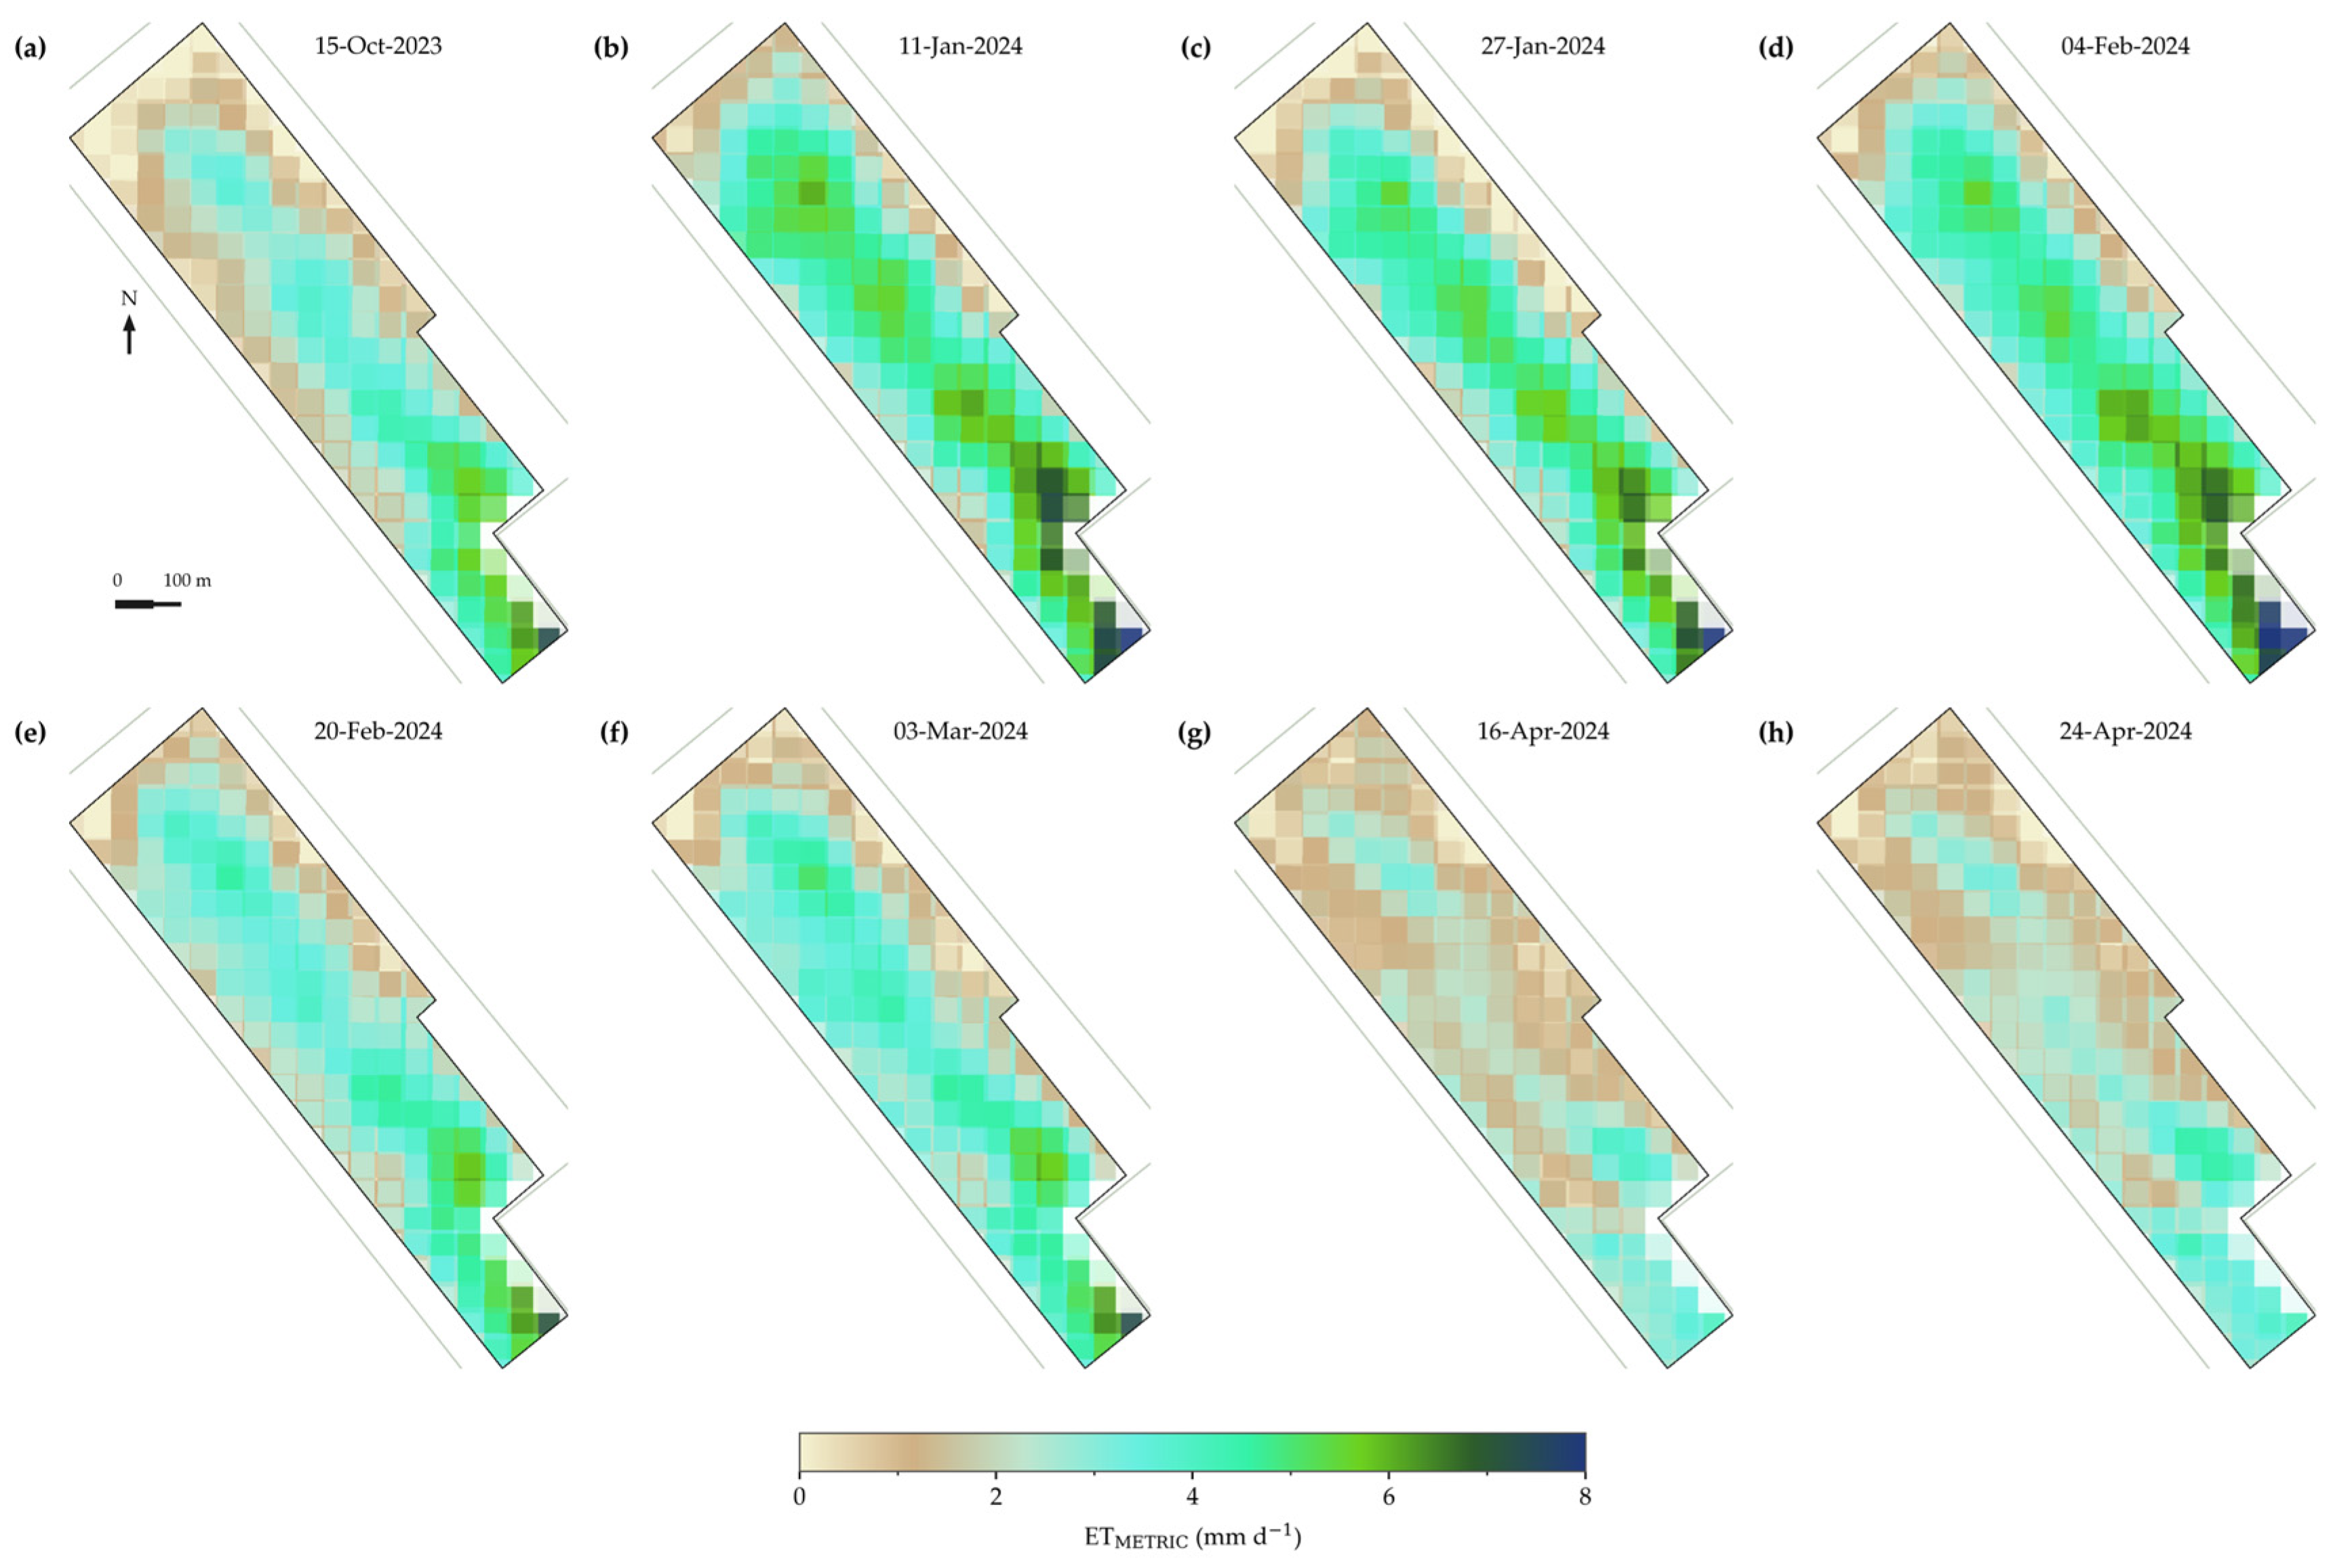
The resulting multi-temporal ETMETRIC maps (Figure 7 and Figure 8) illustrate the seasonal evolution of evapotranspiration. In the 2021–2022 campaign (Figure 7), ETMETRIC peaked around 6–7 mm d−1 during March–April, followed by a gradual decline toward May. In contrast, the 2023–2024 campaign (Figure 8) exhibited attenuated fluxes (~3–5 mm d−1) and greater spatial heterogeneity, reflecting canopy water stress and reduced soil-moisture availability.
The multi-temporal ETMETRIC maps show higher fluxes during the high-yield 2021–2022 season (Figure 7) and attenuation under water-limited conditions in 2023–2024 (Figure 8). These patterns are consistent with the seasonal decline of Rn and LE and the reduction in ROI-mean ETMETRIC reported in Table 2. Local ETMETRIC maxima reached ~6–7 mm d−1 in central blocks (Figure 7 and Figure 8), while ROI-mean ETMETRIC remained ≤ 4.25 ± 1.76 mm d−1 (Table 2, 11-January-2024).
Vegetation and radiative drivers are detailed in Supplementary Figures S1–S6, while spatial patterns of energy partition (Rn, G, H, LE) per overpass are provided in Supplementary Figures S7–S22.

3.3. Anchor-Pixel Diagnostics and Stability Across Dates

Internal calibration in METRIC relied on per-scene selection of cold and hot anchor pixels capturing the evapotranspiration extrema. Cold pixels were placed over well-irrigated canopies with maximum foliage cover, while hot pixels corresponded to adjacent bare or water-stressed soil. Across dates, calibration coefficients a and b (from the H–ΔT relationship) showed strong temporal stability and physical consistency with the site’s arid context. Cold pixels typically exhibited NDVI = 0.40–0.47, LAI ~ 1.0, and Ts = 295–311 K, whereas hot pixels showed NDVI < 0.20, LAI ~ 0.3–0.5, and Ts = 302–316 K. These patterns support the robustness of the internal calibration under semi-arid to desert conditions.
Anchor-pixel attributes and ΔT calibration coefficients are provided in Table S1, while per-date maps of energy-balance components that reflect coherent spatial partitioning are shown in Figures S7–S22.

3.4. Spatial Patterns of Parcel-Scale ET (METRIC)

Parcel-scale ETMETRIC distributions exhibited robust intra-parcel gradients consistent with canopy structure and local microtopography. In both campaigns, higher ETMETRIC (~5–7 mm d−1) concentrated in the central blocks with denser canopy, while peripheral or sparse-canopy areas showed lower values (~2–4 mm d−1). During peak photosynthetic activity (February–April), spatial patterns became more homogeneous, reflecting physiological response to increased atmospheric demand and the effectiveness of drip irrigation. These patterns are visible in Figure 7 and Figure 8 and are consistent with the energy partition summarized in Table 2.

3.5. Temporal Dynamics and Method Comparison at Parcel Scale

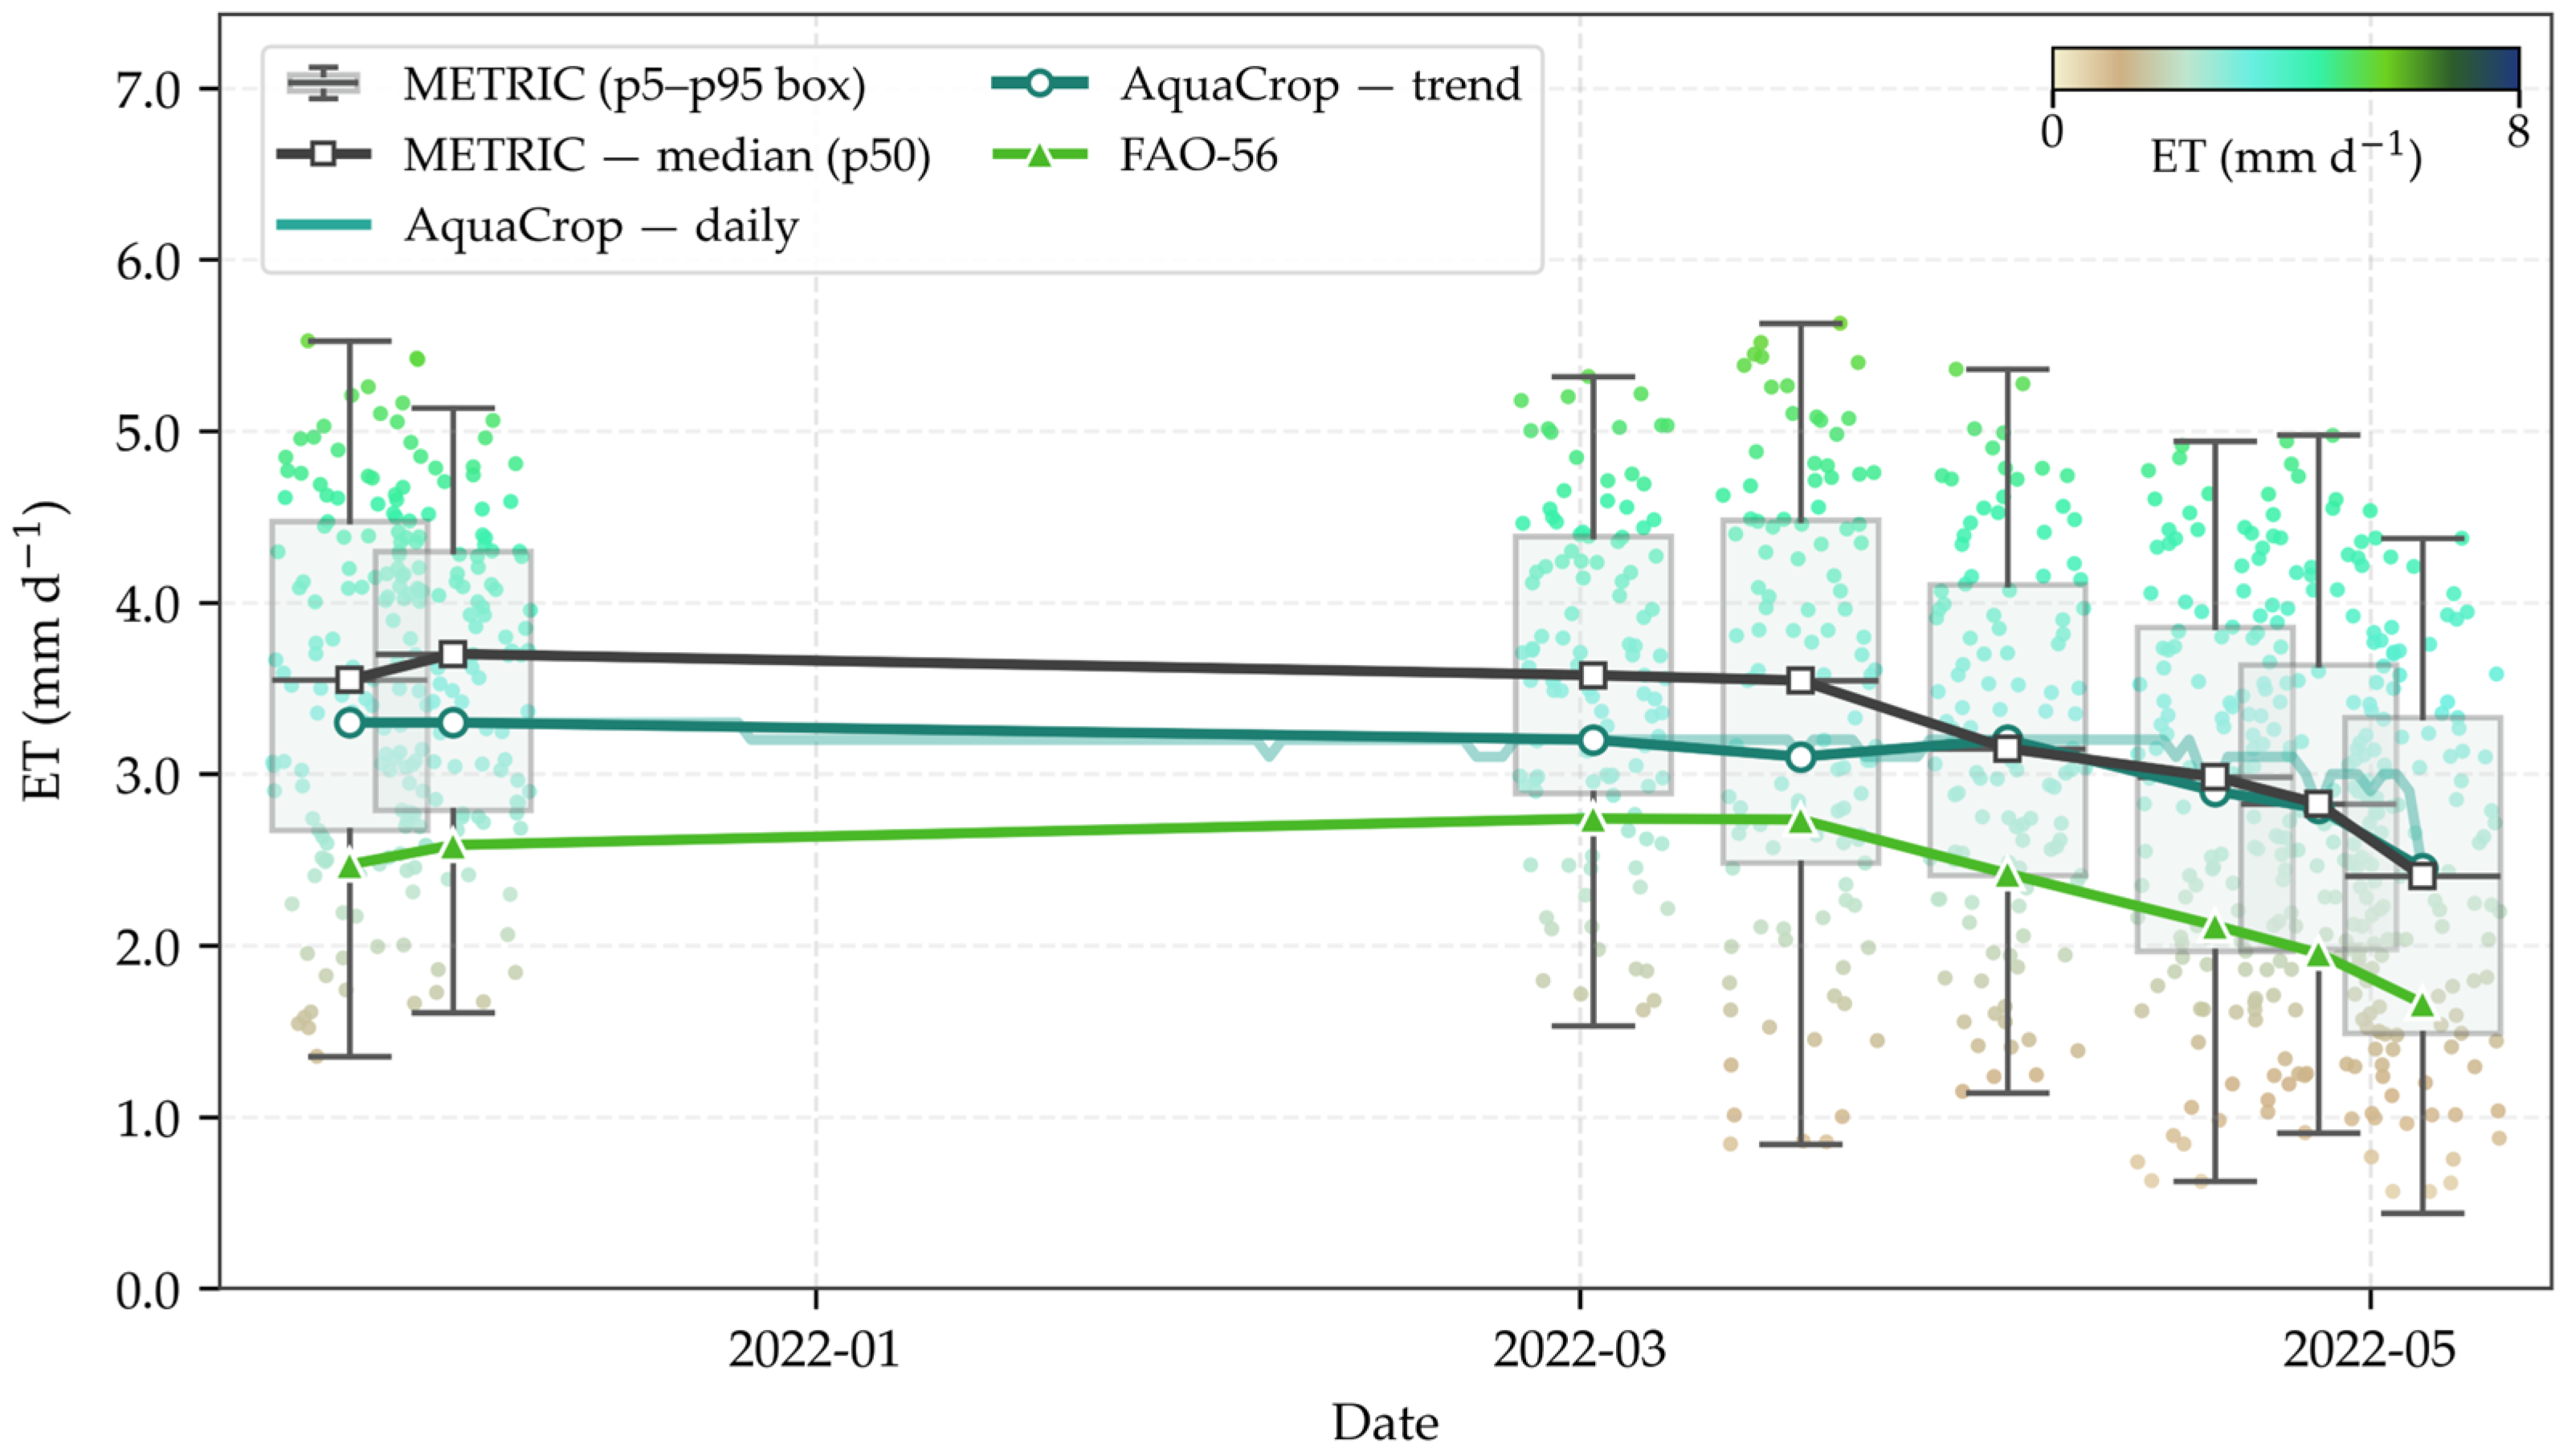
During the 2021–2022 high-yield campaign, ETMETRIC, ETAQUACROP, and ETFAO-56 displayed a consistent seasonal pattern characterized by a gradual decline in evapotranspiration from November to May (Figure 9). The METRIC medians remained between ~3.3–3.8 mm d−1 at the beginning of the season and progressively decreased toward ~3.0 mm d−1 as the canopy approached senescence. AquaCrop daily estimates closely tracked the temporal evolution of METRIC, with almost parallel trajectories throughout the season, confirming a strong temporal coherence between both physically based approaches. In contrast, FAO-56 systematically underestimated ET across all dates: it remained ~1.8–2.2 mm d−1 below METRIC during early-season conditions and continued to diverge moderately during mid- and late-season. This behavior reflects the limitations of the empirical Kc curve in capturing the combined effects of canopy vigor, advective conditions, and soil evaporation that METRIC and AquaCrop represent more explicitly.
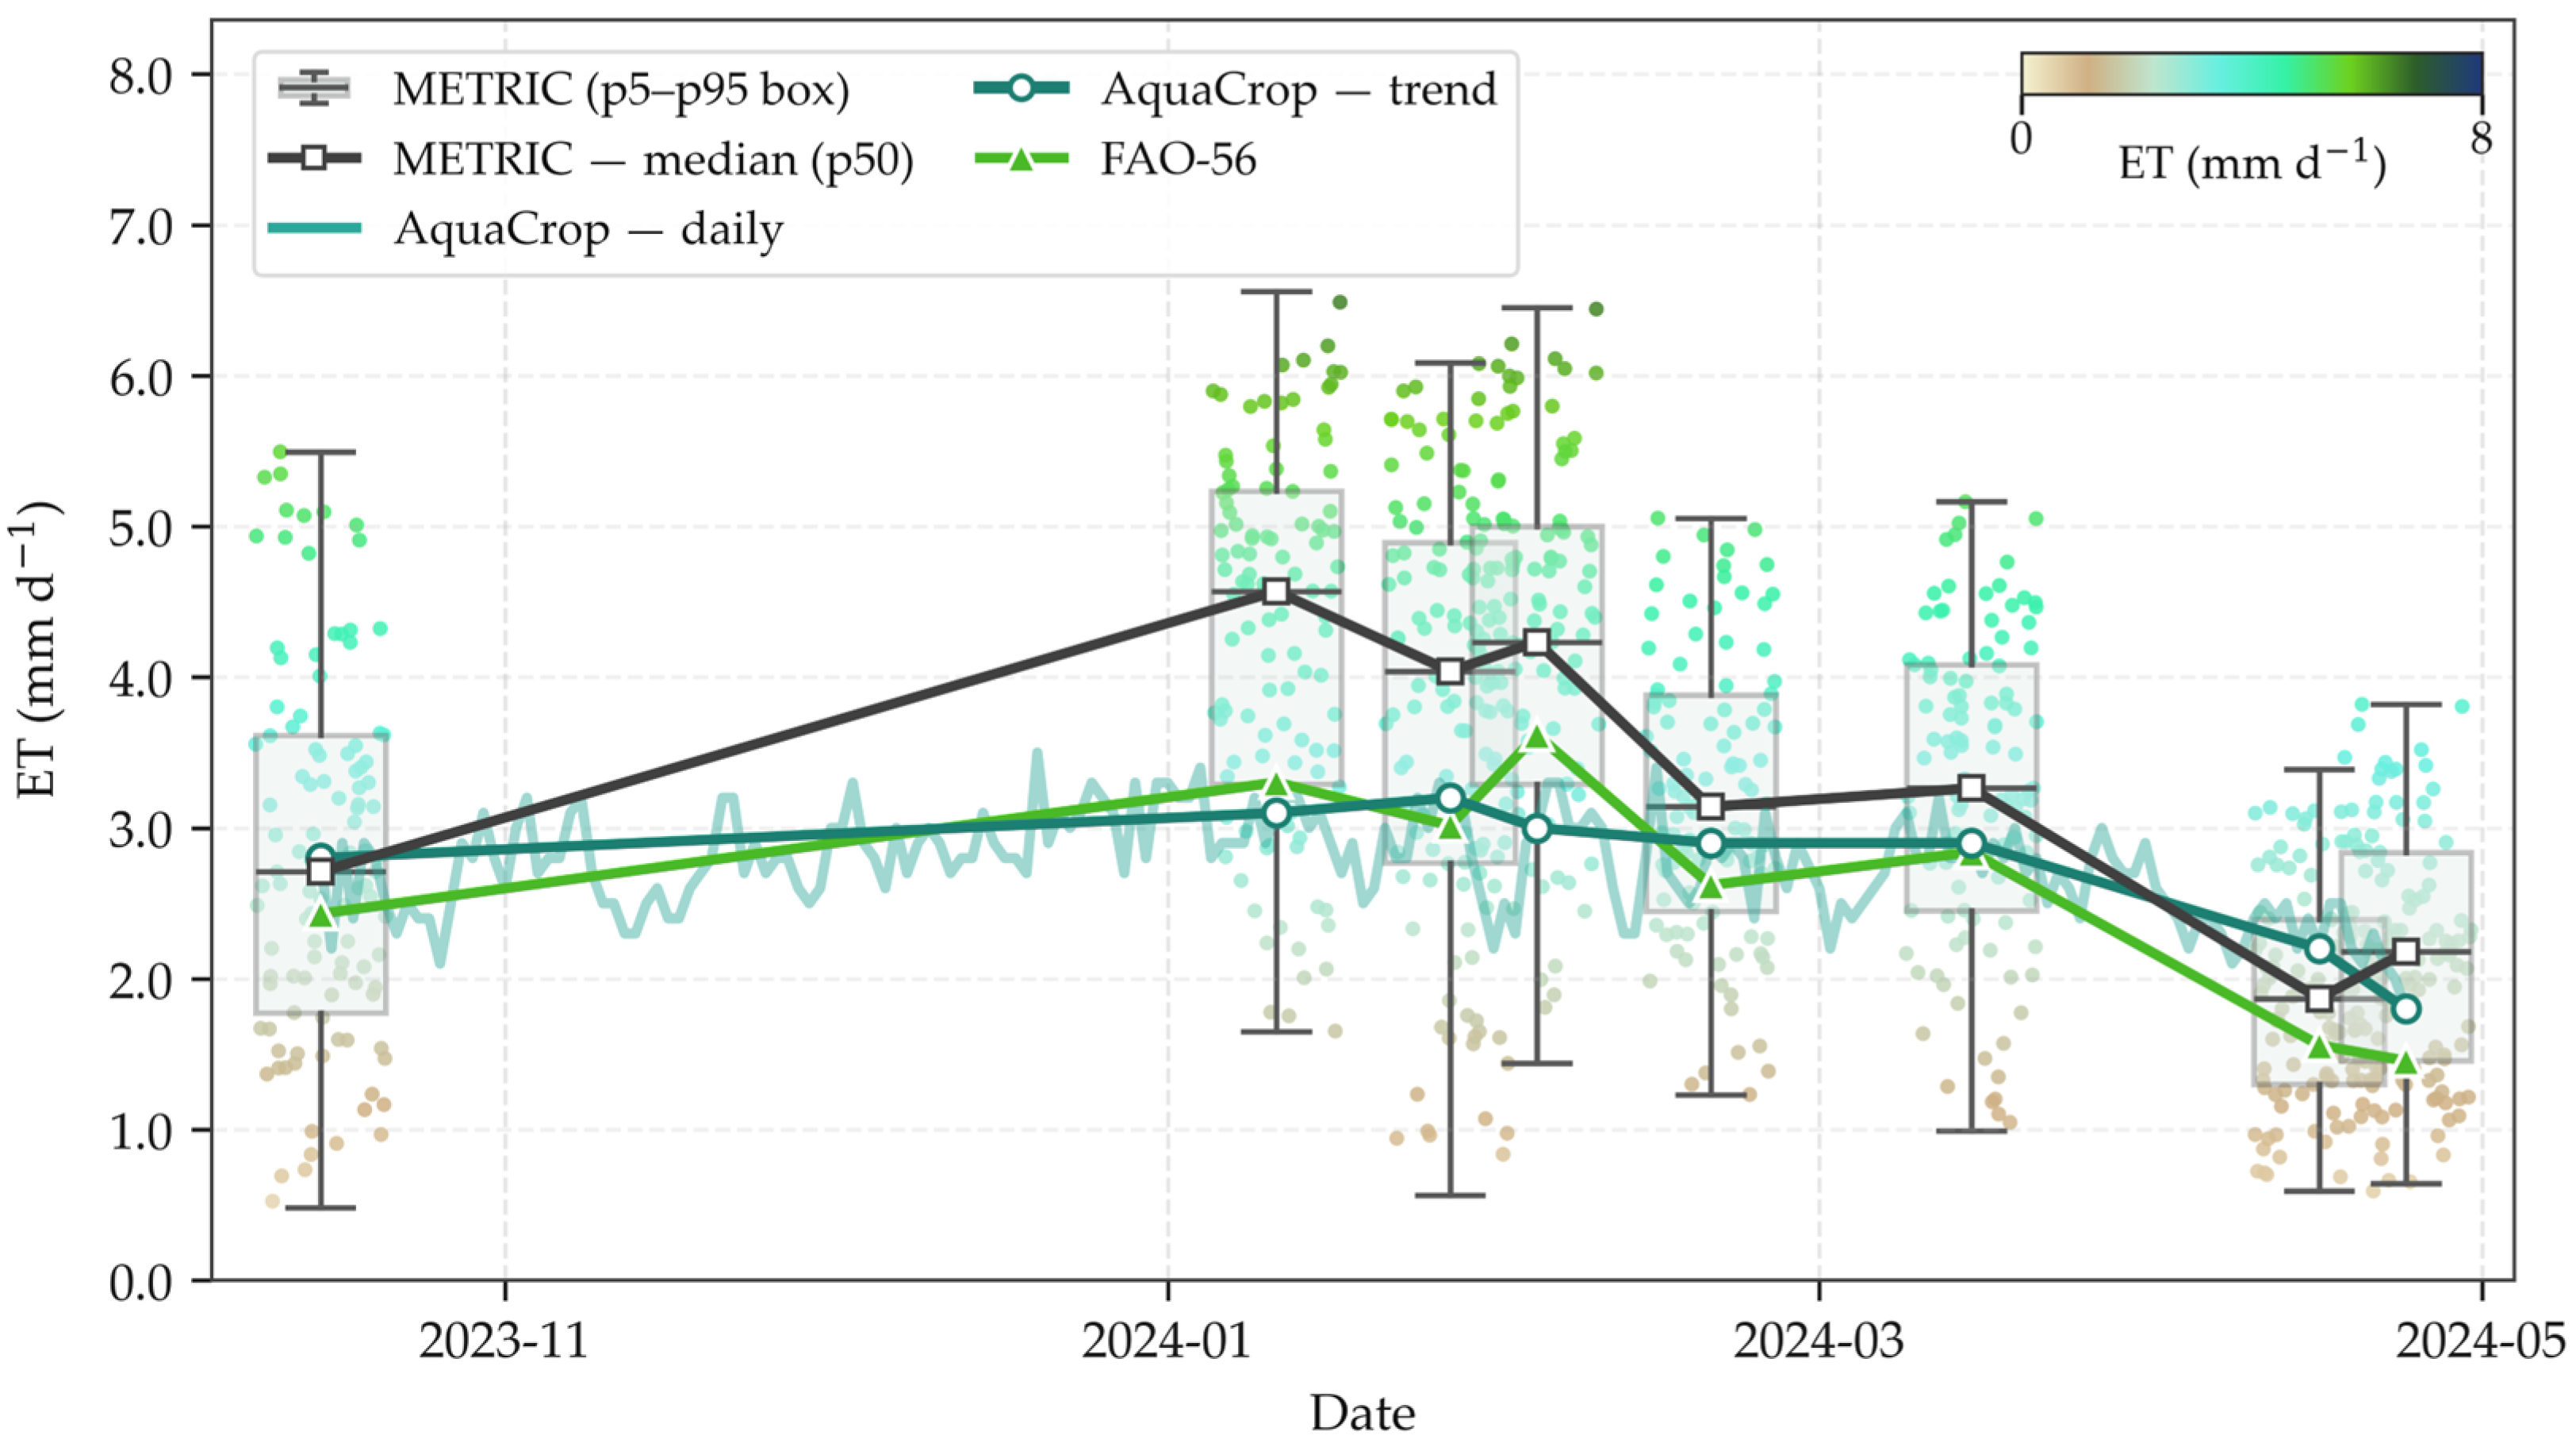
In the 2023–2024 water-limited campaign (Figure 10), evapotranspiration exhibited a dampened seasonal pattern, with METRIC median values generally ranging between 2.5 and 4.5 mm d−1 and decreasing toward April–May as soil moisture became increasingly limiting. AquaCrop reproduced the overall seasonal behavior but followed a smoother trajectory (~2.8–3.5 mm d−1), not fully capturing the METRIC peaks observed in mid-summer (January–February). Likewise, the FAO-56 series consistently underestimated ET throughout the season. Although its values remained close to the METRIC median during the early season (~November), the divergence increased during mid-season: FAO-56 captured the increasing evaporative demand but remained well below the METRIC median during the January–February peak. This underestimation persisted during the late-season decline (March–April), where FAO-56 produced lower ET values than both METRIC and AquaCrop. METRIC continued to exhibit pronounced spatial variability—visible in the wide p5–p95 ranges—particularly along parcel margins, highlighting its higher sensitivity to canopy heterogeneity and localized deficit-irrigation effects.
During the 2021–2022 high-yield campaign, FAO-56 systematically underestimated METRIC, with an average deviation of –0.81 mm d−1, reaching –1.03 mm d−1 during early-season conditions (November–December). Relative to AquaCrop, FAO-56 also exhibited a consistent negative bias (–0.70 mm d−1), reflecting its weaker responsiveness to canopy-driven increases in ET.
In the 2023–2024 water-limited campaign, the divergence persisted but was reduced. FAO-56 underestimated METRIC by –0.56 mm d−1 on average, with peak gaps of –0.75 mm d−1 during the high evaporative demand period (January–February). Deviations relative to AquaCrop were smaller and more variable (–0.13 mm d−1 on average), indicating that FAO-56 tracked early-season ET reasonably well but lagged during mid-season stress intensification.
These quantitative diagnostics reinforce that the empirical Kc-based FAO-56 consistently produced the lowest ET estimates across both optimal- and deficit-irrigation regimes, particularly during periods of high atmospheric demand and rapid canopy development.

3.6. Cross-Method Consistency (METRIC vs. AquaCrop vs. FAO)

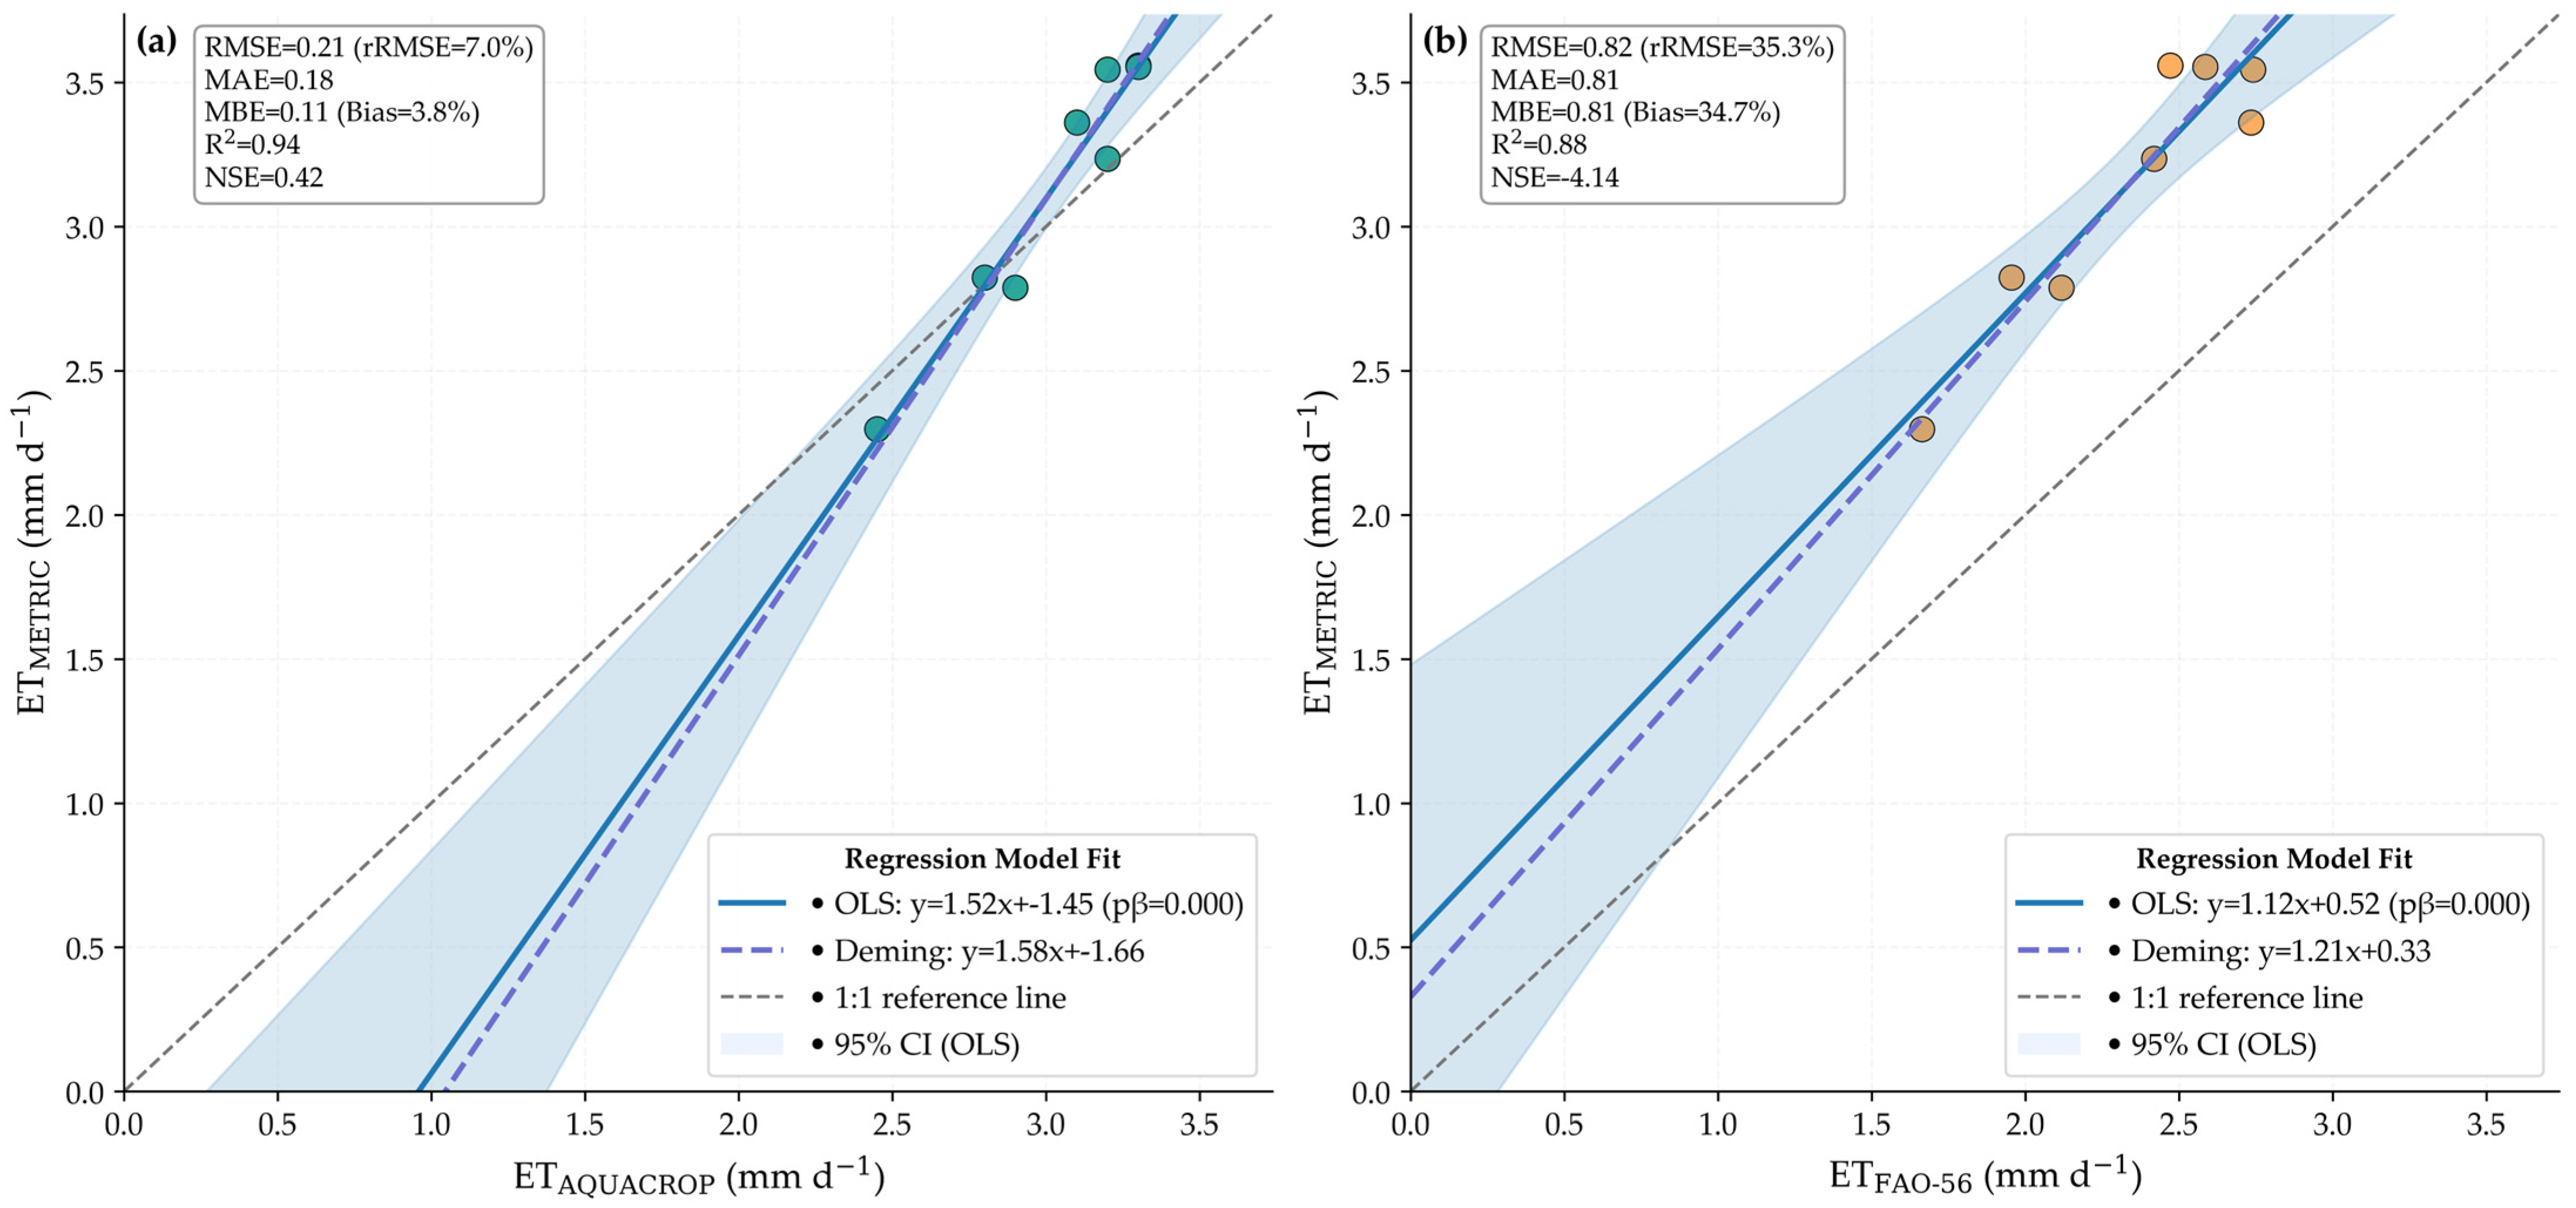
The cross-method comparison between the ETMETRIC energy-balance model and the process-based ETAQUACROP and ETFAO-56 formulations showed strong coherence during the 2021–2022 high-yield campaign (Figure 11). The ETMETRIC–ETAQUACROP relationship exhibited excellent agreement (R2 = 0.94, RMSE = 0.21 mm d−1, rRMSE = 7.0%), with a negligible bias (MBE = 0.11 mm d−1) and near-1:1 correspondence across the ET range. The slope greater than unity (OLS = 1.52) suggests that METRIC slightly overestimated ET relative to AquaCrop at higher fluxes, likely due to residual soil evaporation and local advective effects captured by the thermal signal. In contrast, the comparison with ETFAO-56 showed a larger dispersion (R2 = 0.88, RMSE = 0.82 mm d−1, rRMSE = 35.3%) and a positive bias (MBE = 0.81 mm d−1). The empirical Kc approach tended to underpredict ET under high evaporative demand, particularly when canopy cover approached its seasonal maximum. Overall, the consistency between ETAQUACROP and ETMETRIC confirms their physical compatibility, whereas deviations from ETFAO-56 highlight the limitations of static crop-coefficient curves under hyper-arid orchard conditions.
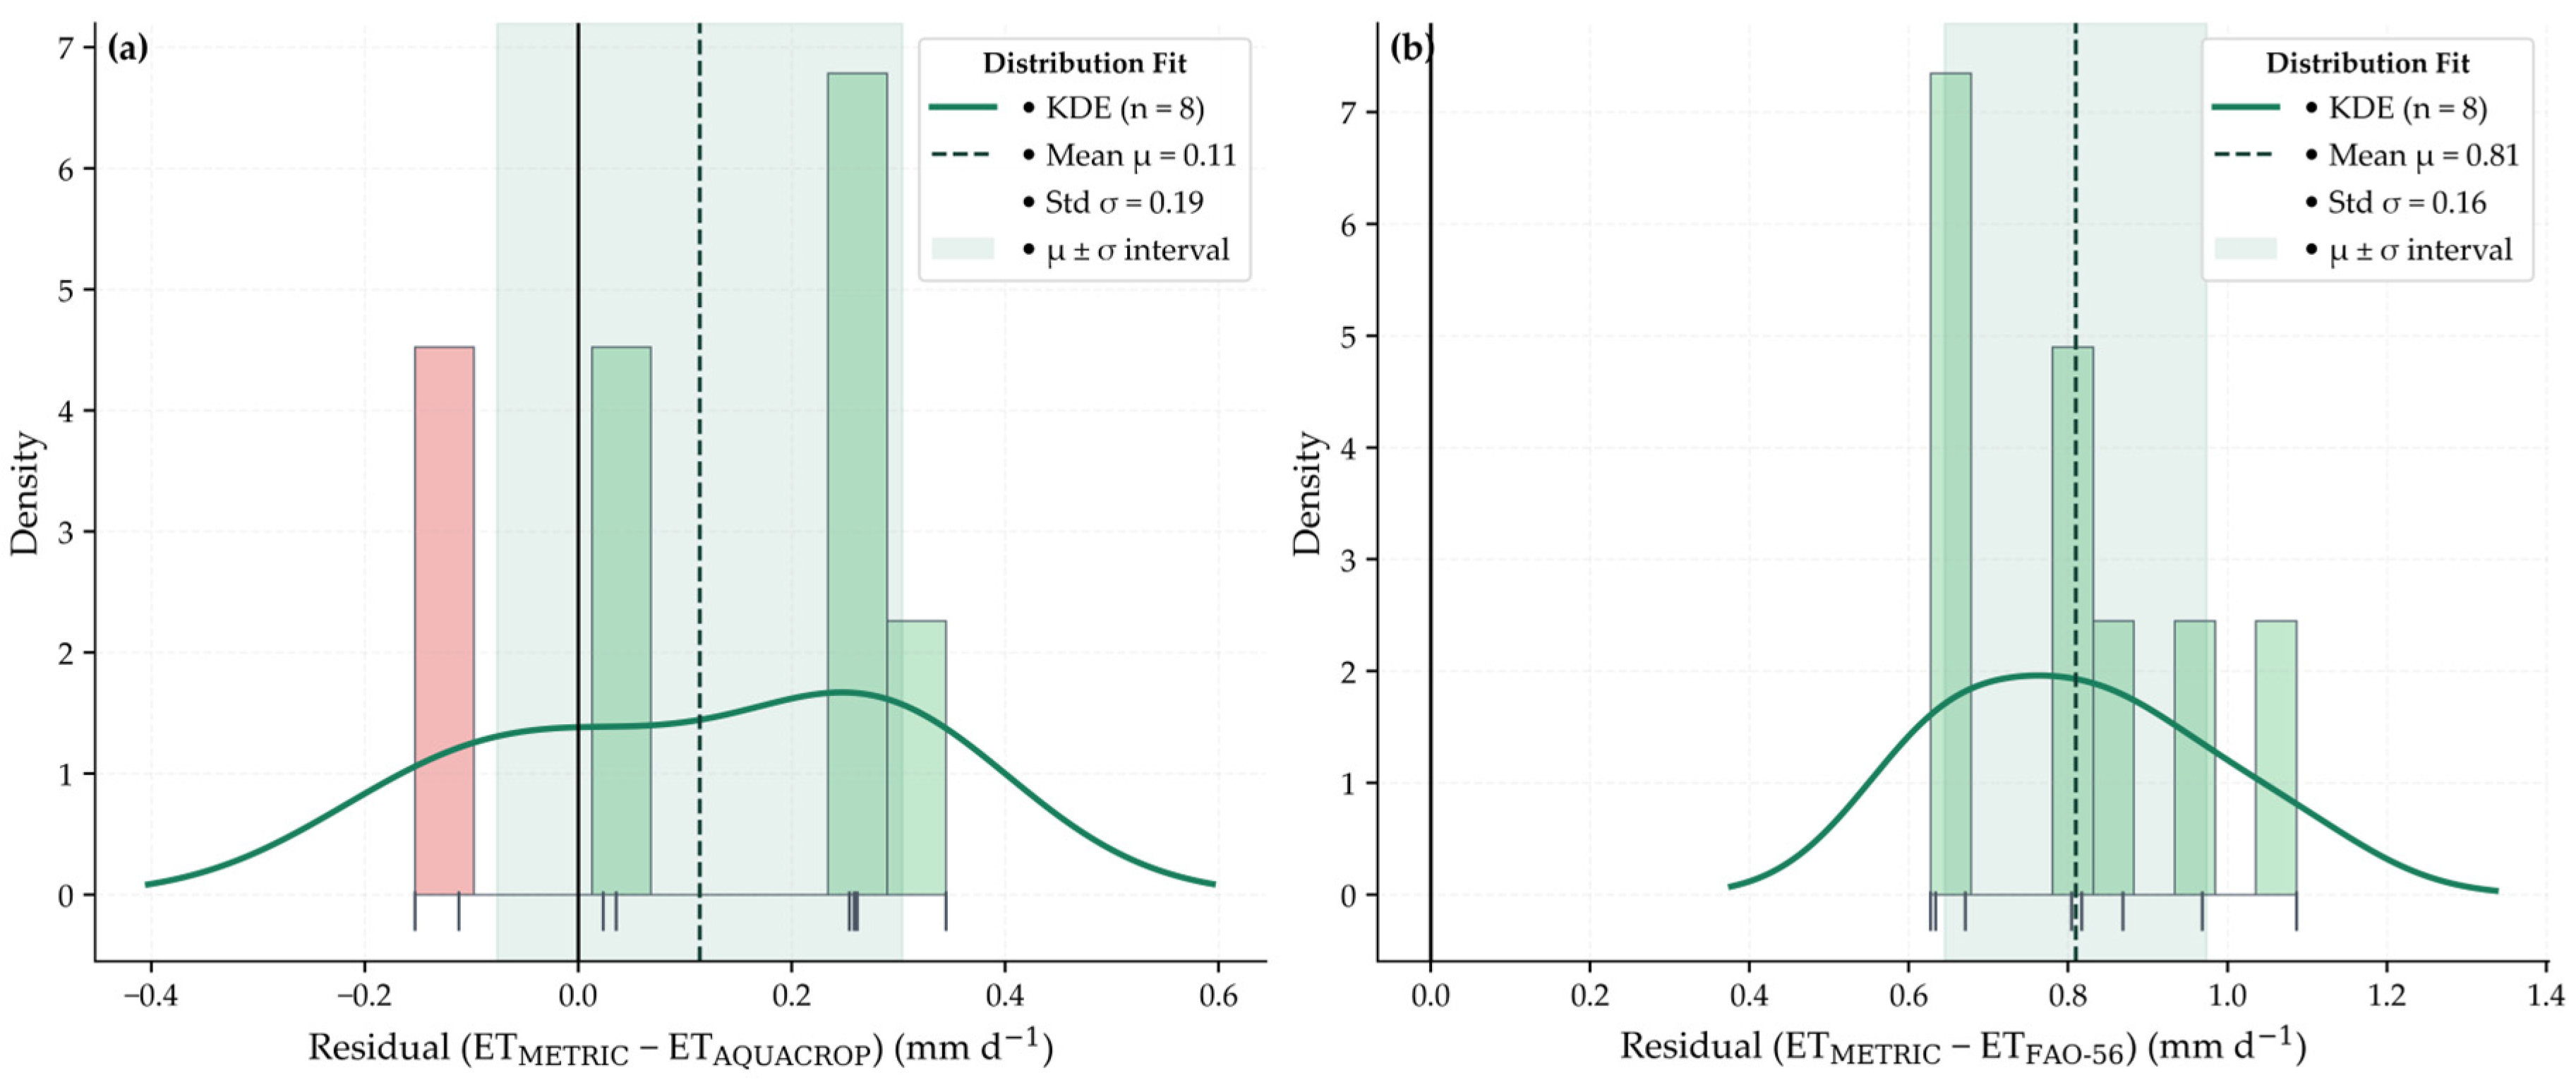
For the 2021–2022 campaign (Figure 12), the residual distributions exhibited a near-normal pattern, confirming the internal consistency of the METRIC calibration. The ETMETRIC–ETAQUACROP residuals were centered close to zero (μ = 0.11 mm d−1, σ = 0.19), indicating negligible bias and a tight agreement between the satellite-based and process-based estimates. In contrast, the ETMETRIC–ETFAO-56 residuals showed a positive offset (μ = 0.81 mm d−1, σ = 0.16), revealing a systematic overestimation by ETMETRIC relative to the empirical ETFAO-56 formulation. Despite this shift, the narrow spread and unimodal symmetry across both comparisons highlight the physical coherence between the models and the robustness of the ETMETRIC energy-balance calibration under high-yield conditions.
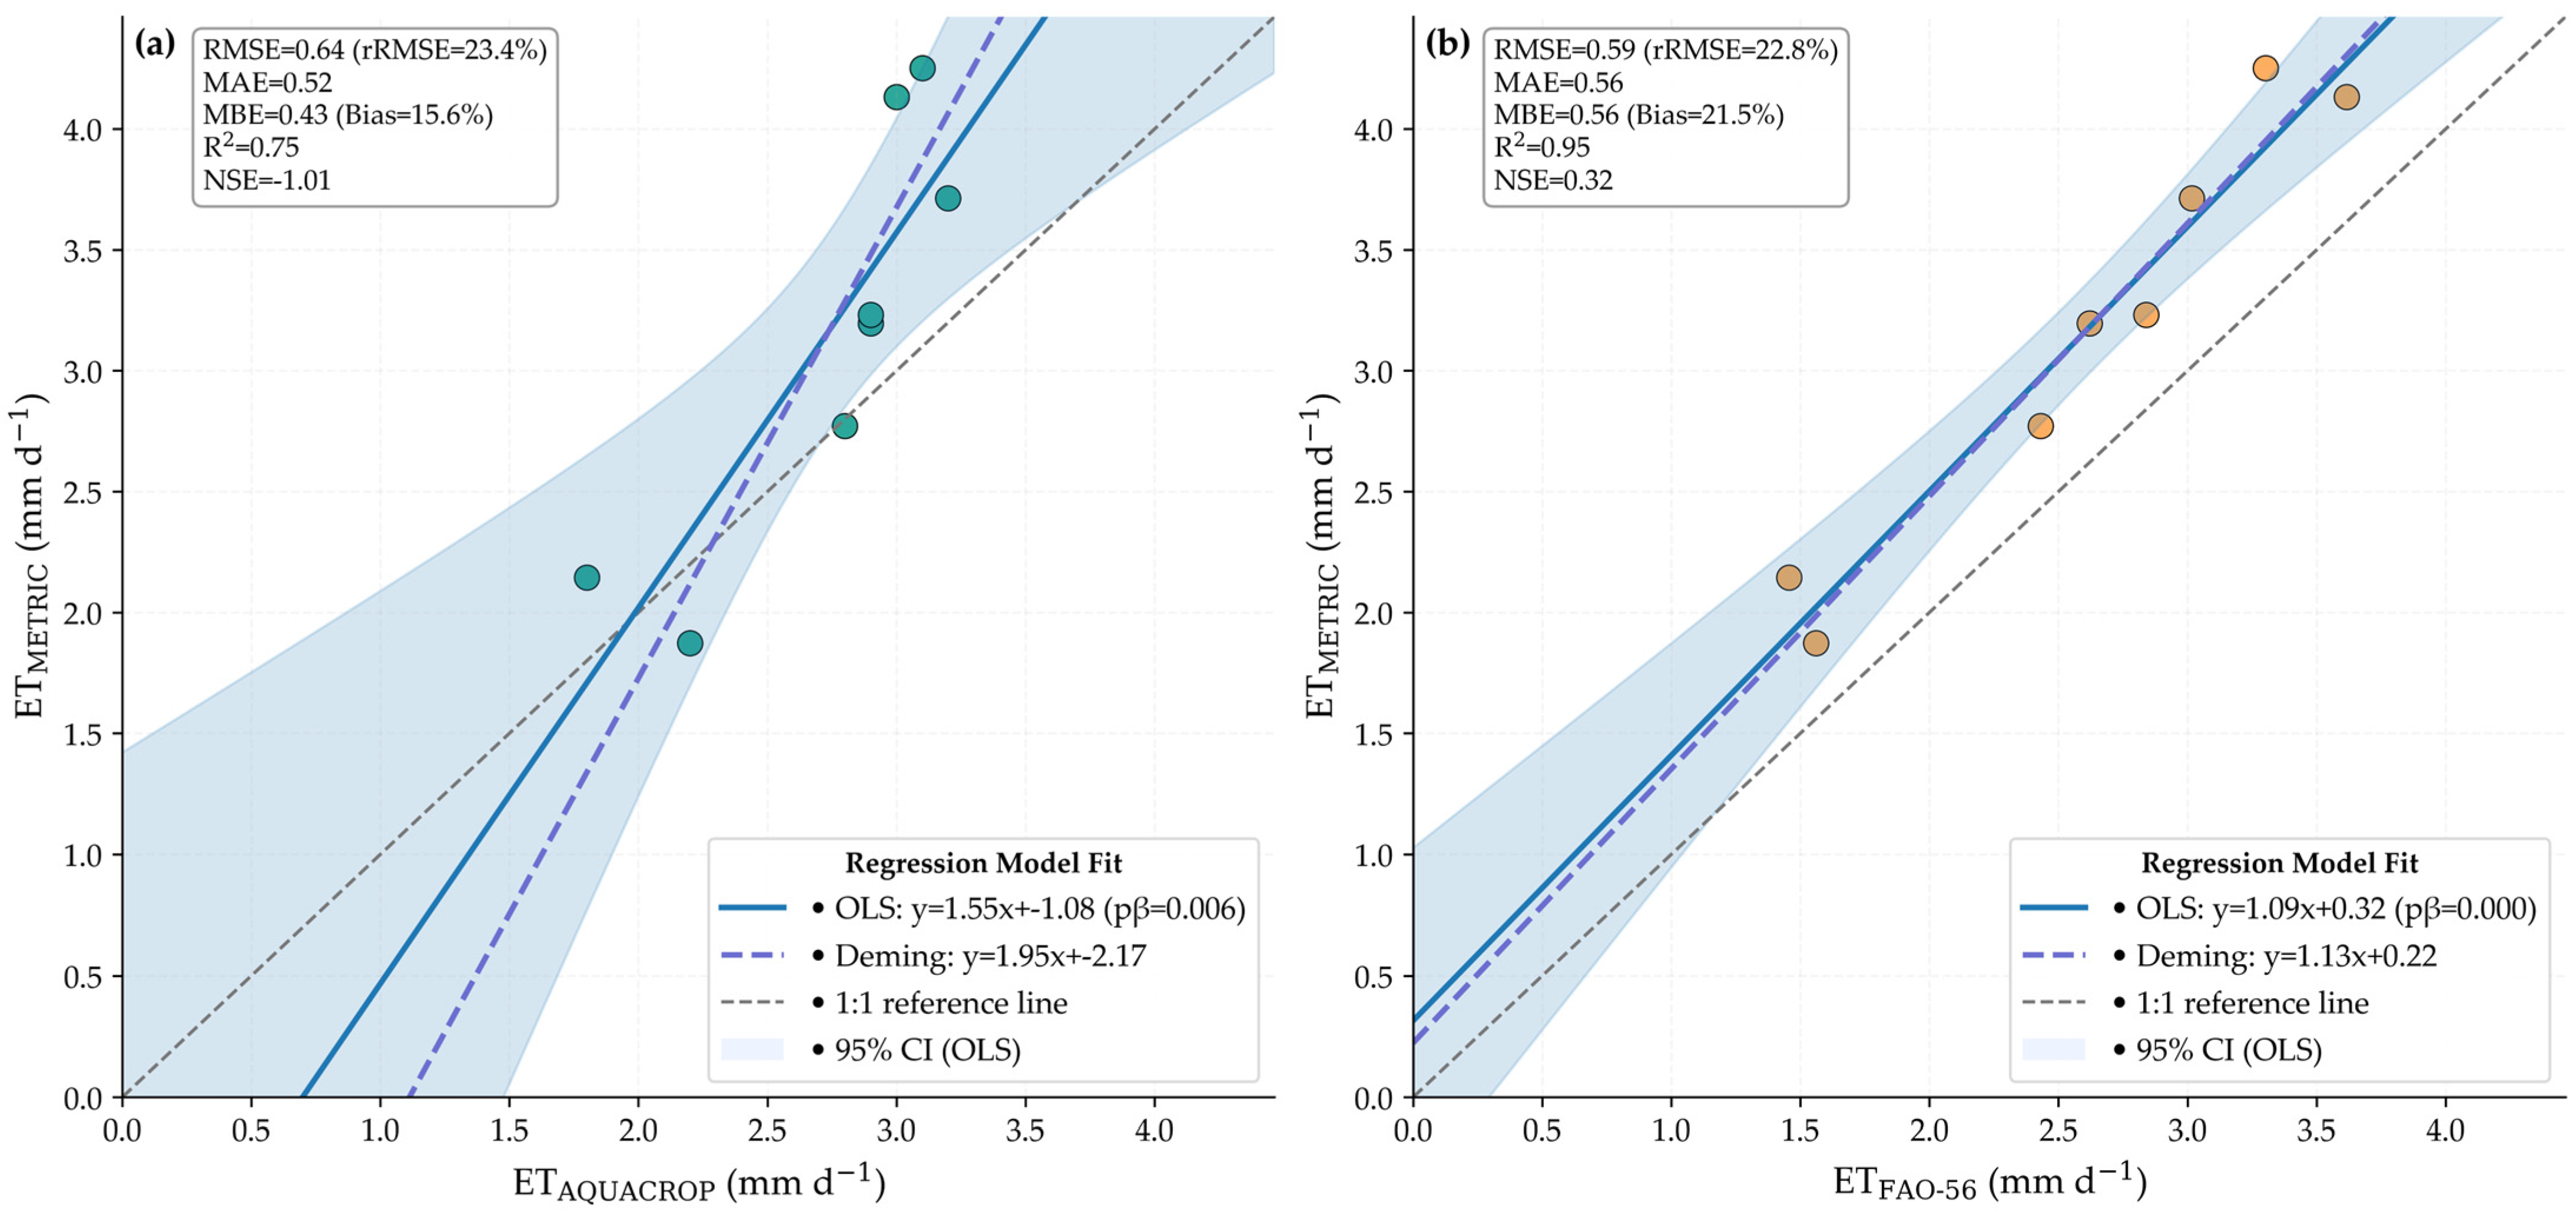
During the 2023–2024 water-limited campaign, the inter-model comparison confirmed a strong yet attenuated correspondence among the three approaches (Figure 13). The relationship between ETMETRIC and ETAQUACROP yielded R2 = 0.75 and RMSE = 0.64 mm d−1 (rRMSE = 23.4%), indicating good overall agreement but greater dispersion under moisture stress. In contrast, the ETMETRIC–ETFAO-56 comparison exhibited tighter alignment (R2 = 0.95, RMSE = 0.59 mm d−1, rRMSE = 22.8%), albeit with a consistent positive bias (MBE = 0.56 mm d−1). The observed overestimation by ETMETRIC relative to both reference models (MBE = 0.43–0.56 mm d−1) reflects the enhanced contribution of soil evaporation and local micro-advection captured by the energy-balance formulation but not explicitly represented in ETAQUACROP or the empirical ETFAO-56 approach. Despite these differences, the regressions maintained near-linear behavior across the ET range, confirming that both ETAQUACROP and ETFAO-56 adequately tracked the seasonal ET dynamics derived from ETMETRIC under reduced irrigation conditions.
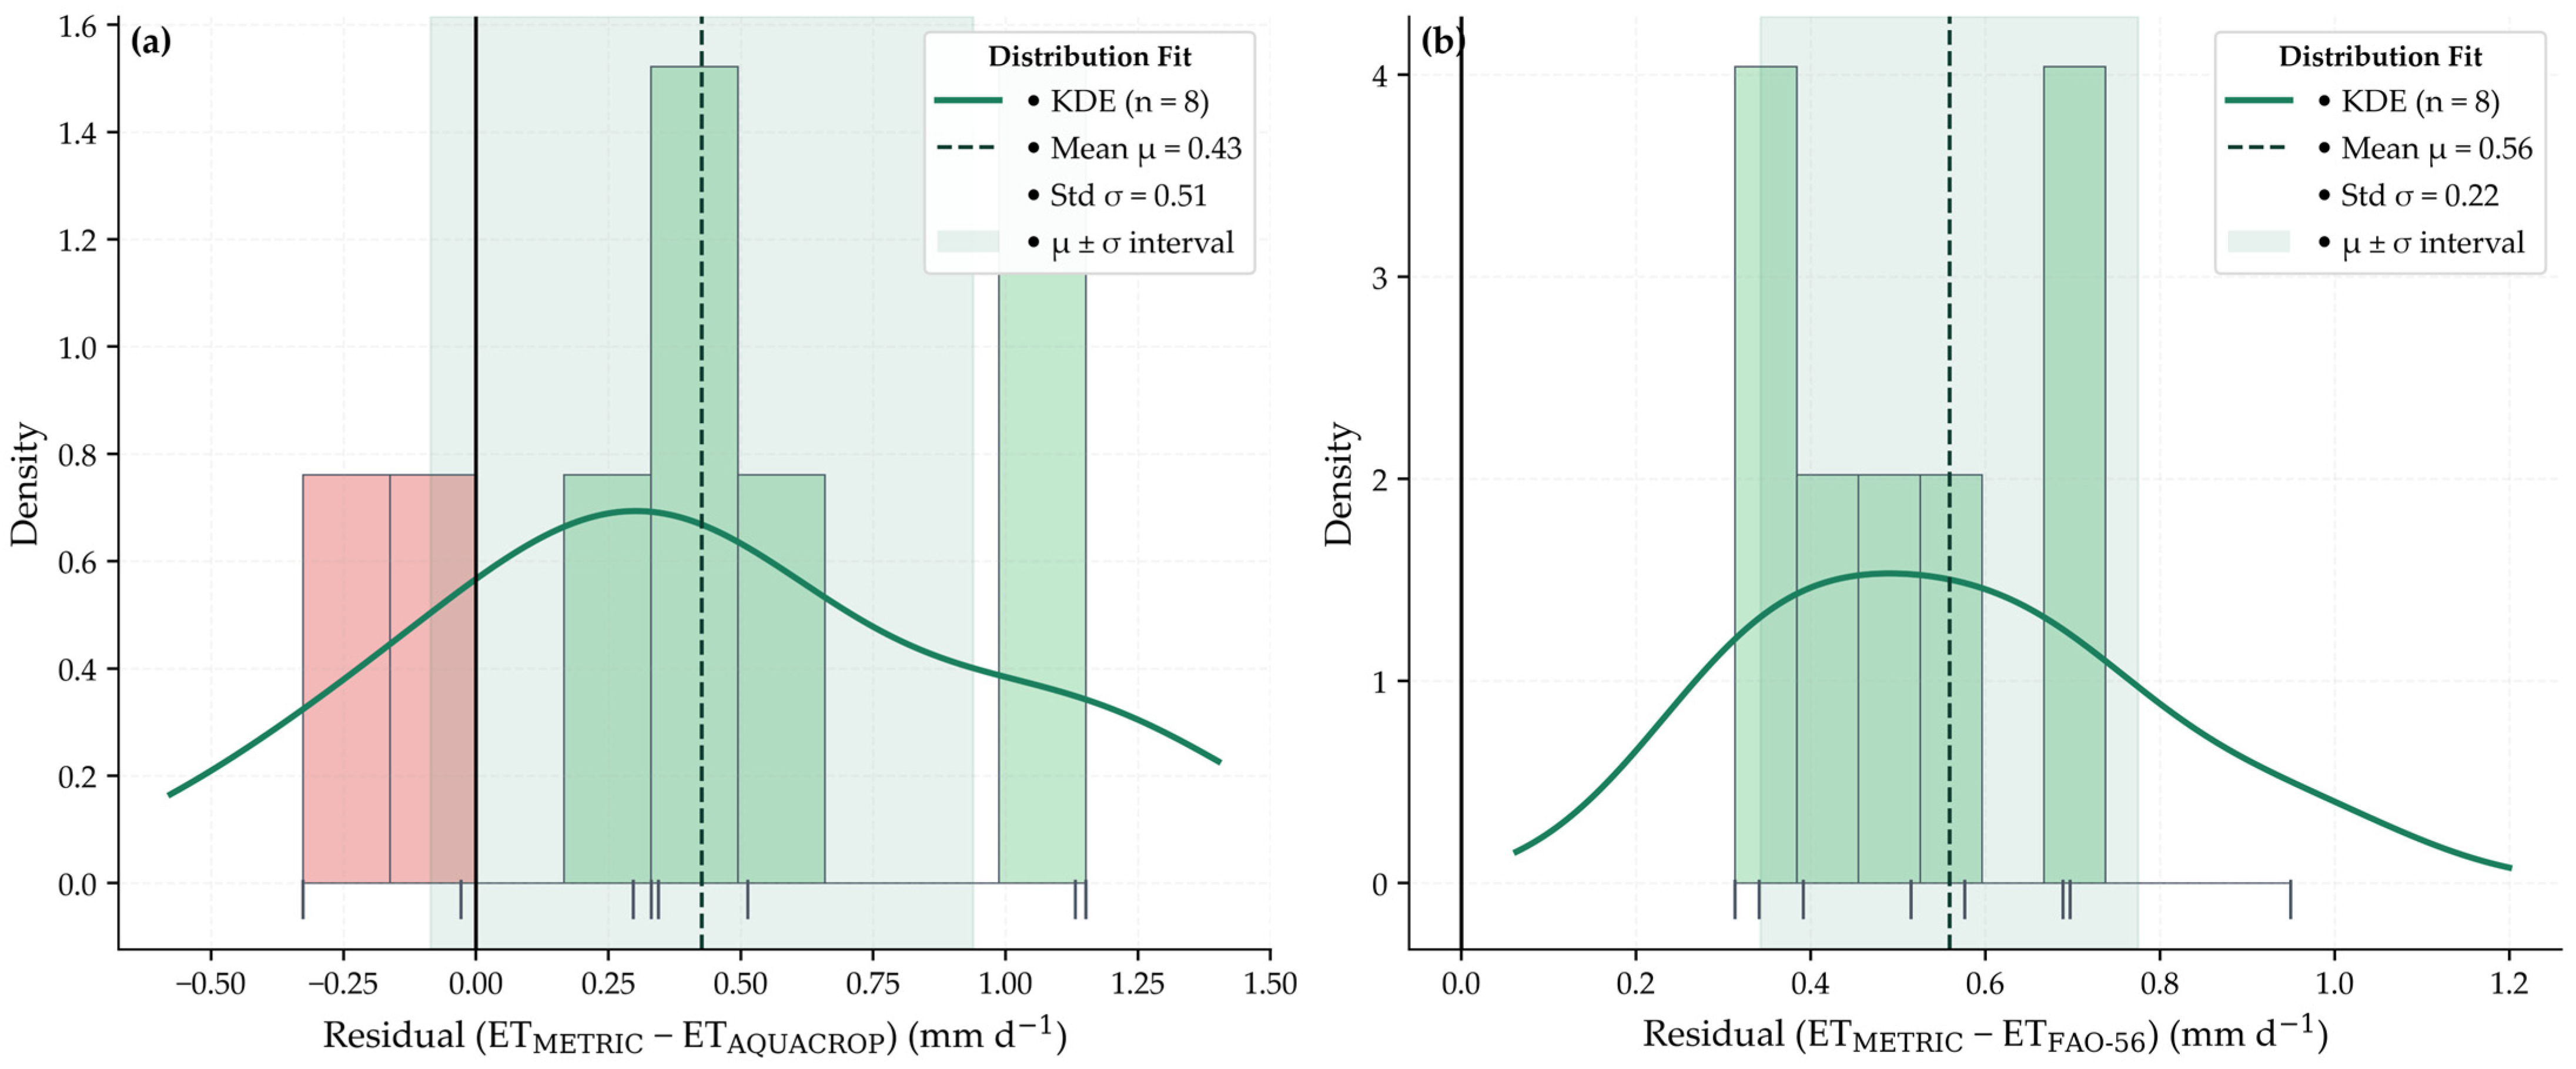
For the 2023–2024 water-limited campaign (Figure 14), residual distributions were broader and shifted toward positive values, reflecting the attenuation of evapotranspiration under deficit irrigation. The ETMETRIC–ETAQUACROP residuals (μ = 0.43 mm d−1, σ = 0.51) indicated mild overestimation but maintained an overall symmetric distribution, suggesting consistent performance despite soil-moisture constraints. In contrast, the ETMETRIC–ETFAO-56 residuals (μ = 0.56 mm d−1, σ = 0.22) exhibited a narrower yet systematically positive shift, confirming a persistent high-bias of ETMETRIC relative to the empirical ETFAO-56 formulation. These residual structures emphasize the complementary nature of both models: ETMETRIC effectively captures fine-scale spatial variability and canopy stress through its energy-balance formulation, while ETAQUACROP reproduces the temporal dynamics of transpiration governed by root-zone water depletion.
Overall, the multiscale analysis revealed consistent seasonal ET dynamics across both agricultural campaigns, with METRIC capturing pronounced intra-parcel variability and AquaCrop providing smooth daily continuity. The strongest agreement among methods occurred during periods of full canopy development, whereas the largest deviations—particularly between METRIC and FAO-56—emerged under water-limited and spatially heterogeneous conditions. These collective patterns provide a coherent basis for the subsequent discussion of the physical drivers of inter-model discrepancies and their implications for irrigation management in hyper-arid olive orchards.

4. Discussion

4.1. Multiscale Coherence and Phenological Control of ET

Across both campaigns, ETMETRIC and ETAQUACROP captured a coherent seasonal signal: ET rose to a late-summer maximum and then declined as foliage senesced (Figure 7 and Figure 8). In 2021–2022, local ET maxima in central blocks reached ~6–7 mm d−1, while ROI means stayed lower (≤4.25 ± 1.76 mm d−1 on 11 January 2024; Table 2), highlighting the expected gap between pixel peaks and parcel means. Temporal agreement among methods was strongest near peak canopy, when vegetation structure and soil moisture were most stable (Figure 9), and weakened under water limitation in 2023–2024 (Figure 10). These patterns align with recent olive-orchard studies where remote-sensing fluxes track canopy expansion/senescence under arid forcing and where RS–model convergence tightens at maximum cover and loosens under stress, e.g., [1,8,36].

4.2. Physical Drivers of Discrepancies Across Methods

Inter-method differences arise from complementary sensitivities that are intrinsic to the physical basis of each model. In ETMETRIC, the selection of cold and hot anchor pixels governs the ΔT–H calibration and directly affects LE retrieval. Sub-pixel thermal mixing at 30 m—combining canopy, bare soil, and wetted drip zones—can elevate apparent ET over warmer patches, particularly in discontinuous or sparse canopies (Figure 7 and Figure 8). This behavior is widely reported in arid tree-crop systems where soil-evaporation contributions dominate under high atmospheric demand [35].
In contrast, ETAQUACROP is driven by a spatially uniform parameterization of rooting depth, salinity response, and canopy development. This structure tends to smooth micro-advective processes and localized soil-evaporation pulses that METRIC detects thermally. The use of a single weather station as atmospheric forcing may also attenuate wind and radiation gradients that influence sensible-heat flux (H), contributing to deviations between models.
The wider scatter and steeper slopes observed in the 2023–2024 regressions (Figure 13), compared with the more coherent 2021–2022 relationships (Figure 11), are consistent with these mechanisms intensifying under moisture-limited conditions [9]. Similar increases in ET dispersion under deficit irrigation and heterogeneous canopy stress have been documented in recent orchard-scale studies [37], supporting the interpretation that water limit amplifies spatial and temporal divergence among ETMETRIC, ETAQUACROP, and ETFAO-56.

4.3. FAO-56 Performance and the Role of Canopy Structure

The ETFAO-56 method showed intermediate performance in the 2021–2022 season and better alignment during the drier cycle of 2023–2024. In 2021–2022, ETFAO-56 systematically underestimated ET relative to ETMETRIC and ETAQUACROP (Figure 9), a pattern confirmed by positive residuals in the METRIC-FAO-56 comparison (Figure 11b). In 2023–2024, agreement increased (R2 = 0.95; RMSE = 0.59 mm d−1; Figure 13b), although a positive residual shift persisted (μ = 0.56 mm d−1; Figure 14b), indicating continued underestimation under deficit conditions. These results emphasize that empirical Kc approaches perform more robustly when dynamically linked to vegetation metrics (e.g., NDVI, fractional cover) or locally calibrated to canopy structure and stress responses—particularly in hyper-arid perennial systems where ET is strongly influenced by canopy heterogeneity and soil-evaporation contributions [38,39].

4.4. Residual Structure and Operational Bias

Residual diagnostics were informative and largely unimodal. In 2021–2022, ETMETRIC–ETAQUACROP residuals were effectively unbiased (μ = 0.11 mm d−1; σ = 0.19), whereas ETMETRIC–ETFAO-56 showed a clear positive shift (μ = 0.81 mm d−1; σ = 0.16) (Figure 12). Under 2023–2024 water limitation, dispersion increased and both comparisons shifted positive (μ = 0.43 and 0.56 mm d−1; Figure 14). The direction and magnitude of these residuals indicate that ETMETRIC is more sensitive to localized soil evaporation and micro-advection—signals attenuated in ETAQUACROP and in Kc-based formulations—providing actionable guidance to curb avoidable evaporative losses (e.g., reducing the wetted area, applying mulches), consistent with findings in arid irrigated systems [2].

4.5. Implications for Water Management in Hyper-Arid Orchards

The combined use of ETMETRIC and ETAQUACROP provides complementary and operationally relevant information for precision irrigation. METRIC offers spatial diagnostics at resolution 30 m that reveal intra-parcel heterogeneity and evaporative “hotspots” (Figure 7 and Figure 8), while AquaCrop provides daily temporal continuity and a physically based E/Tr partitioning that closely follows parcel-scale medians (Figure 9 and Figure 10). Together, both models enable the derivation of simple decision indicators—such as the METRIC–AquaCrop residuals (e.g., μ in Figure 12 and Figure 14)—which help identify periods or zones dominated by non-productive evaporation or by emerging water stress. This integrated perspective supports targeted irrigation, improved scheduling, and soil-surface conservation practices in hyper-arid orchard systems [36,40].

4.6. Limitations and Future Work

The multiscale comparison between ETMETRIC, ETAQUACROP, and ETFAO-56 revealed consistent yet seasonally dependent performance. During the high-yield campaign (2021–2022), both models exhibited near 1:1 correspondence (R2 = 0.94; RMSE = 0.21 mm d−1; MBE = 0.11 mm d−1), whereas deviations were larger in the FAO-56 estimates (R2 = 0.88; RMSE = 0.82 mm d−1; MBE = 0.81 mm d−1). Under water-limited conditions (2023–2024), inter-model correlations remained strong but attenuated (ETMETRIC–ETAQUACROP: R2 = 0.75; RMSE = 0.64 mm d−1; MBE = 0.43 mm d−1; ETAQUACROP–ETFAO-56: R2 = 0.95; RMSE = 0.59 mm d−1; MBE = 0.56 mm d−1). Residual analysis confirmed minimal bias in 2021–2022 (μ = 0.11 mm d−1, σ = 0.19) and positive shifts in 2023–2024 (μ = 0.43–0.56 mm d−1), consistent with METRIC’s higher sensitivity to soil evaporation and micro-advection, which are not fully represented in process- or coefficient-based models.
Uncertainties are mainly associated with (i) meteorological representativeness due to single-station forcing, (ii) anchor-pixel selection and ΔT–H robustness in ETMETRIC, (iii) parameter sensitivity in ETAQUACROP, and (iv) thermal sub-pixel mixing. These factors collectively contribute to variations in energy partitioning and evapotranspiration retrieval under heterogeneous canopy and irrigation conditions.
Given the discontinuous canopy typical of olive orchards, sub-pixel thermal mixing between foliage, bare soil, and wetted drip zones may locally elevate land surface temperature (LST), shifting the ΔT–H calibration and inflating LE estimates. Although hot and cold pixel selection prioritized spectrally homogeneous patches to reduce this effect, residual thermal mixing at 30 m resolution likely contributed to the moderate METRIC overestimation observed in sparse-canopy and edge-of-parcel areas. This is a known limitation of thermal remote sensing in woody perennial systems and underscores the need for future refinements using higher-resolution LST products or multi-sensor fusion approaches.
Future priorities include automated or ensemble-based anchor selection with uncertainty propagation, multi-sensor LST fusion (Landsat–Sentinel–ECOSTRESS) to refine Ts sampling, and ensemble AquaCrop calibration constrained by soil-water observations. Independent validation using eddy covariance or lysimeter measurements will be essential to reduce model bias and strengthen physical consistency. Furthermore, integrating soil-moisture constraints jointly with thermal data within ETFAO-56 or dual-source frameworks could further reduce ET uncertainty and improve spatio-temporal coupling across scales [9,21,40].
Collectively, these refinements will enhance the reliability of remote-sensing-based evapotranspiration estimates and expand their operational application for irrigation management in hyper-arid agricultural systems.

5. Conclusions

The integration of the satellite-based METRIC model and the process-oriented AquaCrop model enabled a robust and internally consistent reconstruction of the seasonal dynamics of evapotranspiration (ET) in a hyper-arid olive orchard. Both models exhibited the highest agreement during mid-season foliage peaks—when canopy structure and soil moisture were most stable—and a moderate divergence under water-limited conditions, reflecting the expected shift in the evaporation/transpiration partition and the increasing role of soil evaporation.
Spatially, ETMETRIC mapped well-defined intra-parcel gradients, with ETMETRIC maxima of approximately 6–7 mm d−1 in central blocks during March–April, while regional means remained ≤ 4.25 ± 1.76 mm d−1. This systematic gap between pixel peaks and parcel averages highlights the utility of 30 m-resolution spatial diagnostics for identifying localized water-use patterns and stress hotspots under drip irrigation.
Operationally, the two modeling approaches are complementary: AquaCrop provides daily temporal continuity and physically based E/Tr partitioning that aligns closely with parcel-scale medians, while METRIC delivers spatially explicit diagnostics of canopy heterogeneity and energy-balance stress at the management scale. Integrating both within a unified workflow allows accurate ET quantification and actionable irrigation guidance—e.g., optimizing timing and zoning of water applications to minimize non-productive evaporation and improve water-use efficiency (WUE) in hyper-arid perennial systems.
This research establishes a methodological foundation for future investigations incorporating UAV-based thermal sensing and eddy covariance flux towers to enhance ET validation and energy-balance closure at finer spatial and temporal scales. Such advancements will strengthen precision irrigation and water-resource management strategies for olive orchards along the southern coast of Peru, a region of growing agro-economic relevance under increasing aridity pressures.

Supplementary Materials

The following supporting information can be downloaded at https://www.mdpi.com/article/10.3390/agriculture15232423/s1.

Author Contributions

Conceptualization, J.Q.-M. and L.R.-F.; methodology, J.H.-M. and J.Q.-M.; validation, J.H.-M., J.Q.-M. and G.H.-F.; formal analysis, J.H.-M.; investigation, J.H.-M., D.Q.-T. and C.C.-R.; resources, G.H.-F., E.P.-V. and B.V.-B.; data curation, J.H.-M.; writing—original draft preparation, J.H.-M.; writing—review and editing, J.Q.-M., L.R.-F., D.Q.-T. and C.C.-R.; visualization, J.H.-M.; supervision, L.R.-F. and E.P.-V.; project administration, L.R.-F. and E.P.-V.; funding acquisition, E.P.-V. All authors have read and agreed to the published version of the manuscript.

Funding

This research was funded by the Vice-Rectorate for Research of the Jorge Basadre Grohmann National University (UNJBG) through the canon and mining royalties funds, under the project “Use of remote sensors to improve irrigation management in olive trees (Olea europaea L.) and confront climate change in arid zones” (Rectoral Resolution No. 11174-2023-UNJBG). The authors also acknowledge the support of the Water Research Group (H2O-UNJBG).

Data Availability Statement

The data presented in this study are available upon request from the corresponding author.

Acknowledgments

The authors gratefully acknowledge the technical and logistical support provided by the staff of the Jorge Basadre Grohmann National University (UNJBG), Tacna, Peru, for facilitating the execution of the project “Use of remote sensors to improve irrigation management in olive trees (Olea europaea L.) and confront climate change in arid zones”.

Conflicts of Interest

The authors declare no conflicts of interest.

Abbreviations

The following abbreviations are used in this manuscript:
ETEvapotranspiration
ETcCrop evapotranspiration
EToReference evapotranspiration
ETrFReference evapotranspiration fraction
KcCrop coefficient
RnNet radiation
GSoil heat flux
HSensible heat flux
LELatent heat flux
LSTLand surface temperature
NDVINormalized Difference Vegetation Index
LAILeaf Area Index
CCCanopy cover
E/TrEvaporation/Transpiration
WUEWater-use efficiency
RMSERoot Mean Square Error
MAEMean Absolute Error
MBEMean Bias Error
rRMSERelative Root Mean Square Error
NSENash–Sutcliffe Efficiency
GEEGoogle Earth Engine
ROIRegion of Interest
DOYDay of Year
ECElectrical Conductivity
FCField Capacity
PWPPermanent Wilting Point
CGCCanopy Growth Coefficient
CDCCanopy Decline Coefficient
OLSOrdinary Least Squares
ΔTAir temperature difference between surface and reference height
METRICMapping Evapotranspiration at High Resolution with Internalized Calibration
FAOFood and Agriculture Organization of the United Nations
FAO-56FAO Irrigation and Drainage Paper No. 56 (Penman–Monteith method)
AquaCropFAO Crop Water Productivity Model
OLI/TIRSOperational Land Imager/Thermal Infrared Sensor
UTMUniversal Transverse Mercator
ECOSTRESSECOsystem Spaceborne Thermal Radiometer Experiment on Space Station
SMAPSoil Moisture Active Passive mission

References

  1. Bchir, A.; M’nassri, S.; Dhib, S.; El Amri, A.; Mulla, D. Estimating and Mapping Evapotranspiration in Olive Groves of Semi-Arid Tunisia Using Empirical Formulas and Satellite Remote Sensing. Arab. J. Geosci. 2021, 14, 2717. [Google Scholar] [CrossRef]
  2. Elkatoury, A.; Alazba, A.A.; Radwan, F.; Kayad, A.; Mossad, A. Evapotranspiration Estimation Assessment Using Various Satellite-Based Surface Energy Balance Models in Arid Climates. Earth Syst. Environ. 2024, 8, 1347–1369. [Google Scholar] [CrossRef]
  3. Allen, R.G.; Tasumi, M.; Trezza, R. Satellite-Based Energy Balance for Mapping Evapotranspiration with Internalized Calibration (METRIC)—Model. J. Irrig. Drain. Eng. 2007, 133, 380–394. [Google Scholar] [CrossRef]
  4. Elfarkh, J.; Simonneaux, V.; Jarlan, L.; Ezzahar, J.; Boulet, G.; Chakir, A.; Er-Raki, S. Evapotranspiration Estimates in a Traditional Irrigated Area in Semi-Arid Mediterranean. Comparison of Four Remote Sensing-Based Models. Agric. Water Manag. 2022, 270, 107728. [Google Scholar] [CrossRef]
  5. Alsenjar, O.; Cetin, M.; Aksu, H.; Golpinar, M.S.; Akgul, M.A. Actual Evapotranspiration Estimation Using METRIC Model and Landsat Satellite Images over an Irrigated Field in the Eastern Mediterranean Region of Turkey. Mediterr. Geosci. Rev. 2023, 5, 35–49. [Google Scholar] [CrossRef]
  6. Rahimi, A.; Bouasria, A.; Bounif, M.; Zaakour, F.; El Mjiri, I. Estimating Evapotranspiration Using Remote Sensing and the METRIC Energy Balance Model: Case Study of Sidi Benour Region (Morocco). In Proceedings of the 2021 Third International Sustainability and Resilience Conference: Climate Change, Sakheer, Bahrain, 15–16 November 2021; pp. 142–147. [Google Scholar] [CrossRef]
  7. Singh, R.P.; Paramanik, S.; Bhattacharya, B.K.; Behera, M.D. Modelling of Evapotranspiration Using Land Surface Energy Balance and Thermal Infrared Remote Sensing. Trop. Ecol. 2020, 61, 42–50. [Google Scholar] [CrossRef]
  8. Aguirre-García, S.D.; Aranda-Barranco, S.; Nieto, H.; Serrano-Ortiz, P.; Sánchez-Cañete, E.P.; Guerrero-Rascado, J.L. Modelling Actual Evapotranspiration Using a Two Source Energy Balance Model with Sentinel Imagery in Herbaceous-Free and Herbaceous-Cover Mediterranean Olive Orchards. Agric. Meteorol. 2021, 311, 108692. [Google Scholar] [CrossRef]
  9. Sara, O.; Bouchra, A.; Abdelhakim, A.; Salah, E.R.A.K.I.; Lhoussaine, B.; Frederic, J.; Abdelghani, C. Assessment of the Modified Two-Source Energy Balance (TSEB) Model for Estimating Evapotranspiration and Its Components over an Irrigated Olive Orchard in Morocco. Agric. Water Manag. 2024, 298, 108861. [Google Scholar] [CrossRef]
  10. Acharya, B.; Sharma, V. Comparison of Satellite Driven Surface Energy Balance Models in Estimating Crop Evapotranspiration in Semi-Arid to Arid Inter-Mountain Region. Remote Sens. 2021, 13, 1822. [Google Scholar] [CrossRef]
  11. Liu, N.; Liu, Q.; Liu, X.; Zhang, X.; Shao, L. Upscaling Instantaneous ET Obtained Using UAV Multispectral and Thermal Data into Daily ET with and without UAV Flights. Eur. J. Agron. 2026, 172, 127865. [Google Scholar] [CrossRef]
  12. Jaafar, H.; Sujud, L. High Resolution Evapotranspiration from UAV Multispectral Thermal Imagery: Validation and Comparison with EC, Landsat, and Fused S2-MODIS HSEB ET. Int. J. Appl. Earth Obs. Geoinf. 2025, 136, 104359. [Google Scholar] [CrossRef]
  13. Liu, M.; Lei, H.; Wang, X.; Paredes, P. High-Resolution Mapping of Evapotranspiration over Heterogeneous Cropland Affected by Soil Salinity. Agric. Water Manag. 2025, 308, 109301. [Google Scholar] [CrossRef]
  14. Rozanov, A.; Subedi, S.; Sharma, V.; Runck, B.C. Knowledge-Guided Machine Learning Models to Upscale Evapotranspiration in the U.S. Midwest. arXiv 2025, arXiv:2510.11505. [Google Scholar]
  15. López-Urrea, R.; Domínguez, A.; Pardo, J.J.; Montoya, F.; García-Vila, M.; Martínez-Romero, A. Parameterization and Comparison of the AquaCrop and MOPECO Models for a High-Yielding Barley Cultivar under Different Irrigation Levels. Agric. Water Manag. 2020, 230, 105931. [Google Scholar] [CrossRef]
  16. Boulange, J.; Nizamov, S.; Nurbekov, A.; Ziyatov, M.; Kamilov, B.; Nizamov, S.; Abduvasikov, A.; Khamdamova, G.; Watanabe, H. Calibration and Validation of the AquaCrop Model for Simulating Cotton Growth under a Semi-Arid Climate in Uzbekistan. Agric. Water Manag. 2025, 310, 109360. [Google Scholar] [CrossRef]
  17. Rahimi Jamnani, M.; Mirzaei, F.; Liaghat, A. Evaluation of Sugarcane Irrigation Using AquaCrop Model and Remote Sensing. Irrig. Drain. 2022, 71, 1034–1047. [Google Scholar] [CrossRef]
  18. Er-Raki, S.; Bouras, E.; Rodriguez, J.C.; Watts, C.J.; Lizarraga-Celaya, C.; Chehbouni, A. Parameterization of the AquaCrop Model for Simulating Table Grapes Growth and Water Productivity in an Arid Region of Mexico. Agric. Water Manag. 2021, 245, 106585. [Google Scholar] [CrossRef]
  19. Khorsand, A.; Dehghanisanij, H.; Heris, A.M.; Asgarzadeh, H.; Rezaverdinejad, V. Calibration and Evaluation of the FAO AquaCrop Model for Canola (Brassica Napus) under Full and Deficit Irrigation in a Semi-Arid Region. Appl. Water Sci. 2024, 14, 56. [Google Scholar] [CrossRef]
  20. Hassen, J.M.; Borana, F.R. Comparison of Three Different Approaches Used for the Determination of Wheat Evapotranspiration in Middle Awash, Werer, Ethiopia. J. Water Resour. Ocean. Sci. 2025, 14, 45–51. [Google Scholar] [CrossRef]
  21. Bambach, N.; Knipper, K.; McElrone, A.J.; Nocco, M.; Torres-Rua, A.; Kustas, W.; Anderson, M.; Castro, S.; Edwards, E.; Duran-Gomez, M.; et al. The Tree-Crop Remote Sensing of Evapotranspiration Experiment (T-REX): A Science-Based Path for Sustainable Water Management and Climate Resilience. Bull. Am. Meteorol. Soc. 2024, 105, E257–E284. [Google Scholar] [CrossRef]
  22. Machaca-Pillaca, R.; Pino-Vargas, E.; Ramos-Fernández, L.; Quille-Mamani, J.; Torres-Rua, A. Estimation of Evapotranspiration for Irrigation Purposes in Real Time of an Olive Grove from Drone Images in Arid Arcas, Case of La Yarada, Tacna, Peru. Idesia 2022, 40, 55–65. [Google Scholar] [CrossRef]
  23. Peddinti, S.R.; Kisekka, I. Estimation of Turbulent Fluxes over Almond Orchards Using High-Resolution Aerial Imagery with One and Two-Source Energy Balance Models. Agric. Water Manag. 2022, 269, 107671. [Google Scholar] [CrossRef]
  24. Quispe-Tito, D.J.; Ramos-Fernández, L.; Pino-Vargas, E.; Quille-Mamani, J.; Torres-Rua, A. Use of RPAS for Precision Evapotranspiration in Rice Fields and Water Consumption Reduction. Agron. Mesoam. 2024, 35, 56529. [Google Scholar] [CrossRef]
  25. Ali, M.; Haque, M.A.; Ali, M.R.; Rahman, M.A.; Jin, H.; Jang, Y.Y.; Chung, S.O. Spatial, Vertical, and Temporal Soil Water Content Variability Affected by Low-Pressure Drip Irrigation in Sandy Loam Soil: A Soil Bin Experimental Study. Agronomy 2024, 14, 2848. [Google Scholar] [CrossRef]
  26. Alghamdi, A.G.; Majrashi, M.A.; Ibrahim, H.M. Improving the Physical Properties and Water Retention of Sandy Soils by the Synergistic Utilization of Natural Clay Deposits and Wheat Straw. Sustainability 2023, 16, 46. [Google Scholar] [CrossRef]
  27. Xu, J.; Bai, W.; Li, Y.; Wang, H.; Yang, S.; Wei, Z. Modeling Rice Development and Field Water Balance Using AquaCrop Model under Drying-Wetting Cycle Condition in Eastern China. Agric. Water Manag. 2019, 213, 289–297. [Google Scholar] [CrossRef]
  28. Terán-Chaves, C.A.; García-Prats, A.; Polo-Murcia, S.M. Calibration and Validation of the FAO AquaCrop Water Productivity Model for Perennial Ryegrass (Lolium perenne L.). Water 2022, 14, 3933. [Google Scholar] [CrossRef]
  29. Ramos-Fernández, L.; Peña-Amaro, R.; Huanuqueño-Murillo, J.; Quispe-Tito, D.; Maldonado-Huarhuachi, M.; Heros-Aguilar, E.; Flores del Pino, L.; Pino-Vargas, E.; Quille-Mamani, J.; Torres-Rua, A. Water Use Efficiency in Rice Under Alternative Wetting and Drying Technique Using Energy Balance Model with UAV Information and AquaCrop in Lambayeque, Peru. Remote Sens. 2024, 16, 3882. [Google Scholar] [CrossRef]
  30. Rallo, L.; Barranco, D.; Díez, C.M.; Rallo, P.; Suárez, M.P.; Trapero, C.; Alfaro, F.P. Strategies for Olive (Olea europaea L.) Breeding: Cultivated Genetic Resources and Crossbreeding. Adv. Plant Breed. Strateg. Fruits 2018, 3, 535–600. [Google Scholar] [CrossRef]
  31. Quille-Mamani, J.A.; Ramos-Fernández, L.; Ontiveros-Capurata, R.E. Estimation of Rice Crop Evapotranspiration in Perú Based on the METRIC Algorithm and UAV Images. Rev. De. Teledetección 2021, 2021, 23–38. [Google Scholar] [CrossRef]
  32. Allen, R.; Irmak, A.; Trezza, R.; Hendrickx, J.M.H.; Bastiaanssen, W.; Kjaersgaard, J. Satellite-Based ET Estimation in Agriculture Using SEBAL and METRIC. Hydrol. Process 2011, 25, 4011–4027. [Google Scholar] [CrossRef]
  33. Suwanlertcharoen, T.; Chaturabul, T.; Supriyasilp, T.; Pongput, K. Estimation of Actual Evapotranspiration Using Satellite-Based Surface Energy Balance Derived from Landsat Imagery in Northern Thailand. Water 2023, 15, 450. [Google Scholar] [CrossRef]
  34. Bastiaanssen, W.G.M.; Menenti, M.; Feddes, R.A.; Holtslag, A.A.M. A Remote Sensing Surface Energy Balance Algorithm for Land (SEBAL). 1. Formulation. J. Hydrol. 1998, 212–213, 198–212. [Google Scholar] [CrossRef]
  35. Paço, T.A.; Pôças, I.; Cunha, M.; Silvestre, J.C.; Santos, F.L.; Paredes, P.; Pereira, L.S. Evapotranspiration and Crop Coefficients for a Super Intensive Olive Orchard. An Application of SIMDualKc and METRIC Models Using Ground and Satellite Observations. J. Hydrol. 2014, 519, 2067–2080. [Google Scholar] [CrossRef]
  36. Elfarkh, J.; Johansen, K.; El Hajj, M.M.; Almashharawi, S.K.; McCabe, M.F. Evapotranspiration, Gross Primary Productivity and Water Use Efficiency over a High-Density Olive Orchard Using Ground and Satellite Based Data. Agric. Water Manag. 2023, 287, 108423. [Google Scholar] [CrossRef]
  37. Ortega-Salazar, S.; Ortega-Farías, S.; Kilic, A.; Allen, R. Performance of the METRIC Model for Mapping Energy Balance Components and Actual Evapotranspiration over a Superintensive Drip-Irrigated Olive Orchard. Agric. Water Manag. 2021, 251, 106861. [Google Scholar] [CrossRef]
  38. Eliades, M.; Bruggeman, A.; Djuma, H.; Christofi, C.; Kuells, C. Quantifying Evapotranspiration and Drainage Losses in a Semi-Arid Nectarine (Prunus Persica Var. Nucipersica) Field with a Dynamic Crop Coefficient (Kc) Derived from Leaf Area Index Measurements. Water 2022, 14, 734. [Google Scholar] [CrossRef]
  39. Ippolito, M.; De Caro, D.; Capodici, F.; Ciraolo, G. Distributed FAO56 Agro-Hydrological Model for Irrigation Scheduling in Olives Orchards. In Proceedings of the 2023 IEEE International Workshop on Metrology for Agriculture and Forestry (MetroAgriFor), Pisa, Italy, 6–8 November 2023; pp. 137–142. [Google Scholar] [CrossRef]
  40. Amazirh, A.; Er-Raki, S.; Ojha, N.; Bouras, E.h.; Rivalland, V.; Merlin, O.; Chehbouni, A. Assimilation of SMAP Disaggregated Soil Moisture and Landsat Land Surface Temperature to Improve FAO-56 Estimates of ET in Semi-Arid Regions. Agric. Water Manag. 2022, 260, 107290. [Google Scholar] [CrossRef]
Figure 1. Conceptual flowchart of the METRIC energy balance model implemented in Google Earth Engine (GEE) for the estimation of actual evapotranspiration (ETMETRIC, ETAQUACROP, and ETFAO-56) in irrigated olive orchards under hyper-arid conditions in southern Peru. The diagram outlines the preprocessing of multispectral and thermal Landsat data, the integration of meteorological inputs, and the coupling with AquaCrop simulations for model intercomparison.
Agriculture 15 02423 g001
Figure 2. Study area of the experimental olive orchard located in La Yarada–Los Palos, Tacna region, southern Peru: (a) national-scale geographic location, (b) regional setting within Tacna, and (c) high-resolution view of the irrigated olive orchard used for the integrated spatial analysis of evapotranspiration using ETMETRIC, ETAQUACROP, and ETFAO-56 models.
Agriculture 15 02423 g002
Figure 3. Monthly meteorological conditions at the experimental olive orchard in La Yarada–Los Palos, Tacna, Peru, during two contrasting growing seasons (2021–2022 and 2023–2024): (a) accumulated precipitation (bars; mm) and mean relative humidity (lines; %); (b) monthly mean air temperatures (Tmax and Tmin; bars, °C) and wind speed (lines, m s−1).
Agriculture 15 02423 g003
Figure 4. Methodological flowchart of the AquaCrop model configuration, calibration, and simulation process for estimating crop evapotranspiration (ETAQUACROP), biomass, and yield in the experimental olive orchard located in La Yarada–Los Palos, Tacna, Peru.
Agriculture 15 02423 g004
Figure 5. Workflow of the METRIC model implemented in Google Earth Engine (GEE) for the estimation of actual evapotranspiration (ETMETRIC) and surface energy balance in olive orchards under arid conditions in Tacna, Peru.
Agriculture 15 02423 g005
Figure 6. Validation of AquaCrop-simulated green canopy cover (CC, %) against field observations for two contrasting growing seasons in the experimental olive orchard of La Yarada–Los Palos (Tacna, Peru): (a) 2021–2022 high-yield campaign; (b) 2023–2024 water-limited campaign. The dashed line denotes the 1:1 agreement; error bars indicate ±1 SD computed from the three field measurements taken each month, which were averaged to obtain the 12 monthly calibration points. Reported statistics include r, RMSE, CV(RMSE), NSE, and Willmott’s d.
Agriculture 15 02423 g006
Figure 7. Multi-temporal maps of daily actual evapotranspiration estimated with the ETMETRIC model during the 2021–2022 high-yield campaign over the experimental olive orchard in La Yarada–Los Palos, Tacna (Peru). Panels (ah) correspond to 11 November 2021, 4 December 2021, 2 March 2022, 18 March 2022, 3 April 2022, 19 April 2022, 27 April 2022, and 5 May 2022. Higher ET (~6–7 mm d−1) occurred in March–April, declining toward May as the canopy senesced. All scenes share a 0–8 mm d−1 color scale (UTM 19S).
Agriculture 15 02423 g007
Figure 8. Multi-temporal maps of daily actual evapotranspiration estimated with the ETMETRIC model during the 2023–2024 water-limited campaign over the experimental olive orchard in La Yarada–Los Palos, Tacna (Peru). Panels (ah) correspond to 15 October 2023, 11 January 2024, 27 January 2024, 4 February 2024, 20 Febbruary 2024, 3 March 2024, 16 April 2024, and 24 April 2024. ET was lower overall (~3–5 mm d−1) and spatially more heterogeneous, reflecting canopy water stress. All maps share a 0–8 mm d−1 color scale (UTM 19S).
Agriculture 15 02423 g008
Figure 9. Temporal comparison among ETMETRIC, ETAQUACROP, and ETFAO-56 during the 2021–2022 campaign. Lines represent daily series; boxplots depict spatial variability of METRIC at each Landsat date (30 m).
Agriculture 15 02423 g009
Figure 10. Temporal comparison among ETMETRIC, ETAQUACROP, and ETFAO-56 during the 2023–2024 campaign. Lines represent daily series; boxplots depict spatial variability of METRIC at each Landsat date (30 m).
Agriculture 15 02423 g010
Figure 11. Validation of ETMETRIC Against ETAQUACROP and ETFAO-56 for the 2021–2022 Growing Season: (a) Comparison with ETAQUACROP Daily and (b) Comparison with ETFAO-56 Estimates. The colored dots represent individual daily ET estimates corresponding to satellite overpass dates. The solid blue line indicates the Ordinary Least Squares (OLS) linear regression fit, with the shaded blue area representing its 95% confidence interval. The dashed purple line shows the Deming regression fit, and the dashed gray line is the 1:1 reference line indicating perfect agreement.
Agriculture 15 02423 g011
Figure 12. Residual density distributions of METRIC-derived daily actual evapotranspiration (ETMETRIC) for the 2021–2022 campaign: (a) residuals between ETMETRIC and ETAQUACROP-simulated values; (b) residuals between ETMETRIC and ETFAO-56 estimates. Histograms depict the residual frequency distribution (mm d−1), with pink bars indicating negative residuals (underestimation by ETMETRIC) and green bars indicating positive residuals (overestimation). The solid dark-green curve represents the kernel density estimation (KDE). The dashed vertical line marks the mean (μ), and the shaded area denotes the μ ± σ interval. The solid black line indicates the zero-bias reference, highlighting the magnitude and symmetry of deviations in each comparison.
Agriculture 15 02423 g012
Figure 13. Validation of ETMETRIC Against ETAQUACROP and ETFAO-56 for the 2023–2024 Growing Season: (a) Comparison with ETAQUACROP Daily and (b) Comparison with ETFAO-56 Estimates. The colored dots represent individual daily ET estimates corresponding to satellite overpass dates. The solid blue line indicates the Ordinary Least Squares (OLS) linear regression fit, with the shaded blue area representing its 95% confidence interval. The dashed purple line shows the Deming regression fit, and the dashed gray line is the 1:1 reference line indicating perfect agreement.
Agriculture 15 02423 g013
Figure 14. Residual density distributions of METRIC-derived daily actual evapotranspiration (ETMETRIC) for the 2023–2024 campaign: (a) residuals between ETMETRIC and ETAQUACROP-simulated values; (b) residuals between ETMETRIC and ETFAO-56 estimates. Histograms depict the residual frequency distribution (mm d−1), with pink bars indicating negative residuals (underestimation by ETMETRIC) and green bars indicating positive residuals (overestimation). The solid dark-green curve represents the kernel density estimation (KDE). The dashed vertical line marks the mean (μ), and the shaded area denotes the μ ± σ interval. The solid black line indicates the zero-bias reference, highlighting the magnitude and symmetry of deviations in each comparison.
Agriculture 15 02423 g014
Table 1. Landsat 8/9 (Collection 2, Level 2) scenes used for evapotranspiration estimation with the METRIC model in the experimental olive orchard of La Yarada–Los Palos (Tacna, Peru). The table includes product identifiers, acquisition dates, and cloud cover percentage within the region of interest (ROI).
SensorDate (mm-dd-yyyy)DOYOverpass (UTC-5)Path/RowProduct IDCloud % (ROI)
Landsat 811/26/20213309:42:24002/073LC08_L2SP_002073_202111260
Landsat 912/04/20213389:42:27002/073LC09_L2SP_002073_202112040
Landsat 803/2/2022619:42:03002/073LC08_L2SP_002073_202203020
Landsat 803/18/2022779:41:56002/073LC08_L2SP_002073_202203180
Landsat 804/03/2022939:41:47002/073LC08_L2SP_002073_202204030
Landsat 804/19/20221099:41:52002/073LC08_L2SP_002073_202204190
Landsat 904/27/20221179:41:47002/073LC09_L2SP_002073_202204270
Landsat 805/05/20221259:41:53002/073LC08_L2SP_002073_202205050
Landsat 810/15/20232889:42:12002/073LC08_L2SP_002073_202310150
Landsat 901/11/2024119:42:19002/073LC09_L2SP_002073_202401110
Landsat 901/27/2024279:42:17002/073LC09_L2SP_002073_202401270
Landsat 802/04/2024359:42:08002/073LC08_L2SP_002073_202402040
Landsat 802/20/2024519:42:06002/073LC08_L2SP_002073_202402200
Landsat 903/15/2024759:42:12002/073LC09_L2SP_002073_202403150
Landsat 904/16/20241079:41:54002/073LC09_L2SP_002073_202404160
Landsat 804/24/20241159:41:29002/073LC08_L2SP_002073_202404240
Table 2. Surface energy balance components and evapotranspiration derived from the METRIC model for each Landsat overpass (2021–2024) in the experimental olive orchard, Tacna, Peru.
Acquisition Date (mm-dd-yyyy)NDVILAIAlbedoRn (W m−2)G (W m−2)H (W m−2)LE (W m−2)ETMETRIC (mm d−1)
11/26/20210.36 ± 0.060.86 ± 0.130.24 ± 0.01558.69 ± 18.76121.51 ± 3.73338.02 ± 32.1399.31 ± 46.023.56 ± 1.65
12/4/20210.36 ± 0.060.86 ± 0.120.23 ± 0.01592.96 ± 18.51101.42 ± 3.34391.25 ± 26.6499.91 ± 39.243.56 ± 1.40
3/2/20220.35 ± 0.050.83 ± 0.120.21 ± 0.01541.69 ± 20.2694.31 ± 3.70348.28 ± 25.3299.35 ± 38.533.54 ± 1.37
3/18/20220.36 ± 0.060.86 ± 0.120.21 ± 0.02500.11 ± 21.0095.67 ± 3.96310.44 ± 36.3393.87 ± 50.543.36 ± 1.81
4/3/20220.36 ± 0.060.86 ± 0.120.21 ± 0.02476.73 ± 21.9992.07 ± 4.25294.29 ± 29.0090.51 ± 43.643.24 ± 1.56
4/19/20220.38 ± 0.060.89 ± 0.130.20 ± 0.02449.86 ± 22.8283.70 ± 4.42288.95 ± 35.3677.32 ± 49.072.76 ± 1.75
4/27/20220.38 ± 0.060.89 ± 0.130.19 ± 0.02470.68 ± 23.7858.45 ± 3.33332.49 ± 25.4379.76 ± 39.062.82 ± 1.38
5/5/20220.39 ± 0.060.91 ± 0.140.19 ± 0.02418.98 ± 23.6574.06 ± 4.37281.85 ± 29.4763.47 ± 44.822.27 ± 1.60
10/15/20230.37 ± 0.060.87 ± 0.130.22 ± 0.01547.32 ± 19.95116.87 ± 4.09354.25 ± 29.8576.89 ± 47.652.76 ± 1.71
1/11/20240.37 ± 0.060.87 ± 0.130.22 ± 0.01584.66 ± 20.5691.37 ± 3.29373.82 ± 35.51119.75 ± 49.484.25 ± 1.76
1/27/20240.36 ± 0.060.87 ± 0.120.21 ± 0.02589.63 ± 21.2983.55 ± 3.17401.99 ± 43.71104.46 ± 57.293.70 ± 2.03
2/4/20240.36 ± 0.060.85 ± 0.120.22 ± 0.02528.48 ± 20.65114.80 ± 4.00298.15 ± 35.21115.98 ± 50.114.17 ± 1.80
2/20/20240.37 ± 0.060.87 ± 0.120.23 ± 0.02521.51 ± 20.7696.95 ± 3.60335.12 ± 23.2789.35 ± 38.533.19 ± 1.37
3/15/20240.38 ± 0.060.89 ± 0.120.20 ± 0.02548.60 ± 22.1975.07 ± 3.51382.44 ± 27.9590.98 ± 41.883.22 ± 1.48
4/16/20240.39 ± 0.060.93 ± 0.130.19 ± 0.02486.44 ± 23.4167.48 ± 3.76366.02 ± 9.2052.81 ± 24.391.87 ± 0.86
4/24/20240.35 ± 0.050.84 ± 0.120.20 ± 0.02446.55 ± 22.7971.90 ± 3.91314.61 ± 12.6460.20 ± 28.052.14 ± 1.00
Disclaimer/Publisher’s Note: The statements, opinions and data contained in all publications are solely those of the individual author(s) and contributor(s) and not of MDPI and/or the editor(s). MDPI and/or the editor(s) disclaim responsibility for any injury to people or property resulting from any ideas, methods, instructions or products referred to in the content.