Article

Response of Maize Yield and Water Productivity to Different Long-Term Fertilization Strategies in Semi-Arid Regions in Northern China

by
Zhiping Liu
1,
Ziyuan Guo
1,
Zongyi Wang
1,
Wenyan Xie
1,
Zhenxing Yang
1,
Liyan He
1,
Deli Chen
2,
Xueping Wu
3,* and
Huaiping Zhou
1,*
1
Key Laboratory of Sustainable Dryland Agriculture of Shanxi Province, College of Resources and Environment, Shanxi Agricultural University, Taiyuan 030031, China
2
School of Agriculture, Food and Ecosystem Sciences, Faculty of Science, The University of Melbourne, Parkville, VIC 3010, Australia
3
State Key Laboratory of Efficient Utilization of Arid and Semi-arid Arable Land in Northern China, Institute of Agricultural Resources and Regional Planning, Chinese Academy of Agricultural Sciences, Beijing 100081, China
*
Authors to whom correspondence should be addressed.
Agriculture 2025, 15(22), 2396; https://doi.org/10.3390/agriculture15222396
Submission received: 21 October 2025 / Revised: 14 November 2025 / Accepted: 18 November 2025 / Published: 20 November 2025

Abstract

The scarcity and uneven distribution of precipitation present significant challenges for agriculture in arid regions. Fertilization can improve crop yields and water productivity (WP) under these conditions. However, the effects of different long-term fertilization practices on maize yield and WP under varying precipitation patterns require further research. A 30-year fertilization experiment was conducted to investigate the effects of different fertilization treatments on maize yield, WP, soil organic carbon (SOC), and the correlations among these factors. The treatments included no fertilization, application of chemical fertilizers alone, combined application of chemical fertilizers and cattle manure, and application of a high amount of cattle manure alone. Chemical fertilizers, cattle manure, and the combined application of chemical fertilizers and cattle manure significantly increased maize yield by 61.81–86.14%, 121.0%, and 114.5–125.5%, and increased WP by 59.4–84.9%, 119.4%, and 111.9–126.5%, respectively, compared to the unfertilized control. The combined application of chemical fertilizers and cattle manure resulted in optimal maize yield and WP, while also substantially reducing the coefficient of variation in maize yield (by 19.9–25.9% compared to the control) under interannual precipitation fluctuations. Compared with the no fertilization treatment, the average increase in maize yield peaks in very wet years, while WP reaches its highest level in relatively dry years. Maize yield was significantly positively related to SOC, WP, and water consumption during growth (p < 0.01). SOC was also significantly positively correlated with WP (p < 0.01). For every unit increase in SOC, the WP increased by 0.3955 kg ha−1 mm−1. In summary, the integrated application of organic and inorganic fertilizers is a proven strategy to enhance crop productivity and resilience, while concurrently improving WP and SOC. This synergistic approach represents a cornerstone for climate-resilient and sustainable dryland agriculture.

1. Introduction

Insufficient water resources and with low soil fertility are the primary factors limiting agricultural development in arid regions worldwide. In the Loess Plateau of northern China, precipitation is the sole water resource for dryland farming [1]. However, serious water shortages severely restrict agricultural production in arid and semi-arid regions due to uneven temporal and spatial distribution of precipitation as well as seasonal moisture deficits caused by the mismatch between precipitation periods and crop water requirements [2,3]. The objective of agriculture in these regions is to maximize soil moisture retention, minimize ineffective evaporation, and make full use of limited precipitation to support crop growth.
Shanxi Province is located in the eastern Loess Plateau, where the most of the area is covered by thick loess, with dryland areas accounting for 79.4% of the total arable land, making it a typical semi-arid farming region in northern China. Maize (Zea mays L.) is one of the main staple crops in the arid regions of Shanxi Province. In 2021, the maize planting area in the province reached 1.8 × 10⁶ ha, accounting for 56.5% of the total grain growing area [4]. The total maize production was approximately 8.0 × 10⁹ kg, contributing two-thirds of the province’s total grain yield. The average maize yield in the cinnamon soil farmlands of Shanxi Province was 5250 kg∙ha−1, with high-yield records reaching 18,000 kg∙ha−1. The primary reasons for such significant yield differences are variations in water and fertilizer availability.
Fertilization, as a crucial agricultural practice, significantly impacts crop yield and water productivity (WP) of plants in dry land. Previous research has shown that the application of chemical fertilizer can improve crop yield and WP [5,6,7,8,9]. However, the long-term application of chemical fertilizers decreases soil organic carbon (SOC) and water content, and can lead to issues such as uneven nutrient distribution, soil acidification, and compaction [5,10]. Consequently, this practice is detrimental to sustainable agricultural development. Therefore, fertilization strategies need to be optimized to improve soil fertility and WP in drylands. Organic fertilizers, such as livestock manure, compost, and green manure, have greater potential to address and balance these issues when applied together with chemical fertilizers in different types of soil and farming systems [9,11,12,13,14]. Numerous studies have demonstrated that the organic fertilizer application can improve soil conditions from physical, chemical, and biological aspects, thereby enhancing crop yields [15,16]. Moreover, organic fertilizer application can increase soil aggregate stability and improve water holding capacity [14,17,18,19], while decreasing soil bulk density and penetration resistance [5,10]. Organic fertilizer application can also improve soil organic matter and fertility status [5,10,20], adjust soil pH and increase the availability of micronutrients [21]. Furthermore, the combined application of organic and inorganic fertilizers influences the total microbial biomass, diversity and community structure [20,22,23], and soil enzymes activity [14,24,25,26]. Optimizing of these soil properties ultimately leads to an increase in crop yields and WP.
Cinnamon soil is the primary agricultural soil type in Shanxi province. Currently, most research on the effects of fertilization on maize yield and WP in this region is based on short-term experiments, with limited studies on crop yield and WP under varying long-term fertilization strategies. The results of long-term field experiments that integrate water and fertilizer management will improve our understanding of the relationship between WP, fertilization, and crop yield. Although our research group roughly divided 2019–2021 into three precipitation year categories and published a paper based on the data of this stage [4], the long-term average or cumulative data is more conducive to describing the overall picture of the field experiment. To test the hypothesis that combined organic–inorganic fertilization enhances maize yield and WP across different precipitation year types, albeit to varying extents, we analyzed a 30-year dataset from a dryland spring maize system. The objectives of this study were: (1) to investigate the response of maize yield and WP to different long-term fertilization strategies under different precipitation patterns; and (2) to find an optimal fertilization strategy for stable maize yields in drylands.

2. Materials and Methods

2.1. Experimental Site

The experimental site is located at the National Agricultural and Environmental Observation Station (37°58′23″ N 113°06′38″ E, altitude 1130 m) in Shouyang, Shanxi Province, China. This area is semi-humid drought-prone, with an average annual precipitation of 518.3 mm and evapotranspiration of 1600.0 mm. The soil at the site is cinnamon soil, classified as Hapli-Ustic Cambisol in the World Reference Base for Soil Resources (WRB) [27,28]. The texture of the soil is light soil, mainly composed of sand and silt, and has a total porosity of about 50%. The physical properties of the soil profile before the experiment are shown in Table 1. The main chemical properties of the 0–20 cm soil layer before the experiment in 1992 were as follows: soil organic matter, 23.5 g kg−1; total nitrogen, 1.07 g kg−1; total phosphorus, 0.79 g kg−1; alkali-hydrolyzable nitrogen, 106.4 mg kg−1; available phosphorus, 4.97 mg kg−1; available potassium, 117.2 mg kg−1; and pH, 8.4.

2.2. Experimental Design

The experiment included 18 treatments, including three factors and four levels of nitrogen, phosphorus and cattle manure; a control without fertilizer; and a treatment with high amount of cattle manure. Experimental plots were established in a randomized arrangement. In this study, 9 treatments were selected for analysis: a control without fertilizer (N0P0M0), four levels of chemical fertilizer alone (N1P1M0, N2P2M0, N3P3M0, N4P4M0), three combinations of chemical fertilizer and cattle manure (N2P1M1, N3P2M3, N4P2M2), and a high cattle manure level (N0P0M6). The specific amounts of fertilizer and manure are shown in Table 2. Urea (46% N) was used as the nitrogen fertilizer, while superphosphate (16% P2O5) served as the phosphorus source. The cattle manure was fully decomposed and contained 90.5–127.3 g·kg−1 of organic matter, 3.93–4.97 g·kg−1 of total nitrogen, 1.37–1.46 g·kg−1 of total phosphorus, and 14.1–34.3 g·kg−1 of total potassium. Each treatment had three replicate plots of 66.7 m2. The planting density was 45,000–52,000 plants ha−1 from 1992 to 2011, and 66,000 plants ha−1 from 2012 to 2021. The planting time was from 15 April to 30 April, and the harvest time was from 20 September to 10 October. During the experimental period, precipitation data were collected using a rain gauge positioned within the experimental field. The precipitation during maize growth (May–September) from 1992 to 2021 is shown in Figure 1.
From 1952 to 1991, the average annual precipitation was 501.1 mm. From 1992 to 2021, the average annual precipitation decreased by 26.2 mm. The precipitation patterns were divided according to the dryness index (DI) [29]:
DI = (p − m)/σ,
where DI is the dryness index, p is the precipitation of the current year (mm), m is the average annual precipitation (mm), and σ is the variance of average precipitation over many years. Each year was categorized based on precipitation level: DI ≥ 1.0 is very wet, 0.35–1.0 is relatively wet, −0.35–0.35 is normal, −0.35–−1.0 is relatively dry, and ≤−1.0 is very dry. This classification method differs from a previous paper published by our research group based on data from 2019 to 2021 [4]. This method is more detailed and the data is more comprehensive. The 30-year precipitation patterns in the experimental area are shown in Table 3.

2.3. Sample Collection and Analysis

2.3.1. Maize Yield

At the harvesting stage from 1992 to 2021, twenty randomly selected ears from each treatment were weighed, oven-dried, and threshed. The grain yield per treatment was then calculated based on the measured moisture content and kernel percentage [30].

2.3.2. Soil Bulk Density

Soil bulk density was measured using a 100 cm3 steel cylinder [31].

2.3.3. Soil Water Storage Before Sowing and After Harvesting and Water Consumption During the Growth Period

Every year before sowing and after harvesting, soil was collected with an auger from 0 to 200 cm, with every 20 cm regarded as one layer. The oven drying method was used to measure soil moisture content. Soil water storage at a depth of 200 cm and maize water consumption during the growth period were calculated as follows [32]:
S W S = i = 1 n W i × D i × H i × 10 / 100 ,
ET = W1 − W2 + P,
where SWS is the soil water storage (mm), Wi is the soil moisture content of the i layer (%), Di is the soil bulk density of the i layer (g cm−3), Hi is the depth of the soil layer (cm); n is the number of soil layers (n = 10), ET is the maize water consumption during the growth period (mm), W1 is the soil water storage before sowing (mm), W2 is the soil water storage after harvesting (mm), P is the precipitation of the current year.

2.3.4. Maize Water Productivity (WP)

Maize WP was calculated as follows [33]:
WP = Y/ET,
where WP is maize water productivity (kg ha−1 mm−1), Y is maize yield (kg ha−1), and ET is the maize water consumption during the growth period (mm).

2.3.5. Soil Organic Carbon (SOC)

Soil samples from the 0–20 cm layer were collected with an auger after harvesting in 1992, 1996, 2001, 2006, 2011, 2016 and 2021. After air drying and grounding, SOC was measured using the potassium dichromate volumetric method [31].

2.4. Statistical Analysis

One-way analysis of variance (ANOVA) followed by the least significant difference (LSD) and Duncan’s test were performed using IBM Statistics SPSS 26.0 at a significance level of p < 0.05. Multi-factor analysis of variance was used to evaluate the effects of fertilization and precipitation on maize yield and water use efficiency using SPSS. Pearson’s correlation analysis was employed to evaluate the relationships among yield, SOC, WP, and water consumption for the years 1992, 1996, 2001, 2006, 2011, 2016 and 2021. Linear regression analysis was used to determine the contribution of SOC to WP. Figures were plotted using Origin 2021.

3. Results

3.1. Effect of Fertilization on Maize Yield

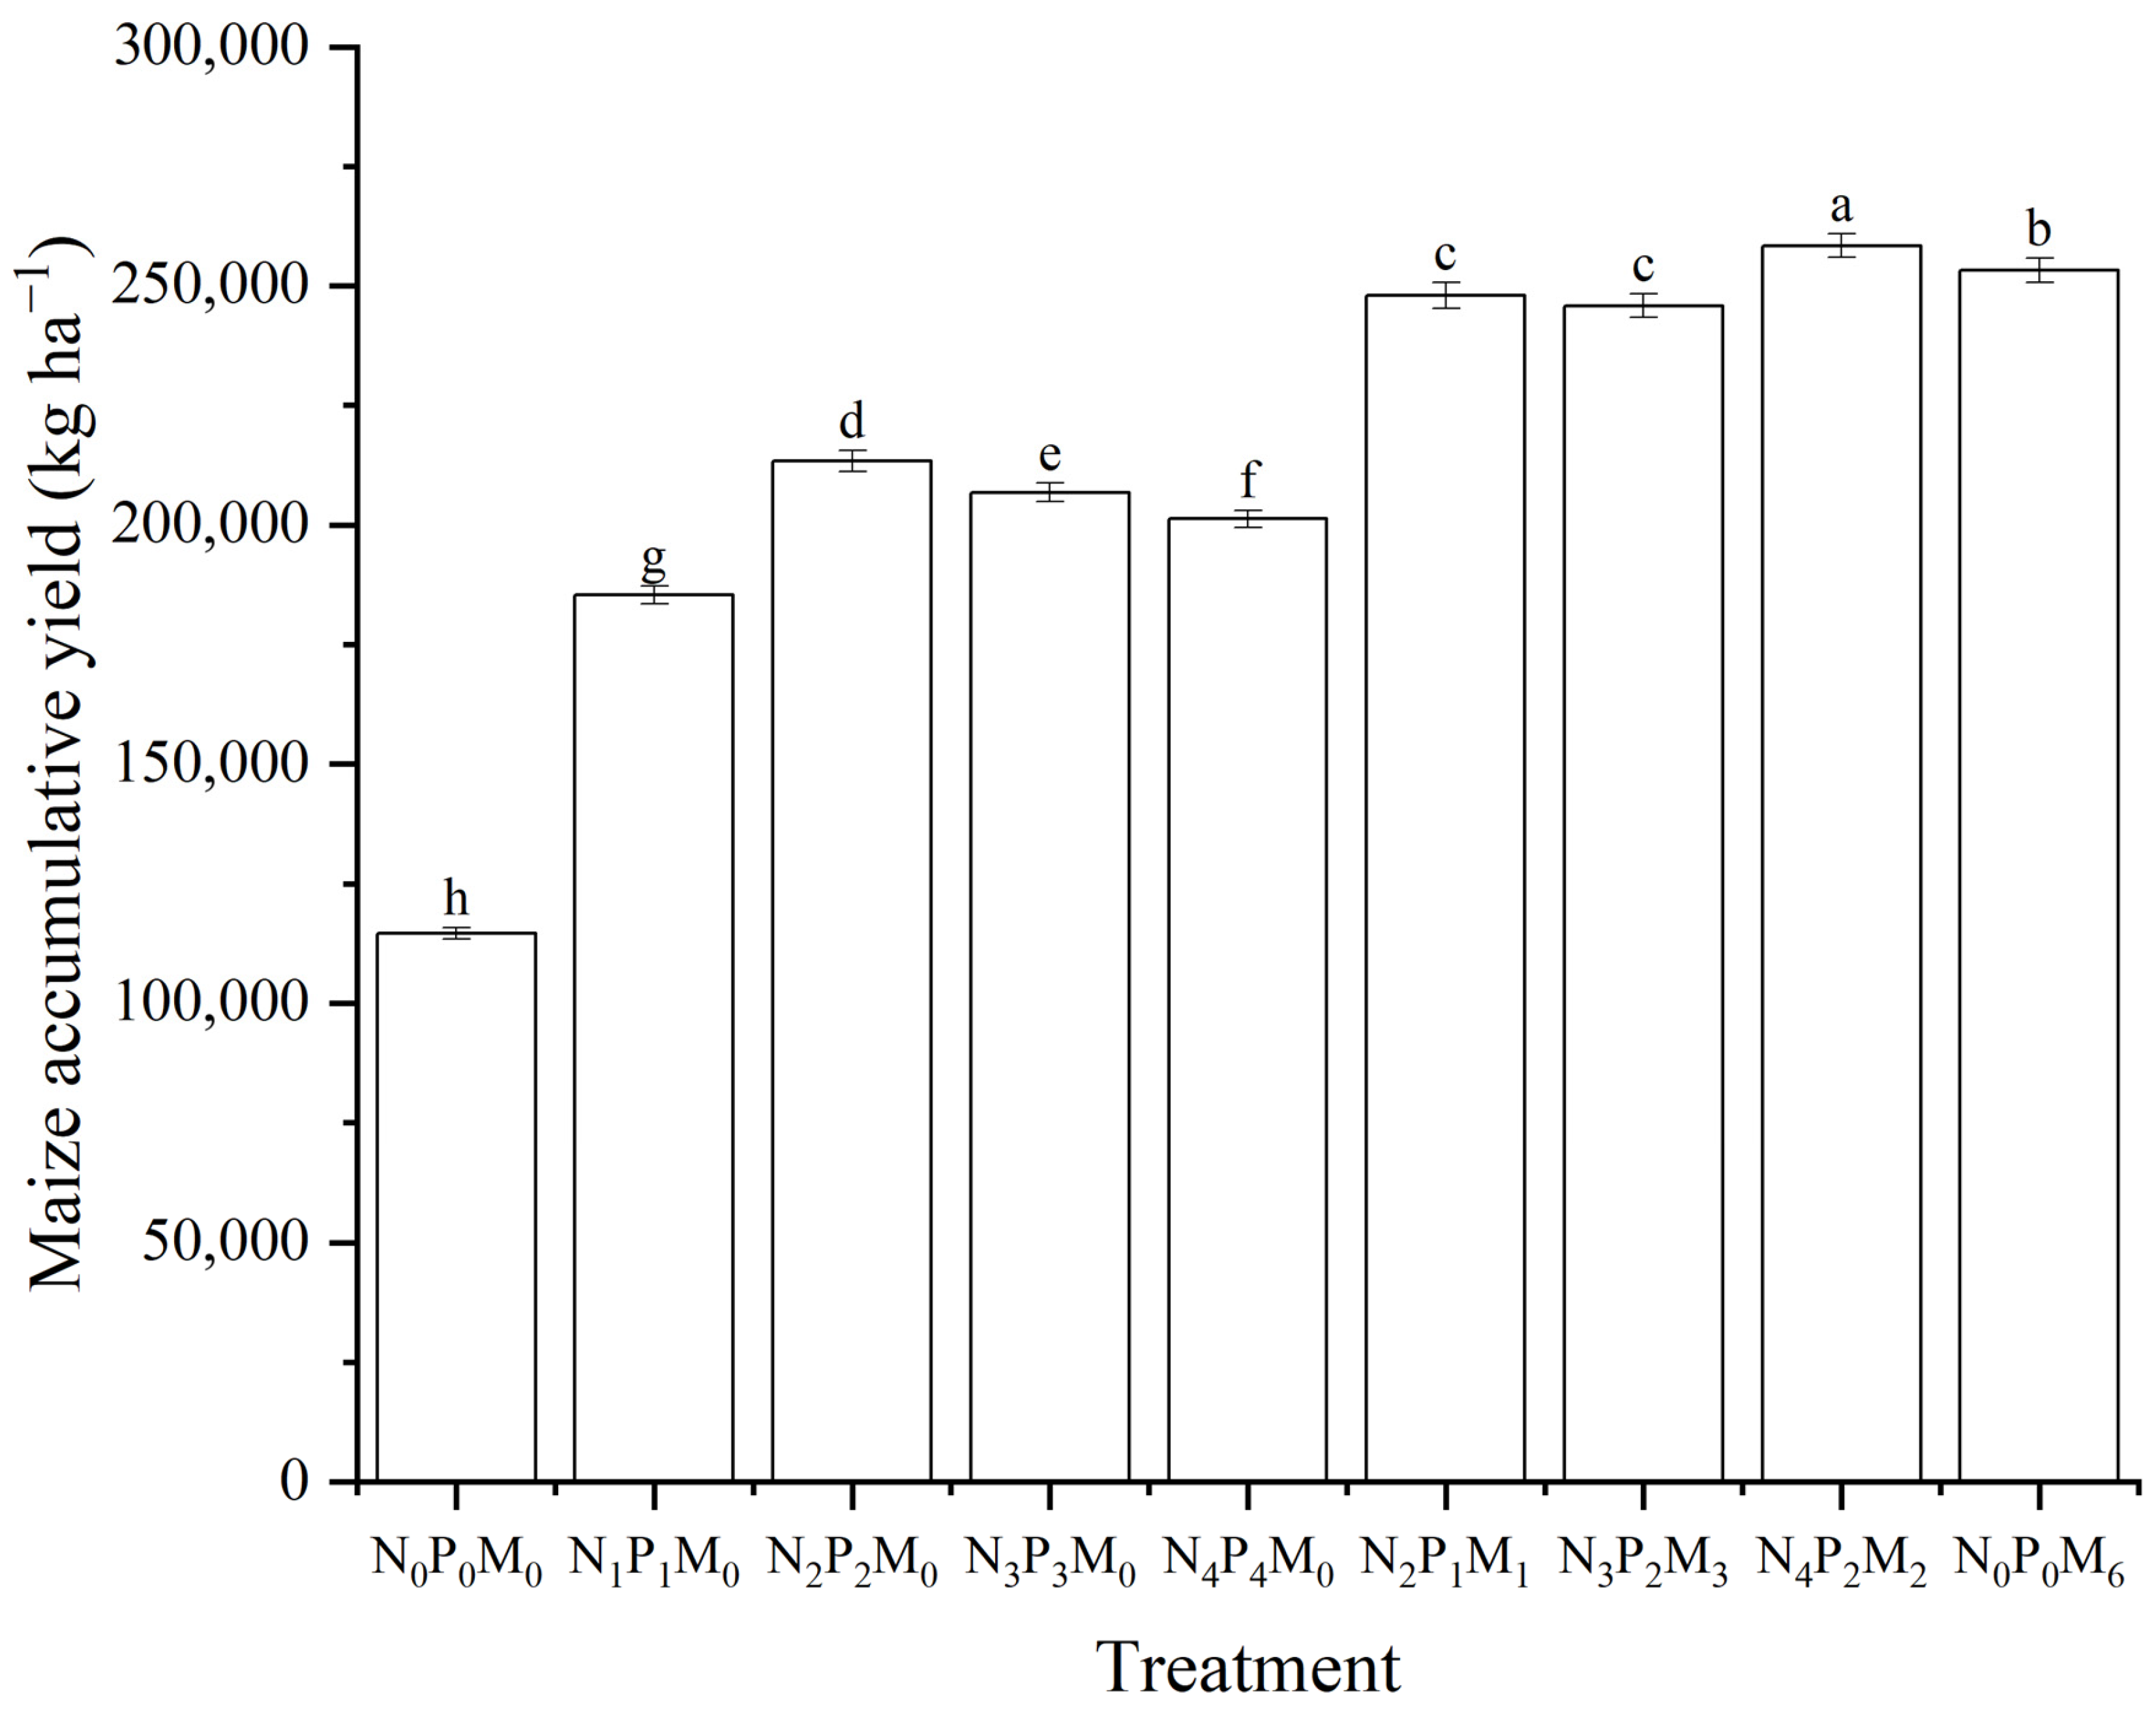
As shown in Figure 2, the accumulative yields of maize from 1992 to 2021 (30 years) ranged from 114,575 to 258,313 kg ha−1, while the average yields of the 30 years ranged from 3819 to 8610 kg ha−1. Compared with N0P0M0, application of chemical fertilizer alone resulted in significantly higher accumulative yields (61.81–86.14% higher). The accumulative yields first increased and then decreased with increasing chemical fertilizer, peaking in N2P2M0. When cattle manure was applied together with chemical fertilizer, the yields were higher than those with chemical fertilizer alone. Compared with N0P0M0, the combination of chemical fertilizer and cattle manure resulted in significantly higher accumulative yields (114.5–125.5%) and peaked in N4P2M2. Although the accumulative yield of N0P0M6 was significantly higher than that of N0P0M0 by 121.0%, it was significantly lower than that of N4P2M2 by 2.0%. From 1992 to 2011, the cumulative total maize yield of the nine treatments peaked in 2007 (81,662.5 kg·ha−1) and was lowest in 1999 (25,228.0 kg·ha−1). From 2012 to 2021, the cumulative total production peaked in 2012 (98,204.7 kg·ha−1) and was lowest in 2019 (55,188.7 kg·ha−1).
The effect of fertilization strategy on maize yield was further examined under each precipitation pattern, and the results were similar to those for the cumulative yield (Table 4). Overall, the N4P2M2 treatment produced the highest yield, except in very wet years, when the N0P0M6 treatment resulted in the highest yield. The average increasing rates of maize yield due to fertilizer under the different precipitation patterns followed the order: very wet year > relatively dry year > normal year > relatively wet year > very dry year.
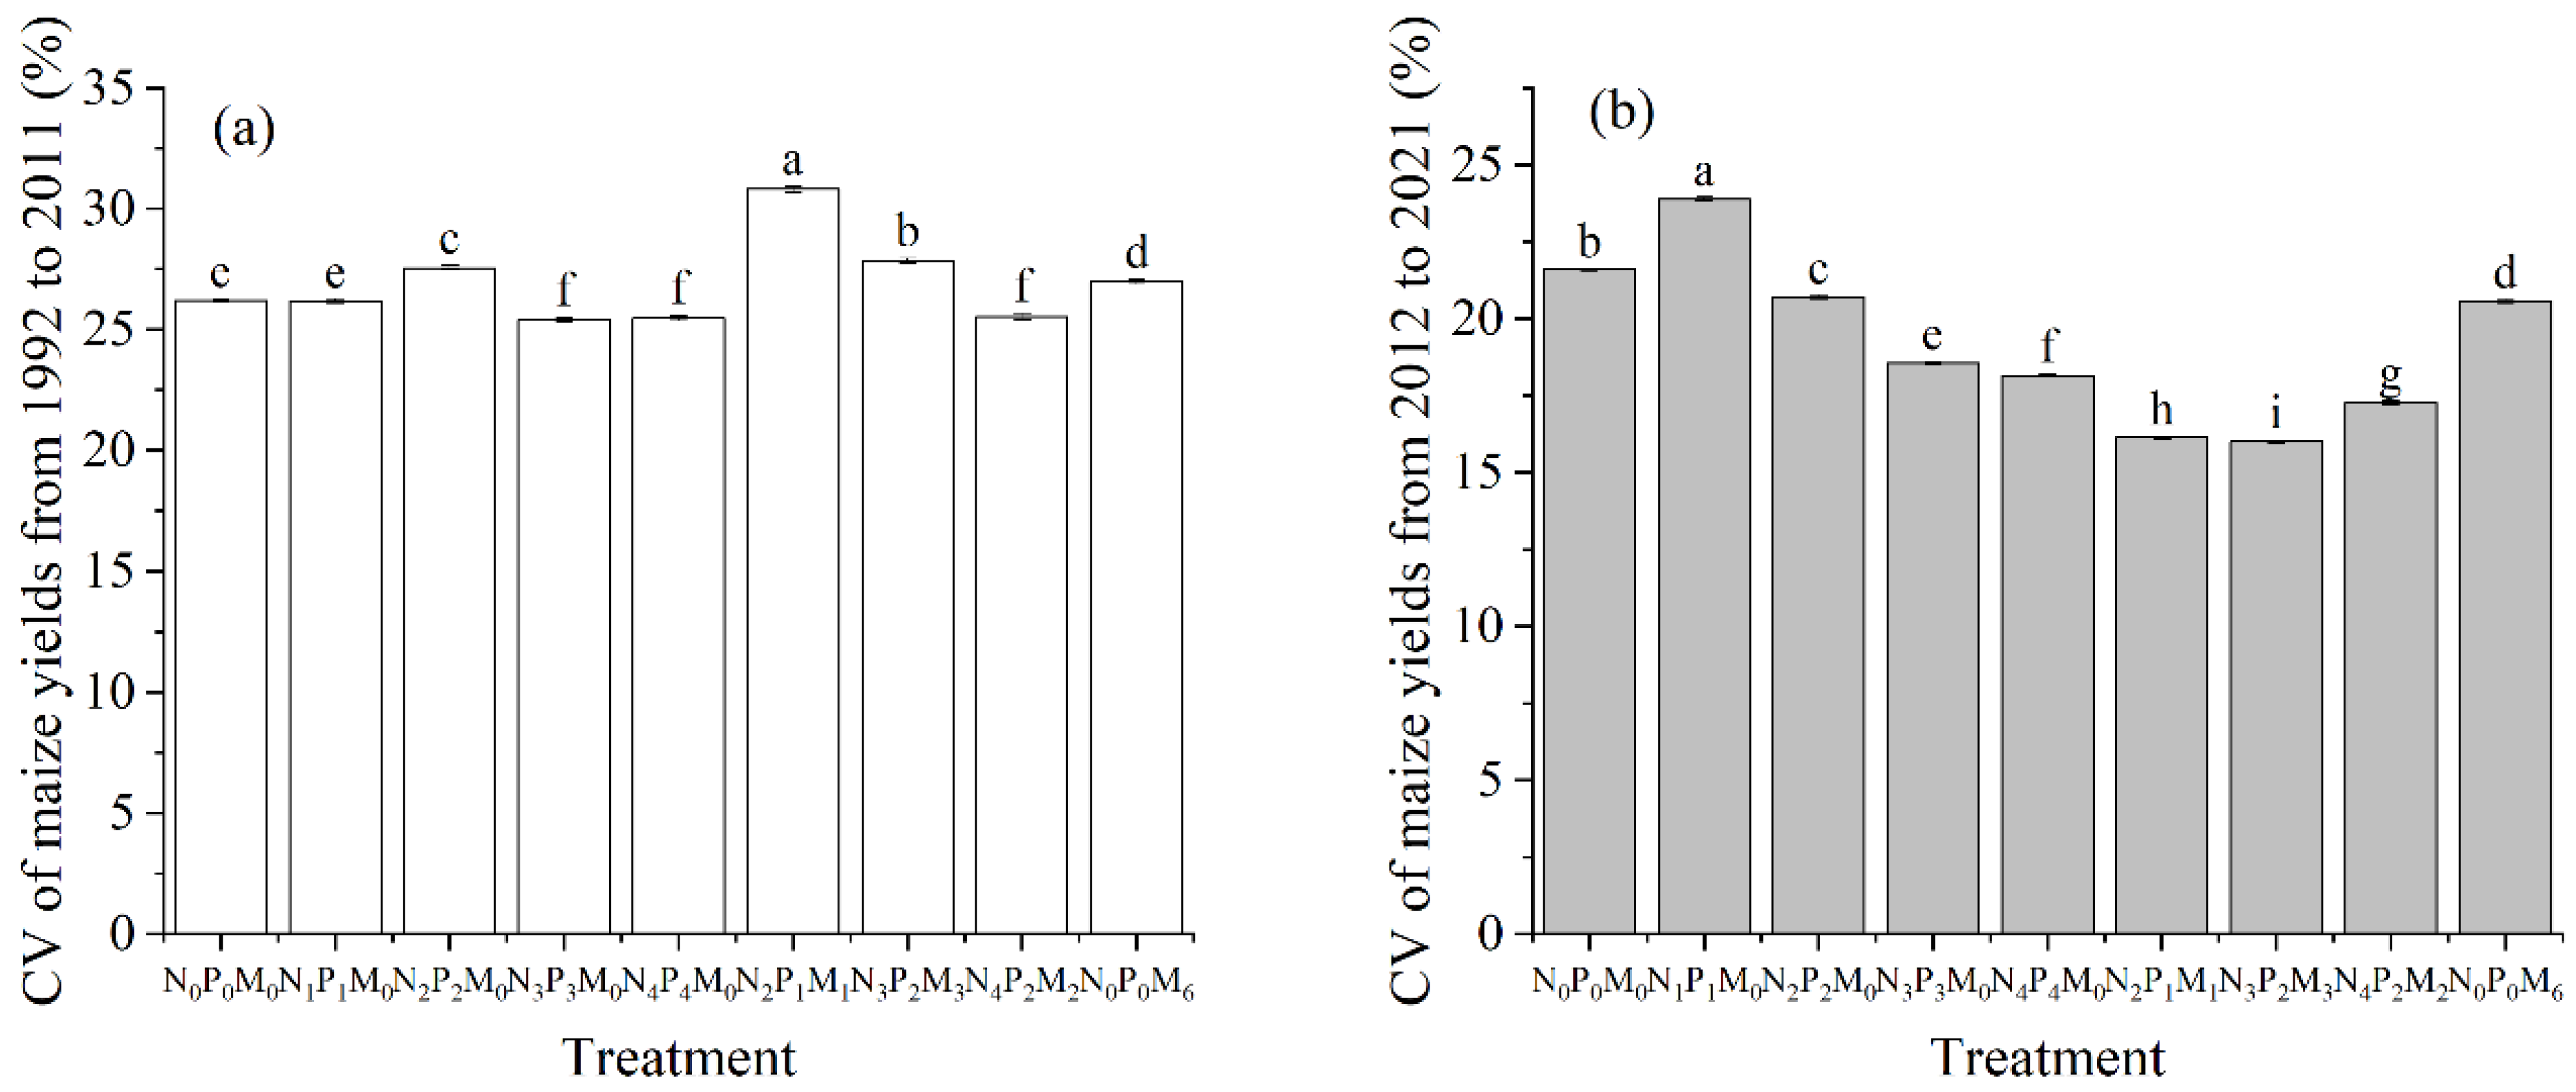
Since planting density increased in 2012, the interannual coefficient variation (CV) of yield was analyzed into two periods: 1992–2011 and 2012–2021. As shown in Figure 3, the CV from 2012 to 2021 (16.1–23.9%) was much lower than from 1992 to 2011 (25.4–30.8%). From 2012 to 2021, the CV of maize yield was significantly reduced under different fertilization regimes: by 4.1–15.9% with chemical fertilizer alone, by 19.9–25.9% with the combined application of chemical fertilizer and cattle manure, and by 4.7% with the application of a high rate of cattle manure.

3.2. Effect of Fertilization on WP

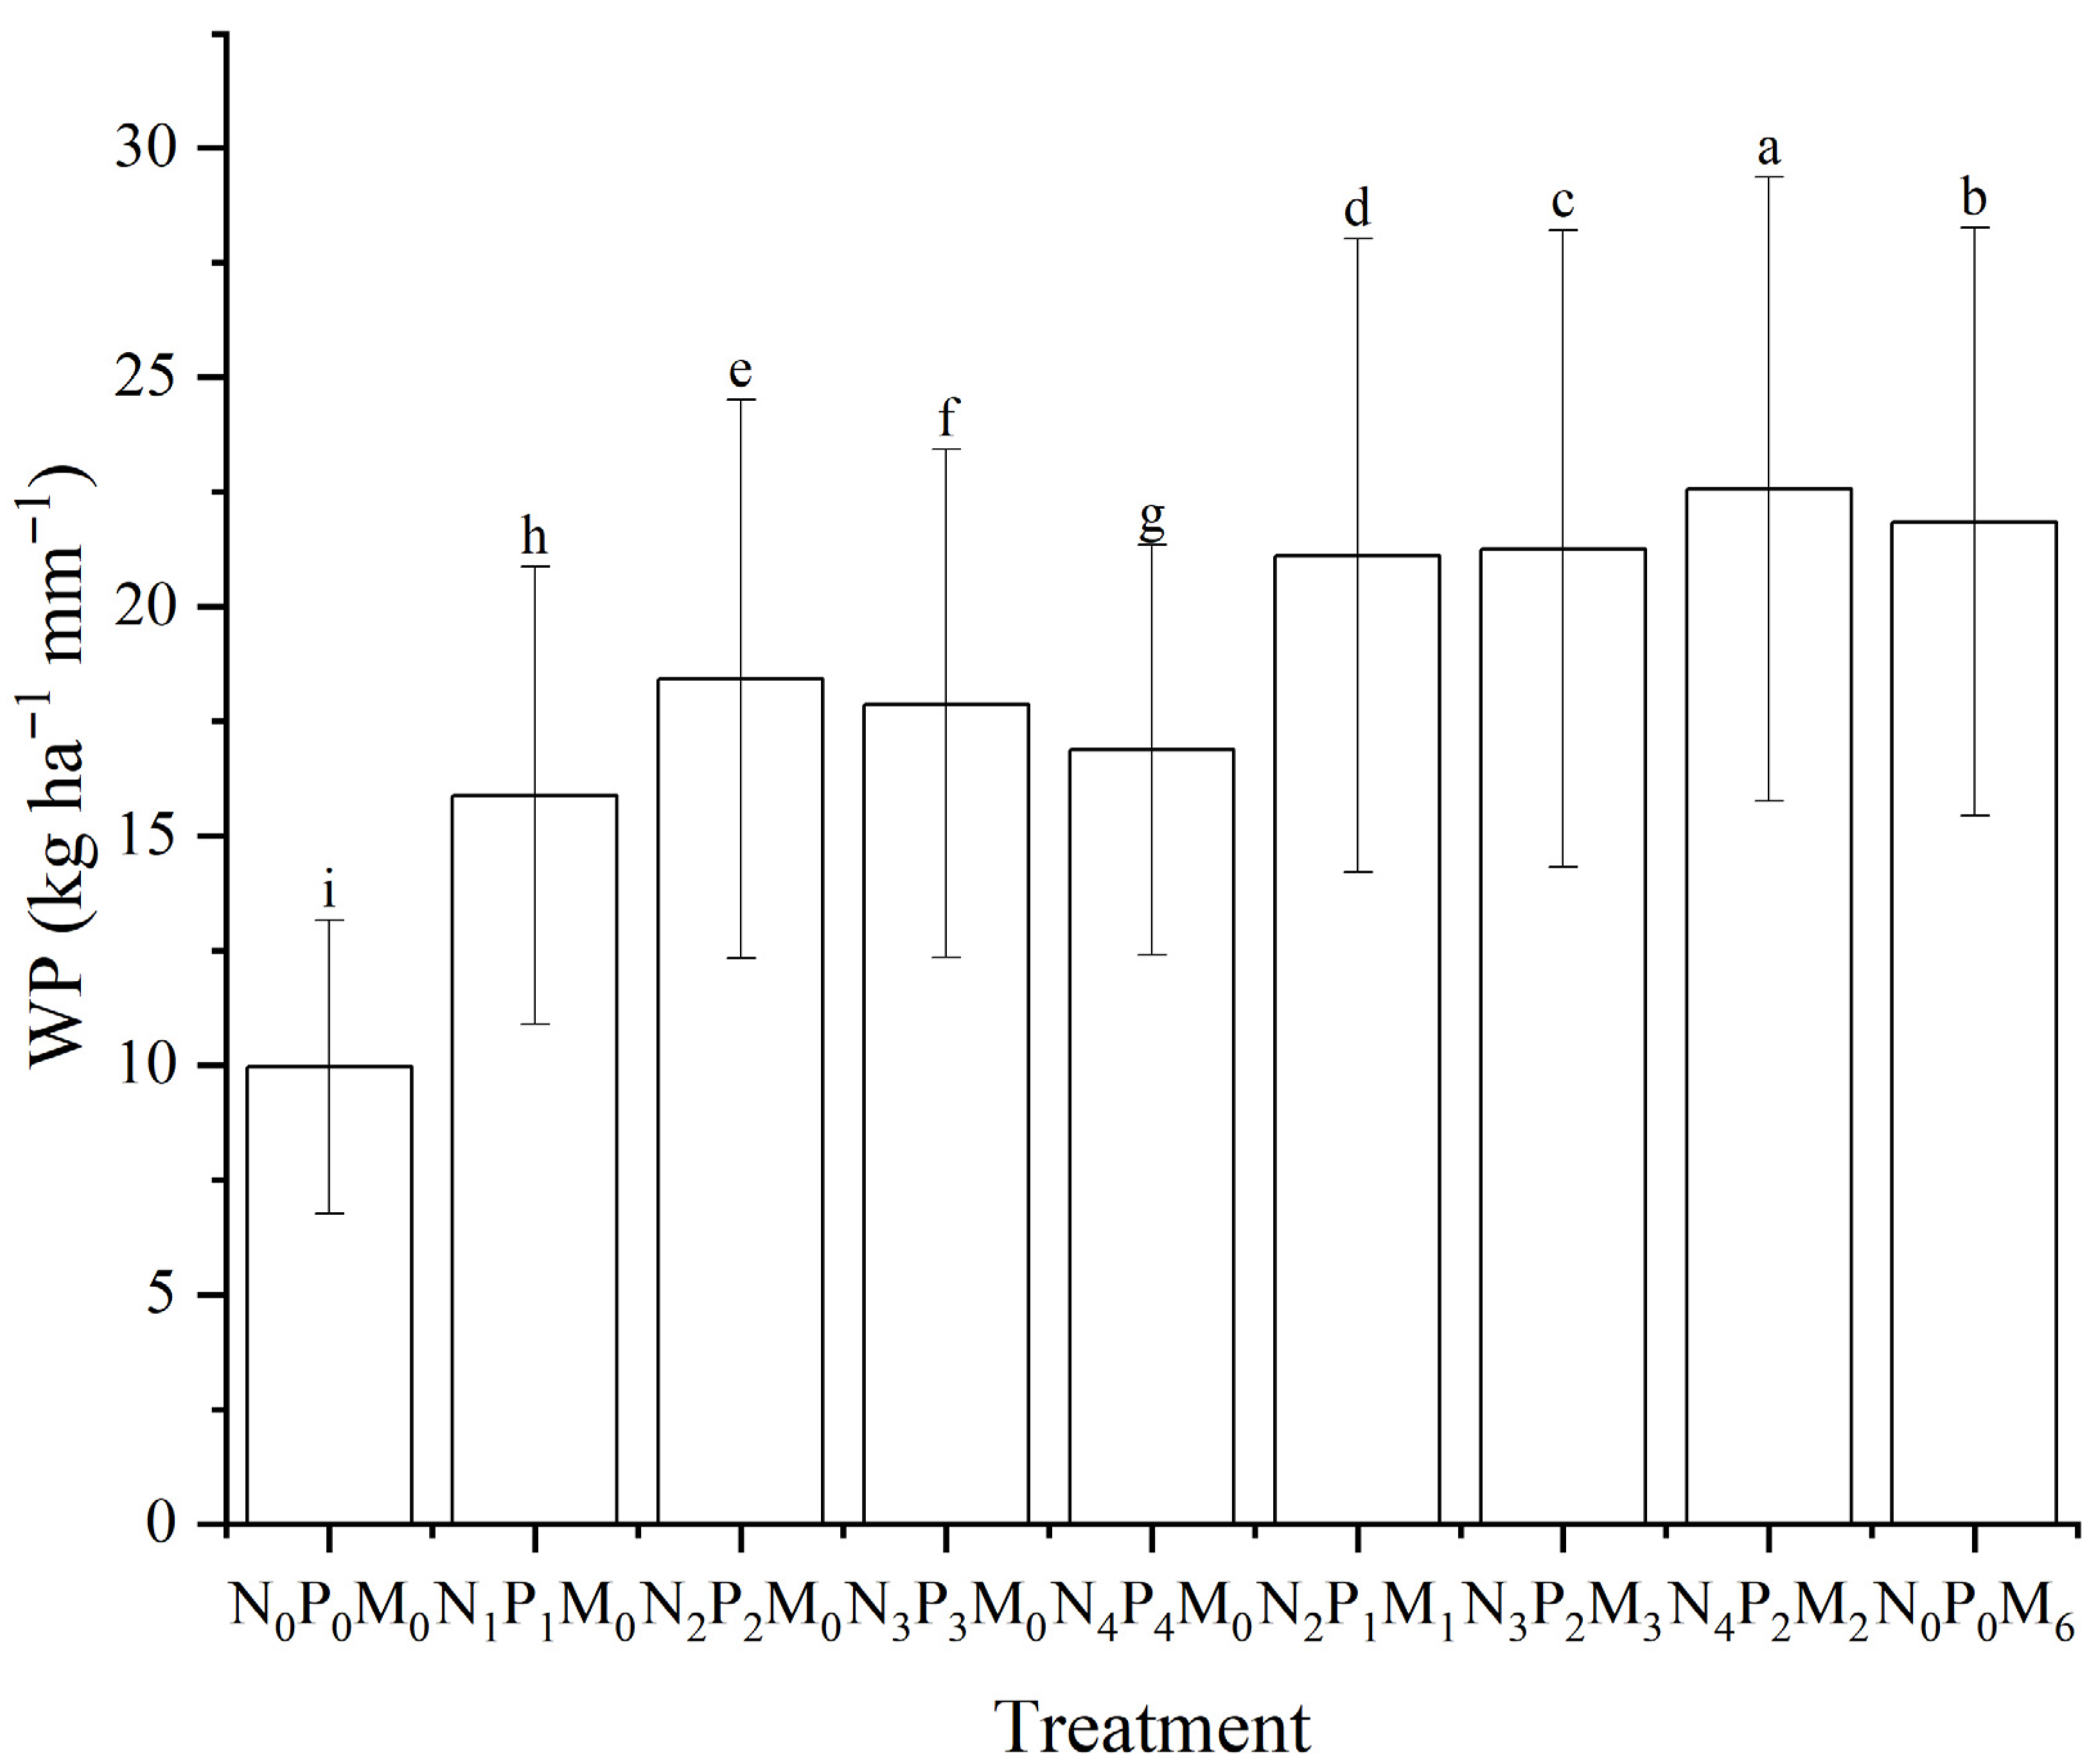
As shown in Figure 4, the 30-year average WP ranged from 9.96 to 22.56 kg ha−1 mm−1. Fertilization treatments significantly affected the average WP. Compared with N0P0M0, chemical fertilizer resulted in significantly higher WP (by 59.4–84.9%). WP first increased and then decreased with increasing chemical fertilizer, peaking in N2P2M0 at 18.42 kg ha−1 mm−1. Compared with chemical fertilizer alone, the combination of chemical fertilizer and cattle manure resulted in significantly higher average WP (14.6–22.5%) and the highest WP (22.56 kg ha−1 mm−1) occurred in the N4P2M2 treatment. The WP in treatment N0P0M6 was significantly lower than that in N4P2M2 by 3.1%, while it was significantly higher than in the other treatments.
Fertilization significantly increased WP in all precipitation patterns (Table 5), with the trends in WP for each precipitation pattern being similar to that of the average WP over the 30 years. The increasing rate of WP compared with the no fertilizer control was the highest in the N4P2M2 treatment except in very wet years, in which case it was highest in N0P0M6. The rate of increase in WP with fertilizer under different precipitation patterns followed the order: relatively dry year > very wet year > normal year > relatively wet year > very dry year.

3.3. Effect of Fertilization and Precipitation on Yield and WP

A multi-factor analysis of variance was employed to investigate the effects of fertilization, precipitation and their interaction on maize yield and WP (Table 6). Both fertilization and precipitation significantly affected yield (p < 0.001), with precipitation having a greater effect than fertilization on yield (F-value = 13.180 for fertilization and 17.764 for precipitation, respectively). In contrast, fertilization had a greater effect than precipitation on WP (F-value = 10.966 for fertilization and 5.888 and precipitation, respectively; p < 0.001). There was no significant interaction between fertilization and precipitation on yield and WP.

3.4. Effect of Fertilization on SOC

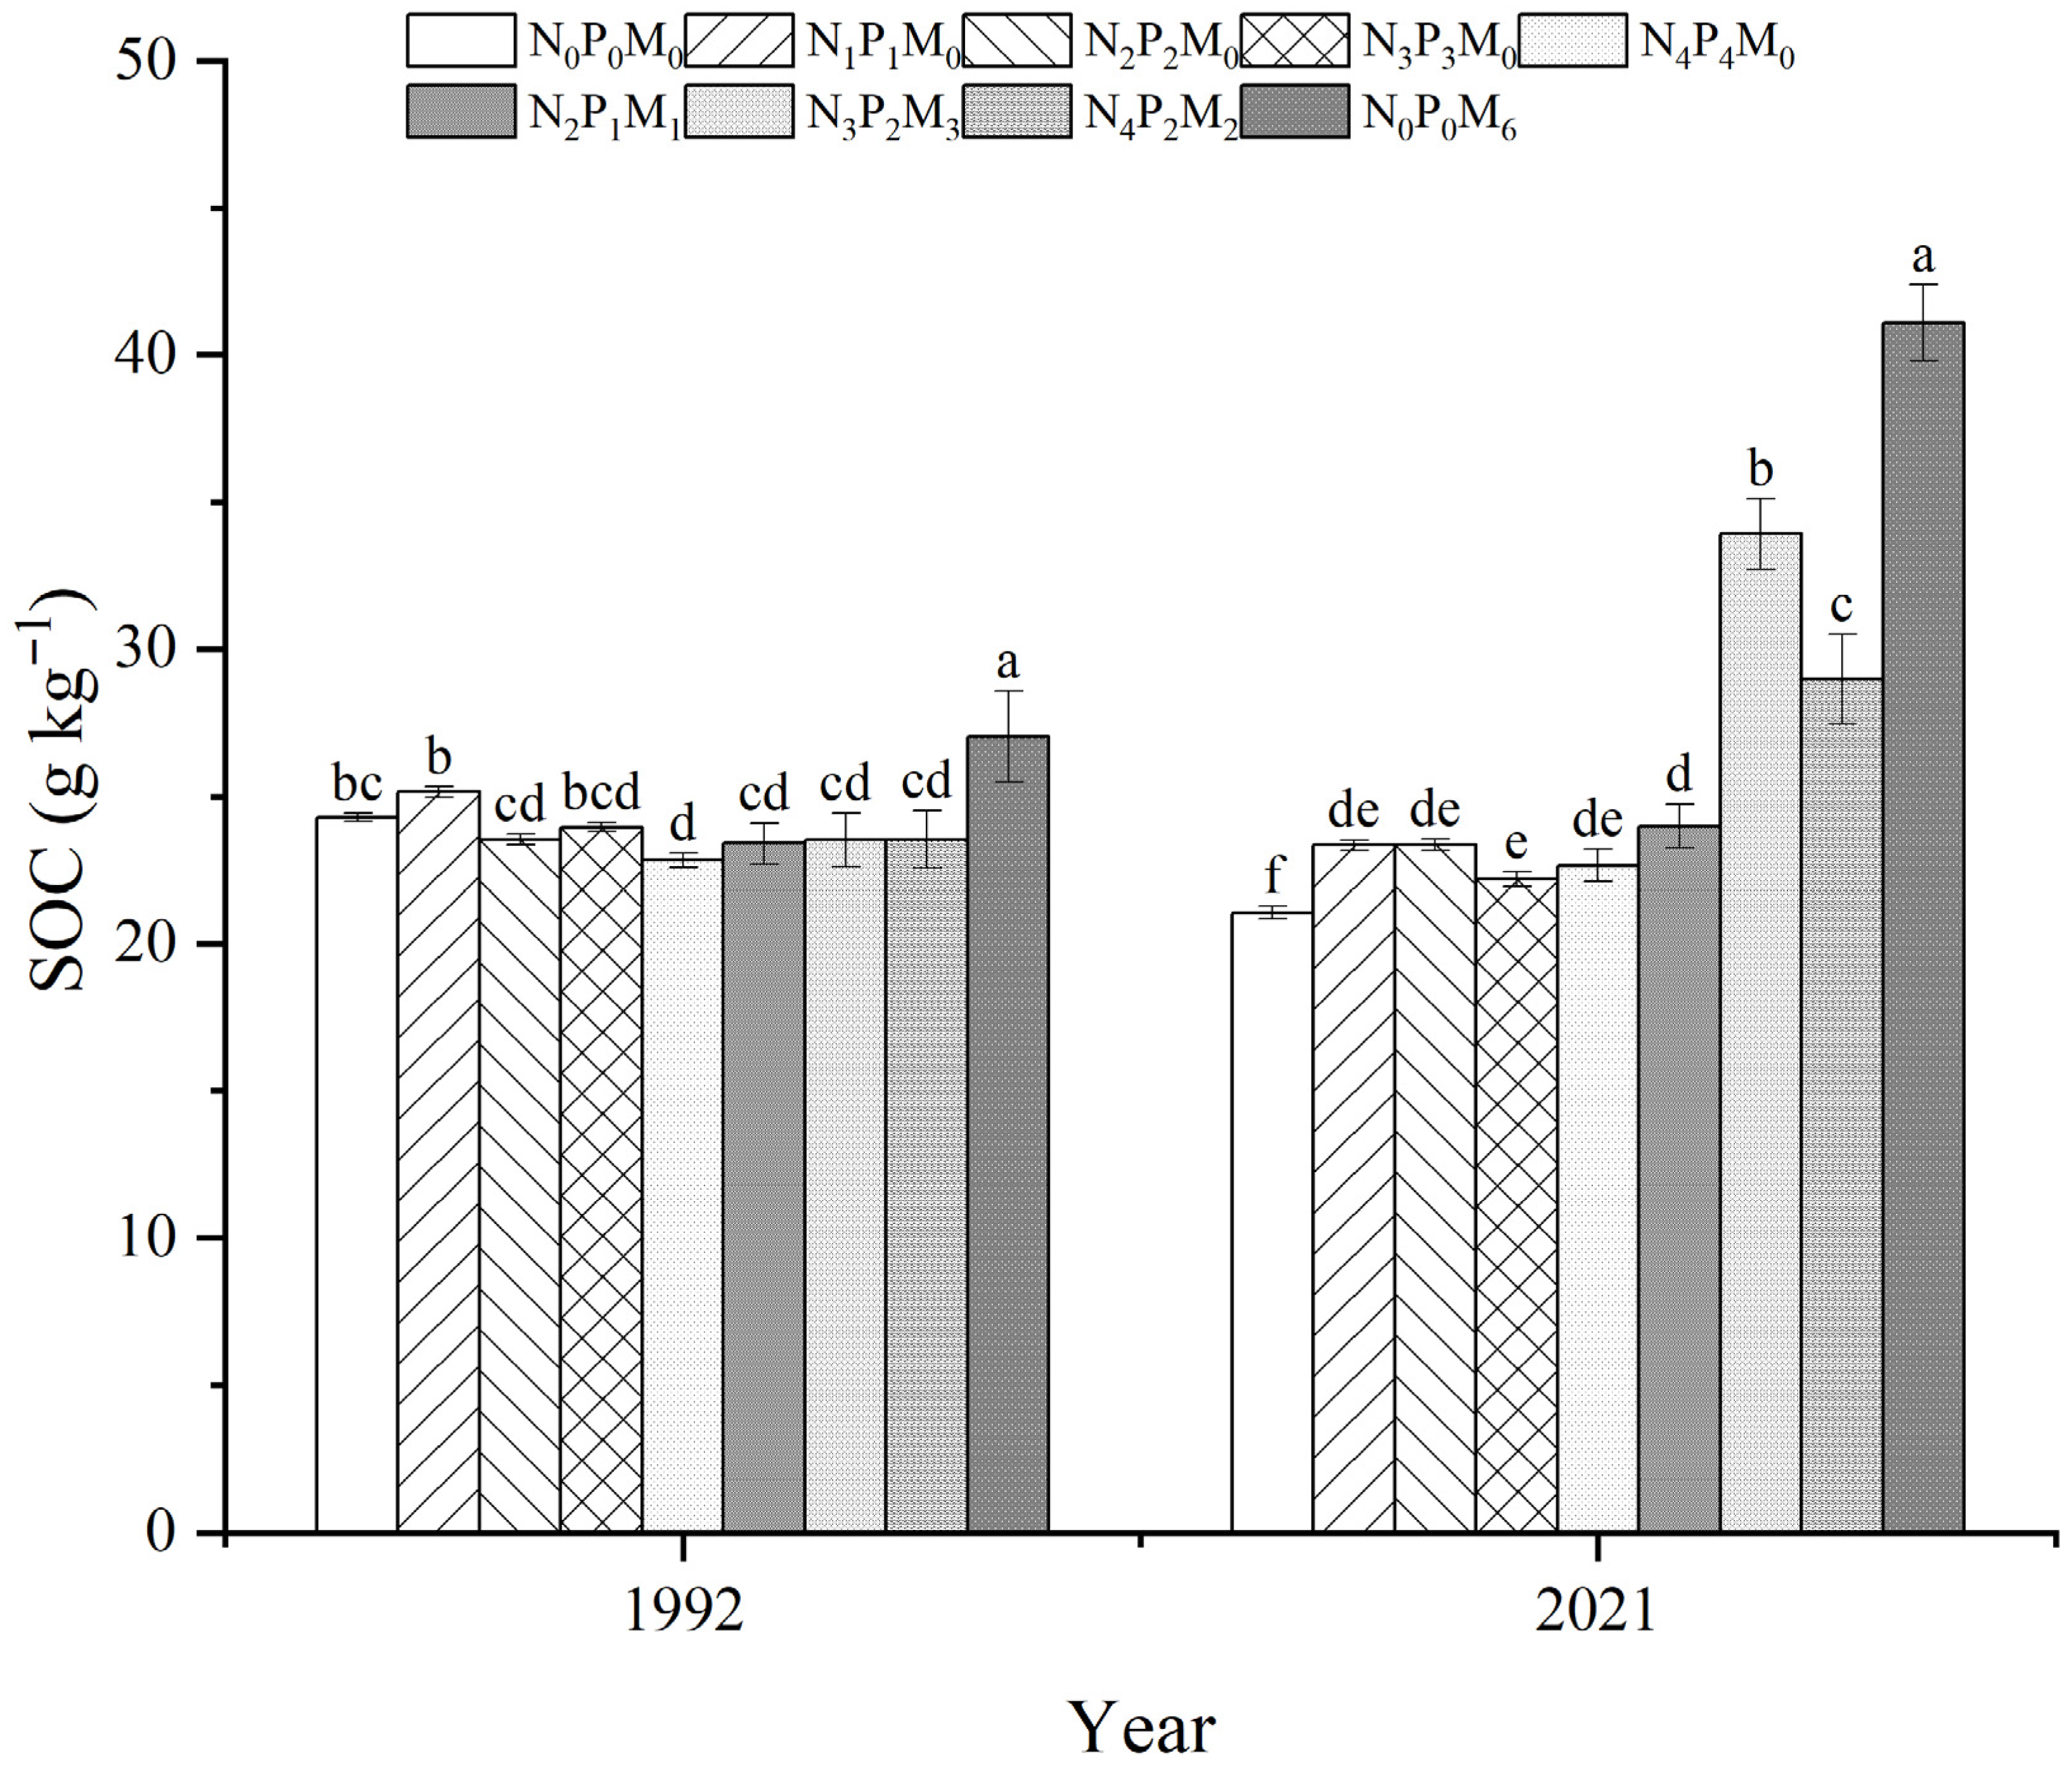
The SOC content under different treatments in 1992 and 2021 is shown in Figure 5. The SOC content in the N0P0M0 treatment was 13.4% lower in 2021 than in 1992, while in the chemical fertilizer treatments was 0.7–7.3% lower in 2021 than in 1992. In contrast, the SOC content in the combined chemical fertilizer and cattle manure treatments was 2.3–44.1% higher in 2021 than in 1992. The N0P0M6 treatment resulted in the highest SOC content (41.09 g kg−1), which was higher than that in 1992 by 52.0%. In 2021, treatments with cattle manure generally had higher SOC contents than those with chemical fertilizers alone. N3P2M3 and N4P2M2 had significantly higher SOC than N2P2M0 by 45.2% and 24.0%, respectively. The N0P0M6 treatment had 75.9% higher SOC than the N2P2M0 treatment.

3.5. Correlations Among Maize Yield, WP, SOC, and Water Consumption During Growth

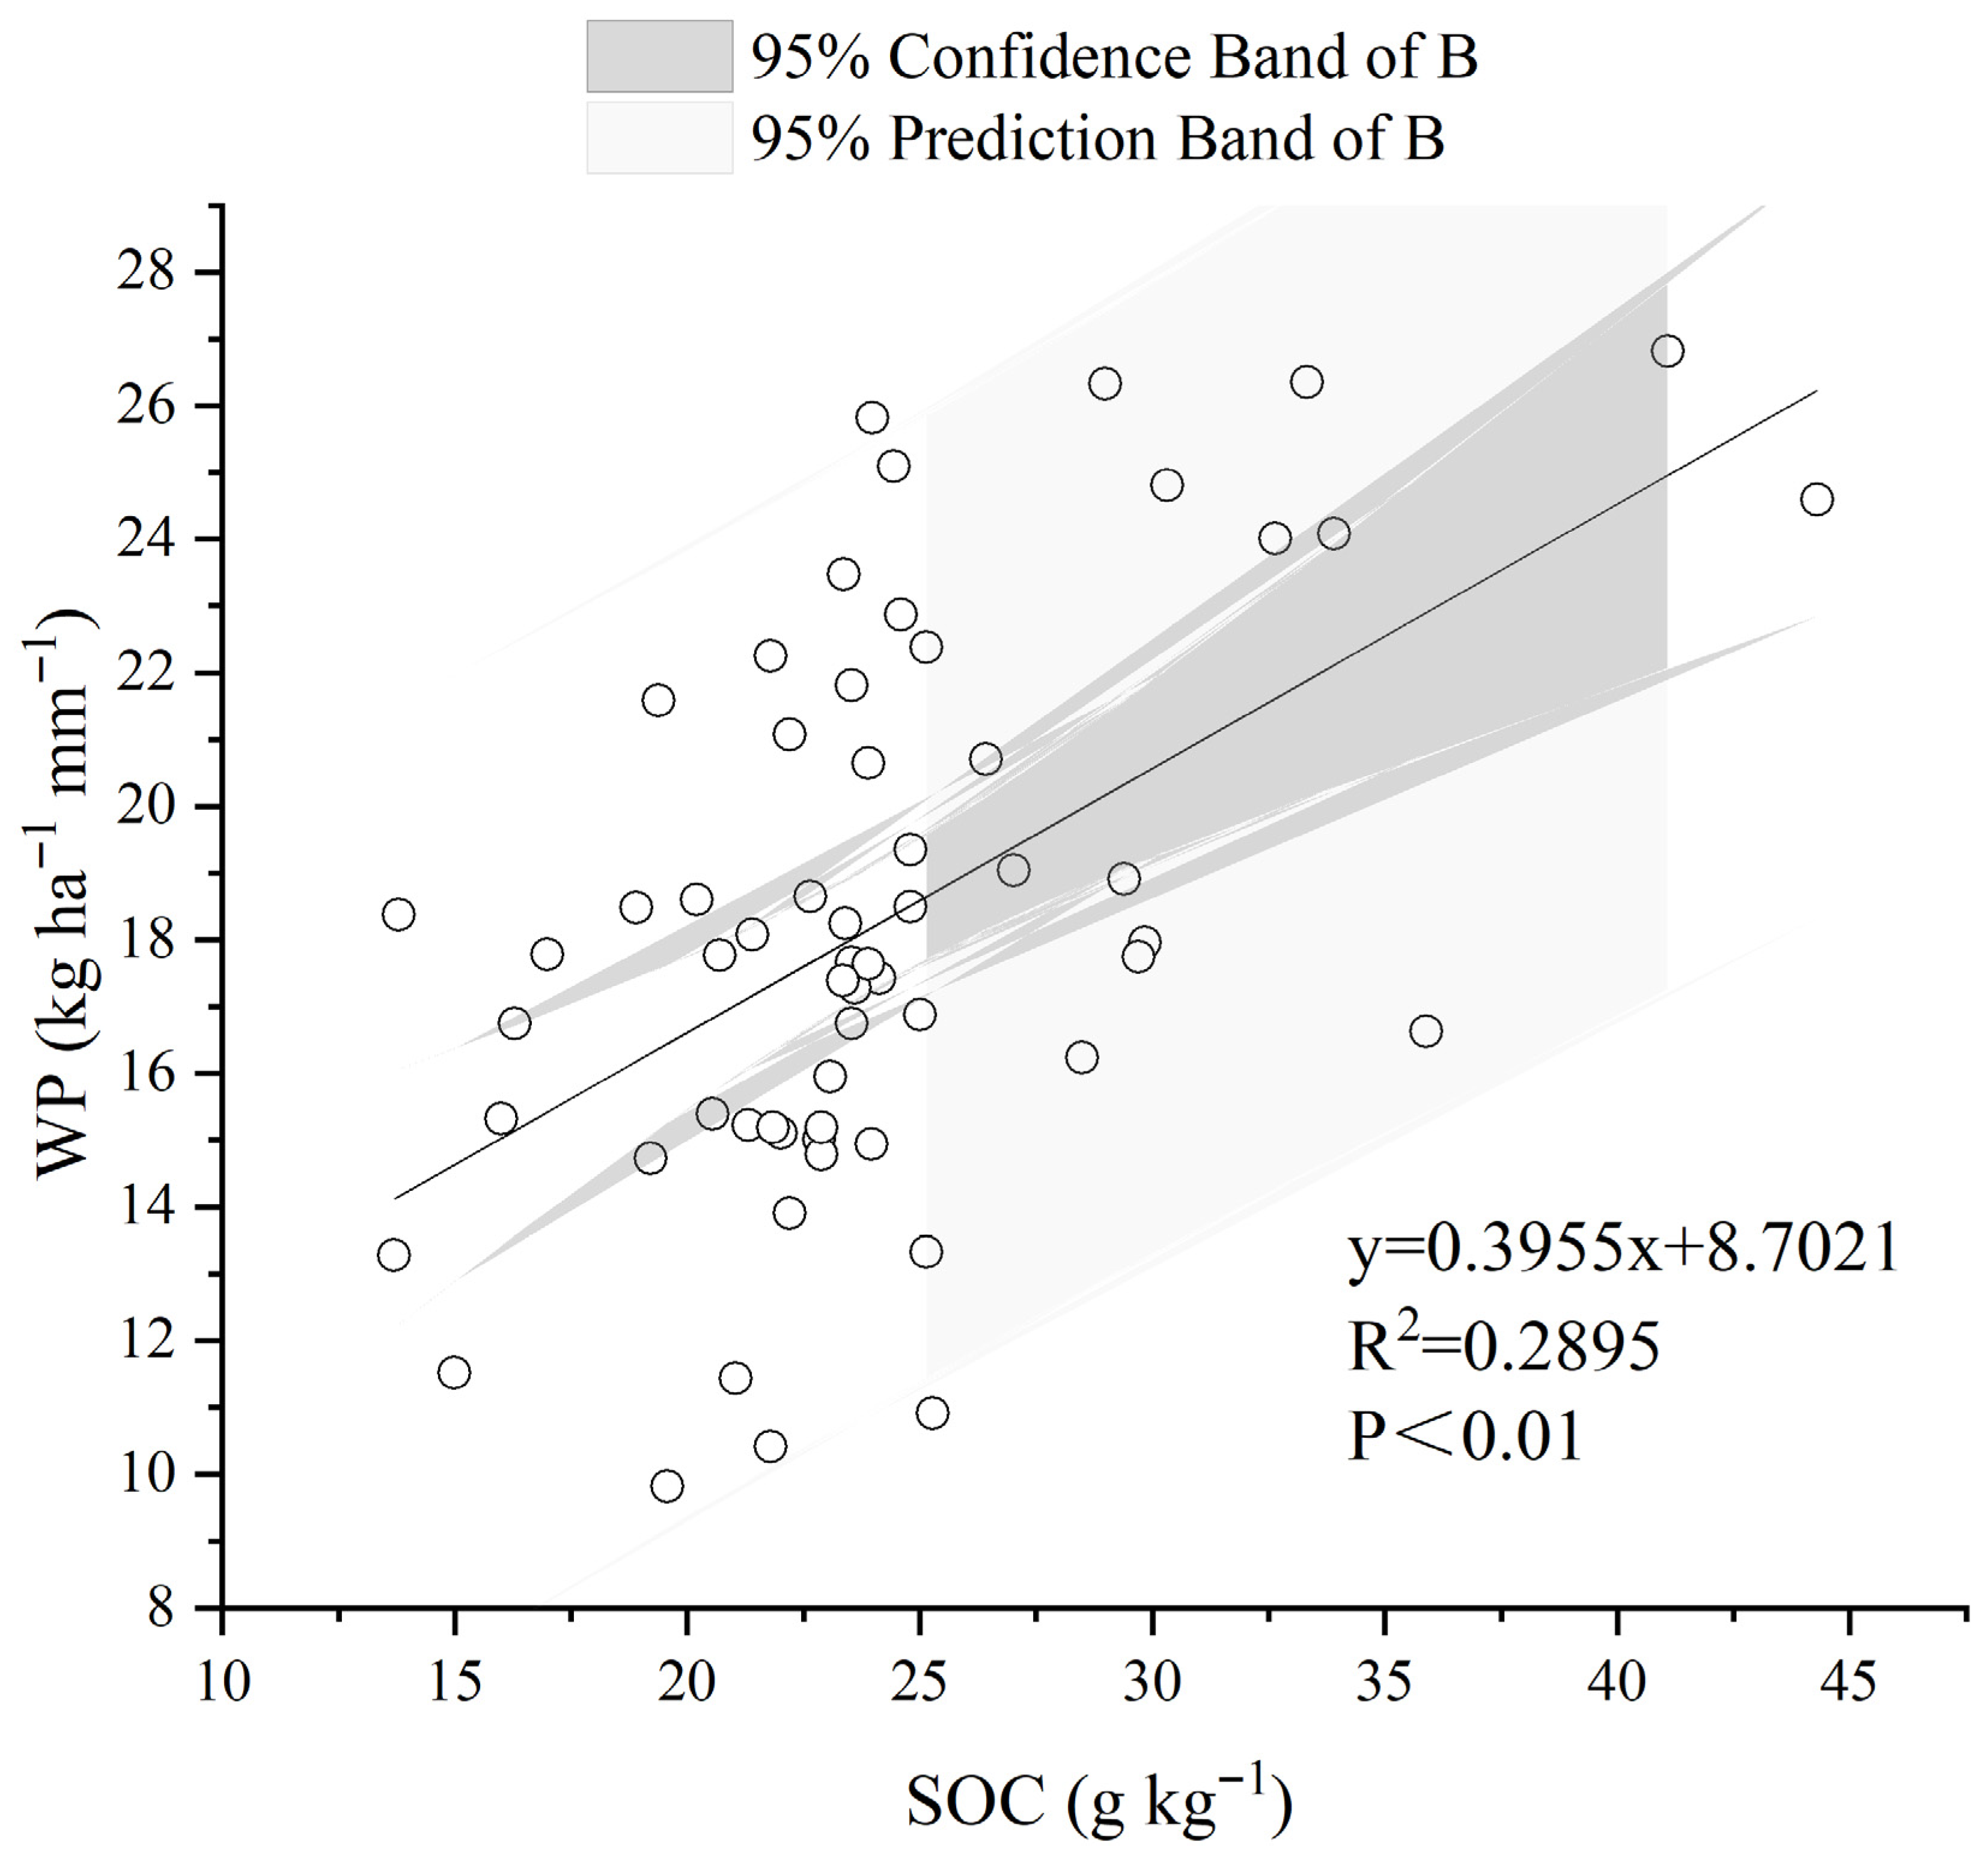
Pearson’s correlation analysis (Table 7) showed that the average yield was significantly positively correlated with SOC, WP, and water consumption during growth (p < 0.01). SOC was also significantly positively correlated with WP (p < 0.01). In contrast, WP was negatively correlated with water consumption during growth. Linear regression analysis of SOC and WP (Figure 6) showed that for every unit increase in SOC, the WP increased by 0.3955 kg ha−1 mm−1.
Further, a Pearson’s correlation analysis was conducted for maize yield and precipitation over five periods: (1) annual precipitation (January–December), (2) precipitation during the maize growth period (May–September), (3) precipitation during the fallow period before sowing (October–December of the previous year and January–April of the current year), (4) precipitation of the previous year and precipitation before sowing (January–December of the previous year and January–April of the current year), and (5) precipitation during the fallow period from the previous harvest until the current sowing season plus precipitation during the current growth period (October–December of the previous year and January–September of the current year). As shown in Table 8, maize yields in all of the treatments were significantly positively correlated with precipitation during the fallow period from the previous harvest until the current sowing season plus precipitation during the current growth period (October–December of the previous year plus January–September of the current year).

4. Discussion

4.1. Effect of Fertilization on Maize Yield

Although the effect of fertilization on maize yield has been assessed using data from 2019 to 2021 [4], the 30-year long-term dataset facilitates a refined classification of precipitation patterns, thereby mitigating systematic errors and enabling a more comprehensive representation of field trial outcomes. Compared to the no fertilization treatment (N0P0M0), fertilization significantly increased maize yield. Among the four treatments with chemical fertilizers alone, maize yield initially increased and then decreased as nitrogen and phosphorus application rates rose, reaching the highest yield in the N2P2M0 (N 120 kg·ha−1 and P 75 kg·ha−1) treatment. Similar results were observed in a previous study [34]. However, the combined application of cattle manure with chemical fertilizers significantly increased maize yield to a higher level, with the highest yield observed in the N4P2M2 treatment. While applying a high rate of cattle manure significantly increased average maize yield by 24.3% compared to chemical fertilizers alone, it resulted in a notably lower yield by 2.0% than that of N4P2M2. This is consistent with a previous study in which a 50% manure substitution improved crop yield while 100% manure decreased grain yield [35]. A global meta-analysis reported by Seufert et al. in 2012 also showed that organic yields are 25% lower than conventional yields [36]. Furthermore, such a high amount of organic fertilizer input cannot be achieved on a large scale at this stage. Chemical fertilizer is quick-acting, and can provide enough nutrients in the early growth stages of maize, while organic fertilizers usually contain lower levels of N and P [37] and are slow releasing [9], providing nutrients in the middle and late growth stages of maize. Combining the two types of fertilizers can ensure sufficient nutrition for maize in each growth period [38]. Moreover, the application of organic fertilizer can decrease the soil bulk density and improve soil agglomeration [5,10]. In addition, organic fertilizers are rich in beneficial microorganisms. These microorganisms significantly suppress pathogenic bacteria and enhance overall soil microbial activity. Consequently, they create a more favorable microenvironment for maize growth by improving nutrient cycling and energy flow [39,40].
Maize yields vary annually due to precipitation, temperature and other environmental conditions. Consequently, the stability of grain production is a crucial indicator of sustainable development in agricultural ecosystems. High yield and yield stability are both vital indicators for agricultural sustainability. However, yield stability is an even more critical measure of an agroecosystem’s ability to ensure food security by measuring its resilience against disturbances. From 2012 to 2021, compared with CK, fertilizer application generally reduced the CV (except for the N1P1M0 treatment), indicating that fertilization contributes to yield stability. Furthermore, the combined organic-inorganic fertilization resulted in a lower CV than the sole chemical fertilizer treatment. Notably, the treatment with a high rate of organic fertilizer alone exhibited a slightly higher CV than the combined fertilization, underscoring that the integrated approach is the most effective strategy to counteract extreme environmental conditions and stabilize crop yields [41,42,43,44]. This phenomenon was not observed in the previous decades (1992–2011), which might be attributed in part to the uneven soil fertility during that period. It could also be due to limitations related to the varieties and cultivation techniques, as the maize yields were relatively low, making them more susceptible to environmental fluctuations. This further highlights the importance of long-term field experiments in agricultural research [45,46].

4.2. Effect of Fertilization on WP

In this study, fertilization significantly increased the average WP compared with N0P0M0, and WP showed a trend similar to maize yield. In the treatments with chemical fertilizer alone, WP initially increased and then decreased with higher fertilizer input, peaking at N2P2M0 with a value of 18.42 kg ha−1 mm−1. The combined application of chemical fertilizers and cattle manure further increased WP, with the highest value at N4P2M2 with a value of 22.56 kg ha−1 mm−1. Cattle manure alone (N0P0M6) resulted in the second highest WP. Similarly, previous studies found that the combined application of organic and inorganic fertilizers enhances crop WP under limited precipitation [9,47,48]. The application of manure notably increased the soil water holding capacity at the tasseling and grain filling stages, while it reduced the evaporation at the jointing-big trumpet and tasseling-grain filling stages [49]. Further, WP is mainly driven by biomass production and the harvest index, both related to fertilizer use and soil fertility [50]. Organic fertilizers can reduce soil bulk density and enhance both soil permeability and moisture conductivity [6,51,52,53]. This benefits root growth and water utilization, and increases moisture retention in the soil, helping to alleviate drought stress in crops caused by uneven precipitation [54]. Furthermore, organic fertilizer application can enhance leaf photosynthesis and reduce evaporation, further improving WP [55]. In summary, a reasonable combination of organic and inorganic fertilizers can regulate the relationship between soil water and fertilizer, increase maize root depth, and improve WP.

4.3. Effect of Precipitation on Maize Yield

Maize is particularly sensitive to water deficiency during the flowering and grain-filling stages; thus, soil water storage is critical for maize growth [56]. In this study, maize yield was significantly affected by soil moisture before sowing and precipitation during maize growth. The highest maize yield from 1992 to 2011 was recorded in 2007. This peak was associated with adequate pre-sowing soil moisture and favorable rainfall distribution during the growing season. In contrast, the yield in 1995 was lower, despite that year receiving higher total and growing-season precipitation. The lowest yield was recorded in 1999. This year was characterized by an exceptionally dry winter and spring, with precipitation of only 77.4 mm, followed by heavy precipitation of 344.3 mm in the late growing season. Consequently, inadequate sunlight and excessive vegetative growth occurred in August, ultimately reducing grain yield. Since 2012, improvements in maize varieties and cultivation techniques led to an increase in maize planting density, which increased maize yields. Similarly, from 2012 to 2021, the highest maize yield was recorded in 2012. This pattern was attributed to adequate pre-sowing soil moisture and favorable rainfall distribution during the growing season. In contrast, the yield in 2017 was lower, despite its higher overall precipitation. In contrast, the lowest yield occurred in 2019, which was characterized by insufficient soil moisture and severe drought during the spring, summer, and autumn. Thus, maize yield is not only affected by water storage during the fallow period from the previous harvest until the current sowing season before sowing, but also related to precipitation during the current growth period (October–December of the last year and January–September of the current year). In summary, these results demonstrate the importance of soil moisture storage and precipitation during the growth period and the type and amount of fertilization. In particular, precipitation and fertilization need to be coupled with water and fertilizer demand during different crop growth stages.

5. Conclusions

A 30-year experiment was conducted to investigate the long-term effects of different fertilization strategies and precipitation patterns on maize yield and water productivity. Compared to the application of either chemical fertilizers alone or cattle manure alone, the combined application of chemical fertilizers and cattle manure significantly increased WP and maize yield and also promoted the stability of food production under conditions of significant annual precipitation variability. Among all treatments, N4P2M2 demonstrated superior performance. Relative to the sole chemical fertilizer treatment, it was associated with a 28.1% increase in grain yield, a 30.1% improvement in WP, and a 15.0 percentage-point reduction in the CV for yield over the 2012–2021 period. Maize yield was significantly correlated with precipitation during the fallow period from the previous harvest until the current sowing season, as well as with precipitation during the current growth period. Among the various precipitation patterns, relatively dry years tended to have the highest WP. In dryland agricultural systems, the integrated application of organic and inorganic fertilizers represents a core strategy for enhancing systemic resilience and productivity. This approach maximizes the utilization of limited precipitation and buffers against climate extremes, thereby safeguarding long-term sustainability.

Author Contributions

Conceptualization, H.Z.; methodology, X.W.; software, L.H.; validation, W.X.; formal analysis, Z.Y.; data curation, Z.G.; writing—original draft preparation, Z.L.; writing—review and editing, Z.L.; visualization, Z.W.; supervision, D.C. All authors have read and agreed to the published version of the manuscript.

Funding

This study was financially supported by the project of Shanxi Province key lab construction (Z135050009017-1-2), the Science and Technology Innovation and Promotion Project of Shanxi Agricultural University (CXGC2023025), the Basic Research Program of Shanxi Province (202403021221095), Major agricultural science and technology Project of Shanxi Province (NYGG07-5), the open project of State Key Laboratory of Efficient Utilization of Arid and Semi-arid Arable Land in Northern China, the Institute of Agricultural Resources and Regional Planning, Chinese Academy of Agricultural Sciences (EUAL-2023-09), the National Key Research and Development Program of China (2023YFD1900503-02, 2023YFD1900402, 2021YFD1900705).

Data Availability Statement

The raw data supporting the conclusions of this article will be made available by the authors on request.

Acknowledgments

We are grateful to the staff who collected data and detected indicators during the long-term positioning test.

Conflicts of Interest

The authors declare no conflicts of interest.

References

  1. Li, S.X.; Wang, Z.H.; Malhi, S.S.; Li, S.Q.; Gao, Y.J.; Tian, X.H. Nutrient and water management effects on crop production, and nutrient and water use efficiency in dryland areas of China. Adv. Agron. 2009, 102, 223–265. [Google Scholar]
  2. Fang, H.; Li, Y.; Gu, X.; Du, Y.; Chen, P.; Hu, H. Evapotranspiration, water use efficiency, and yield for film mulched maize under different nitrogen-fertilization rates and climate conditions. Agric. Water. Manag. 2024, 301, 108935. [Google Scholar] [CrossRef]
  3. Guo, S.; Zhu, H.; Dang, T.; Wu, J.; Liu, W.; Hao, M.; Li, Y.; Syers, J.K. Winter wheat grain yield associated with precipitation distribution under long-term nitrogen fertilization in the semiarid Loess Plateau in China. Geoderma 2012, 189–190, 442–450. [Google Scholar] [CrossRef]
  4. Liu, Z.; Ma, X.; Xie, W.; Yang, Z.; Zhou, H.; Xu, M. Response of maize yield and water efficiency to long-term fertilization patters in dryland of Shanxi Province. Agric. Res. Arid. Areas 2023, 41, 61–70. [Google Scholar]
  5. Celik, I.; Gunal, H.; Budak, M.; Akpinar, C. Effects of long-term organic and mineral fertilizers on bulk density and penetration resistance in semi-arid Mediterranean soil conditions. Geoderma 2010, 160, 236–243. [Google Scholar] [CrossRef]
  6. Cheng, Y.; Luo, M.; Zhang, T.; Yan, S.; Wang, C.; Dong, Q.G.; Feng, H.; Zhang, T.; Kisekka, I. Organic substitution improves soil structure and water and nitrogen status to promote sunflower (Helianthus annuus L.) growth in an arid saline area. Agric. Water. Manag. 2023, 283, 108320. [Google Scholar] [CrossRef]
  7. Li, S.X.; Wang, Z.H.; Li, S.Q.; Gao, Y.J. Effect of nitrogen fertilization under plastic mulched and non-plastic mulched conditions on water use by maize plants in dryland areas of China. Agric. Water. Manag. 2015, 162, 15–32. [Google Scholar] [CrossRef]
  8. Yang, Z.; Kong, T.; Xie, J.; Yang, T.; Jiang, Y.; Feng, Z.; Zhang, Z. Appropriate water and fertilizer supply can increase yield by promoting growth while ensuring the soil ecological environment in melon production. Agric. Water. Manag. 2023, 289, 108561. [Google Scholar] [CrossRef]
  9. Zhai, L.; Wang, Z.; Zhai, Y.; Zhang, L.; Zheng, M.; Yao, H.; Lv, L.; Shen, H.; Zhang, J.; Yao, Y.; et al. Partial substitution of chemical fertilizer by organic fertilizer benefits grain yield, water use efficiency, and economic return of summer maize. Soil Tillage Res. 2022, 217, 105287. [Google Scholar] [CrossRef]
  10. Guo, L.; Wu, G.; Li, Y.; Li, C.; Liu, W.; Meng, J.; Liu, H.; Yu, X.; Jiang, G. Effects of cattle manure compost combined with chemical fertilizer on topsoil organic matter, bulk density and earthworm activity in a wheat–maize rotation system in Eastern China. Soil Tillage Res. 2016, 156, 140–147. [Google Scholar] [CrossRef]
  11. Duan, C.; Li, J.; Zhang, B.; Wu, S.; Fan, J.; Feng, H.; He, J.; Siddique, K.H.M. Effect of bio-organic fertilizer derived from agricultural waste resources on soil properties and winter wheat (Triticum aestivum L.) yield in semi-humid drought-prone regions. Agric. Water. Manag. 2023, 289, 108539. [Google Scholar] [CrossRef]
  12. Duan, Y.; Xu, M.; Gao, S.; Yang, X.; Huang, S.; Liu, H.; Wang, B. Nitrogen use efficiency in a wheat–corn cropping system from 15 years of manure and fertilizer applications. Field Crops Res. 2014, 157, 47–56. [Google Scholar] [CrossRef]
  13. Meade, G.; Lalor, S.T.J.; Cabe, T.M. An evaluation of the combined usage of separated liquid pig manure and inorganic fertiliser in nutrient programmes for winter wheat production. Eur. J. Agron. 2011, 34, 62–70. [Google Scholar] [CrossRef]
  14. Zhou, H.; Fang, H.; Mooney, S.J.; Peng, X. Effects of long-term inorganic and organic fertilizations on the soil micro and macro structures of rice paddies. Geoderma 2016, 266, 66–74. [Google Scholar] [CrossRef]
  15. Cai, A.; Xu, M.; Wang, B.; Zhang, W.; Liang, G.; Hou, E.; Luo, Y. Manure acts as a better fertilizer for increasing crop yields than synthetic fertilizer does by improving soil fertility. Soil Tillage Res. 2019, 189, 168–175. [Google Scholar] [CrossRef]
  16. Huang, R.; Wang, Y.; Liu, J.; Gao, J.; Zhang, Y.; Ni, J.; Xie, D.; Wang, Z.; Gao, M. Partial substitution of chemical fertilizer by organic materials changed the abundance, diversity, and activity of nirS-type denitrifying bacterial communities in a vegetable soil. Appl. Soil Ecol. 2020, 152, 103589. [Google Scholar] [CrossRef]
  17. Kiboi, M.N.; Ngetich, K.F.; Fliessbach, A.; Muriuki, A.; Mugendi, D.N. Soil fertility inputs and tillage influence on maize crop performance and soil water content in the Central Highlands of Kenya. Agric. Water Manag. 2019, 217, 316–331. [Google Scholar] [CrossRef]
  18. Bhattacharyya, R.; Kundu, S.; Prakash, V.; Gupta, H.S. Sustainability under combined application of mineral and organic fertilizers in a rainfed soybean–wheat system of the Indian Himalayas. Eur. J. Agron. 2008, 28, 33–46. [Google Scholar] [CrossRef]
  19. Pan, G.; Zhou, P.; Li, Z.; Smith, P.; Li, L.; Qiu, D.; Zhang, X.; Xu, X.; Shen, S.; Chen, X. Combined inorganic/organic fertilization enhances N efficiency and increases rice productivity through organic carbon accumulation in a rice paddy from the Tai Lake region, China. Agric. Ecosyst. Environ. 2009, 131, 274–280. [Google Scholar] [CrossRef]
  20. Han, J.; Dong, Y.; Zhang, M. Chemical fertilizer reduction with organic fertilizer effectively improve soil fertility and microbial community from newly cultivated land in the Loess Plateau of China. Appl. Soil Ecol. 2021, 165, 103966. [Google Scholar] [CrossRef]
  21. Khaliq, A.; Kaleem Abbasi, M. Improvements in the physical and chemical characteristics of degraded soils supplemented with organic–inorganic amendments in the Himalayan region of Kashmir, Pakistan. Catena 2015, 126, 209–219. [Google Scholar] [CrossRef]
  22. Dai, X.; Song, D.; Zhou, W.; Liu, G.; Liang, G.; He, P.; Sun, G.; Yuan, F.; Liu, Z.; Yao, Y.; et al. Partial substitution of chemical nitrogen with organic nitrogen improves rice yield, soil biochemical indictors and microbial composition in a double rice cropping system in south China. Soil Tillage Res. 2021, 205, 104753. [Google Scholar] [CrossRef]
  23. Dong, W.Y.; Zhang, X.Y.; Dai, X.Q.; Fu, X.L.; Yang, F.T.; Liu, X.Y.; Sun, X.M.; Wen, X.F.; Schaeffer, S. Changes in soil microbial community composition in response to fertilization of paddy soils in subtropical China. Appl. Soil Ecol. 2014, 84, 140–147. [Google Scholar] [CrossRef]
  24. Ai, C.; Liang, G.; Sun, J.; Wang, X.; Zhou, W. Responses of extracellular enzyme activities and microbial community in both the rhizosphere and bulk soil to long-term fertilization practices in a fluvo-aquic soil. Geoderma 2012, 173–174, 330–338. [Google Scholar] [CrossRef]
  25. Islam, M.R.; Singh Chauhan, P.; Kim, Y.; Kim, M.; Sa, T. Community level functional diversity and enzyme activities in paddy soils under different long-term fertilizer management practices. Biol. Fertil. Soils 2010, 47, 599–604. [Google Scholar] [CrossRef]
  26. Liu, E.; Yan, C.; Mei, X.; He, W.; Bing, S.H.; Ding, L.; Liu, Q.; Liu, S.; Fan, T. Long-term effect of chemical fertilizer, straw, and manure on soil chemical and biological properties in northwest China. Geoderma 2010, 158, 173–180. [Google Scholar] [CrossRef]
  27. Liu, Z.; Xie, W.; Yang, Z.; Huang, X.; Zhou, H. Effects of manure and chemical fertilizer on bacterial community structure and soil enzyme activities in North China. Agronomy 2021, 11, 1017. [Google Scholar] [CrossRef]
  28. IUSS Working Group WRB. World Reference Base for Soil Resources 2006. In A Framework for International Classification, Correlation and Communication, 2nd ed.; World Soil Resources Reports No. 103; FAO: Rome, Italy, 2006. [Google Scholar]
  29. Xing, N.Q.; Zhang, Y.Q.; Wang, L.X. The Study on Dryland Agriculture in North China; China Agricultural Press: Beijing, China, 2001. [Google Scholar]
  30. Tsimba, R.; Edmeades, G.O.; Millner, J.P.; Kemp, P.D. The effect of planting date on maize grain yields and yield components. Field Crops Res. 2013, 150, 135–144. [Google Scholar] [CrossRef]
  31. Bao, S.D. Analysis Method of Soil and Agricultural Chemistry, 3rd ed.; China Agricultural Press: Beijing, China, 2000; pp. 25–108. [Google Scholar]
  32. Fang, Y.; Xu, B.C.; Lin, L.; Gu, Y.J.; Liu, Q.Q.; Turner, N.C.; Li, F.M. Does a mixture of old and modern winter wheat cultivars increase yield and water use efficiency in water-limited environments? Field Crops Res. 2014, 156, 12–21. [Google Scholar] [CrossRef]
  33. Zhang, S.L.; Li, P.R.; Yang, X.Y.; Wang, Z.H.; Chen, X.P. Effects of tillage and plastic mulch on soil water, growth and yield of spring-sown maize. Soil Tillage Res. 2011, 112, 92–97. [Google Scholar] [CrossRef]
  34. Kumari, K.; Dass, A.; Sudhishri, S.; Kaur, R.; Rain, A. Yield components, yield and nutrient uptake pattern in maize (Zea mays) under varying irrigation and nitrogen levels. Indian J. Agron. 2017, 62, 104–107. [Google Scholar] [CrossRef]
  35. Xie, J.; Shi, X.; Zhang, Y.; Wan, Y.; Hu, Q.; Zhang, Y.; Wang, J.; He, X.; Evgenia, B. Improved nitrogen use efficiency, carbon sequestration and reduced environmental contamination under a gradient of manure application. Soil Tillage Res. 2022, 220, 105386. [Google Scholar] [CrossRef]
  36. Seufert, V.; Ramankutty, N.; Foley, J.A. Comparing the yields of organic and conventional agriculture. Nature 2012, 485, 229–232. [Google Scholar] [CrossRef]
  37. Gezahegn, A.M. Effect of organic fertilizers on maize (Zea mays L.) production and soil physical and chemical properties. World Appl. Sci. J. 2021, 39, 11–19. [Google Scholar]
  38. Crews, T.E.; Peoples, M.B. Can the Synchrony of Nitrogen Supply and Crop Demand be Improved in Legume and Fertilizer-based Agroecosystems? A Review. Nutr. Cycl. Agroecosyst. 2015, 72, 101–120. [Google Scholar] [CrossRef]
  39. Tao, R.; Liang, Y.; Wakelin, S.A.; Chu, G. Supplementing chemical fertilizer with an organic component increases soil biological function and quality. Appl. Soil Ecol. 2015, 96, 42–51. [Google Scholar] [CrossRef]
  40. Zhao, J.; Ni, T.; Li, J.; Lu, Q.; Fang, Z.; Huang, Q.; Zhang, R.; Li, R.; Shen, B.; Shen, Q. Effects of organic–inorganic compound fertilizer with reduced chemical fertilizer application on crop yields, soil biological activity and bacterial community structure in a rice–wheat cropping system. Appl. Soil Ecol. 2016, 99, 1–12. [Google Scholar] [CrossRef]
  41. Chen, H.; Deng, A.; Zhang, W.; Li, W.; Qiao, Y.; Yang, T.; Zheng, C.; Cao, C.; Chen, F. Long-term inorganic plus organic fertilization increases yield and yield stability of winter wheat. Crop J. 2018, 6, 589–599. [Google Scholar] [CrossRef]
  42. Han, X.; Hu, C.; Chen, Y.; Qiao, Y.; Liu, D.; Fan, J.; Li, S.; Zhang, Z. Crop yield stability and sustainability in a rice-wheat cropping system based on 34-year field experiment. Eur. J. Agron. 2020, 113, 125965. [Google Scholar] [CrossRef]
  43. Macholdt, J.; Piepho, H.P.; Honermeier, B. Mineral NPK and manure fertilisation affecting the yield stability of winter wheat: Results from a long-term field experiment. Eur. J. Agron. 2019, 102, 14–22. [Google Scholar] [CrossRef]
  44. Muller, C.; Elliott, J.; Pugh, T.A.M.; Ruane, A.C.; Ciais, P.; Balkovic, J.; Deryng, D.; Folberth, C.; Izaurralde, R.C.; Jones, C.D.; et al. Global patterns of crop yield stability under additional nutrient and water inputs. PLoS ONE 2018, 13, e0198748. [Google Scholar] [CrossRef] [PubMed]
  45. Berry, P.M.; Sylvester-Bradley, R.; Philipps, L.; Hatch, D.J.; Cuttle, S.P.; Rayns, F.W.; Gosling, P. Is the productivity of organic farms restricted by the supply of available nitrogen? Soil Use Manag. 2006, 18, 248–255. [Google Scholar] [CrossRef]
  46. Pang, X.P.; Letey, J. Organic Farming Challenge of Timing Nitrogen Availability to Crop Nitrogen Requirements. Soil Sci. Soc. Am. J. 2000, 64, 247–253. [Google Scholar] [CrossRef]
  47. Wang, X.; Nie, J.; Wang, P.; Zhao, J.; Yang, Y.; Wang, S.; Zeng, Z.; Zang, H. Does the replacement of chemical fertilizer nitrogen by manure benefit water use efficiency of winter wheat—Summer maize systems? Agric. Water Manag. 2021, 243, 106428. [Google Scholar] [CrossRef]
  48. Wang, X.; Ren, Y.; Zhang, S.; Chen, Y.; Wang, N. Applications of organic manure increased maize (Zea mays L.) yield and water productivity in a semi-arid region. Agric. Water. Manag. 2017, 187, 88–98. [Google Scholar] [CrossRef]
  49. Wang, X.J.; Jia, Z.K.; Liang, L.Y.; Kang, S.Z. Effect of manure management on the temporal variations of dryland soil moisture and water use efficiency of maize. J. Agric. Sci. Technol. 2013, 15, 1293–1304. [Google Scholar]
  50. Zhang, X.; Uwimpaye, F.; Yan, Z.; Shao, L.; Chen, S.; Sun, H.; Liu, X. Water productivity improvement in summer maize—A case study in the North China Plain from 1980 to 2019. Agric. Water. Manag. 2021, 247, 106728. [Google Scholar] [CrossRef]
  51. Liu, J.; Bu, L.; Zhu, L.; Luo, S.; Chen, X.; Li, S. Optimizing Plant Density and Plastic Film Mulch to Increase Maize Productivity and Water-Use Efficiency in Semiarid Areas. Agron. J. 2014, 106, 1138–1146. [Google Scholar] [CrossRef]
  52. Uzoma, K.C.; Inoue, M.; Andry, H.; Fujimaki, H.; Zahoor, A.; Nishihara, E. Effect of cow manure biochar on maize productivity under sandy soil condition. Soil Use Manag. 2011, 27, 205–212. [Google Scholar] [CrossRef]
  53. Zhao, Y.; Yan, Z.; Qin, J.; Xiao, Z. Effects of long-term cattle manure application on soil properties and soil heavy metals in corn seed production in Northwest China. Environ. Sci. Pollut. Res. 2014, 21, 7586–7595. [Google Scholar] [CrossRef]
  54. Ge, T.; Sui, F.; Bai, L.; Tong, C.; Sun, N. Effects of water stress on growth, biomass partitioning, and water-use efficiency in summer maize (Zea mays L.) throughout the growth cycle. Acta Physiol. Plant. 2011, 34, 1043–1053. [Google Scholar] [CrossRef]
  55. Liu, C.A.; Li, F.R.; Zhou, L.M.; Zhang, R.H.; Yu, J.; Lin, S.L.; Wang, L.J.; Siddique, K.H.M.; Li, F.M. Effect of organic manure and fertilizer on soil water and crop yields in newly-built terraces with loess soils in a semi-arid environment. Agric. Water Manag. 2013, 117, 123–132. [Google Scholar] [CrossRef]
  56. Doerge, T. Safely delaying the first irrigation of corn. In Crop Insights; Pioneer Hi-Bred: Johnston, IA, USA, 2008; Volume 18. [Google Scholar]
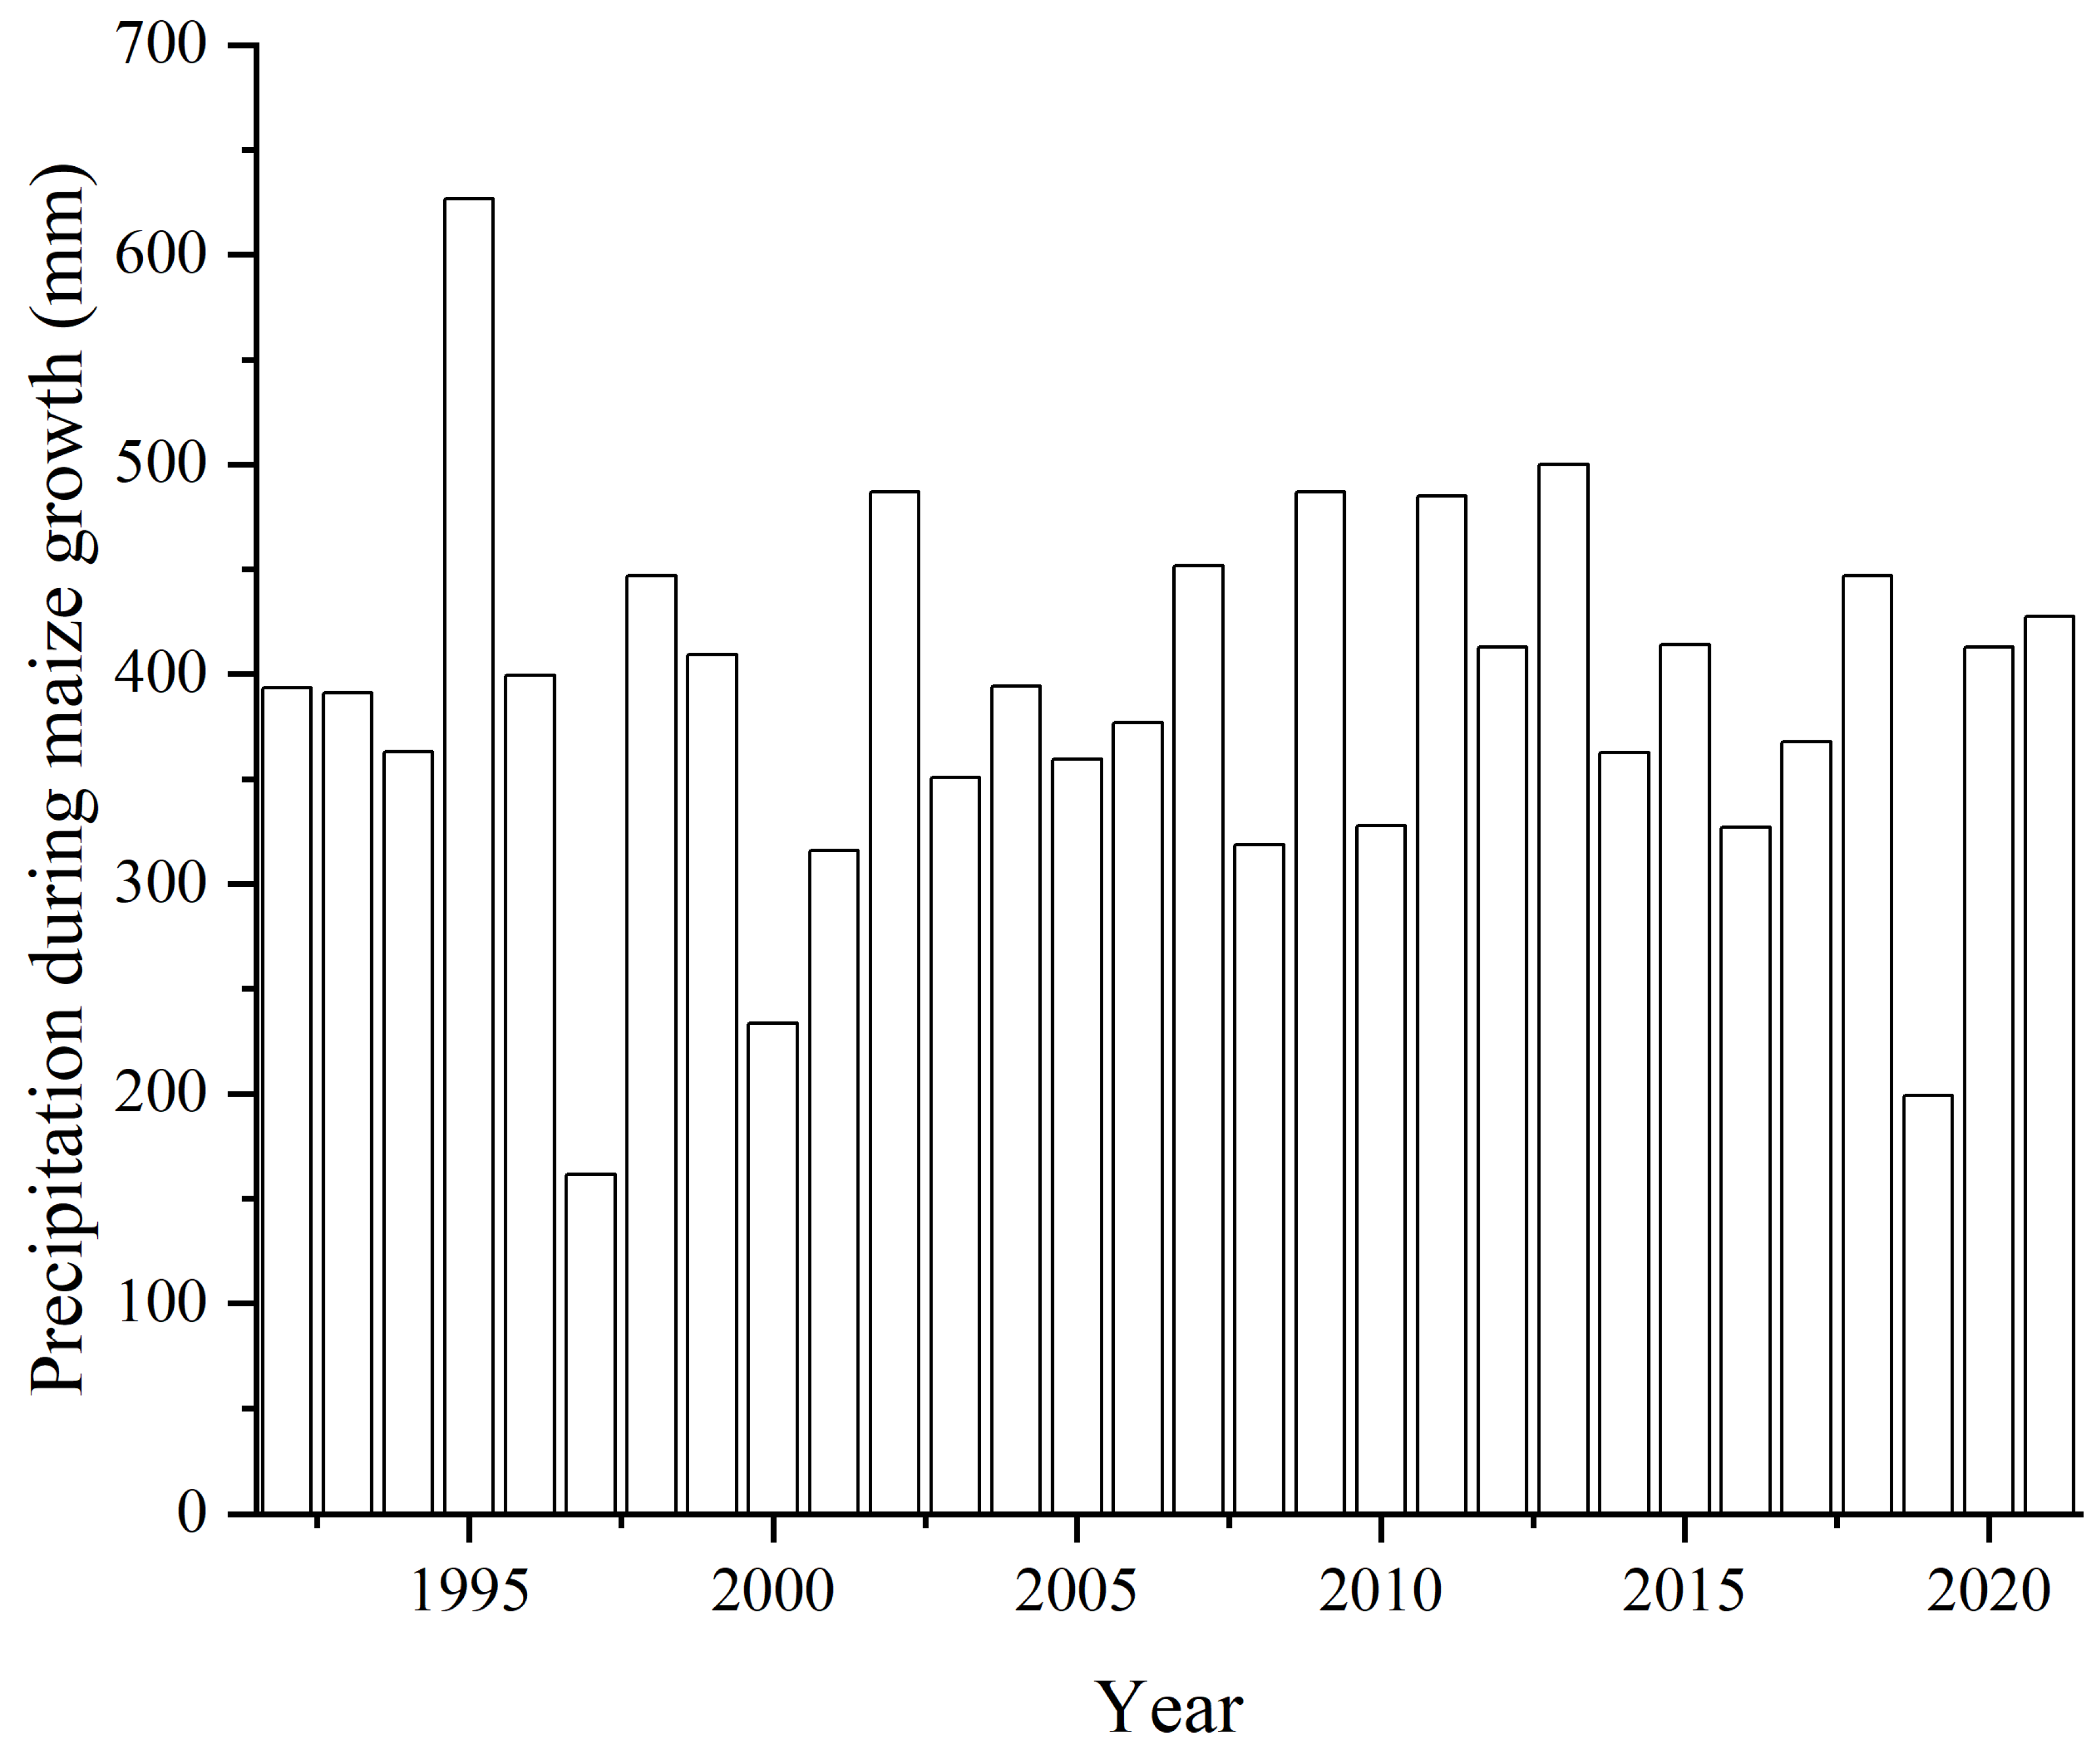
Figure 1. Precipitation during maize growth from 1992 to 2021.
Agriculture 15 02396 g001
Figure 2. Accumulative maize yield from 1992 to 2021. Different letters indicate significant differences (ANOVA followed by LSD post hoc test, p < 0.05).
Agriculture 15 02396 g002
Figure 3. CV of maize yield (a) from 1992 to 2011 and (b) from 2012 to 2021 according to the planting density. Different letters indicate significant differences (ANOVA followed by LSD post hoc test, p < 0.05).
Agriculture 15 02396 g003
Figure 4. Average WP of maize from 1992 to 2021. Different letters indicate significant differences (ANOVA followed by LSD post hoc test, p < 0.05).
Agriculture 15 02396 g004
Figure 5. SOC in the year 1992 and 2021. Different letters indicate significant differences (ANOVA followed by LSD post hoc test, p < 0.05).
Agriculture 15 02396 g005
Figure 6. Correlation between SOC and WP. The circles represent the measured values under different treatments in 1992, 1996, 2001, 2006, 2011, 2016 and 2021, n = 63.
Agriculture 15 02396 g006
Table 1. Physical properties of the soil profile before the experiment.
Soil Depth (cm)Bulk Density
(g/cm3)
Porosity (%)Particle Size Distribution (%)Wilting Moisture
(Dry Soil %)
Field Capacity
(Dry Soil %)
>0.05
mm
0.05–0.01
mm
0.01–0.005
mm
0.005–0.001
mm
<0.001
mm
0–101.1855.545.523.510.512.58.05.125.7
10–201.2453.244.526.511.010.08.06.124.8
20–401.3349.837.532.59.58.312.25.525.1
40–601.3648.744.530.012.04.09.55.323.4
60–801.2851.741.733.28.57.39.35.024.0
80–1001.2851.743.033.08.26.89.06.524.2
100–1201.3748.343.030.511.06.09.57.225.4
120–1401.3648.744.527.010.59.58.58.026.2
140–1601.4047.240.538.07.56.57.57.926.4
160–1801.3947.537.535.09.09.59.08.827.3
180–2001.3250.237.532.010.510.010.09.530.7
Table 2. Design of the long-term fertilization experiment.
TreatmentN
(kg·ha−1)
P2O5
(kg·ha−1)
Cattle Manure
(t·ha−1)
N0P0M00.00.00.0
N1P1M060.037.50.0
N2P2M0120.075.00.0
N3P3M0180.0112.50.0
N4P4M0240.0150.00.0
N2P1M1120.037.522.5
N3P2M3180.075.067.5
N4P2M2240.075.045.0
N0P0M60.00.0135.0
Table 3. Precipitation patterns from 1992 to 2021.
Precipitation PatternFrequencyPrecipitation (mm)Drying IndexYears
Very wet year3613.7–668.21.4–2.01995, 2007, 2021
Relatively wet year7518.7–572.40.4–1.02002, 2003, 2009, 2011, 2013, 2015, 2017
Normal year11447.8–504.1−0.3–0.31992, 1993, 1994, 1996, 1998, 2004, 2006, 2008, 2012, 2016, 2018
Relatively dry year5380.9–440.5−1.0–−0.41999, 2005, 2010, 2014, 2020
Very dry year4250.7–368.7−2.3–−1.11997, 2000, 2001, 2019
Table 4. Effect of fertilization on maize yield under different precipitation patterns.
TreatmentVery Wet YearRelative Wet YearNormal YearRelative Dry YearVery Dry Year
Average Maize Yield (kg ha−1)Increasing Rate (%) *Average Maize Yield (kg ha−1)Increasing Rate (%)Average Maize Yield (kg ha−1)Increasing Rate (%)Average Maize Yield (kg ha−1)Increasing Rate (%)Average Maize Yield (kg ha−1)Increasing Rate (%)
N0P0M04352.6-4143.7-3839.2-3602.2-3067.3-
N1P1M07663.376.066677.858.226180.260.986332.275.794005.030.57
N2P2M08391.092.787641.680.367405.092.886958.993.184589.149.61
N3P3M08752.4101.087376.674.286913.980.096889.391.254596.149.84
N4P4M08438.993.887032.366.366956.581.206592.583.014295.040.03
N2P1M19869.8126.769065.6113.088364.5117.878288.5130.105358.174.68
N3P2M39903.0127.528704.4104.788571.2123.257845.9117.815403.376.16
N4P2M210,138.6132.939006.7111.739019.5134.938453.7134.685842.090.46
N0P0M610,236.2135.178744.4105.708885.8131.458513.1136.335239.470.81
Average8638.42110.777599.2389.317348.42102.837052.92107.774710.5960.27
Note: * Values indicate the increasing rate compared with the no fertilizer control (N0P0M0).
Table 5. Effects of fertilization on water productivity under different precipitation patterns.
TreatmentVery Wet YearRelative Wet YearNormal YearRelative Dry YearVery Dry Year
Average of Water Productivity (kg ha−1 mm−1)Increasing Rate (%) *Average of Water Productivity (kg ha−1 mm−1)Increasing Rate (%)Average of Water Productivity (kg ha−1 mm−1)Increasing Rate (%)Average of Water Productivity (kg ha−1 mm−1)Increasing Rate (%)Average of Water Productivity (kg ha−1 mm−1)Increasing Rate (%)
N0P0M09.33 -10.97 -9.34 -10.15 -10.09 -
N1P1M016.80 0.80 17.51 0.60 14.69 0.57 18.50 0.82 12.31 0.22
N2P2M017.56 0.88 20.03 0.83 17.72 0.90 21.24 1.09 14.68 0.46
N3P3M017.87 0.92 19.33 0.76 16.26 0.74 22.08 1.18 14.57 0.44
N4P4M017.90 0.92 18.49 0.69 16.20 0.73 18.30 0.80 13.41 0.33
N2P1M121.36 1.29 23.19 1.11 19.76 1.11 23.95 1.36 17.42 0.73
N3P2M321.60 1.32 22.97 1.09 20.29 1.17 23.65 1.33 17.70 0.75
N4P2M222.69 1.43 23.70 1.16 21.67 1.32 25.60 1.52 19.15 0.90
N0P0M623.73 1.54 22.30 1.03 21.11 1.26 24.15 1.38 18.78 0.86
Average18.76 1.14 19.83 0.91 17.45 0.98 20.84 1.19 15.34 0.59
Note: * Values indicate the increasing rate of water productivity compared with the no fertilizer control (N0P0M0).
Table 6. Results of multi-factor analysis of variance of the effects of fertilization and precipitation on maize yield and WP.
YieldWP
F Valuep ValueF Valuep Value
Fertilization13.180 <0.001 10.966 <0.001
Precipitation17.764 <0.001 5.888 <0.001
Fertilization × Precipitation0.1911.0000.1231.000
Table 7. Pearson’s correlation among yield, SOC, WP and water consumption.
YieldSOCWPWater Consumption
Yield1
SOC0.644 **1
WP0.838 **0.585 **1
Water consumption0.495 **0.223−0.0391
Note: ** At level 0.01 (two-tailed), the correlation was significant, n = 63.
Table 8. Correlation analysis between annual yield and precipitation in each period.
PeriodN0P0M0N1P1M0N2P2M0N3P3M0N4P4M0N2P1M1N3P2M3N4P2M2N0P0M6
Annual precipitation (January–December)0.104* 0.0110.059** 0.006** 0.0060.053* 0.026* 0.035* 0.020
Precipitation during maize growth period (May–September)0.323* 0.0350.124* 0.017* 0.0170.1740.103* 0.049* 0.045
Precipitation during the leisure period before sowing (October–December of the previous year + January–April of the current year)* 0.020.087* 0.040.1060.059* 0.038** 0.007* 0.046** 0.006
Precipitation of the previous year and precipitation before sowing (January–December of the previous year + January–April of the current year)0.1280.130.140.1010.0950.065* 0.0320.164* 0.027
Precipitation in the fallow period and growth period (October–December of the previous year + January–September of the current year) * 0.042** 0.004* 0.013** 0.002** 0.001* 0.021** 0.004** 0.004** 0.001
Note: * At level 0.05 (two-tailed), the correlation was significant; ** At level 0.01 (two-tailed), the correlation was significant, n = 63.
Disclaimer/Publisher’s Note: The statements, opinions and data contained in all publications are solely those of the individual author(s) and contributor(s) and not of MDPI and/or the editor(s). MDPI and/or the editor(s) disclaim responsibility for any injury to people or property resulting from any ideas, methods, instructions or products referred to in the content.