Article

Molecular Regulatory Networks Underlying Root Growth and Development in Crested Wheatgrass (Agropyron cristatum L.)

1
Institute of Animal Science, Chinese Academy of Agricultural Sciences, Beijing 100193, China
2
College of Agro-Grassland Science, Nanjing Agricultural University, Nanjing 210095, China
3
Agros (Beijing) Tech Company Limited, Beijing 101399, China
4
College of Grassland Science, Inner Mongolia Agricultural University/Key Laboratory of Forage Cultivation, Processing and High-Efficiency Utilization, Ministry of Agriculture and Rural Affairs/Key Laboratory of Grassland Resources, Ministry of Education/Key Laboratory of Native Grass Breeding, National Forestry and Grassland Administration, Inner Mongolia, Hohhot 010018, China
*
Author to whom correspondence should be addressed.
These authors contributed equally to this work.
Agriculture 2025, 15(22), 2392; https://doi.org/10.3390/agriculture15222392
Submission received: 1 October 2025 / Revised: 6 November 2025 / Accepted: 17 November 2025 / Published: 19 November 2025
(This article belongs to the Section Crop Genetics, Genomics and Breeding)

Abstract

Crested wheatgrass (Agropyron cristatum) is a perennial forage species characterized by extensive root systems that contribute to ecological restoration and stress resilience. This study aimed to elucidate the regulatory mechanisms of root growth and development through transcriptome analysis at three developmental stages (20, 28, and 42 days after germination). Morphological analyses revealed progressive increases in root length, biomass, and surface area over time. Transcriptomic profiling identified 28,518 differentially expressed genes (DEGs) between R-28 and R-20, 35,581 DEGs between R-42 and R-20, and 24,418 DEGs between R-42 and R-28, indicating extensive transcriptional reprogramming during root development. Functional enrichment analyses highlighted pathways involved in ribosome biogenesis, phenylpropanoid metabolism, and energy regulation. Notably, 45 bHLH, 57 NAC, 56 WRKY, and 6 GRAS genes were differentially expressed and well-annotated, underscoring their regulatory roles in root system development. Furthermore, 65 nitrogen metabolism-related genes and multiple hormone signaling pathways, including auxin, abscisic acid, and ethylene, exhibited dynamic expression patterns coordinating developmental and stress-responsive processes. Collectively, these findings provide novel insights into the regulatory networks governing A. cristatum root development and offer valuable genetic resources for functional genomics studies, ecological restoration efforts, and breeding programs.

1. Introduction

Wheatgrass species are dominant components of northern grassland ecosystems, providing valuable forage resources and playing crucial roles in ecological restoration and germplasm conservation [1,2]. Agropyron cristatum (L.) Gaertn., commonly known as crested wheatgrass, possesses distinctive morphological features such as an extensive root system and erect, caespitose culms. This perennial species establishes rapidly, is easy to cultivate, and produces substantial biomass supported by a well-developed root architecture [3]. Moreover, A. cristatum exhibits remarkable phenotypic plasticity and tolerance to various abiotic stresses, including low temperature, drought, nutrient deficiency, and salinity, allowing it to thrive across a wide range of soil environments [4,5,6]. Owing to these agronomic and ecological advantages, A. cristatum has become an important model for studying stress adaptation and root system development in perennial grasses.
Root tissues form the structural foundation of terrestrial plants, supporting water and nutrient uptake as well as serving as major sites of energy storage and carbon sequestration [7]. The roots of A. cristatum exhibit strong tillering capacity and remarkable environmental resilience [8]. Its well-developed fibrous root system, characterized by dense proliferation and deep soil penetration, allows the species to thrive in sandy soils and makes it an excellent candidate for soil conservation and revegetation in arid and semi-arid regions [9]. Beyond their ecological significance, the molecular mechanisms regulating root growth and development are equally important. Nitrogen metabolism plays a central role in sustaining vigorous root proliferation and adaptive responses to nutrient availability [10]. In addition, transcription factors act as key regulators coordinating developmental and stress-responsive pathways, while phytohormone signaling networks—including auxin, cytokinin, and abscisic acid—govern cell division, elongation, and root system plasticity [11]. Collectively, these regulatory pathways form an integrated network that controls root development and environmental adaptability in A. cristatum, providing the conceptual framework for the present study.
A. cristatum is a perennial species within the genus, encompassing diploid (2n = 2x = 14), tetraploid (2n = 4x = 28), and hexaploid (2n = 6x = 42) cytotypes [12,13]. Its genomic complexity, together with the limited availability of transcriptomic data, has constrained the efficient utilization of genetic resources and hindered in-depth molecular characterization. RNA sequencing (RNA-Seq) provides a powerful, high-throughput approach for profiling transcriptomes, enabling precise quantification of gene expression and the detection of transcript variants across diverse biological contexts [14]. Functional enrichment analyses based on Gene Ontology (GO) and Kyoto Encyclopedia of Genes and Genomes (KEGG) pathways further facilitate the interpretation of large-scale expression datasets by revealing key biological processes and regulatory networks. Although second-generation sequencing platforms offer high throughput and cost efficiency, their relatively short read lengths often complicate full-length transcript assembly and may introduce amplification bias [15,16]. Comparative transcriptomic analyses across developmental stages can uncover temporal expression dynamics and identify candidate regulatory genes, providing a foundation for elucidating the molecular mechanisms underlying root growth and development in A. cristatum.
Transcriptomic analyses in various grasses have identified key regulatory genes associated with stress adaptation and developmental control. In Bermudagrass (Cynodon dactylon), salt stress induces genes encoding cell wall-modifying enzymes (xyloglucan endotransglucosylases/hydrolases), reactive oxygen species (ROS)-scavenging peroxidases, and hormone signaling components related to abscisic acid and auxin pathways, together with stress-responsive transcription factors such as bHLH, WRKY, and MYB, thereby promoting adaptive root growth [17]. In tall fescue (Festuca arundinacea), heat stress activates molecular chaperones, antioxidant enzymes, and thermotolerance signaling networks that enhance cellular protection [18]. Similarly, in Agropyron mongolicum, cold stress influences abscisic acid signaling, as well as NAC and bZIP transcription factors, forming co-regulated gene modules that contribute to freezing tolerance and winter survival [19]. Although transcriptomic studies in A. cristatum have identified genes associated with agronomic traits such as tillering ability and thousand-kernel weight [20,21], its intrinsic molecular mechanisms underlying root growth and developmental regulation remain largely unexplored.
This study aimed to elucidate the molecular basis of root growth and development in A. cristatum by identifying key regulatory genes and characterizing their associated pathways. Integrating morphological observations with transcriptomic analyses across three developmental stages, we identified differentially expressed genes and performed functional enrichment to determine their biological roles. The results highlighted the central involvement of nitrogen metabolism, hormone signaling, and transcription factor-mediated regulation in root development. These findings provide valuable insights into the molecular mechanisms governing root formation in A. cristatum, offering a foundation for enhancing stress resilience and productivity in forage and cereal crops, with broader implications for sustainable agriculture.

2. Material and Methods

2.1. Plant Materials and Growth Conditions

Five-day-old seedlings were transferred to a controlled-environment growth chamber for hydroponic cultivation under standardized growth conditions. The chamber was maintained at a 16 h light/8 h dark photoperiod, with a diurnal temperature of 25 °C and a nocturnal temperature of 20 °C, relative humidity of 60%, and a photosynthetic photon flux density (PPFD) of 500 μmol m−2 s−1. The hydroponic system consisted of plastic containers (42 cm × 30 cm × 12 cm) and floating plates (44 cm × 32 cm × 2 cm) containing 24 evenly spaced holes. Seedlings were secured at the tillering node using pre-cut sponges and positioned in the holes so that their roots were submerged in Hoagland nutrient solution. The nutrient solution was renewed weekly, and its composition was as follows: 2.5 mM KNO3, 0.5 mM NH4NO3, 1 mM MgSO4, 0.5 mM KH2PO4, 2 mM Ca(NO3)2, 25 μM FeSO4, 25 μM Na2-EDTA, 2.5 μM KI, 50 μM MnSO4, 50 μM H3BO3, 0.05 μM CuSO4, 15 μM ZnSO4, 0.5 μM NaMoO4, and 0.05 μM CoCl2 [22]. Phenotypically uniform seedlings exhibiting vigorous growth were selected for sampling. Root tissues were harvested at 20, 28, and 42 days after germination, with three independent biological replicates collected per timepoint. Samples were immediately transferred to cryogenic vials, flash-frozen in liquid nitrogen, and stored at −80 °C until further analysis.

2.2. Root Morphology Measurements

Root growth traits of A. cristatum were evaluated at 20, 28, and 42 days after germination. For morphological analyses, three biological replicates of entire root systems were collected at each timepoint, individually placed in 10 mL centrifuge tubes containing water, and scanned using a root scanning system (Seiko Epson Corporation, Suwa, Japan) equipped with WinRHIZO image analysis software (version 5.0). The total root length, surface area, and volume were subsequently quantified from the scanned images. In parallel, manual measurements were conducted to validate scanning results: root length was measured using a ruler on 30 representative roots per timepoint, while root fresh and dry biomasses were determined from four independent root systems. Fresh weight was recorded immediately after harvest, and dry weight was measured following oven-drying at 80 °C until a constant weight was achieved.

2.3. RNA Extraction and RNA-Seq Library Construction

Total RNA was extracted using an Eastep Super Total RNA Extraction Kit (Shanghai Promega Bioproducts Co., Ltd., Shanghai, China). RNA concentration and integrity were assessed using a micro-spectrophotometer (Implen NP80 Touch, Munich, Germany). RNA quality was further evaluated for degradation and contamination by 1% agarose gel electrophoresis, and RNA Integrity Numbers (RIN) were determined using an Agilent 2100 Bioanalyzer system (Agilent Technologies, Santa Clara, CA, USA, Table S1).
RNA-seq libraries were prepared using the Fast RNA-seq Library Preparation Kit V2 (ABclonal Technology Co., Ltd., Wuhan, China) according to the manufacturer’s protocol. Briefly, polyadenylated RNA was enriched from 1 μg of total RNA using oligo (dT) magnetic beads and subsequently fragmented at 94 °C. First-strand cDNA was synthesized using random hexamer primers and reverse transcriptase, followed by second-strand synthesis to generate double-stranded cDNA. Following end repair, A-tailing, and adaptor ligation, cDNA fragments were purified with AMPure XP beads (Brea, CA, USA). Library fragments with an average insert size of 250–300 bp were amplified by 16 PCR cycles, and their quality and insert size distributions were assessed using an Agilent 2100 Bioanalyzer (Santa Clara, CA, USA). Quantified libraries were pooled in equimolar concentrations and subjected to high-throughput paired-end sequencing on the Illumina NovaSeq X Plus platform (San Diego, CA, USA).

2.4. Transcriptome Sequencing and Quality Assessment

Second-generation RNA sequencing was conducted on nine biological samples using the Illumina platform for library construction and high-throughput sequencing. The quality of the raw sequencing data was assessed and filtered using fastp (version 1.0) [23]. Clean reads were obtained by removing adaptor-contaminated sequences, reads with more than 10% ambiguous bases (N), poly(A) sequences, and reads in which over 50% of bases had a quality score ≤ Q20. Transcript quantification was performed using RSEM (version 1.3.0) [24] with available reference isoforms as the alignment basis. Gene detection status was statistically evaluated across all samples, and sequencing reads were mapped to quantify transcript abundance.

2.5. Differentially Expressed Gene Analysis and Functional Annotation

Root tissue samples from A. cristatum at different developmental timepoints were organized into three pairwise comparisons: R-28 versus R-20, R-42 versus R-20, and R-42 versus R-28. Raw read counts for each gene were obtained using featureCounts [25]. Differential expression analysis was performed using the DESeq2 package (v1.10.1) in R [26]. Genes with an absolute value of log2 fold change (|log2FC|) ≥ 1 and a false discovery rate (FDR) < 0.05, adjusted by the Benjamini–Hochberg method, were considered as differentially expressed genes (DEGs).
Functional annotation of differentially expressed genes (DEGs) was performed through sequence alignment against multiple public databases, including Gene Ontology (GO), Kyoto Encyclopedia of Genes and Genomes (KEGG, v0.8.36), NCBI non-redundant protein (NR, v0.8.36) and nucleotide (NT, ncbi-blast 2.7.1+), Pfam (HMMER 3.1), and Swiss-Prot (v0.8.36) databases, using DIAMOND BLASTx (v2.1.8) with an E-value threshold of 1 × 10⁻⁵ [27]. GO terms were assigned based on annotation results and categorized into three functional groups: biological process (BP), molecular function (MF), and cellular component (CC). KEGG pathway annotation and enrichment analyses were conducted using KOBAS and the clusterProfiler (v4.10.0) R package [28,29] to identify significantly enriched metabolic and signal transduction pathways. Visualization of GO and KEGG enrichment results was carried out on the Novogene Bioinformatics Cloud Platform (https://cn.novogene.com/ (accessed on 2 June 2025)).

2.6. Quantitative Real-Time PCR Analysis

High-quality RNA samples were normalized to 200 ng/μL for cDNA synthesis using a UnionScript First-strand cDNA Synthesis Mix (Beijing Jinsha Biotechnology Co., Ltd., Beijing, China). Quantitative real-time PCR was performed using Taq Pro Universal SYBR qPCR Master Mix (Nanjing Novozyme Biotechnology Co., Ltd., Nanjing, China) on an ABI 7300 real-time PCR system (Foster City, CA, USA). Gene-specific primers were designed based on NCBI database sequences (https://www.ncbi.nlm.nih.gov/tools/primer-blast/, Table S2, accessed on 17 July 2025), The genes selected for qPCR analysis were COG1, FtsH11, γ-ECS, CPI1, DHAR, and GR. The β-ACTIN gene in A. cristatum was served as the internal reference gene. Relative transcript expression levels were calculated using the 2−ΔΔCt method with three biological replicates per treatment [30]. Statistical analysis was conducted using one-way ANOVA (p ≤ 0.05), and data are presented as mean ± standard error of the mean (n = 3). Data visualization was performed using GraphPad Prism (v 9.0).

2.7. Data Analysis and Statistical Methods

Data organization and analysis were performed using Microsoft Excel 2020 and GraphPad Prism 8. Statistical analysis was conducted using one-way ANOVA (p ≤ 0.05), and data are presented as mean ± standard error of the mean (n = 3).

3. Results

3.1. Plant Root Growth Index Determination

To characterize morphological dynamics during root development in A. cristatum, root architectural parameters were systematically evaluated across three developmental timepoints (Figure 1A–C). At 20 days after germination, the root fresh and dry weights were 0.20 g and 0.02 g, respectively. Correspondingly, the mean root length and total root length were 12.69 cm and 34.69 cm, while the root surface area and volume reached 1.58 cm2 and 0.01 cm3. By 28 days, the root fresh weight increased to 0.57 g and dry weight to 0.06 g, with root length and total root length extending to 15.48 cm and 87.83 cm. Root surface area and volume also expanded to 4.08 cm2 and 0.02 cm3. At 42 days, roots exhibited pronounced growth, with fresh and dry weights reaching 3.00 g and 0.74 g, root length and total root length increasing to 17.66 cm and 197.16 cm, and surface area and volume further rising to 10.42 cm2 and 0.05 cm3. These quantitative measurements were consistent with observed morphological patterns: roots at 20 days appeared sparse and short (Figure 1D), extensive branching and elongation were apparent at 28 days (Figure 1E), and a dense fibrous root system had formed by 42 days (Figure 1F). Collectively, these results reveal a clear temporal trend of vigorous root system development in A. cristatum.

3.2. Differential Expression Genes in Roots of A. cristatum s at Different Sampling Days

To elucidate the transcriptional dynamics underlying root development in A. cristatum, differential gene expression analysis was conducted across three developmental stages. A total of 28,518 differentially expressed genes (DEGs) were identified between R-28 and R-20 (17,829 upregulated and 10,689 downregulated, Figure 2A), 35,581 DEGs between R-42 and R-20 (23,668 upregulated and 11,913 downregulated, Figure 2B), and 24,418 DEGs between R-42 and R-28 (11,520 upregulated and 12,898 downregulated, Figure 2C). As illustrated by the Venn diagram (Figure 2D), 6594 DEGs were shared between R-28 vs. R-20 and R-42 vs. R-20, 9208 DEGs overlapped between R-28 vs. R-20 and R-42 vs. R-28, and 9394 DEGs were common to both R-42 vs. R-20 and R-42 vs. R-28. Notably, 254 DEGs were consistently differentially expressed across all three comparisons.
Functional classification of these 254 shared DEGs revealed that approximately 5% were associated with cellular processes (mainly transport and catabolism), 5% with environmental information processing (signal transduction), 25% with genetic information processing (translation, folding, sorting and degradation, and transcription), 60% with metabolism (including energy metabolism, global and overview maps, carbohydrate and lipid metabolism, biosynthesis of secondary metabolites, and amino acid metabolism), and 5% with organismal systems (aging and environmental adaptation). Altogether, these results indicate that metabolic and genetic information processing pathways were the predominant molecular processes governing root developmental transitions in A. cristatum.

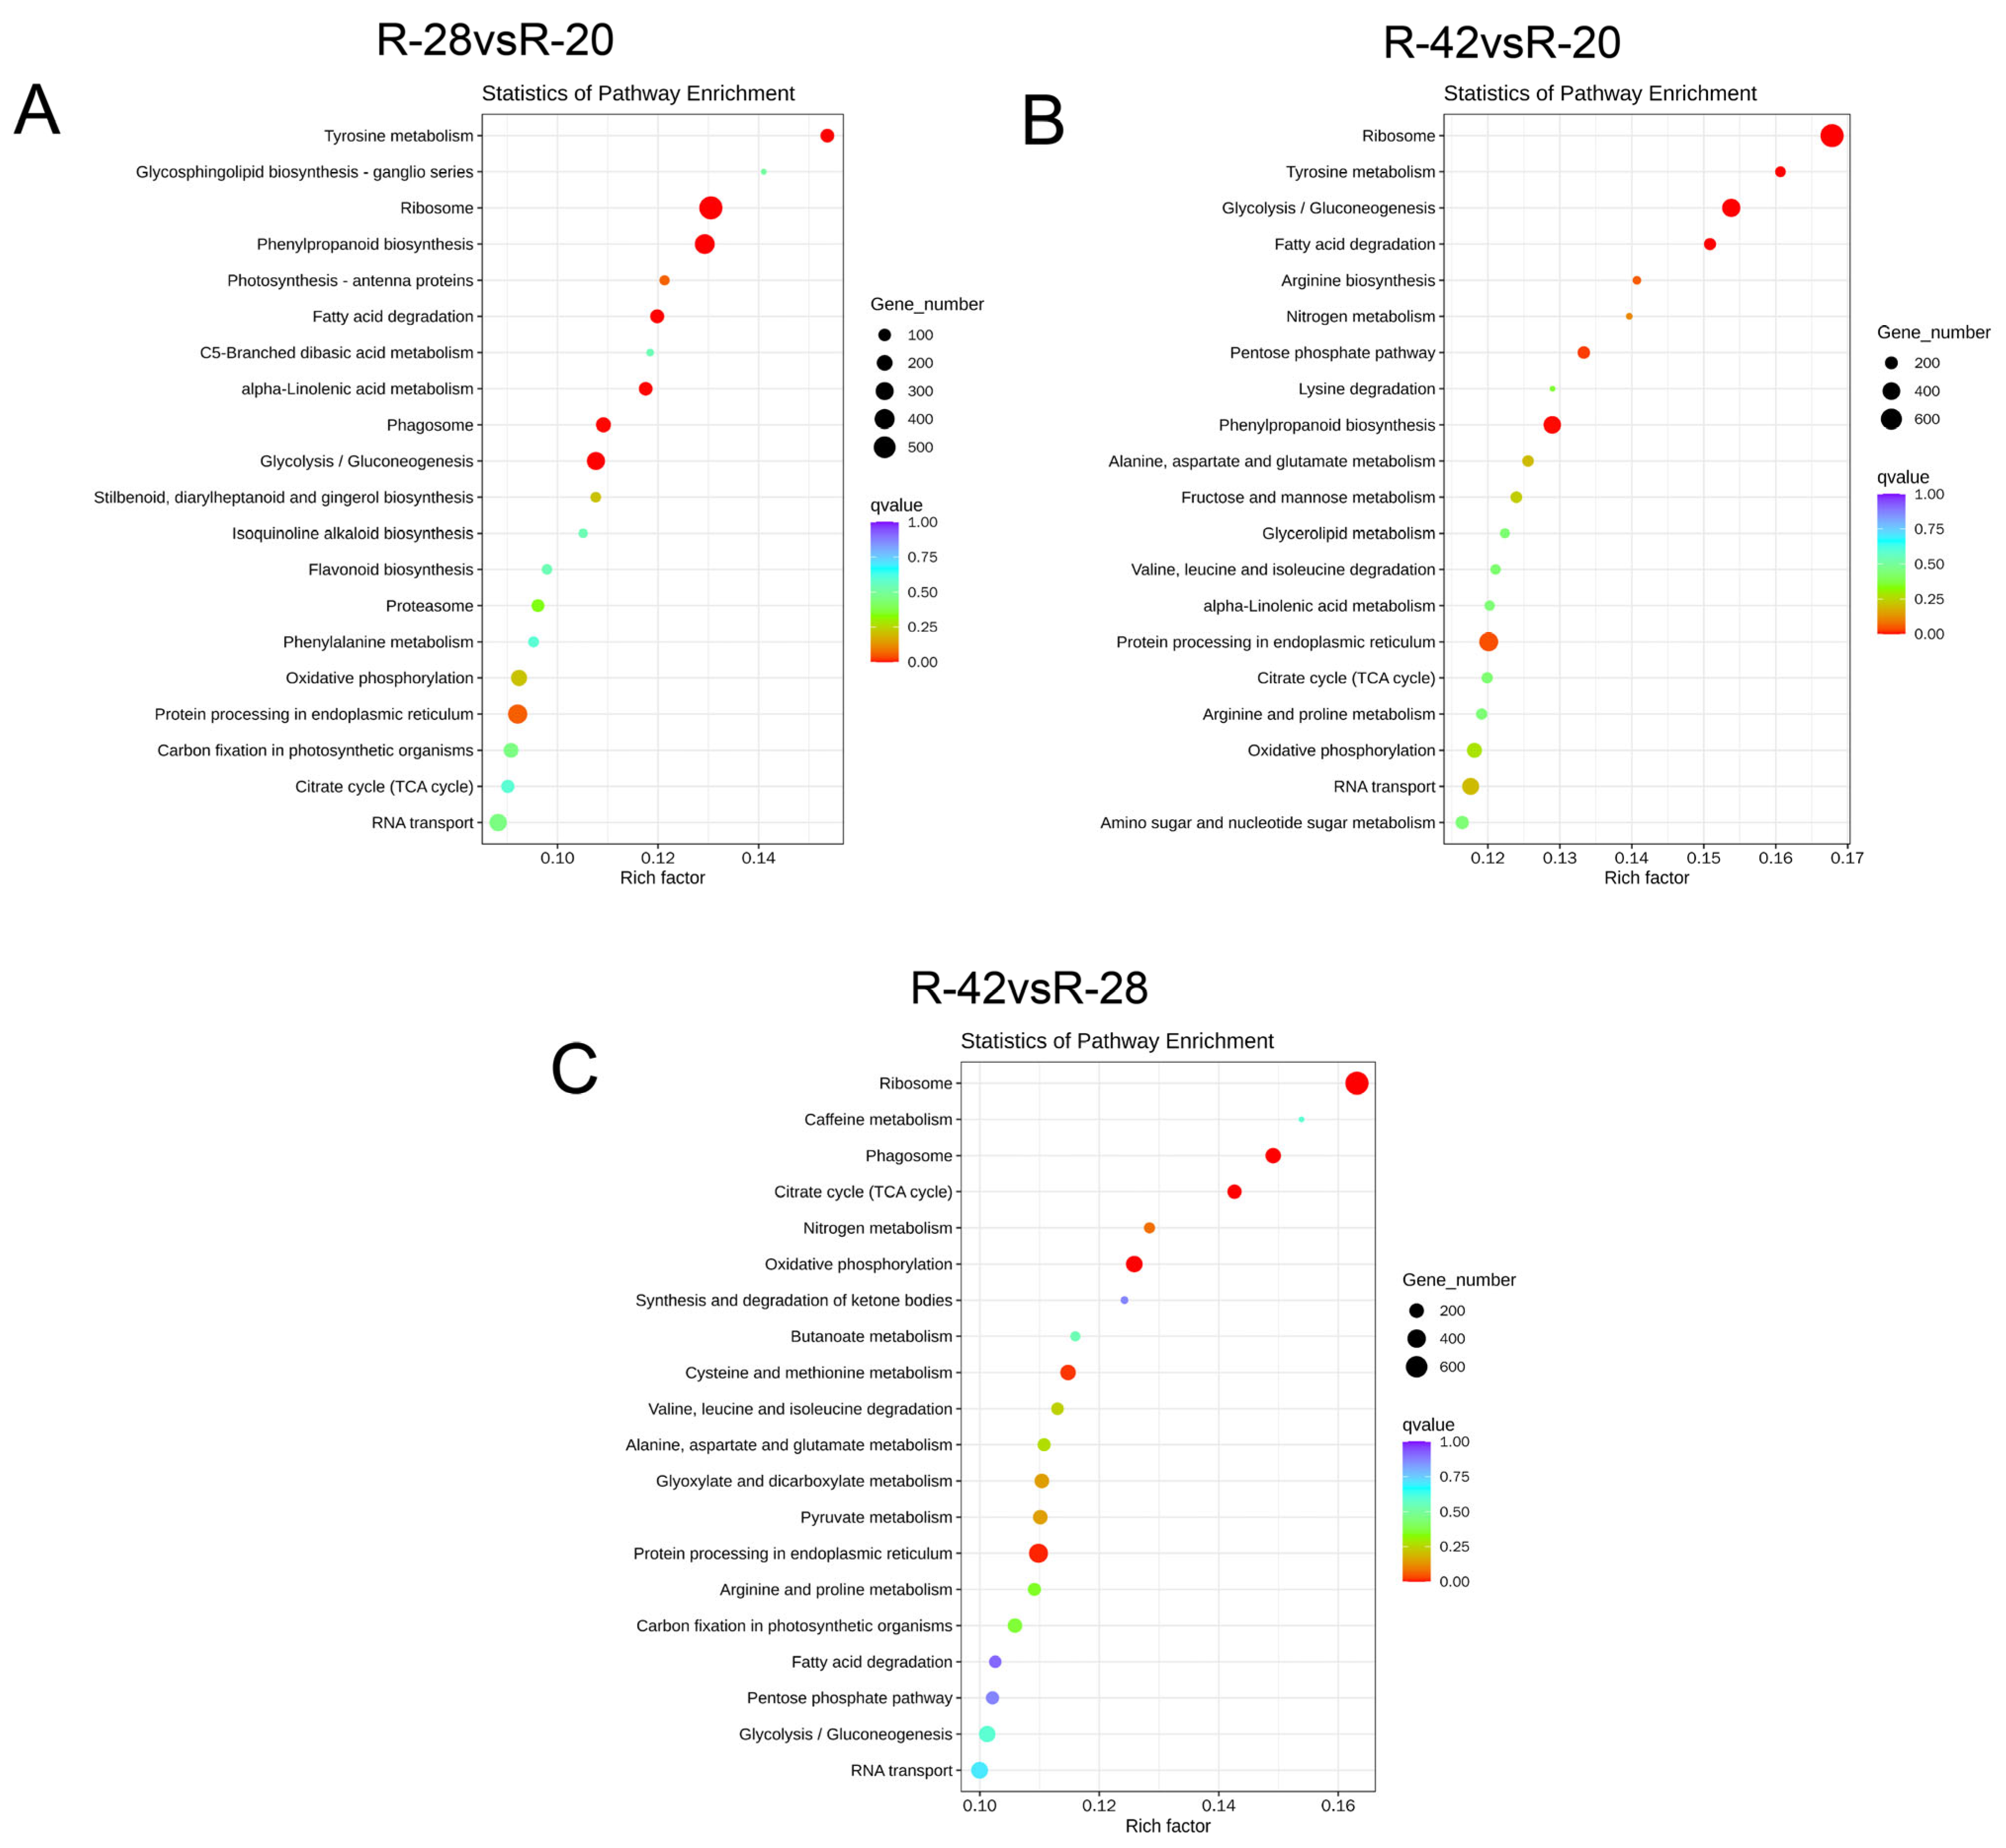
3.3. KEGG Classification and Enrichment Analysis of Differentially Expressed Genes

To investigate the functional pathways associated with root development at different growth timepoints, KEGG pathway enrichment analysis was performed on differentially expressed genes (DEGs) from root tissues at R-20, R-28, and R-42. Overall, the DEGs were predominantly enriched in pathways related to ribosome biogenesis, phenylpropanoid biosynthesis, protein processing in the endoplasmic reticulum, and tyrosine metabolism.
In the R-28 vs. R-20 comparison, DEGs were primarily concentrated in ribosome, protein processing in the endoplasmic reticulum, oxidative phosphorylation, and phagosome pathways, with additional enrichment in the TCA cycle and cysteine and methionine metabolism (Figure 3A). Notably, 80 genes were assigned to nitrogen metabolism and 131 to plant hormone signal transduction. In the R-42 vs. R-20 comparison, DEGs were enriched in ribosome, glyoxylate and dicarboxylate metabolism, phenylpropanoid biosynthesis, glycolysis/gluconeogenesis, fatty acid degradation, and tyrosine metabolism pathways (Figure 3B), including 87 genes in nitrogen metabolism and 177 in plant hormone signal transduction. For the R-42 vs. R-28 comparison, DEGs were concentrated in ribosome, phenylpropanoid biosynthesis, tyrosine metabolism, fatty acid degradation, glycolysis/gluconeogenesis, and alpha-linolenic acid metabolism pathways (Figure 3C), with 55 genes enriched in nitrogen metabolism and 102 in plant hormone signal transduction.

3.4. Transcription Factor Analysis During Root Development

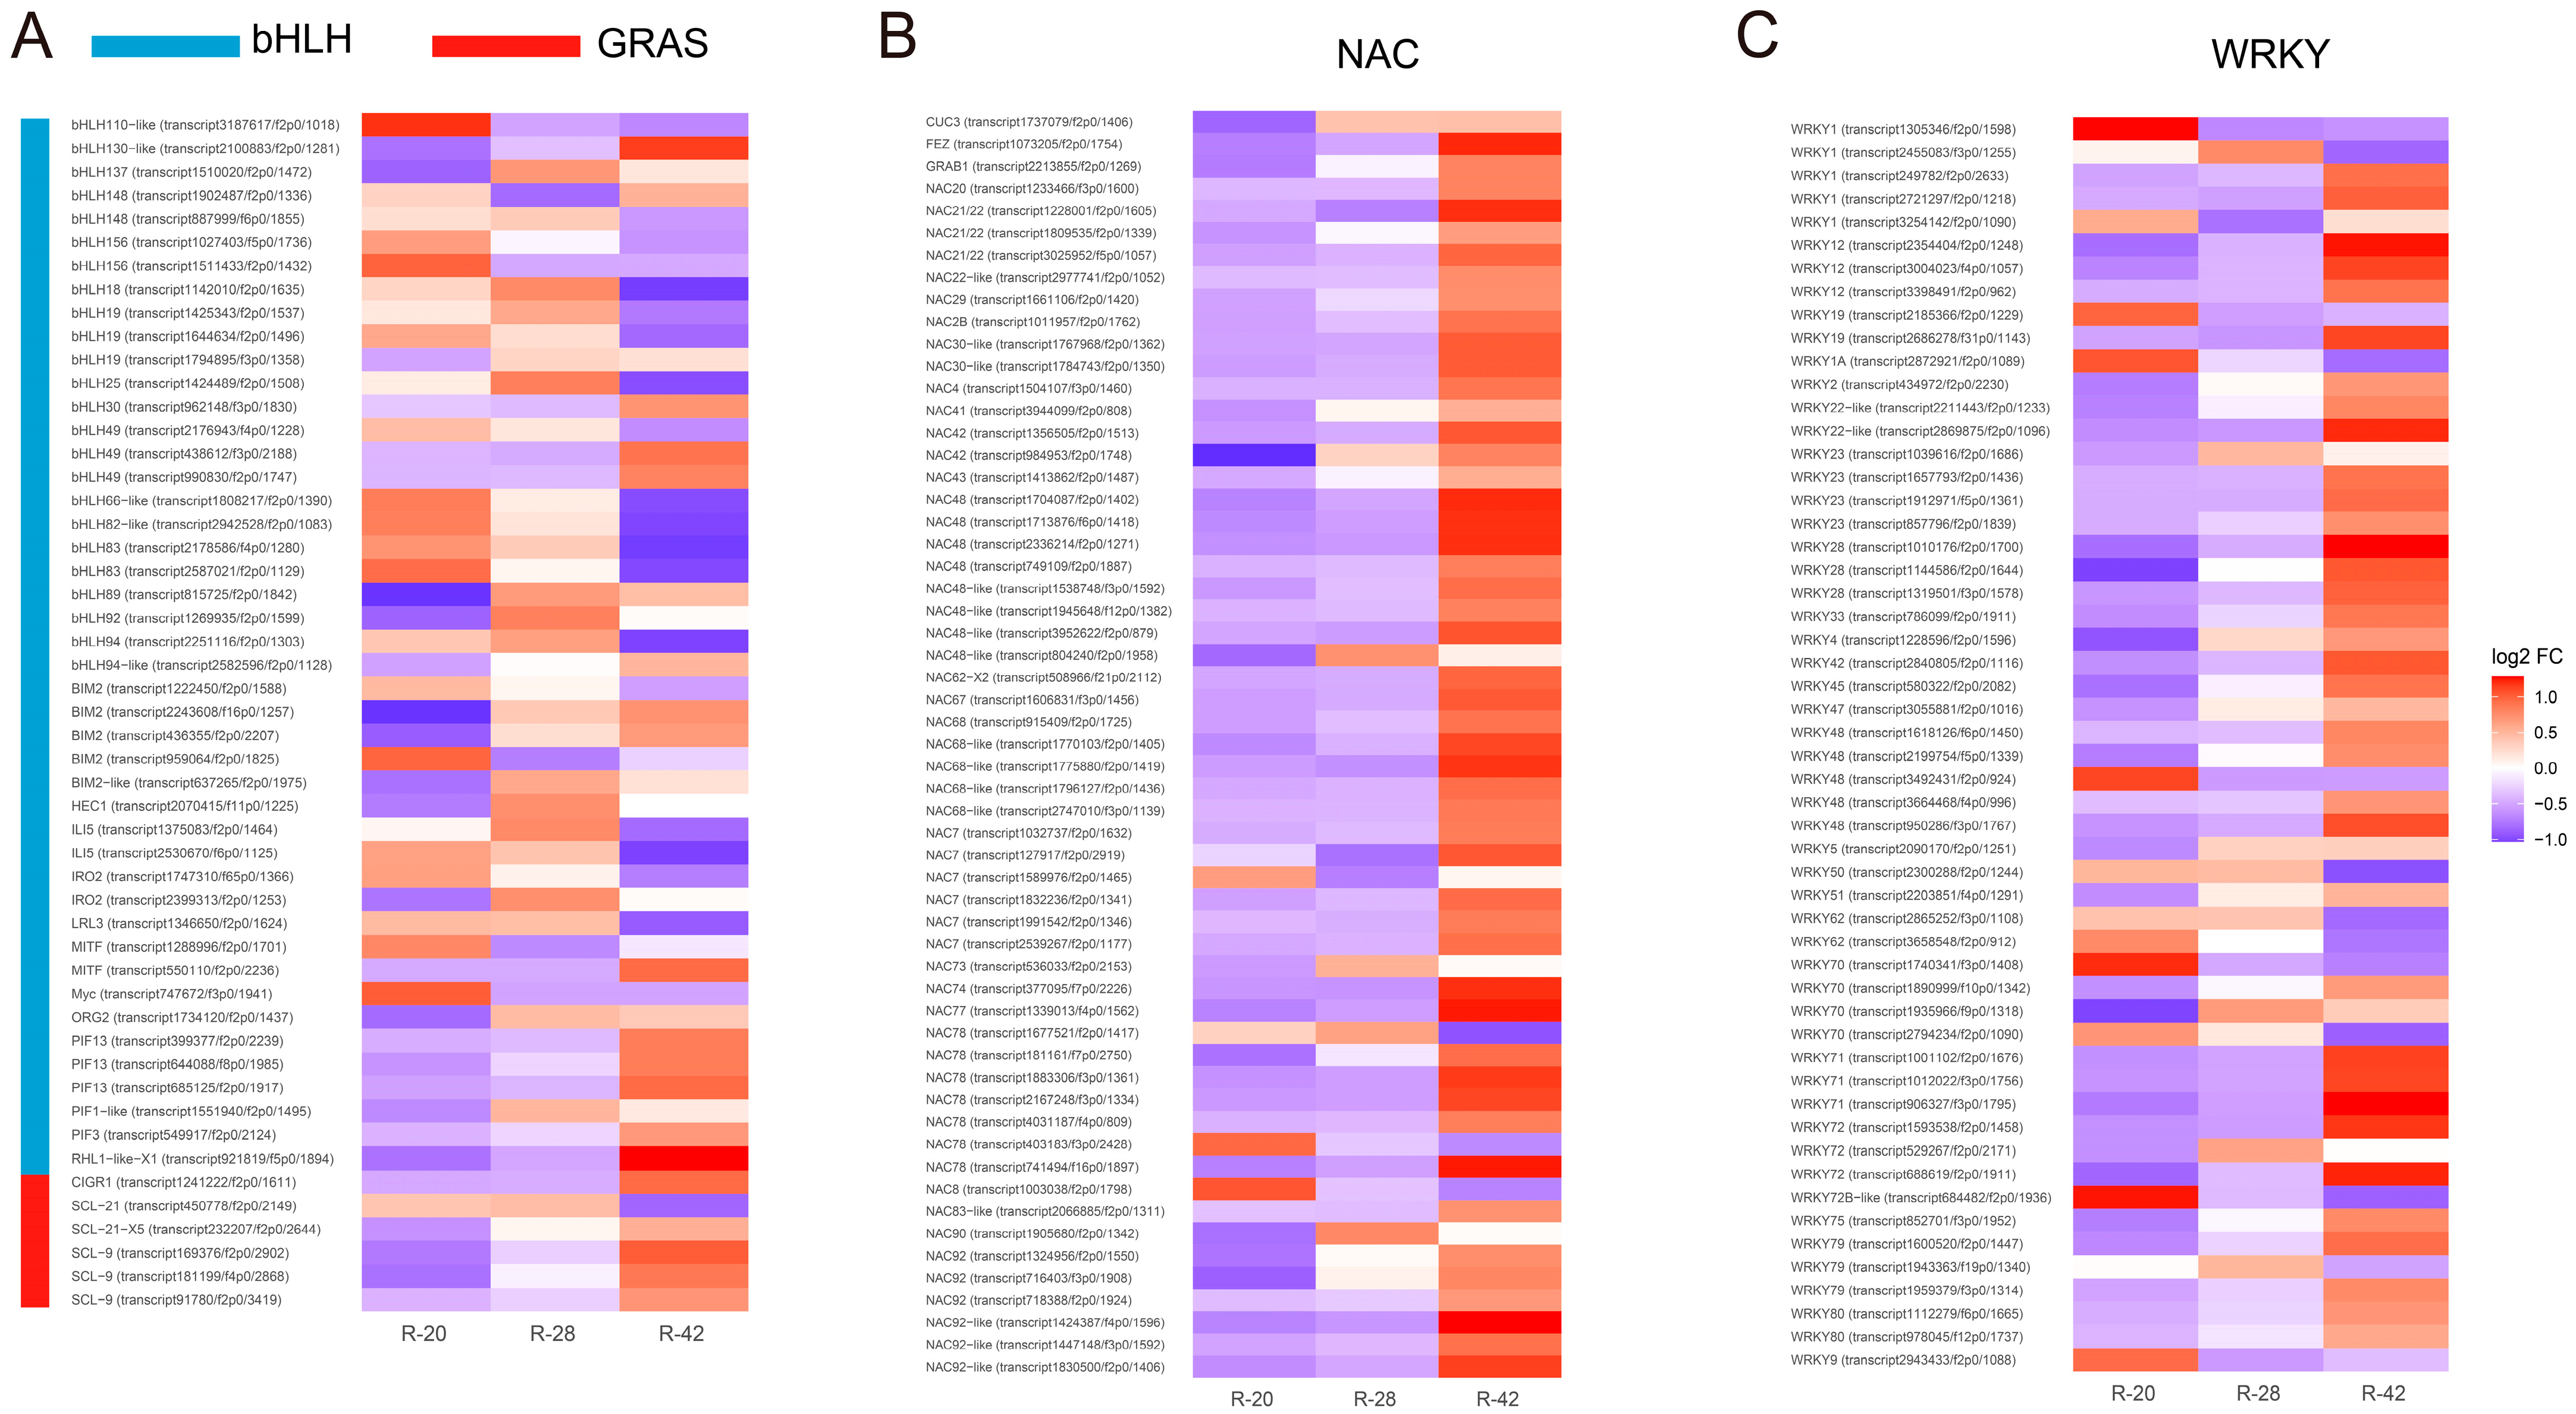
To further characterize the transcriptional regulation underlying root development, transcription factor (TF) families were systematically analyzed across different developmental timepoints. The Venn diagram (Figure 4A) showed that 18 transcription factors (TFs) were commonly differentially expressed across all three pairwise comparisons, suggesting that they may function as key regulators of root system development. In the R-28vsR-20 comparison (Figure 4B), members of the AP2/ERF-ERF, NAC, bZIP, MYB, and WRKY families were predominantly up-regulated, while several C2H2, GARP-G2-like, and B3 family genes showed down-regulation. For R-42vsR-20 (Figure 4C), a marked expansion of differentially expressed TFs was observed, with substantial induction of AP2/ERF-ERF, NAC, and WRKY genes, accompanied by repression of multiple C2H2, bHLH, and MYB family members. In the R-42vsR-28 comparison (Figure 4D), a similar trend of up-regulation was evident for AP2/ERF-ERF and NAC, whereas several bHLH and MYB-related TFs were down-regulated. These results highlight timepoint-specific transcriptional reprogramming, with certain TF families functioning as key drivers of root growth and developmental transitions. Further analysis focused on four transcription factor families—bHLH, NAC, WRKY, and GRAS—that exhibited particularly pronounced differential expression patterns throughout the developmental series (Figure 5A–C, Table S3). The differentially expressed transcription factor genes displayed dynamic expression changes across the R-20, R-28, and R-42 developmental timepoints. Notably, the bHLH family included 45 genes, with 11 showing sustained upregulation and 12 showing consistent downregulation. The NAC family comprised 57 genes, among which 43 were continuously upregulated and 3 were consistently downregulated. In the WRKY family, 56 genes were identified, with 6 exhibiting sustained upregulation and 35 showing persistent downregulation. The GRAS family consisted of 6 genes, of which 5 were consistently upregulated. Among the three pairwise comparisons, the R-42 vs. R-20 contrast exhibited the strongest transcriptional activity, with 23 transcripts showing log2(fold change) values greater than 10. Most of these genes displayed minimal variation in R-28 vs. R-20 and R-42 vs. R-28, indicating that their marked induction primarily occurred during the later developmental stage (R-42 vs. R-20). Representative upregulated transcripts include NAC78, SUSIBA2-like, NAC48, and NAC92-like.

3.5. Nitrogen Metabolic Network Dynamics During Root Development

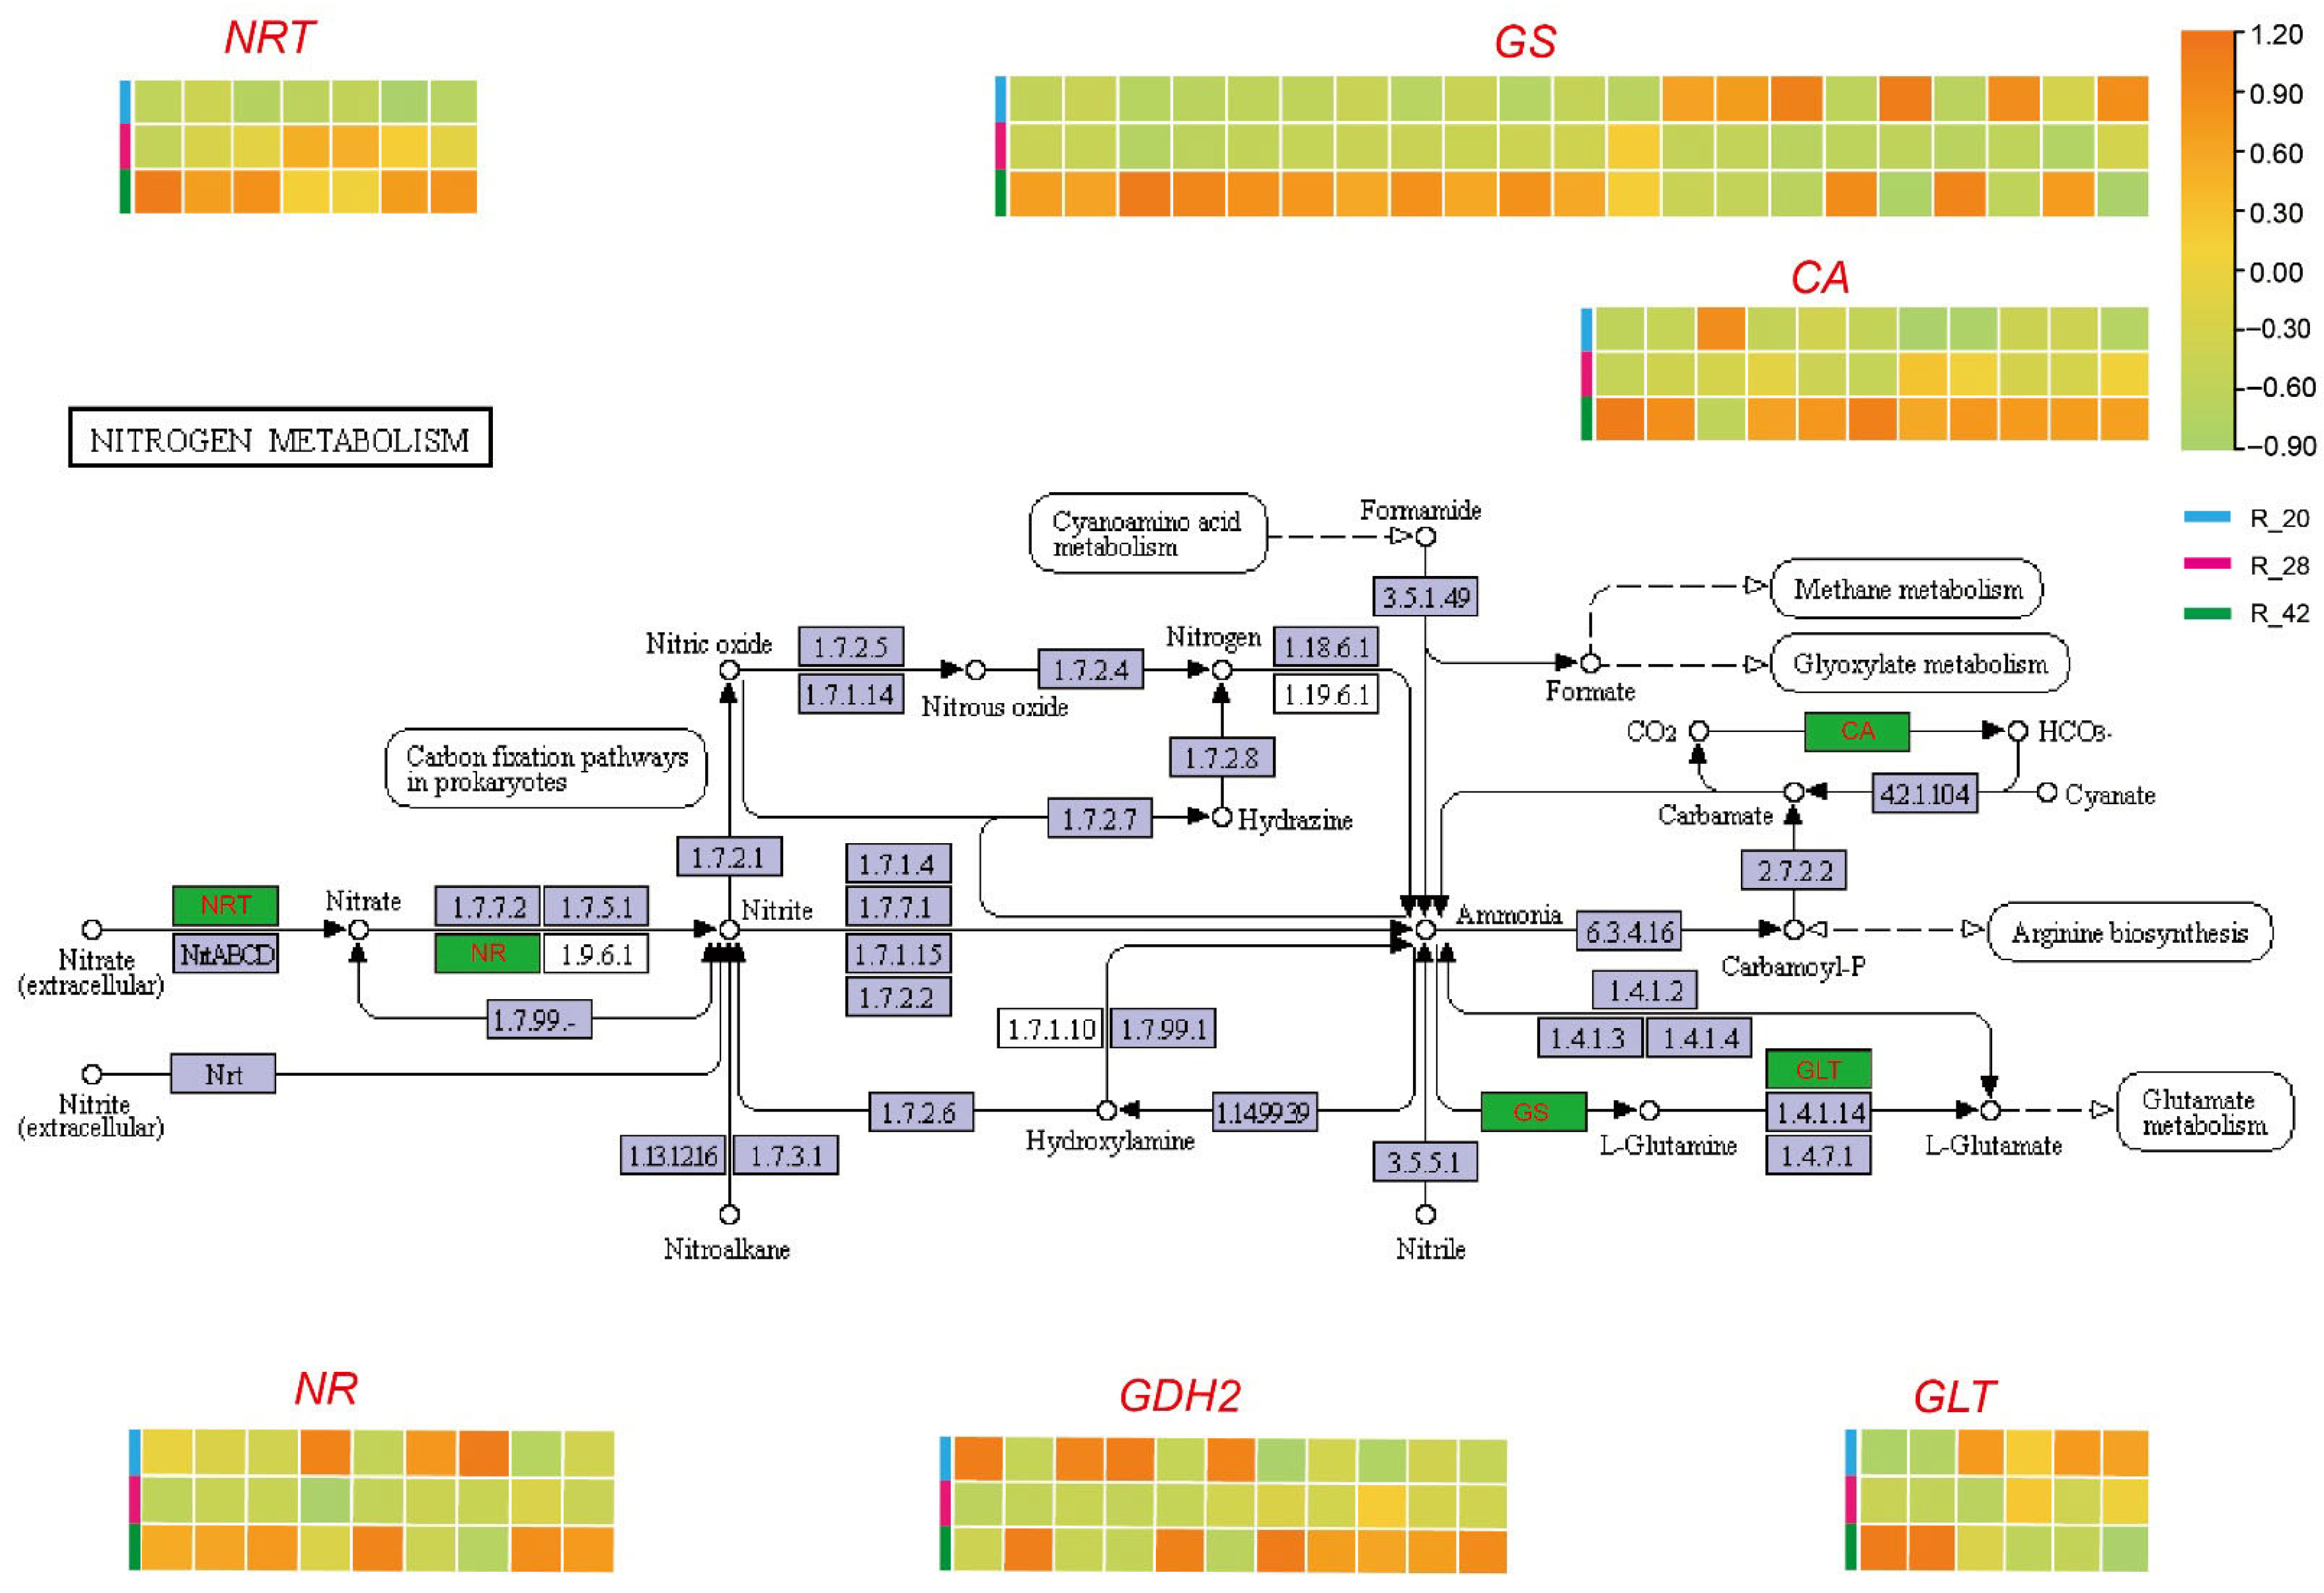
Nitrogen metabolism emerged as a critical regulatory network governing the development of A. cristatum roots, encompassing 65 differentially expressed genes organized into three functionally distinct categories that orchestrate nitrogen acquisition, assimilation, and carbon-nitrogen metabolic integration (Figure 6, Table S4).
The nitrogen metabolic network in the roots of A. cristatum showed different spatiotemporal expression patterns across important biosynthetic pathways as development progressed. Seven NRT genes—six NRT2.1 and one NRT2.3 isoform—showed progressively higher transcription levels during developmental transitions in the nitrate transport machinery. This means that the plant was better able to take up nitrate. Conversely, the nitrate reduction machinery, consisting of nine NADPH-dependent nitrate reductase (NADPH-NR) genes, exhibited consistent transcriptional repression at successive developmental stages.
Genes mediating carbon metabolism through the carbonic anhydrase (CA) pathway predominantly exhibited transcriptional stability or upregulation. Among eleven CA genes (nine CA and two CA-X2 isoforms), only one CA gene underwent downregulation, indicating sustained metabolic support for carbon fixation processes and carbon skeleton biosynthesis. The glutamine synthetase (GS) pathway comprised 21 genes (nine GS, three GS1, six GS1_2, and three GSr1), among which 16 exhibited transcriptional upregulation and five exhibited transcriptional repression. Concomitantly, the ferredoxin-dependent glutamate synthase (Fd-GOGAT) and glutamate transporter (GLT) pathways encompassed four Fd-GOGAT and two GLT1 genes, respectively, with both GLT1 genes demonstrating significant downregulation. The glutamate dehydrogenase (GDH) pathway showed complex regulation, with six GDH2 and one gdhA gene predominantly upregulated, while one GDH2 and three gdhA genes exhibited decreased transcriptional activity.
Compared with the other two pairwise comparisons (R-28 vs. R-20 and R-42 vs. R-28), the R-42 vs. R-20 contrast showed much stronger transcriptional changes. Notably, NRT2.1, GS1, and several GS1_2 isoforms exhibited log2(fold change) values greater than 10.

3.6. Phytohormone Signaling Networks in Root Development

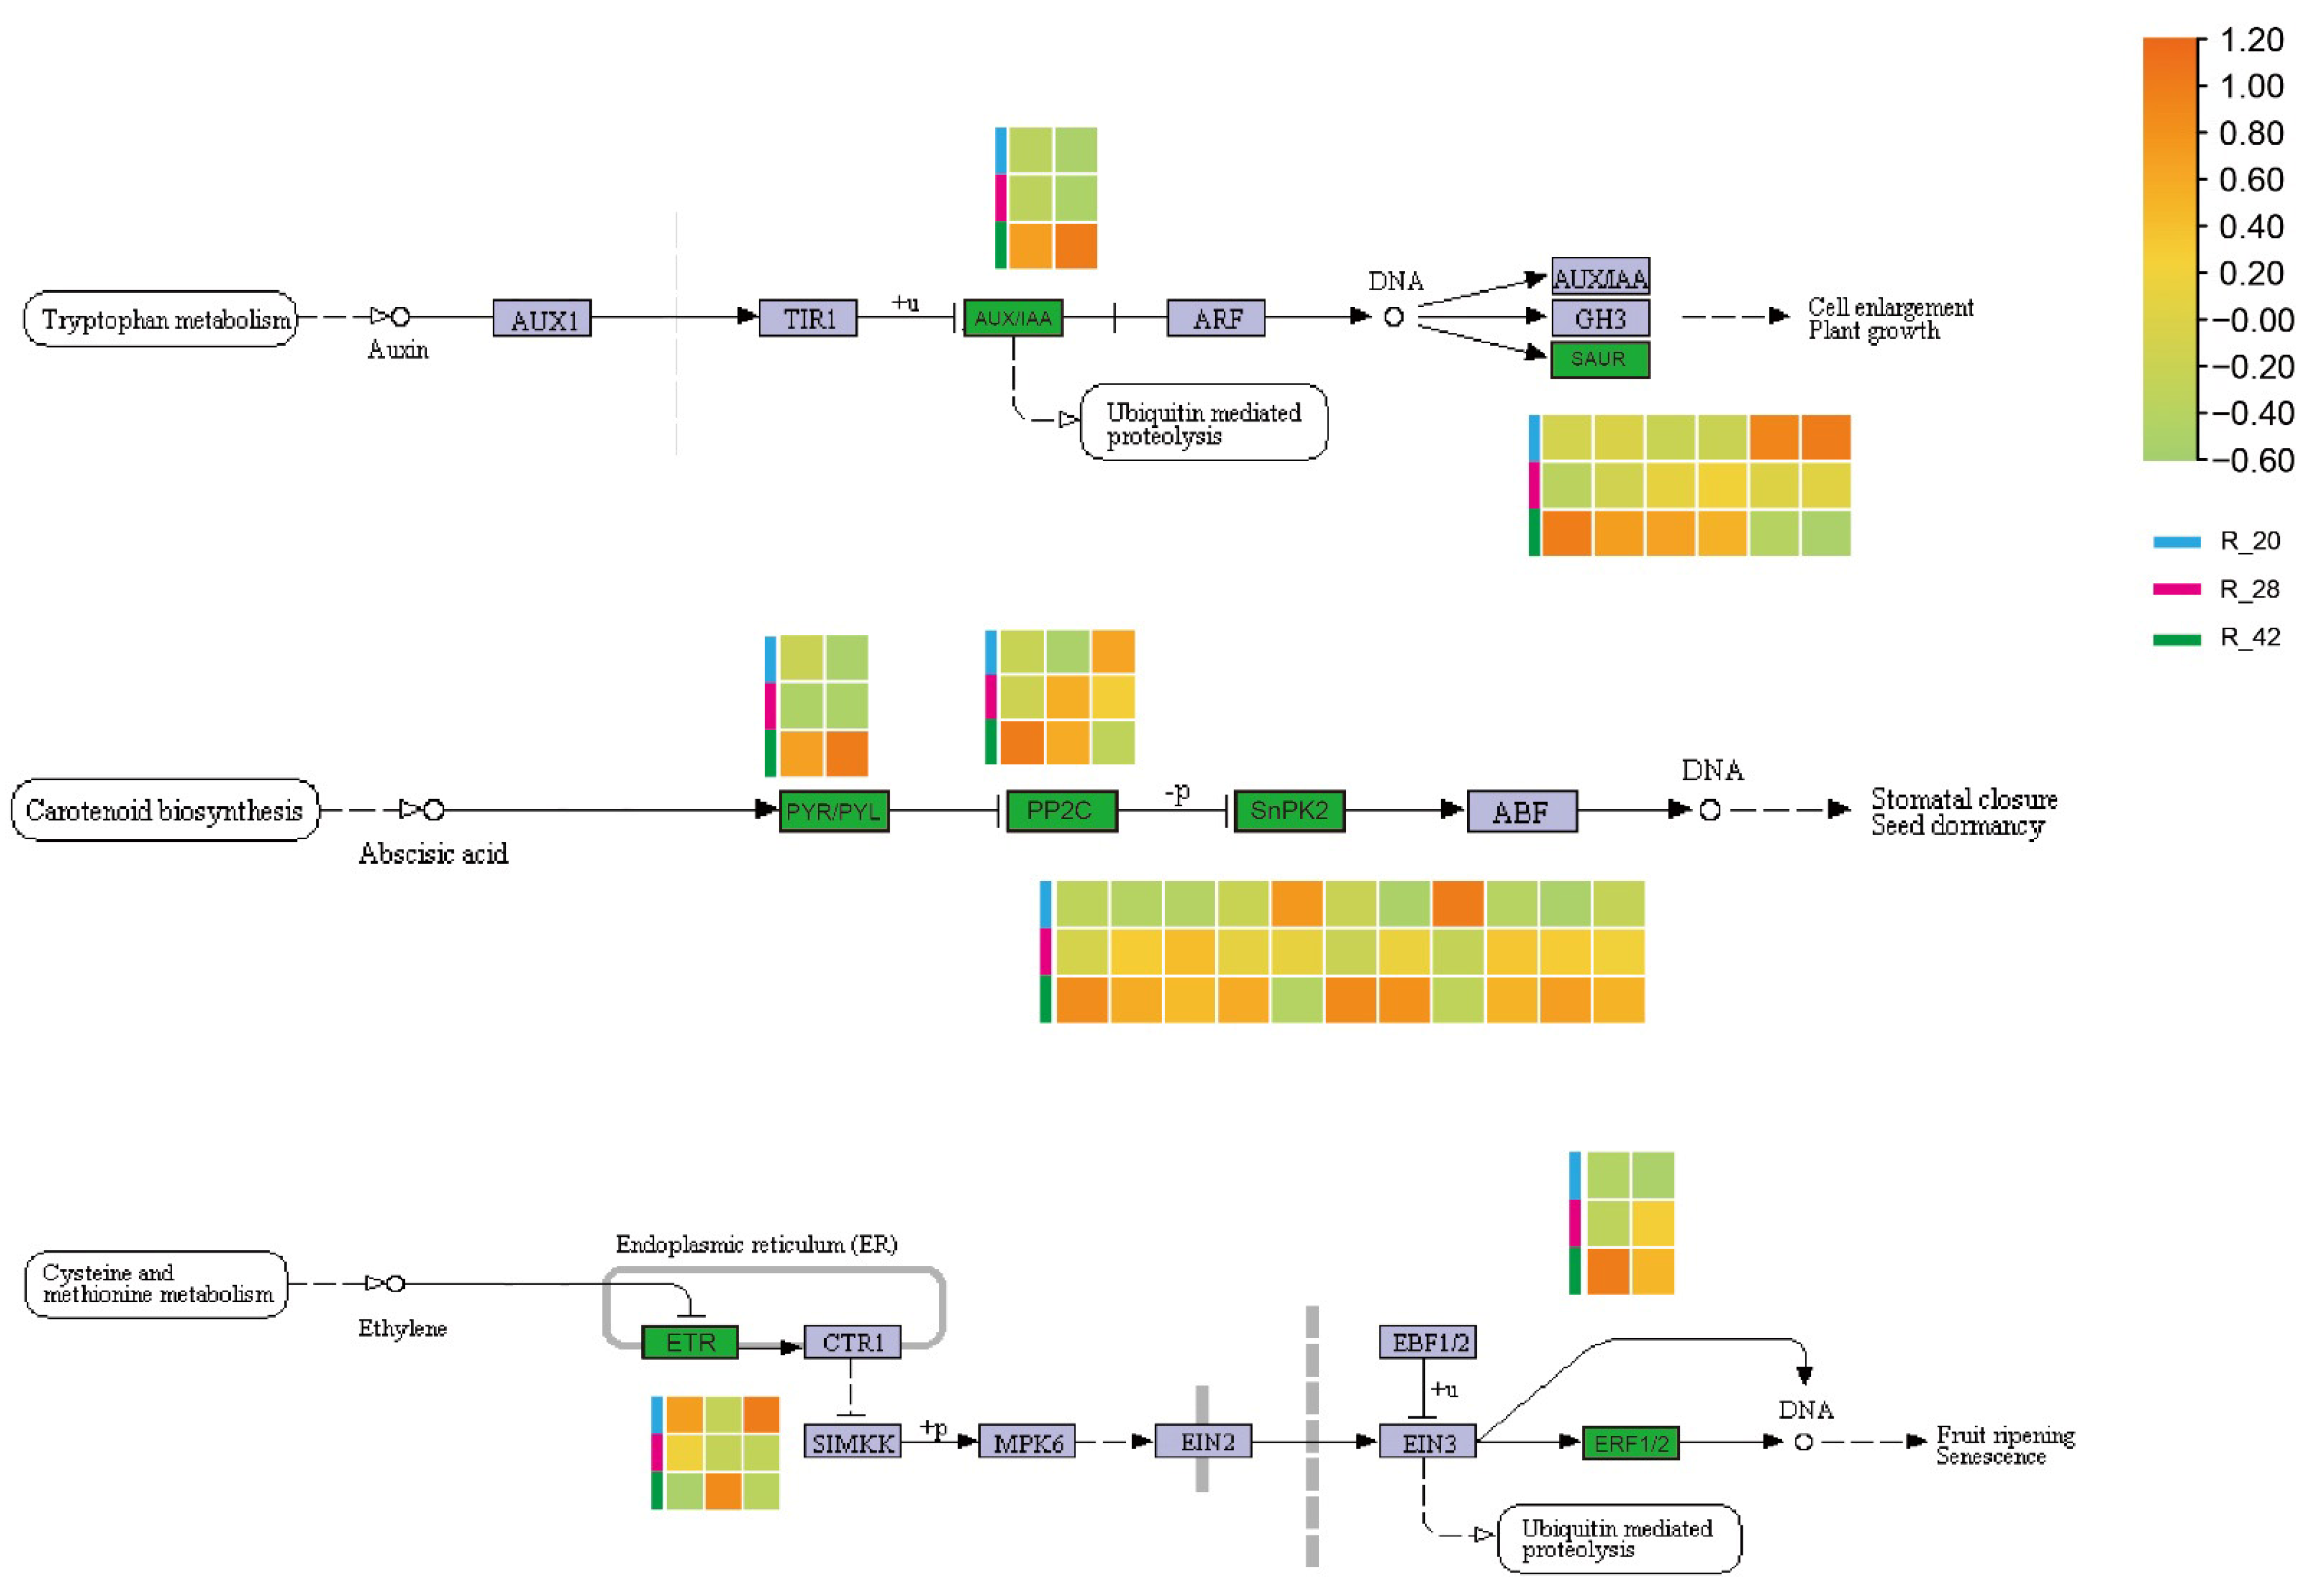
Multiple phytohormone signaling networks orchestrate root developmental processes in A. cristatum, with auxin, abscisic acid, and ethylene pathways displaying distinct yet synchronized expression dynamics that collectively regulate root morphogenesis (Figure 7, Table S5).
Within the auxin signaling cascade, four pivotal genes were identified: IAA9, SAUR36-like, SAUR71, and SAUR71-like. While SAUR36-like genes underwent transcriptional repression, IAA9, SAUR71, and SAUR71-like exhibited upregulation, indicating net activation of auxin-responsive transcriptional programs. This expression pattern suggests enhanced auxin-mediated control of cellular elongation and root differentiation processes during developmental progression, despite selective downregulation of specific SAUR components.
The abscisic acid (ABA) signaling pathway demonstrated comprehensive transcriptional activation encompassing multiple regulatory components: PP2C, PP2C51, PYL2, PYL5, SAPK2, SAPK4, SAPK7, and SnRK2.3. The majority of pathway genes exhibited upregulation, with notable exceptions including SnRK2.3, PP2C, and SAPK7, which showed transcriptional suppression. These findings underscore ABA signaling as a central mediator of stress adaptation and osmotic homeostasis in root tissues, maintaining pathway functionality through coordinated receptor-kinase and kinase-transcription factor modules while implementing precise negative regulatory control.
The ethylene signaling network involved three representative genes—EIN4, ETR2, and ERF-C3—exhibiting differential expression patterns. EIN4 and ETR2 demonstrated downregulation, while ERF-C3 showed transcriptional activation, reflecting a regulatory transition from receptor-mediated signal suppression toward transcriptional program enhancement. This regulatory reconfiguration implies augmented ethylene responsiveness that facilitates root hair development and promotes comprehensive architectural remodeling of the root system.
Several regulatory genes with conserved domains exhibited strong transcriptional activation in the R-42 vs. R-20 comparison. These included IAA9, encoding a PB1 domain-containing auxin-responsive protein; PP2C 51, a protein phosphatase 2C; SAPK2, a serine/threonine protein kinase; EIN4, carrying a response regulator receiver domain; and ERF-C3, containing an AP2 domain.

3.7. RT-qPCR Validation of RNA-Seq Results

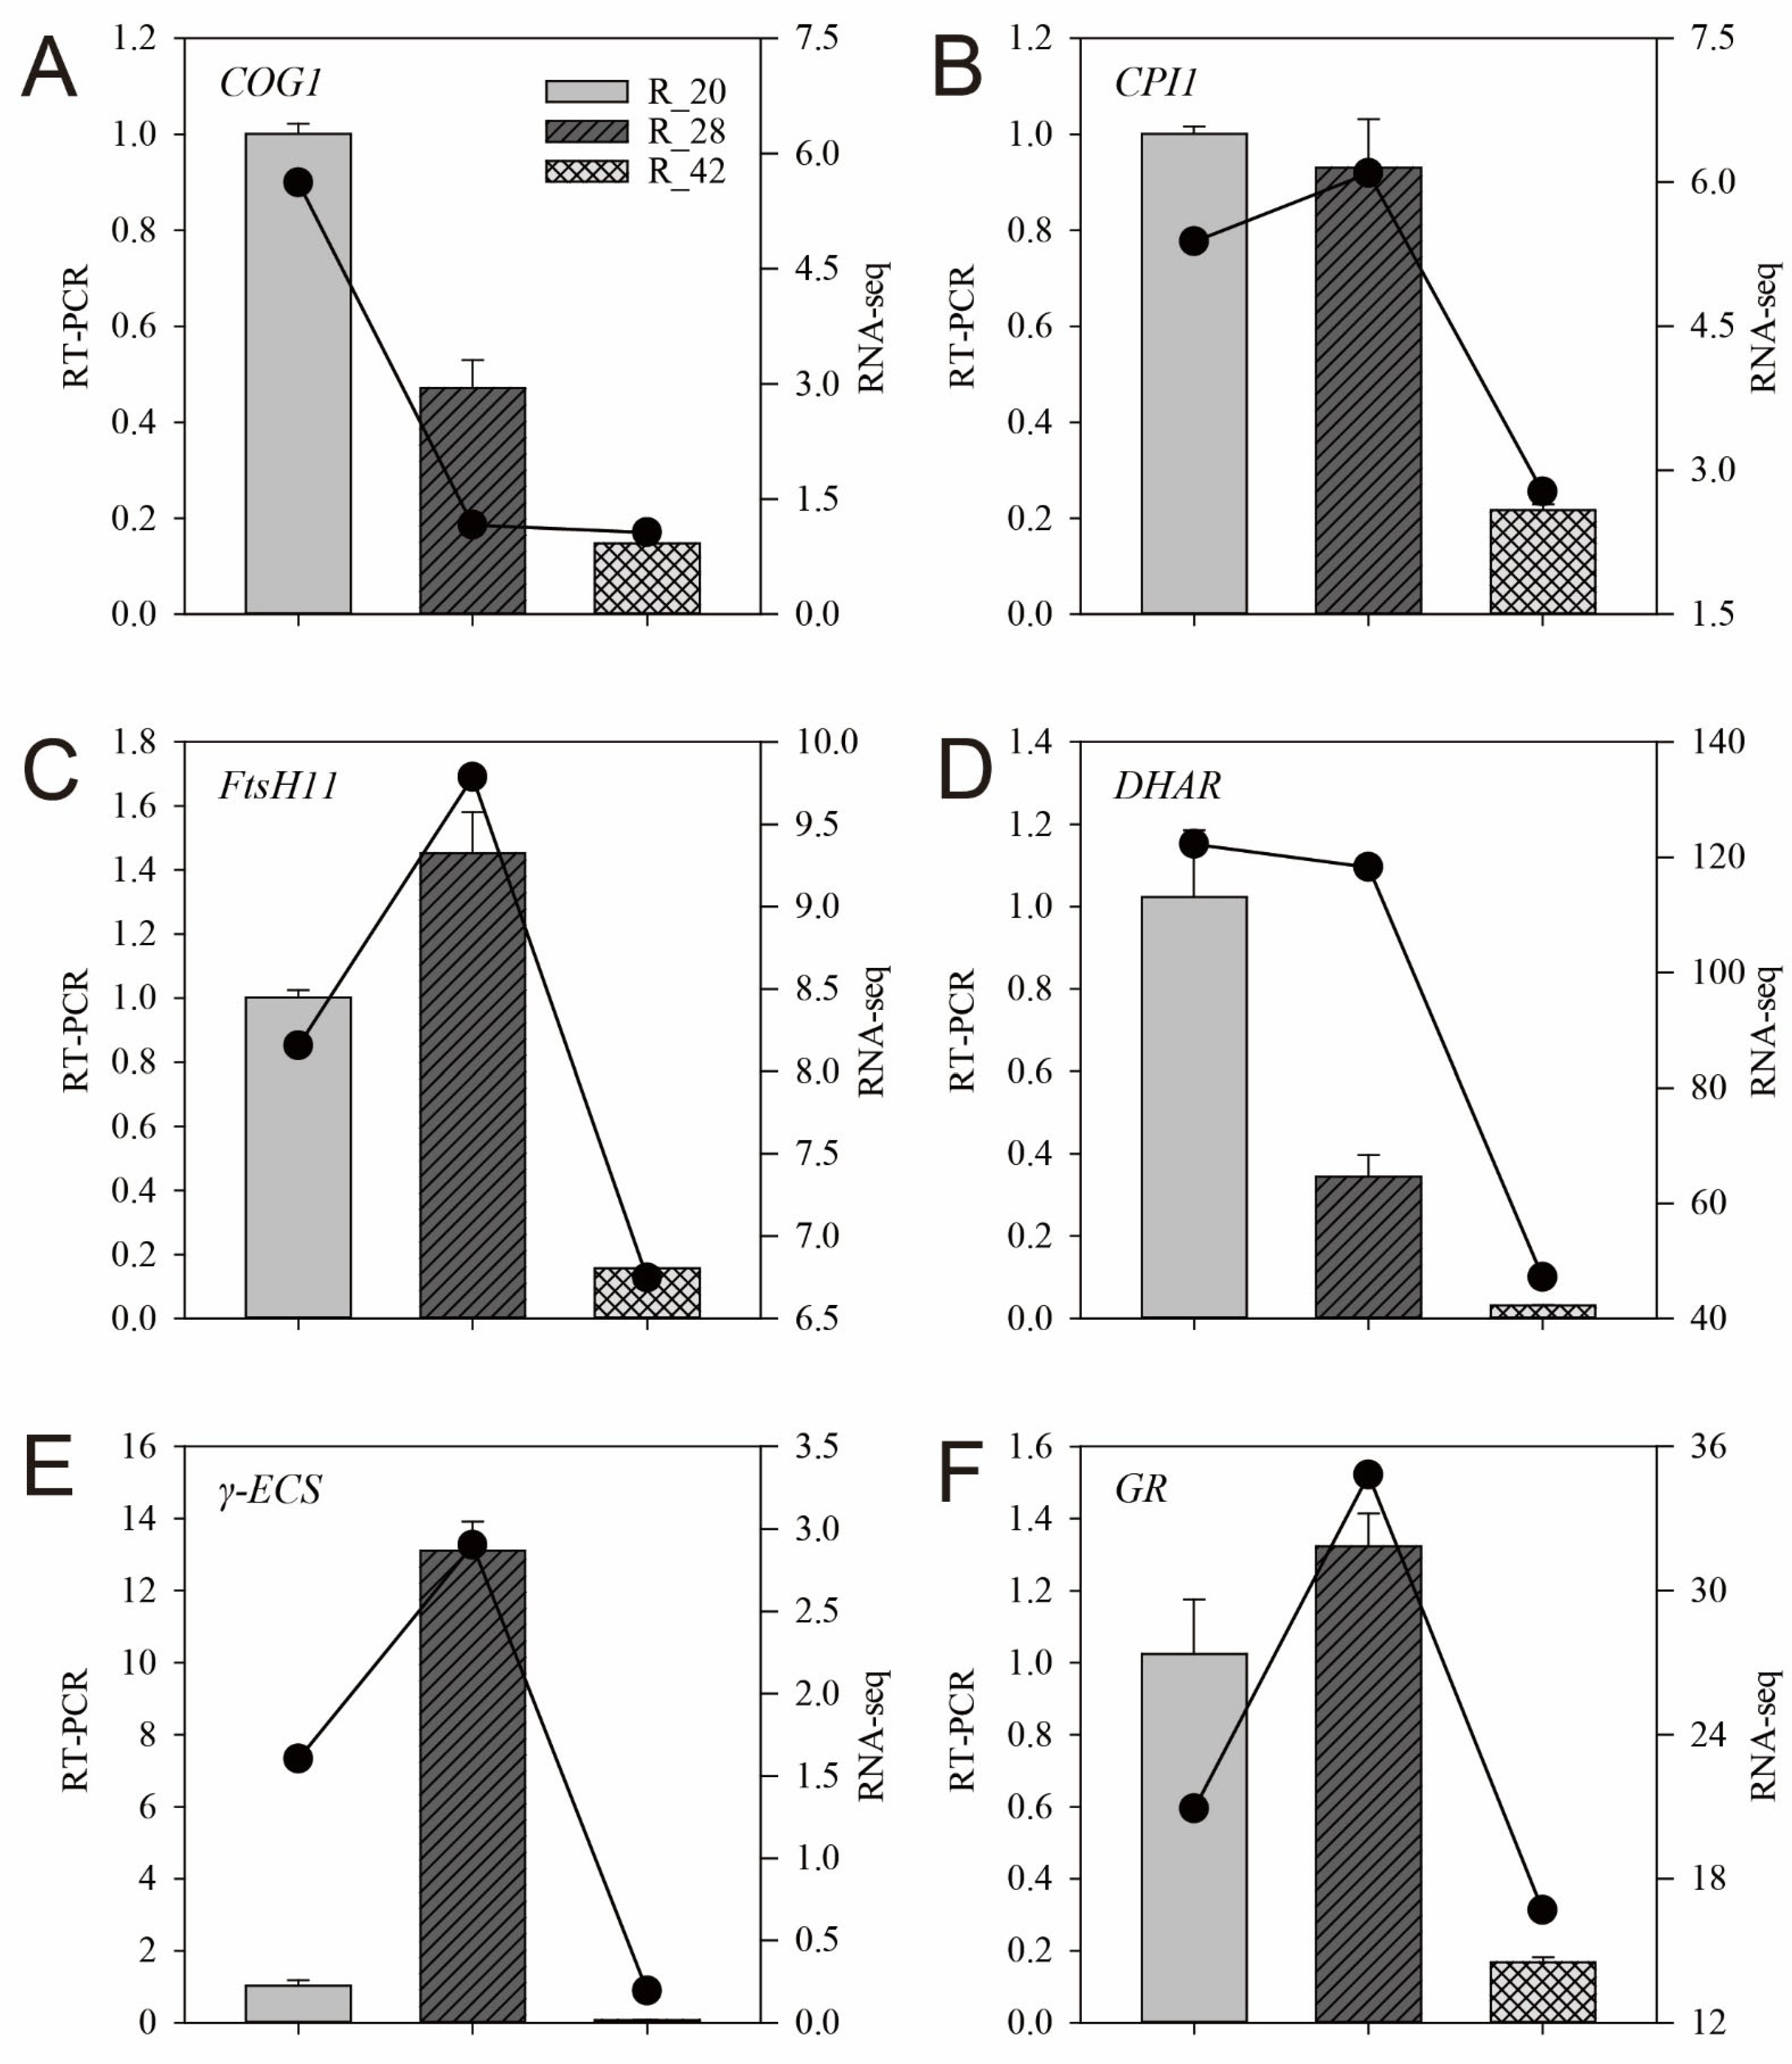
To validate the transcriptome data, six genes associated with root development in A. cristatum were selected for RT-qPCR analysis. As shown in Figure 8, the expression patterns obtained from RT-qPCR were generally consistent with RNA-seq results, confirming the reliability of the transcriptomic dataset. Specifically, COG1 and CPI1 showed progressive downregulation during root development (Figure 8A,B), whereas FlsH11, γ-ECS, and GR exhibited transient induction at the intermediate stage before declining at later stages (Figure 8C,E,F). By contrast, DHAR displayed the highest expression at the early stage, followed by a sharp reduction thereafter (Figure 8D). These results confirm the reliability of the transcriptome data for capturing timepoint-specific regulation of key genes during root development in A. cristatum.

4. Discussion

In this study, root growth and development were characterized using stereomicroscopy, paraffin sectioning, and transcriptome sequencing at three stages (20, 28, and 42 days after germination). Morphological observations showed a continuous developmental trajectory, while transcriptomic analysis revealed thousands of differentially expressed genes (DEGs). Functional enrichment analyses (GO and KEGG) indicated that these DEGs were mainly involved in transcriptional regulation, nitrogen metabolism, and hormone signaling pathways related to root development.
Transcription factors (TFs) are central regulators of root development [31], with 18 members showing consistent differential expression across all developmental comparisons. Members of the bHLH, NAC, WRKY, and GRAS families displayed particularly dynamic transcriptional patterns. The bHLH (basic helix-loop-helix) proteins are ubiquitous nuclear TFs in eukaryotes that play pivotal roles in root morphogenesis, including root hair initiation and lateral root formation [32]. Both bHLH130-like and BIM2 were significantly upregulated at 42 days after germination, implying their involvement in the later stages of root differentiation. Similar genes in other species support this role: MdbHLH130 in Malus domestica is induced by water deficit and contributes to stress-responsive root regulation [33], while BIM2 in Arabidopsis thaliana governs root hair development, thereby enhancing water and nutrient uptake [34]. Members of the NAC family are key modulators of cell wall biosynthesis and root tissue patterning [35]. Notably, NAC4 and NAC41 exhibited strong transcriptional induction at 42 days, aligning with the broader activation of other TFs at this developmental stage. Their homology to NAC4 in A. thaliana and NAC41 in rice suggests conserved roles in lateral root formation and primary root elongation [36,37]. The significant upregulation of WRKY23 further reinforces this pattern, consistent with previous evidence that WRKY23 enhances root development through auxin-mediated signaling [38]. In addition, GRAS TFs are well recognized for their roles in gibberellin signaling and meristem maintenance [39,40]. Importantly, TF–nutrient–hormone cross-talk forms a crucial regulatory hub: NLP and bZIP members integrate nitrate signaling with root growth [41], while ARF7–IAA modules mediate auxin redistribution and lateral root branching [42]. Collectively, these results suggest that TFs not only drive lineage-specific transcriptional programs but also serve as integrators of metabolic, hormonal, and environmental cues to coordinate the developmental and adaptive processes underlying root growth.
Nitrogen metabolism was identified as a second major regulatory axis governing root growth [43]. A total of 65 differentially expressed genes (DEGs) were associated with nitrogen acquisition, assimilation, and carbon–nitrogen integration. The progressive upregulation of seven NRT genes (six NRT2.1 and one NRT2.3) suggests an enhanced nitrate uptake capacity, whereas the coordinated repression of nine NADPH-dependent nitrate reductase genes indicates a developmental transition in nitrogen assimilation strategy. Six NRT2.1 genes displayed continuous upregulation during root development, reflecting a concerted enhancement of nitrate transport activity. Similar observations have been reported in rice, where OsNRT2.1 promotes both root elongation and lateral root formation [44]. In A. thaliana, NRT1.1 functions as a dual nitrate transporter and sensor that modulates auxin distribution, thereby shaping root system architecture in response to nitrate availability [45]. Ammonium assimilation pathways exhibited complex regulatory dynamics: glutamine synthetase (GS) genes showed partial repression, whereas ferredoxin-dependent glutamate synthase (Fd-GOGAT) and glutamate dehydrogenase (GDH) displayed heterogeneous expression patterns. These transcriptional shifts likely represent fine-tuned metabolic adjustments to sustain amino acid biosynthesis and carbon skeleton provision during active root growth [46]. Expression of GS is closely associated with root development [47]; in some cases, its downregulation has been linked to constrained root growth or altered structural differentiation. The consistent downregulation of five GS genes suggests a developmentally regulated reduction in ammonium assimilation activity within maturing roots. Likewise, four Fd-GOGAT genes exhibited a gradual decline in expression with root age, reflecting a decreased requirement for ammonium assimilation in differentiated tissues and enabling balanced nitrogen allocation to sustain growth and differentiation. Notably, beyond their canonical metabolic roles, NRT2.1 transporters may also affect auxin distribution, providing a mechanistic link between nutrient uptake and developmental signaling pathways [48].
Phytohormone signaling pathways provided an additional regulatory layer that synergistically integrated environmental cues with developmental programs [49,50]. Auxin signaling exhibited overall transcriptional activation, with IAA9, SAUR71, and SAUR71-like genes upregulated despite the selective repression of SAUR36-like, suggesting that auxin-mediated cell elongation and differentiation are reinforced during later stages of root development [51,52]. Previous studies have shown that AtSAUR41, SAUR71, and SAUR72 are highly expressed in the root tip and hypocotyl regions, implicating their roles in cell expansion and division [53]. The upregulation of two SAUR71 transcripts observed here likely contributes to enhanced root elongation and tissue differentiation. The abscisic acid (ABA) signaling pathway was also broadly activated, with PYL–PP2C–SnRK modules mediating osmotic adjustment and adaptive stress responses, consistent with evidence that ABA signaling enhances root drought resilience [54,55]. The ethylene signaling network exhibited a developmental transition from receptor repression (ETR2, EIN4) to downstream transcriptional activation (ERF-C3), thereby promoting root hair formation and overall developmental progression [56,57,58]. Furthermore, upregulation of MPK6 supports its known role as a signaling hub interacting with both ethylene and auxin pathways to coordinate root system development [59].
Taken together, the integration of transcriptional regulators, nitrogen metabolic reprogramming, and hormone signaling networks underscores a multi-layered regulatory framework that drives root growth and developmental progression in A. cristatum. The sustained activation of TF families such as bHLH, NAC, WRKY, and GRAS, combined with enhanced nitrate acquisition capacity and coordinated auxin–ABA–ethylene signaling, supports dynamic root growth and differentiation, providing a mechanistic basis for improving root development in perennial grasses under varying environmental conditions.

5. Conclusions

This study presents comprehensive transcriptomic analyses of A. cristatum root tissues using next-generation sequencing technologies. Root development exhibited progressive increases in biomass, surface area, and architectural complexity across three developmental stages. These morphological changes were accompanied by extensive transcriptional reprogramming, with thousands of differentially expressed genes enriched in key biological pathways, including ribosome biogenesis, phenylpropanoid biosynthesis, protein processing in the endoplasmic reticulum, and tyrosine metabolism. Nitrogen metabolism and hormone signaling pathways played particularly prominent roles in developmental regulation. Multiple transcription factor families, such as bHLH, NAC, WRKY, and GRAS, were broadly upregulated, underscoring their central regulatory functions. Nitrogen metabolism emerged as a pivotal regulatory hub integrating nutrient uptake with carbon–nitrogen balance, while auxin, abscisic acid, and ethylene signaling pathways acted synergistically to coordinate cell elongation, stress responses, and root architectural remodeling. By elucidating the transcriptional networks underlying root development, this study provides valuable molecular insights and potential targets for optimizing root architecture to enhance stress tolerance, nutrient acquisition, and soil anchorage. These findings advance our understanding of root developmental mechanisms in A. cristatum and have important implications for breeding resilient cultivars and improving grassland productivity and ecological restoration, thereby contributing to sustainable agricultural and environmental development. Nevertheless, this study primarily provides a preliminary identification of candidate genes associated with root development and lacks corresponding functional validation. Future studies will focus on experimental verification and mechanistic exploration of these key genes to deepen our understanding of the molecular basis of root growth and adaptive regulation.

Supplementary Materials

The following supporting information can be downloaded at: https://www.mdpi.com/article/10.3390/agriculture15222392/s1, Table S1: RNA Sample Quality and Quantity Detection Results; Table S2: Primers used for qRT-PCR analysis of selected genes; Table S3: Differentially expressed transcription factors; Table S4: Differentially expressed genes involved in nitrogen fixation; Table S5: Differentially expressed genes involved in hormone signaling.

Author Contributions

Software and writing—original draft and visualization, H.Z.; manuscript revision, data curation and software, X.L.; data curation and validation, Y.X. and R.L. (Ruyue Li); validation and formal analysis, X.Z.; funding acquisition and project administration, R.L. (Ruicai Long) and X.W.; resource and supervision, W.D. and Y.Z.; conceptualization, methodology and supervision, M.L. All authors have read and agreed to the published version of the manuscript.

Funding

This work was funded by the National Key Research and Development Program of China (2023YFD1200303).

Data Availability Statement

The data presented in this study are available on request from the corresponding author.

Conflicts of Interest

Author Wang Ding was employed by the company Agros (Beijing) Tech Company Limited. The remaining authors declare that the research was conducted in the absence of any commercial or financial relationships that could be construed as a potential conflict of interest.

References

  1. Robins, J.; Jensen, K. Breeding of the Crested Wheatgrass Complex (Agropyron spp.) for North American Temperate Rangeland Agriculture and Conservation. Agronomy 2020, 10, 1134. [Google Scholar] [CrossRef]
  2. Koryakina, V.; Kochegina, A. Results of studying wheatgrass (Agropyron Gaertn.) accessions from the VIR global genetic resources collection in Yakutia. Proc. Appl. Bot. Genet. Breed. 2021, 182, 59–71. [Google Scholar] [CrossRef]
  3. Asay, K.H.; Johnson, D.A. Genetic Variances for Forage Yield in Crested Wheatgrass at Six Levels of Irrigation. Crop Sci. 1990, 30, 79–82. [Google Scholar] [CrossRef]
  4. Wei, X.; Yu, W.; Qinghua, Y. Effect of NaCl on Growth and Activities of Protective Enzymes in Seedlings of White Clovers (Trifolium repens L.). Acta Agrestia Sinica. 2011, 19, 492–496. Available online: https://manu40.magtech.com.cn/Jweb_cdxb/CN/Y2011/V19/I3/492 (accessed on 16 November 2025).
  5. Abdelrady, W.A.; Ma, Z.; Elshawy, E.E.; Wang, L.; Askri, S.M.H.; Ibrahim, Z.; Dennis, E.; Kanwal, F.; Zeng, F.; Shamsi, I.H. Physiological and biochemical mechanisms of salt tolerance in barley under salinity stress. Plant Stress. 2024, 11, 100403. [Google Scholar] [CrossRef]
  6. Shi, Y.; Wan, L.; Liu, J.; Wang, Y.; Guo, R.; Wu, X.; Li, X. Analysis of the Principal Components and the Subordinate Function of Lolium perenne Drought Resistance. Acta Agrestia Sin. 2010, 18, 669–672. Available online: https://manu40.magtech.com.cn/Jweb_cdxb/EN/Y2010/V18/I5/669 (accessed on 16 November 2025).
  7. Pierret, A.; Moran, C.J. Plant Roots and Soil Structure. In Encyclopedia of Agrophysics; Encyclopedia of Earth Sciences Series; Springer: Dordrecht, The Netherlands, 2011; pp. 628–632. [Google Scholar] [CrossRef]
  8. Robins, J.G.; Waldron, B.L.; Jensen, K.B. Productivity, stability, and resilience of cool-season perennial grasses used for rangeland revegetation. Agrosystems Geosci. Environ. 2020, 3, e20002. [Google Scholar] [CrossRef]
  9. Xu, C.; Mi, F.; Wang, Y.; Li, X.; Zhao, H. Factors influencing plant regeneration systems in mature embryo culture of Agropyron. Acta Prataculturae Sin. 2009, 18, 80–85. Available online: http://cyxb.magtech.com.cn/EN/Y2009/V18/I1/80 (accessed on 16 November 2025).
  10. Ruiz Herrera, L.F.; Shane, M.W.; López-Bucio, J. Nutritional regulation of root development. Wiley Interdiscip. Rev. Dev. Biol. 2015, 4, 431–443. [Google Scholar] [CrossRef] [PubMed]
  11. Sharma, M.; Singh, D.; Saksena, H.B.; Sharma, M.; Tiwari, A.; Awasthi, P.; Botta, H.K.; Shukla, B.N.; Laxmi, A. Understanding the Intricate Web of Phytohormone Signalling in Modulating Root System Architecture. Int. J. Mol. Sci. 2021, 22, 5508. [Google Scholar] [CrossRef]
  12. Dewey, D.R. The Genomic System of Classification as a Guide to Intergeneric Hybridization with the Perennial Triticeae. BMC Plant Biol. 2021, 21, 9.209–279. [Google Scholar]
  13. Asay, K.H.; Jensen, K.B.; Hsiao, C.; Dewey, D.R. Probable origin of standard crested wheatgrass, Agropyron desertorum Fisch. ex Link, Schultes. Can. J. Plant Sci. 1992, 72, 763–772. [Google Scholar] [CrossRef]
  14. Fan, L.; Tang, J.; Ma, L.; Zhang, Z.; Jiang, Q.; Li, E.; Ma, Q.; Wang, X.; Zhao, W. Screening Genes Related to Drought Resistance in Agropyron mongolicum Keng Based on Transcriptome. Acta Agrestia Sin. 2024, 32, 3344–3357. [Google Scholar] [CrossRef]
  15. Satam, H.; Joshi, K.; Mangrolia, U.; Waghoo, S.; Zaidi, G.; Rawool, S.; Thakare, R.P.; Banday, S.; Mishra, A.K.; Das, G.; et al. Next-Generation Sequencing Technology: Current Trends and Advancements. Biology 2023, 12, 997. [Google Scholar] [CrossRef]
  16. Wang, Z.; Gerstein, M.; Snyder, M. RNA-Seq: A revolutionary tool for transcriptomics. Nat. Rev. Genet. 2009, 10, 57–63. [Google Scholar] [CrossRef]
  17. Hu, L.; Li, H.; Chen, L.; Lou, Y.; Amombo, E.; Fu, J. RNA-seq for gene identification and transcript profiling in relation to root growth of bermudagrass (Cynodon dactylon) under salinity stress. BMC Genom. 2015, 16, 575. [Google Scholar] [CrossRef]
  18. Hu, T.; Sun, X.; Zhang, X.; Nevo, E.; Fu, J. An RNA sequencing transcriptome analysis of the high-temperature stressed tall fescue reveals novel insights into plant thermotolerance. BMC Genom. 2014, 15, 1147. [Google Scholar] [CrossRef]
  19. Du, J.; Li, X.; Li, T.; Yu, D.; Han, B. Genome-wide transcriptome profiling provides overwintering mechanism of Agropyron mongolicum. BMC Plant Biol. 2017, 17, 138. [Google Scholar] [CrossRef]
  20. Zhang, J.; Liu, W.; Han, H.; Song, L.; Bai, L.; Gao, Z.; Zhang, Y.; Yang, X.; Li, X.; Gao, A.; et al. De novo transcriptome sequencing of Agropyron cristatum to identify available gene resources for the enhancement of wheat. Genomics 2015, 106, 129–136. [Google Scholar] [CrossRef]
  21. Zhou, S.; Zhang, J.; Han, H.; Zhang, J.; Ma, H.; Zhang, Z.; Lu, Y.; Liu, W.; Yang, X.; Li, X.; et al. Full-length transcriptome sequences of Agropyron cristatum facilitate the prediction of putative genes for thousand-grain weight in a wheat-A. cristatum translocation line. BMC Genom. 2019, 20, 1025. [Google Scholar] [CrossRef]
  22. Wang, S.; Ren, X.; Huang, B.; Wang, G.; Zhou, P.; An, Y. Aluminium-induced reduction of plant growth in alfalfa (Medicago sativa) is mediated by interrupting auxin transport and accumulation in roots. Sci. Rep. 2016, 6, 30079. [Google Scholar] [CrossRef] [PubMed]
  23. Chen, S.; Zhou, Y.; Chen, Y.; Gu, J. fastp: An ultra-fast all-in-one FASTQ preprocessor. Bioinformatics 2018, 34, i884–i890. [Google Scholar] [CrossRef] [PubMed]
  24. Li, B.; Dewey, C.N. RSEM: Accurate transcript quantification from RNA-Seq data with or without a reference genome. BMC Bioinform. 2011, 12, 323. [Google Scholar] [CrossRef] [PubMed]
  25. Liao, Y.; Smyth, G.K.; Shi, W. featureCounts: An efficient general purpose program for assigning sequence reads to genomic features. Bioinformatics 2014, 30, 923–930. [Google Scholar] [CrossRef]
  26. Love, M.I.; Huber, W.; Anders, S. Moderated estimation of fold change and dispersion for RNA-seq data with DESeq2. Genome Biol. 2014, 15, 550. [Google Scholar] [CrossRef]
  27. Buchfink, B.; Xie, C.; Huson, D.H. Fast and sensitive protein alignment using DIAMOND. Nat. Methods 2015, 12, 59–60. [Google Scholar] [CrossRef]
  28. Kanehisa, M.; Goto, S. KEGG: Kyoto encyclopedia of genes and genomes. Nucleic Acids Res. 2000, 28, 27–30. [Google Scholar] [CrossRef]
  29. Yu, G.; Wang, L.G.; Han, Y.; He, Q.Y. clusterProfiler: An R package for comparing biological themes among gene clusters. Omics 2012, 16, 284–287. [Google Scholar] [CrossRef]
  30. Livak, K.J.; Schmittgen, T.D. Analysis of Relative Gene Expression Data Using Real-Time Quantitative PCR and the 2−ΔΔCT Method. Methods 2001, 25, 402–408. [Google Scholar] [CrossRef]
  31. Wray, G.A. Transcriptional regulation and the evolution of development. Int. J. Dev. Biol. 2003, 47, 675–684. Available online: https://pubmed.ncbi.nlm.nih.gov/14756343/ (accessed on 2 July 2025).
  32. Makkena, S.; Lamb, R.S. The bHLH transcription factor SPATULA regulates root growth by controlling the size of the root meristem. BMC Plant Biol. 2013, 13, 1. [Google Scholar] [CrossRef]
  33. Zhao, Q.; Fan, Z.; Qiu, L.; Che, Q.; Wang, T.; Li, Y.; Wang, Y. MdbHLH130, an Apple bHLH Transcription Factor, Confers Water Stress Resistance by Regulating Stomatal Closure and ROS Homeostasis in Transgenic Tobacco. Front. Plant Sci. 2020, 11, 543696. [Google Scholar] [CrossRef]
  34. Ding, W.; Yu, Z.; Tong, Y.; Huang, W.; Chen, H.; Wu, P. A transcription factor with a bHLH domain regulates root hair development in rice. Cell Res. 2009, 19, 1309–1311. [Google Scholar] [CrossRef] [PubMed]
  35. Zheng, C.; Yang, Q.; Wang, X.; Chen, Y.; He, R.; Li, X.; Pan, H.; Zhuo, R.; Qu, T.; Qiu, W. Transcription Factors Involved in Plant Stress and Growth and Development: NAC. Agronomy 2025, 15, 949. [Google Scholar] [CrossRef]
  36. Vidal, E.; Álvarez, J.; Gutiérrez, R.A. Nitrate regulation of AFB3 and NAC4 gene expression in Arabidopsis roots depends on NRT1.1 nitrate transport function. Plant Signal Behav. 2014, 9, e28501. [Google Scholar] [CrossRef]
  37. Han, S.; Wang, Y.; Li, Y.; Zhu, R.; Gu, Y.; Li, J.; Guo, H.; Ye, W.; Nabi, H.; Yang, T.; et al. The OsNAC41-RoLe1-OsAGAP module promotes root development and drought resistance in upland rice. Mol. Plant 2024, 7, 1573–1593. [Google Scholar] [CrossRef] [PubMed]
  38. Grunewald, W.; Karimi, M.; Wieczorek, K.; Van de Cappelle, E.; Wischnitzki, E.; Grundler, F.; Inzé, D.; Beeckman, T.; Gheysen, G. A role for AtWRKY23 in feeding site establishment of plant-parasitic nematodes. Plant Physiol. 2008, 148, 358–368. [Google Scholar] [CrossRef]
  39. Shtin, M.; Dello Ioio, R.; Del Bianco, M. It’s Time for a Change: The Role of Gibberellin in Root Meristem Development. Front. Plant Sci. 2022, 13, 882517. [Google Scholar] [CrossRef]
  40. Neves, C.; Ribeiro, B.; Amaro, R.; Expósito, J.; Grimplet, J.; Fortes, A.M. Network of GRAS transcription factors in plant development, fruit ripening and stress responses. Hortic. Res. 2023, 10, uhad220. [Google Scholar] [CrossRef]
  41. Gaudinier, A.; Rodriguez-Medina, J.; Zhang, L.; Olson, A.; Liseron-Monfils, C.; Bågman, A.M.; Foret, J.; Abbitt, S.; Tang, M.; Li, B.; et al. Transcriptional regulation of nitrogen-associated metabolism and growth. Nature 2018, 563, 259–264. [Google Scholar] [CrossRef]
  42. Orosa-Puente, B.; Leftley, N.; Wangenheim, D.; Banda, J.; Srivastava, A.K.; Hill, K.; Truskina, J.; Bhosale, R.; Morris, E.; Srivastava, M.; et al. Root branching toward water involves posttranslational modification of transcription factor ARF7. Science 2018, 362, 1407–1410. [Google Scholar] [CrossRef] [PubMed]
  43. Sun, X.; Gu, Y.; Liu, Y.; Liu, Z.; Wang, P. Nitrogen-Driven Orchestration of Lateral Root Development: Molecular Mechanisms and Systemic Integration. Biology 2025, 14, 1099. [Google Scholar] [CrossRef] [PubMed]
  44. Hu, H.; Boisson-Dernier, A.; Israelsson-Nordström, M.; Böhmer, M.; Xue, S.; Ries, A.; Godoski, J.; Kuhn, J.M.; Schroeder, J.I. Carbonic anhydrases are upstream regulators of CO2-controlled stomatal movements in guard cells. Nat. Cell Biol. 2010, 12, 87–93. [Google Scholar] [CrossRef] [PubMed]
  45. Wang, Y.Y.; Cheng, Y.H.; Chen, K.E.; Tsay, Y.F. Nitrate Transport, Signaling, and Use Efficiency. Annu. Rev. Plant Biol. 2018, 69, 85–122. [Google Scholar] [CrossRef]
  46. Naz, M.; Luo, B.; Guo, X.; Li, B.; Chen, J.; Fan, X. Overexpression of Nitrate Transporter OsNRT2.1 Enhances Nitrate-Dependent Root Elongation. Genes 2019, 10, 290. [Google Scholar] [CrossRef]
  47. Jiang, Y.; Li, Y.; Nie, G.; Liu, H. Leaf and Root Growth, Carbon and Nitrogen Contents, and Gene Expression of Perennial Ryegrass to Different Nitrogen Supplies. J. Am. Soc. Hortic. Sci. 2016, 141, 555–562. [Google Scholar] [CrossRef]
  48. Remans, T.; Nacry, P.; Pervent, M.; Filleur, S.; Diatloff, E.; Mounier, E.; Tillard, P.; Forde, B.G.; Gojon, A. The Arabidopsis NRT1.1 transporter participates in the signaling pathway triggering root colonization of nitrate-rich patches. Proc. Natl. Acad. Sci. USA 2006, 103, 19206–19211. [Google Scholar] [CrossRef]
  49. Pozo, M.J.; López-Ráez, J.A.; Azcón-Aguilar, C.; García-Garrido, J.M. Phytohormones as integrators of environmental signals in the regulation of mycorrhizal symbioses. New Phytol. 2015, 205, 1431–1436. [Google Scholar] [CrossRef]
  50. Yoshida, T.; Fernie, A.R.; Shinozaki, K.; Takahashi, F. Long-distance stress and developmental signals associated with abscisic acid signaling in environmental responses. Plant J. 2021, 105, 477–488. [Google Scholar] [CrossRef]
  51. Spartz, A.K.; Lee, S.H.; Wenger, J.P.; Gonzalez, N.; Itoh, H.; Inzé, D.; Peer, W.A.; Murphy, A.S.; Overvoorde, P.J.; Gray, W.M. The SAUR19 subfamily of SMALL AUXIN UP RNA genes promote cell expansion. Plant J. 2012, 70, 978–990. [Google Scholar] [CrossRef]
  52. Qiu, T.; Chen, Y.; Li, M.; Kong, Y.; Zhu, Y.; Han, N.; Bia, H.; Zhu, M.; Wang, J. The tissue-specific and developmentally regulated expression patterns of the SAUR41 subfamily of small auxin up RNA genes: Potential implications. Plant Signal Behav. 2013, 8, e25283. [Google Scholar] [CrossRef] [PubMed]
  53. Ren, H.; Gray, W.M. SAUR Proteins as Effectors of Hormonal and Environmental Signals in Plant Growth. Mol. Plant 2015, 8, 1153–1164. [Google Scholar] [CrossRef] [PubMed]
  54. Umezawa, T.; Nakashima, K.; Miyakawa, T.; Kuromori, T.; Tanokura, M.; Shinozaki, K.; Yamaguchi-Shinozaki, K. Molecular basis of the core regulatory network in ABA responses: Sensing, signaling and transport. Plant Cell Physiol. 2010, 51, 1821–1839. [Google Scholar] [CrossRef] [PubMed]
  55. Zhao, Y.; Zhang, Z.; Gao, J.; Wang, P.; Hu, T.; Wang, Z.; Hou, Y.J.; Wan, Y.; Liu, W.; Xie, S.; et al. Arabidopsis Duodecuple Mutant of PYL ABA Receptors Reveals PYL Repression of ABA-Independent SnRK2 Activity. Cell Rep. 2018, 23, 3340–3351.e5. [Google Scholar] [CrossRef]
  56. Kieber, J.J.; Rothenberg, M.; Roman, G.; Feldmann, K.A.; Ecker, J.R. CTR1, a negative regulator of the ethylene response pathway in Arabidopsis, encodes a member of the raf family of protein kinases. Cell 1993, 72, 427–441. [Google Scholar] [CrossRef]
  57. Yoo, S.D.; Cho, Y.; Sheen, J. Emerging connections in the ethylene signaling network. Trends Plant Sci. 2009, 14, 270–279. [Google Scholar] [CrossRef]
  58. Meng, X.; Xu, J.; He, Y.; Yang, K.Y.; Mordorski, B.; Liu, Y.; Zhang, S. Phosphorylation of an ERF transcription factor by Arabidopsis MPK3/MPK6 regulates plant defense gene induction and fungal resistance. Plant Cell 2013, 25, 1126–1142. [Google Scholar] [CrossRef]
  59. Contreras-Cornejo, H.; López-Bucio, J.; Méndez-Bravo, A.; Macías-Rodríguez, L.; Ramos-Vega, M.; Guevara-García, Á.A.; López-Bucio, J. Mitogen-Activated Protein Kinase 6 and Ethylene and Auxin Signaling Pathways Are Involved in Arabidopsis Root-System Architecture Alterations by Trichoderma atroviride. Mol. Plant Microbe Interact. 2015, 28, 701–710. [Google Scholar] [CrossRef]
Figure 1. Root morphology changes at differential developmental stages. (A) Root length (n = 30) and total root length (n = 3) at 20, 28, and 42 days after germination. Different letters above bars indicate significant differences among time points (p < 0.05, Duncan’s multiple range test). (B) Root fresh weight and dry weight (n = 4) across the same time points. Significant differences are indicated by letters above bars (p < 0.05). (C) Root surface area and volume (n = 3) changes during root development. Bars with different letters indicate significant differences (p < 0.05). For (AC), bars represent mean ± standard error (SE). (DF) Representative scanned images of root systems at 20 days (D), 28 days (E), and 42 days (F). Scale bar = 1 cm.
Agriculture 15 02392 g001
Figure 2. Analysis of the number of differentially expressed genes. Volcano plots of DEGs identified in (A) R-28 vs. R-20, (B) R-42 vs. R-20, and (C) R-42 vs. R-28. Red and green dots denote significantly up- and down-regulated genes, respectively. (D) Venn diagram of shared and unique DEGs among the three pairwise comparisons.
Agriculture 15 02392 g002
Figure 3. KEGG pathway enrichment analysis of DEGs. Bubble plots illustrating significantly enriched KEGG pathways for DEGs in (A) R-28 vs. R-20, (B) R-42 vs. R-20, and (C) R-42 vs. R-28. The X-axis represents the rich factor, the bubble size corresponds to the number of DEGs, and the bubble color indicates adjusted q-value.
Agriculture 15 02392 g003
Figure 4. Differential expression analysis of transcription factors (TFs) during root development. (A) Venn diagram illustrating the overlap of differentially expressed transcription factors (TFs) among the R-28 vs. R-20, R-42 vs. R-20, and R-42 vs. R-28 comparisons. (BD) Histogram of up- and down-regulated TF families in comparison groups of (B) R-28 vs. R-20, (C) R-42 vs. R-20, and (D) R-42 vs. R-28. Bars represent the number of DEGs.
Agriculture 15 02392 g004
Figure 5. Expression profiles of transcription factor (TF) families involved in root development of A. cristatum. The heatmap shows expression patterns of individual TF genes within selected families ((A) bHLH and GRAS; (B) NAC; (C) WRKY), with expression levels quantified as fragments per kilobase of transcript per million mapped reads (FPKM).
Agriculture 15 02392 g005
Figure 6. Differentially expressed genes involved in nitrogen metabolism. Pathway map of nitrogen metabolism with highlighted differentially expressed genes (DEGs). Genes marked with green boxes indicate significant expression changes among R-20, R-28, and R-42, including NRT, NR, GS, GLT, CA, and GDH2. Heatmaps adjacent to each gene represent expression profiles across R-20, R-28, and R-42, with expression levels quantified as fragments per kilobase of transcript per million mapped reads (FPKM).
Agriculture 15 02392 g006
Figure 7. Differentially expressed genes associated with hormone signaling pathways. Pathway diagrams for auxin, abscisic acid (ABA), and ethylene signaling. Green boxes denote genes showing significant differential expression, including AUX1, AUX/IAA, GH3, SAUR, PYR/PYL, PP2C, SnPK2, ETR, and ERF1/2. Heatmaps adjacent to each gene represent expression profiles across R-20, R-28, and R-42, with expression levels quantified as fragments per kilobase of transcript per million mapped reads (FPKM).
Agriculture 15 02392 g007
Figure 8. Validation of RNA-seq data by RT-qPCR. Relative transcript abundance of six representative DEGs: (A) COG1, (B) CPI1, (C) FlsH11, (D) DHAR, (E) γ-ECS, and (F) GR. Bar plots show RT-qPCR data (left Y-axis), and lines represent corresponding RNA-seq expression values (right Y-axis). Error bars indicate mean ± SE (n = 3).
Agriculture 15 02392 g008
Disclaimer/Publisher’s Note: The statements, opinions and data contained in all publications are solely those of the individual author(s) and contributor(s) and not of MDPI and/or the editor(s). MDPI and/or the editor(s) disclaim responsibility for any injury to people or property resulting from any ideas, methods, instructions or products referred to in the content.