Abstract
The impact velocity of the grains is a critical factor affecting the hulling efficiency in centrifugal hullers. However, significant differences in velocity are observed among paddy grains following acceleration by the impeller. Therefore, elucidating the mechanism responsible for these velocity differences is essential for improving hulling performance. This study employed coupled CFD-DEM simulations to analyse the kinematic behaviour of paddy grains. The results demonstrate that velocity differences among grains are prevalent within centrifugal hullers and adversely affect hulling efficiency. These differences primarily arise from tangential collisions between grains and blades prior to acceleration, as well as axial collisions during the acceleration phase. The jumping degree (Sv) quantifies the relative motion between paddy grains and blades in the normal direction. Velocity differences decrease significantly as the jumping degree approaches unity. Furthermore, a tilted curvature blade was developed to mitigate velocity differences. Computational analysis and simulation determined that a blade curvature of 300 mm combined with a 20° tilt angle achieved the most substantial reduction in velocity differences. This optimised configuration improves hulling efficiency by 4.5% compared to the original blade design. This modification is expected to substantially facilitate the optimisation of centrifugal huller designs.
1. Introduction
Paddy grain hulling, which involves the removal of the outer husk to produce brown rice, is a critical stage that significantly influences both the quality and economic value of the final product. Modern hulling technologies primarily employ centrifugal hullers or rubber roller hullers. Among these, rubber roller hullers are the most widely adopted due to their ability to minimise grain breakage while achieving a comparable hulling rate. In contrast, centrifugal hullers produce brown rice with superior gloss, storage stability, and taste characteristics [1]. Additionally, this type of equipment offers advantages such as a simple structure, low energy consumption, and reduced processing costs [2]. However, as noted by Chu et al. [1], existing centrifugal hullers exhibit a breakage rate of approximately 10% when the hulling rate exceeds 85%, which is considerably higher than the desired threshold of below 5%. This high breakage rate directly leads to reduced rice yield and economic losses, representing a major bottleneck in improving the quality and efficiency of paddy grain processing. Therefore, enhancing the hulling rate of centrifugal hullers while simultaneously reducing the breakage rate is essential for advancing the paddy processing industry.
In centrifugal hullers, hulling takes place in a dedicated chamber where paddy grains are accelerated by a high-speed rotating impeller and collide with an annular rubber wall to achieve dehulling. Significant velocity differences result in a broad distribution of impact energies. This leads to a situation where some grains possess insufficient velocity for effective hulling, reducing efficiency, while others impact at excessively high velocities, causing increased breakage. Ultimately, both scenarios adversely affect product quality and processing efficiency. In recent years, academic interest in grain impact behaviour has grown significantly. Researchers have established connections between impact velocity and both hulling efficiency and breakage rates [3,4,5] and have proposed optimal impact velocity ranges for hulling [1]. However, most studies remain focused on the effects of velocity variation on grains, with insufficient attention paid to the velocity differences among paddy grains within centrifugal hullers. It is noteworthy that variations in impact velocity during hulling have been confirmed to significantly affect equipment performance and final product quality. Nevertheless, the underlying mechanisms responsible for these velocity differences remain unclear, hindering the optimisation of centrifugal hulling technology. Therefore, this study systematically investigates the origins of intra-grain impact velocity disparities induced by impeller motion through an integrated discrete particle kinematics analysis.
Functioning as a characteristic black-box system, centrifugal hullers predominantly rely on trial-and-error approaches for parameter optimisation to enhance practical hulling performance [6,7,8,9]. Although these empirical methods have proven effective in improving overall hulling quality, their applicability remains constrained by specific rice varieties and equipment configurations, thereby limiting targeted process improvements. In this context, previous studies have successfully predicted the exit velocity of paddy grains from the impeller by establishing equations of motion [10,11]. Furthermore, mathematical models developed by Lachuga’s research team [12,13,14] demonstrated that grain kinematics during impingement are predominantly governed by both the impeller’s angular velocity and blade curvature. These contributions have not only characterised particle dynamics under varying operational conditions but also provided valuable theoretical support for equipment design. However, existing research has primarily focused on the behaviour of grains under idealised conditions, while systematic investigation of velocity distribution within paddy grain populations remains inadequate. This represents another crucial aspect in understanding centrifugal hulling as a bulk granular system. This study aims to elucidate the formation mechanism of velocity differences in paddy grain populations and propose potential optimisation strategies. The proposed methodology is expected to deliver more precise and practical guidance for enhancing hulling operations.
The complexity of interactions between paddy grains and airflow within centrifugal hullers makes direct observation and real-time monitoring highly challenging. To overcome this limitation, CFD-DEM coupled simulations were employed. This integrated approach combines computational fluid dynamics (CFD) with the discrete element method (DEM) to analyse the kinematic behaviour of paddy grains and has proven highly effective in capturing particle dynamics that are difficult to observe experimentally [15]. Significant progress has been made using this technique in various agricultural processing applications, including cleaning [16,17], grain drying [18,19], and pneumatic separation [20]. While previous studies have often neglected airflow to simplify models [2,21], the high-speed rotation of the impeller generates a complex airflow field that significantly influences grain motion, especially at operational speeds. Therefore, a coupled CFD-DEM approach is essential to accurately capture the synergistic effects of mechanical collision and aerodynamic forces on grain kinematics.
This study employed a validated coupled CFD-DEM approach to model and analyse the motion behaviour of paddy grains within a centrifugal huller. The investigation proceeded as follows: First, the appropriate impact velocity range was determined through single-grain impact experiments. Subsequently, the generation mechanism of velocity differences among grains was investigated by adjusting impeller rotational speed. Building upon this foundation, the kinematic behaviour of paddy grains was analysed in detail at both individual and population levels through the integration of experimental and simulation data. Based on these findings, this study further proposed an optimised impeller blade design incorporating tilt angle and curvature. The performance of this design was systematically validated through both numerical simulation and physical experimentation. The findings provide not only theoretical insights into the grain hulling mechanism but also practical guidance for the design and operational optimisation of centrifugal hullers and related equipment.
2. Materials and Methods
2.1. Experiment
2.1.1. Materials and Equipment
The rice variety used in the experiments was Suijing No. 18 (Japonica rice), as shown in Figure 1a. It was supplied by the Rice Research Institute of Northeast Agricultural University (Harbin, China) and harvested in October 2023. Prior to testing, the paddy grains were manually screened to minimise size variation, thereby reducing potential influences of grain size on the experimental results. The cleaned grains were stored at ambient temperature. The moisture content of the paddy grain samples, measured using the oven-drying method [22], was 11.65% (w.b.), which is within the optimal range for centrifugal hulling (10–12%) as reported by [23]. Additionally, the thousand-grain weight was determined to be 27.32 g.
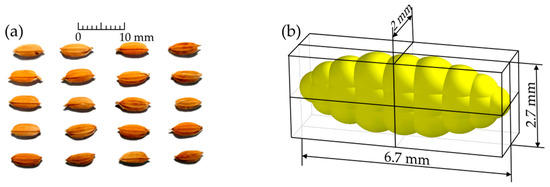
Figure 1.
Geometry of the grain particle: (a) samples of paddy grain and (b) the three-dimensional model of the paddy grain particle used in simulations.
To enable precise control of operating parameters and to investigate the kinematic behaviour and velocity distribution of the paddy grain population. Based on the commercial centrifugal huller FC2K (Figure 2a, Satake Co., Higashi-Hiroshima, Japan), an experimental platform for paddy grain hulling was established, as shown in Figure 2b. This platform was designed to analyse how velocity differences among grains lead to low hulling efficiency and high breakage rates. The system comprises a centrifugal huller, a high-speed camera (FASTCAM Mini UX50, Photron Co., Ltd., Tokyo, Japan), a light source (LED Metal Projection Light, BEIKAAO, Guangdong, China), and a computer (Legion Y7000, Lenovo, Beijing, China). The centrifugal hulling process is facilitated by an impeller system, through which paddy grains are introduced via the feed shaft from the hopper assembly. The grains are subsequently accelerated centrifugally and directionally propelled against a rubberised impact surface, resulting in hull detachment, as demonstrated in Figure 2c. The impeller (Figure 2d), which incorporates two side plates and eight blades, is connected to an electric motor (Y90L-2, Shanghai Yexiang Electric Motor Factory, Shanghai, China) via a coupling. The rotational speed of the electric motor is adjustable through a frequency converter (SPD990, PMSPD, Shanghai, China). To visualise the kinematic behaviour of the paddy grains, the outer shell and one of the side plates of the impeller were replaced with transparent rigid acrylic plastic sheets.
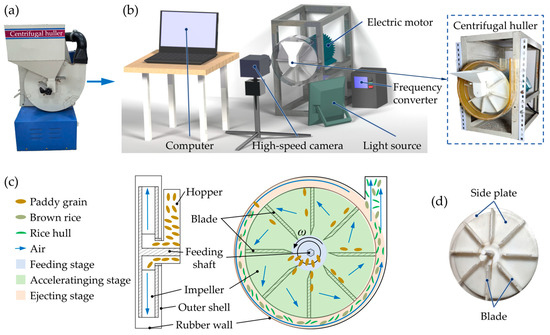
Figure 2.
Paddy grain hulling experimental platform: (a) FC2K centrifugal huller (Satake Co., Higashi-Hiroshima, Japan) (b) experimental equipment, (c) schematic diagram of the working principle, and (d) impeller structure.
2.1.2. Single Paddy Grain Impact Experiment
The determination of the optimal impact velocity range for paddy grains represents crucial information for investigating velocity differences in centrifugal hulling systems. However, it should be noted that the optimal impact velocity range is significantly influenced by the specific rice variety. Consequently, the optimal impact velocity range for the rice variety employed in this study required experimental determination. Due to the complexity of grain motion within centrifugal hullers, direct observation of both impact velocities and hulling efficiency has been found to be particularly challenging. To address these limitations, a single paddy grain impact experimental platform was developed, based on methodologies previously established by Cavalcanti et al. [24] and Tong et al. [25]. The experimental platform (Figure 3a) comprises an air compressor (JB-7509, Guangzhou Leopard Machinery Co., Ltd., Guangzhou, China), a pressure reducing valve (AR2000, Delixi Electric Ltd., Zhejiang, China), and an impact experimental device. The impact experimental device (Figure 3b) includes a manual control valve (JM-06A, Delixi Electric Ltd, Zhejiang, China), an accelerator tube, a photoelectric velocity sensor (HT-X3005, Hangzhou Hante Electronic Co., Ltd., Zhejiang, China), a rubber wall and a foam box. To accurately replicate the hulling process, the rubber material used in the experiment, polyurethane with a Shore hardness of 82, was identical to that in the centrifugal huller. Engineering plastic was installed behind the rubber wall to simulate the huller housing, as shown in Figure 3c. The accelerator tube was constructed from transparent glass to enable precise observation of paddy grain positioning during the experiment, as shown in Figure 3d. The photoelectric velocity sensor system, comprising two precisely aligned optical gate units, was employed to determine paddy grain velocity through measurement of the time interval between successive gate activations and the predetermined spatial separation between the gates.
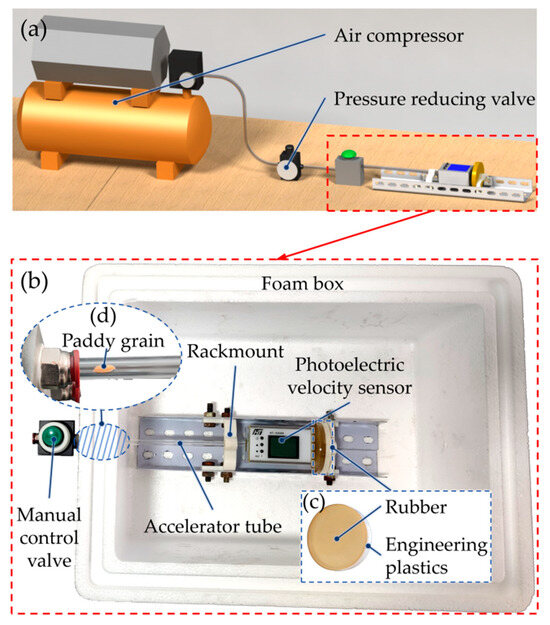
Figure 3.
Single paddy grain impact experimental platform: (a) experimental system, (b) experimental device, (c) rubber wall, and (d) accelerator tube.
The paddy grain impact experiment was conducted using the following specific steps: A single paddy grain was placed at the junction between the manual control valve and the accelerator tube, as shown in Figure 3d. The exit velocity of the paddy grain was controlled by adjusting the pressure reducing valve to regulate the outlet air pressure. Upon opening the manual control valve, the paddy grain was propelled by airflow and collided with the rubber wall. To prevent secondary impacts from bouncing grains after the initial collision, a foam box was used as a collection device. The impact velocity of the paddy grains was measured using a photoelectric velocity sensor. The impact velocity was set within the range of 30 m s−1 to 50 m s−1, divided into 8 groups at intervals of 2.5 m s−1. To ensure statistical reliability, more than 60 impact experiments [1] were conducted for each velocity group to determine the hulling percentage (PE) and breakage percentage (PB). These metrics were calculated using the following equations [23]:
where NS is the number of paddy grains in each group, NRU is the number of unhulled paddy grains after processing, and NB is the number of broken rice grains.
2.2. Numerical Simulations
Hulling is accomplished through the collision of rice grains with the rubber surface, driven by centrifugal force generated from the high-speed rotation of the impeller. However, it has been observed that the high-speed airflow produced by the rotating impeller significantly affects grain motion. The Discrete Element Method (DEM) has been demonstrated to be effective in simulating individual grain motion, including collisions, friction, and energy transfer, while Computational Fluid Dynamics (CFD) has been widely employed to analyse the influence of internal airflow on grain movement. Therefore, a coupled CFD-DEM approach was adopted in this study to accurately simulate the actual motion of paddy grains. The validity of this methodology has been verified, as detailed in Section 2.3.
2.2.1. Mathematical Model
Discrete Element Method (DEM) is a powerful numerical simulation technique widely used to analyse the dynamic behaviour of particles in complex granular systems [26]. To investigate the kinematic behaviour and interaction mechanisms of paddy grain populations in the centrifugal huller, simulations were conducted using DEM software (EDEM 2022; Altair Engineering Inc., Troy, MI, USA) based on the soft-sphere model. Given the low moisture content of the paddy grains, cohesive forces and liquid bridge effects were assumed negligible. Consequently, the Hertz-Mindlin contact model was employed to simulate interactions between paddy grain particles and between the grains and the huller. In this model, the translational and rotational motions of paddy grain particles are governed by Newton’s second law. The corresponding governing equations can be found in Han et al. [27] and Li et al. [16].
Computational Fluid Dynamics (CFD) is a numerical method used to solve fluid flow problems through advanced algorithms and analysis. The CFD-DEM coupled simulation integrates airflow effects, providing a more accurate representation of particle behaviour compared to standard DEM simulations. In this study, the fluid phase was modelled using CFD software (Fluent 2022 R1; ANSYS, Inc., Canonsburg, PA, USA). Given the absence of complex energy transfer processes, only the mass conservation and momentum conservation equations (Navier–Stokes equations) were employed to describe the continuous fluid phase. The governing equations used in these simulations are detailed in a previous study by our research group [20].
In this study, the Dense Discrete Phase Model (DDPM) based on the Euler-Lagrange framework was employed to describe the bidirectional coupling behaviour in particle-fluid two-phase flow. This model is particularly suitable for high-concentration granular flows, as it accurately captures the complex interactions between the two phases. Compared to the conventional Discrete Phase Model (DPM), the key advantage of DDPM lies in its incorporation of the particle phase volume fraction, which realistically reflects the reverse effect of the particle cluster on the fluid phase. This is manifested not only in the intense momentum exchange between particles and fluid, but also in the accurate representation of how high-concentration particles occupy flow space and modulate turbulent characteristics of the fluid. Consequently, the model provides a more realistic simulation of how the particle phase influences and alters the flow field.
2.2.2. DEM Model of Particles
The present study was designed to investigate the fundamental mechanisms underlying velocity differences in paddy grains on the impeller blades. However, it is recognised that grain motion behaviour is influenced by multiple factors, including intrinsic variations, dimensional effects, and hull-kernel separation processes. To focus specifically on grain motion characteristics, a standardised grain model with uniform dimensions and average physical properties was developed, thereby effectively eliminating the aforementioned interfering factors.
The multi-sphere approach has been widely adopted in approximating non-spherical particles due to its computational efficiency and simplicity [28]. Although the contact surfaces of individual sub-spheres in this model are circular, composite contact geometries can be formed by combining multiple sub-spheres [22]. This approach not only achieves higher precision in approximating real contact surfaces but also ensures consistency with macroscopic flow behaviour. Additionally, while increasing the number of sub-spheres enhances model accuracy, it significantly reduces computational efficiency. Previous studies [28] have demonstrated that a 15-sub-sphere configuration sufficiently simulates the flow characteristics of paddy grains. Therefore, a 23-sub-sphere multi-sphere model was developed for paddy grains in this study. This configuration maintains simulation accuracy while fulfilling the requirements for investigating paddy grain flow characteristics.
To ensure geometric accuracy, the length, width, and thickness of 50 paddy grains were systematically measured, and the geometric parameters of the model were determined based on their average values. A schematic representation of the paddy grain model is presented in Figure 1b. The physical parameters of the particles used in the simulations are summarised in Table 1 [2,20].

Table 1.
Physical parameters and corresponding values used in the simulation.
2.2.3. CFD Model of Geometry
The geometric model of the dehulling equipment used in the CFD simulations was consistent with the experimental setup. However, non-core components were removed to improve computational efficiency. In this study, the mesh generation tool in ANSYS Fluent was employed to discretise the simulation domain. Mesh generation is a critical step in numerical simulations, as its quality directly influences the accuracy of results and computational efficiency. Based on the geometric characteristics and flow properties of the simulation domain, a Poly-Hexcore hybrid mesh was adopted for both the stationary and rotating fluid domains, as shown in Figure 4a. This mesh type combines the geometric adaptability of polyhedral cells with the computational efficiency of a hexahedral core, enabling high precision in complex regions while reducing the number of cells in regular regions [29,30]. Furthermore, the mesh quality was optimised using Fluent’s smoothing tool to minimise distortion and ensure numerical stability.
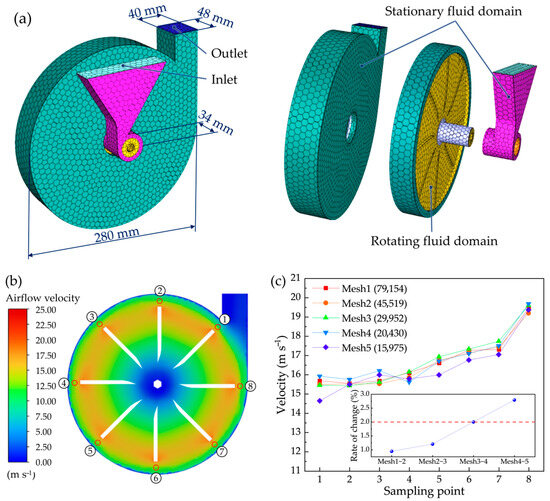
Figure 4.
The centrifugal huller in the CFD simulation: (a) mesh model, (b) airflow velocity contour plot showing the locations of the sampling points (indicated by red circles, with corresponding numerical labels in close proximity), and (c) velocity difference comparison across five mesh configurations.
To eliminate the influence of mesh size on the simulation results, a mesh independence study was conducted. Five sets of meshes, with cell counts of 15,975, 20,430, 29,952, 45,519, and 79,145, were generated, and the solution was progressively refined to approach convergence. By comparing the fluid velocity at sampling points (Figure 4b), it was observed that when the mesh count reached 29,952, the velocity difference compared to denser meshes was less than 2%, indicating that mesh independence had been achieved, as shown in Figure 4c. Consequently, the 29,952-cell mesh was selected to balance computational efficiency and accuracy. The mesh quality parameters (Orthogonal Quality > 0.3) satisfied the requirements of the Fluent solver. The relevant physical parameters are presented in Table 1.
2.2.4. DEM Model of Geometry
The geometric model of the dehulling equipment used in the DEM was derived from the CFD mesh, ensuring consistency between the two models and enabling more accurate coupling. Based on this, baffles and a particle factory were added to the model, as illustrated in Figure 5a. The physical parameters for the particles and geometric materials used in the simulations are presented in Table 1, based on previous studies [2,20].
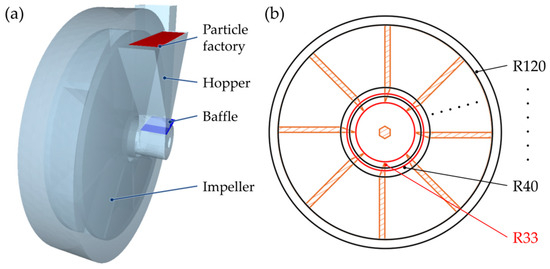
Figure 5.
The centrifugal huller in the DEM simulation: (a) geometric model and (b) annular detection domains for different regions.
To analyse grain velocities at different radial positions on the impeller blade, annular detection domains with a constant width of 10 mm were established across the impeller. For descriptive purposes, these detection domains were designated using the nomenclature “R + inner diameter” (e.g., R33 represents a detection domain with an inner diameter of 33 mm and an outer diameter of 43 mm). A total of ten detection domains (R33, R40, R50, R60, R70, R80, R90, R100, R110, and R120) were established, as shown in Figure 5b.
2.2.5. Simulation Parameters and Conditions
In this study, a transient solver was employed to capture the time-dependent evolution of the system, enabling a more accurate description of dynamic behaviours and transient phenomena. Additionally, the realisable k-epsilon model was utilised to simulate the complex flow behaviour within the centrifugal huller. The inlet boundary condition was set as a pressure inlet to allow free inflow, and the outlet boundary condition was set as a pressure outlet to permit free outflow. The initial pressure values were defined as one standard atmospheric pressure.
In the CFD-DEM coupled simulations, the fluid phase time step was required to be an integer multiple of the particle phase time step. This requirement arises from the explicit coupling approach adopted in this study, where the fluid and particle fields are updated independently at each time step, with data exchange occurring only at fixed intervals. The particle phase time step was set to 1 × 10⁻⁶ s, with paddy grain data recorded at intervals of 2.5 × 10⁻⁴ s. The fluid phase time step was set to 2 × 10⁻⁵ s, and airflow data were recorded at intervals of 1 × 10⁻² s. To ensure simulation accuracy, the rotational motion of the impeller was required to be consistent between the CFD and DEM. In the CFD simulation, impeller rotation was achieved through the implementation of a sliding mesh technique within the designated rotational domain (Figure 4a). Concurrently, in the DEM simulation, rotational motion was directly imposed on the impeller components (Figure 5a). The rotational direction, as specified in Figure 2c, was consistently applied in both simulation approaches.
To analyse the impact velocity differences among paddy grains caused by variations in impeller speed, six experimental groups were designed with a 300 rpm interval. The impeller speeds tested were 1500 rpm, 1800 rpm, 2100 rpm, 2400 rpm, 2700 rpm, and 3000 rpm. The specific steps of the coupled simulation were as follows: First, paddy grain particles were generated in the hopper, and the impeller was activated. After the hopper was filled with paddy grains, the baffle plate at the bottom was removed, allowing the particles to fall freely under gravity. It is noteworthy that continuous feeding was maintained in the hopper to ensure that the paddy grain mass did not fall below 40 g, which could otherwise affect the experimental results. Subsequently, the paddy grain particles were accelerated by the centrifugal force of the rotating impeller. Eventually, the particles separated from the impeller and collided with the rubber wall. Grain velocities were extracted and analysed using a time-averaging approach, where velocity data were processed over a specified time interval to obtain representative motion characteristics. To ensure clarity in the velocity distribution, only the data from the first entry of each particle into the detection domain were retained, thereby avoiding the influence of duplicate data.
To ensure data reliability, information collection was initiated only after the simulation reached a steady state. In this study, the hulling system was considered to have achieved a steady state when the quantity of paddy grain particles within the impeller’s rotating area attained dynamic stability. To monitor this condition, a cylindrical detection domain was established in the impeller rotation area to record the quantity of paddy grain particles in real time, as shown in Figure 6a. As demonstrated in Figure 6b, a steady state was achieved at 1 s across all tested impeller speeds. Consequently, all data in this study were collected from 1 s onwards.
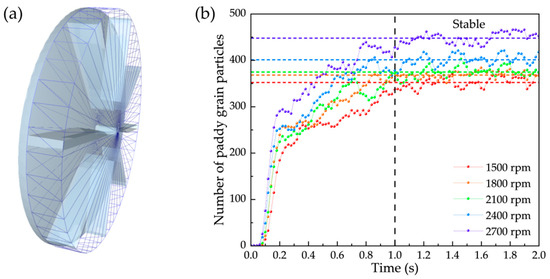
Figure 6.
Verification of the steady state in the simulation: (a) detection domain for paddy grain quantity analysis and (b) variation in paddy grain quantity within the detection domain over time (The dashed line denotes the mean grain count at equilibrium.).
2.3. Verification of Simulation Accuracy
The simulation model was validated to ensure the authenticity and reliability of the obtained results. To facilitate clearer high-speed camera visualisation and minimise measurement errors, the experimental trials were conducted at a low impeller speed of 1500 rpm. The spatial distribution patterns of paddy grains, as shown in Figure 7a,b, demonstrate remarkable consistency between experimental observations and simulation results. Furthermore, a comprehensive comparative analysis of impact velocity distributions was performed between experimental measurements and simulation data. The high-speed camera system, operating at 2500 frames per second, captured grain positions, with subsequent velocity calculations being performed through frame-by-frame analysis.

Figure 7.
Validation of paddy grain velocity: (a) spatial distribution of paddy grains obtained from high-speed camera imaging, (b) spatial distribution of paddy grains in the simulation, and (c) comparison of impact velocity distributions between experimental and simulated results.
Figure 7c presents a comparison of impact velocity distributions at monitoring zone R120 for both experimental and simulated conditions. The analysis revealed that velocity distributions from both methods were predominantly concentrated within the range of 19–23 m s−1, exhibiting Gaussian distribution characteristics. The mean values of the simulation and experiment differ by 0.52 m s−1, corresponding to a relative error of only 2.5%, which is less than 5%. Based on the t-test (p > 0.05), this difference is not statistically significant. However, the experimental distribution exhibited greater dispersion compared to the simulation, which can be attributed to inherent equipment vibrations and unavoidable variations in particle size. These observed differences were found to be within acceptable tolerance limits, while simultaneously confirming the existence of impact velocity differentials among individual grains. The close agreement between experimental and simulated results validates the reliability of the geometric model developed in this study.
As clearly demonstrated in Figure 7a,b, the motion of paddy grains was significantly influenced by airflow patterns. Consequently, a comparative analysis of airflow velocity distributions was conducted between experimental measurements and simulation results to validate the accuracy of the airflow field representation. The airflow velocity measurement system (Figure 8a,b) consisted of a centrifugal huller, an airflow velocity measuring instrument (RS-FS-N01-9TH-OLED, 0–30 m s−1, Resolution 0.1 m s−1,Shandong Renke Measurement and Control Technology Co., Ltd., Shandong, China), a USB to RS485 module protocol converter, and a computer. Airflow velocity was measured by inserting the instrument into sampling holes, with the locations of the sampling points identical to those in Figure 4b. After the centrifugal huller reached a steady state, the airflow velocity at eight sampling points was measured sequentially, with data recorded at 1 s intervals. During measurements at each sampling point, the remaining points were sealed with adhesive tape.

Figure 8.
Validation of airflow velocity: (a) airflow velocity measurement system, (b) airflow velocity measuring device, and (c) comparison of airflow velocities between experimental and simulated results.
Figure 8c compares the experimental and simulated airflow velocities, demonstrating that the airflow velocity increases from sampling point 1 to point 8. This indicates that the airflow trends in both the experiment and simulation are consistent. However, the simulation exhibited slightly higher airflow velocities compared to the experiment. This discrepancy is primarily attributed to the high level of air tightness in the simulation model, which is challenging to replicate in physical experiments. Additionally, the intrusive nature of the experimental measurement method, where the probe inevitably created airflow resistance, contributed to the differences. Given that the simulation was conducted under ideal conditions, minor discrepancies between the experimental and simulated results are expected and acceptable. Therefore, the geometric model developed in this study is reliable and accurate.
In summary, the simulation results for both the discrete and fluid phases were found to align well with the experimental results. The CFD-DEM coupled model utilised in this study has been demonstrated to effectively simulate the kinematic processes of paddy grains within a centrifugal huller.
3. Results
The investigation of impact velocity differences among paddy grains in centrifugal hullers is based on establishing the correlation between impact velocity and hulling performance. To this end, a single-grain impact test was conducted following the methodology described in Section 2.1.2. The hulling and breakage rates at different impact velocities were statistically analysed and calculated, as shown in Figure 9a. According to the national hulling standard [31], the hulling rate must exceed 85% while the breakage rate should remain below 2%. Based on these criteria, the suitable impact velocity range for the paddy grains used in this study was determined to be between 37.5 m s−1 and 40 m s−1.
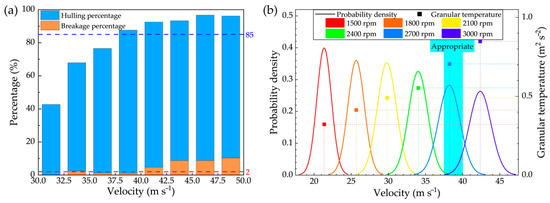
Figure 9.
Impact behaviour of paddy grains: (a) relationship between hulling percentage, breakage percentage, and impact velocity (the blue dashed line indicates the hulling rate standard; the red dashed line represents the breakage rate standard) and (b) impact velocity distribution and granular temperature at different impeller speeds (the cyan shaded area denotes the optimal impact velocity range).
In centrifugal hullers, impact velocity differences within the paddy grain population are prevalent [1], and these differences directly influence the final product quality. To mitigate this issue, increasing the impeller speed is often employed as a method to enhance both work efficiency and product quality. However, this approach is frequently accompanied by a higher breakage percentage. To better understand the effect of impeller speed on the differences in paddy grain population impact velocity, the concept of granular temperature was introduced. Granular temperature serves as a measure to assess the degree of velocity dispersion and is widely recognised as a key indicator for evaluating the kinematic behaviour and randomness within particle systems [32]. A higher granular temperature corresponds to greater velocity differences among particles. The formula for granular temperature is as follows:
where T is the granular temperature of the paddy grain population, m2 s−2; vi is the velocity of the paddy grain i, m s−1; vm is the average velocity of the paddy grains, m s−1; and N is the number of paddy grains in the detection domain. The distribution of paddy impact velocity at the R120 position for different impeller speeds was statistically analysed using CFD-DEM coupled simulations, as illustrated in Figure 9b. The results revealed that increasing the impeller speed led to an elevation in the impact velocity of the paddy grain population. However, it also resulted in a widening of velocity differences among the paddy grains. This indicates that merely adjusting the impeller speed is insufficient to effectively control the impact velocity distribution within the optimal range, thereby making it challenging to significantly improve hulling quality. Notably, the impact velocity distribution was found to be closest to the appropriate range when the impeller speed was set to 2700 rpm. Consequently, subsequent studies were conducted with an impeller speed of 2700 rpm as the primary condition.
To mitigate the adverse effects of velocity differences among paddy grains in centrifugal hullers, it is essential to thoroughly understand their formation mechanism. As illustrated in Figure 2c, the movement of paddy grains before colliding with the rubber wall is divided into three distinct stages. First, the process in which the paddy grains enter the hulling chamber but have not yet been accelerated by the blades is referred to as the feeding stage. Next, the process in which the paddy grains make contact with the rotating blades and are accelerated is referred to as the accelerating stage. Finally, the process in which the paddy grains detach from the blades and impact the rubber wall is referred to as the ejecting stage. During the feeding and accelerating stages, the paddy grains are in contact with the equipment, resulting in significant velocity fluctuations. However, during the ejecting stage, the paddy grains are no longer in contact with the equipment, and their velocity remains nearly constant [33]. Therefore, this study focuses on the velocity differences that arise during the feeding and accelerating stages. The formation mechanism of velocity differences among paddy grains is further elaborated by analysing the kinematic velocity distribution of the paddy grain population, the movement behaviour of individual paddy grains, and theoretical considerations.
3.1. Interaction Mechanisms Between Paddy Grains and Blades During the Feeding Stage
The unsteady kinematics of paddy grains during the feeding stage marks the initiation of velocity differences among paddy grains. To analyse the causes of these velocity differences, velocity distributions at varying impeller speeds were measured at the end of the feeding stage (R33), as illustrated in Figure 10a. The velocity distribution of the paddy grain population exhibited a trimodal pattern. For ease of analysis and description, the three peaks were designated as Peak I, Peak II, and Peak III, from left to right. Figure 10b presents the trends in the average velocity and granular temperature of the paddy grains at different impeller speeds. The data revealed that the average velocity of the paddy grains increased significantly with higher impeller speeds, accompanied by a gradual increase in velocity differences within the population.
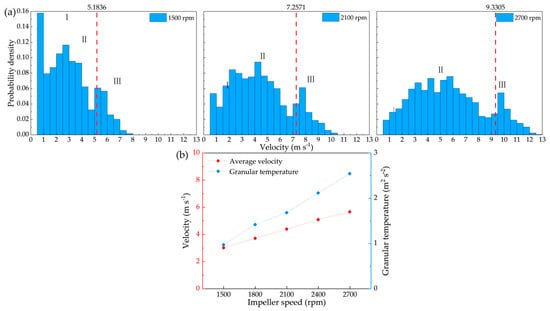
Figure 10.
Velocity distribution of paddy grains during the feeding stage at different impeller speeds: (a) velocity distribution in R33 (the red dotted line indicates the linear velocity at the inner edge of the impeller) and (b) average velocity and granular temperature of paddy grains.
To clarify the underlying cause of the trimodal velocity distribution, the kinematic behaviour of representative paddy grains from each of the three peaks was traced, as shown in Figure 11. The velocity of paddy grain No. I remained nearly constant upon reaching its statistical position, indicating that this grain was undisturbed. In contrast, paddy grain No. II was subjected to a tangential collision, resulting in an increase in velocity, with its velocity at the statistical position reflecting the post-collision value. Similarly, paddy grain No. III underwent an axial collision, leading to a velocity increase, with its velocity at the statistical position corresponding to the post-collision value.
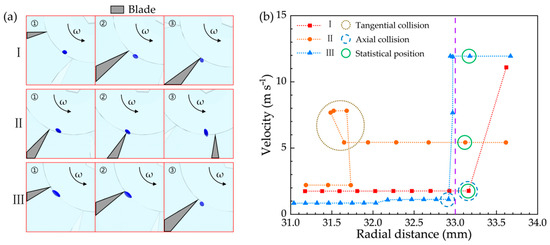
Figure 11.
Motion behaviour of paddy grains: (a) snapshots of paddy grain particles at the three peaks (other particles are hidden for clarity) and (b) kinematic velocity versus distance for paddy grain particles at the three peaks (the purple dotted line indicates the inner edge of the impeller).
Therefore, the trimodal distribution can be explained as follows: Peak I represents the most concentrated distribution, corresponding to the undisturbed velocity of the paddy grains. As the impeller speed increases, the probability of disturbances also rises, causing the magnitude of Peak I to decrease and eventually disappear. Peak II arises due to tangential collisions between paddy grains and the impeller blades, resulting in greater velocity variability and a broader distribution. Finally, Peak III is attributed to axial collisions, with the post-collision velocity strongly correlated with the linear velocity of the blade. This correlation causes the distribution of Peak III to increase in tandem with the blade’s linear velocity. In general, the different forms of collision between the paddy grains and blades were identified as the primary cause of the velocity differences, with tangential collisions playing a predominant role.
3.2. Collision Behaviour Between Paddy Grains and Blades During the Accelerating Stage
The paddy grains were accelerated to impact velocity primarily by the centrifugal force generated by the impeller. However, the kinematic behaviour of paddy grains on the blades remains unclear, and the influence of velocity differences formed during the feeding stage on the accelerating process has not been fully investigated. Therefore, in this section, the kinematic behaviour of individual paddy grains on the blades will be analysed from a theoretical perspective, and the mechanisms responsible for the formation of velocity differences are elucidated.
Previous research has investigated the motion of paddy grains on the blades, with equations derived by some scholars to describe the sliding behaviour of the grains based on theoretical principles [10]. Given that the effects of gravity and airflow on the paddy grains are negligible compared to the forces exerted by the impeller, the simplified equations of motion are provided below:
in which:
where r is the radial distance between the paddy grain and the centre of the impeller, mm; ω is the rotation velocity of the impeller, rad s−1; t is the kinematics time, s; μ is the kinetic friction coefficient between the paddy grain and the blades; v0 is the initial radial velocity of the paddy grain, m s−1; r0 is the initial radial distance from the paddy grain to the impeller centre, mm; and P, Q, C1, and C2 are intermediate variables. To represent the velocity (v) trend of the paddy grain, we define:
Since the function curve of velocity (v) as a function of radial distance (r) could not be directly plotted, the numerical solution was calculated using the structural and operational parameters of the paddy hulling experimental platform. The parametric curve of v versus r was subsequently generated. Figure 12 presents the parametric curves for initial velocity (v0) values of 0 m s−1 and 10 m s−1. It was observed that the influence of v0 on the impact velocity of the paddy grains becomes negligible when r exceeds a critical threshold.
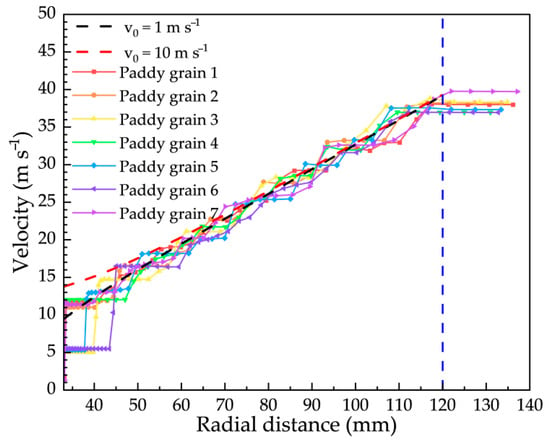
Figure 12.
Velocity (v) versus radial distance (r) for paddy grains (the blue dotted line represents the outer edge of the impeller; red and black dotted lines correspond to parametric curves for two different initial velocities, v0).
To verify the applicability of the derived formula, paddy grains with different initial velocities (v0) were randomly tracked. Their velocities (v) and radial distances (r) were recorded at intervals of 2.5 × 10⁻⁴ s. The comparison between theoretical predictions and experimental results, as shown in Figure 12, demonstrates that the equations effectively predict the general trend of paddy grain velocity on the blade. However, the equations do not account for collisions between the paddy grains and the blades. These collisions lead to variations in the positions of the paddy grains detached from the impeller, resulting in differences in the accelerating process and, consequently, differences in impact velocities. Therefore, further investigation into the effects of paddy grain collisions with the blades is necessary to improve the stability of the paddy grains’ kinematic behaviour and to reduce velocity differences among paddy grains.
Understanding the kinematic behaviour of individual paddy grains is essential for investigating the velocity differences among paddy grains. In this study, the equations describing the collision behaviour of paddy grains with the blades were derived through theoretical analysis to clarify the influence of various parameters. For this analysis, the paddy grain was assumed to be a material point, the collision was considered elastic, and the effects of gravity and airflow were neglected. The first two collisions between the paddy grain and the impeller (as shown in Figure 13a) were selected for analysis. The derived equations are based on the principles of conservation of kinetic energy and the coefficient of restitution. It is important to emphasise that these equations are intended to provide insight into the mechanics of the collisions and should not be used to predict the velocity of the paddy grains.
in which:
where O1 and O2 represent the collision point; θ is the rotation angle of O2 with respect to O1, °; t1 is the time taken for the paddy grain to travel from O1 to O2, s; e is the coefficient of restitution between the paddy grains and the blades. At point O1, r1 is the radial distance, mm; vr1 is the linear velocity of the blade, m s−1; vx1 is the radial velocity of the paddy grain, m s−1; vy1 is the tangential velocity of the paddy grain after collision, m s−1; and is the tangential velocity of the paddy grain before collision, m s−1. Similarly, at point O2, r2 is the radial distance, mm; vr2 is the linear velocity of the blade, m s−1; vx2 is the radial velocity of the paddy grain, m s−1; vy2 is the tangential velocity of the paddy grain after collision, m s−1; and is the tangential velocity of the paddy grain before collision, m s−1. To investigate the effect of different factors on the collision behaviour, four cases with varying initial parameters were designed, as shown in Table 2. Subsequently, numerical solutions for each case were calculated using Equations (12) and (13).
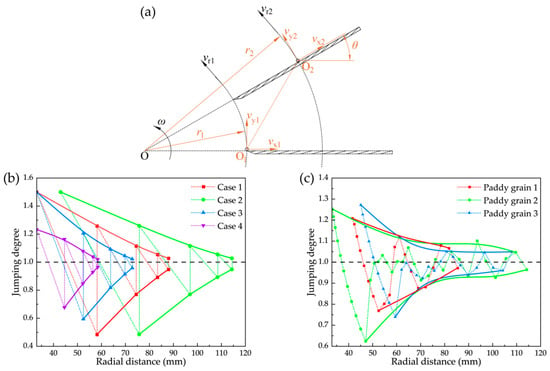
Figure 13.
Analysis of paddy grain collision behaviour: (a) analysis of paddy grain motion, (b) theoretical trends of paddy grain jumping degree, and (c) trends of tracked paddy grain jumping degree over time.

Table 2.
Initial parameters for the four cases.
To compare the collision behaviour across different cases, a “jumping degree (Sv)” is defined to quantitatively assess the intensity of the collisions. The formula is as follows:
where vy is the tangential velocity of the paddy grain, m s−1; and vr is the linear velocity of the impeller at the position of the paddy grain, m s−1. Therefore, when Sv > 1, the paddy grain moves away from the blade; when Sv < 1, the paddy grain moves closer to the blade; and when Sv = 1, the paddy grain slides along the blade. Figure 13b shows the jumping degree trends for the four cases. To validate the accuracy of the theoretical model, three representative paddy grains were selected to track their kinematic behaviour. After the paddy grains collided with the blades, their velocities and positions were recorded every 2.5 × 10⁻⁴ s, and their corresponding jumping degrees were calculated, as shown in Figure 13c. Although some deviations were observed between the experimental and theoretical jumping degrees, the overall trend remains consistent. These discrepancies are mainly attributed to differences in the initial parameters of the paddy grains. Therefore, the jumping degree can be effectively used to analyse the kinematic behaviour of paddy grains.
As shown in Figure 13b, the jumping degree (Sv) exhibits a fluctuating trend, reflecting the collision behaviour between the paddy grain and the blade. The gradual convergence of the jumping degree towards 1 indicates that the motion of the paddy grain on the blade is stabilising. Collisions between the paddy grains and the blades lead to velocity differences. Therefore, achieving stable kinematics of the paddy grains on the blades is crucial for reducing velocity differences among paddy grains.
Increasing both the initial radial velocity (vx1) and tangential velocity (vy1) enhances the ability of the jumping degree to converge towards 1, facilitating the stabilisation of the paddy grain’s motion on the blade. In contrast, increasing the initial radial distance (r1) does not significantly affect the ability of the jumping degree to converge towards 1, but it does increase the distance required for convergence. This, in turn, reduces the stability of the paddy grain’s motion at a given radial position. Therefore, increasing the initial velocity of the paddy grains and reducing the distance to the first collision enhances the ability of the jumping degree to converge towards 1. This makes it easier for the paddy grains to stabilise their motion on the blade, thereby reducing impact velocity differences and optimising the hulling performance.
3.3. Velocity Distribution Trends in the Paddy Grain Population
In the previous section, the investigation focused on the kinematics of individual paddy grains. In this section, the velocity differences in radial distance and the factors influencing these differences are analysed from the perspective of the entire paddy grain population. The velocity distribution of the paddy grain population at various radial positions is statistically presented in Figure 14a. It can be observed that, initially, the velocity distribution exhibits a bimodal pattern. As the radial distance increases, the low-velocity peak gradually diminishes, while the high-velocity peak becomes more prominent. When the low-velocity peak disappears, the velocity range of the high-velocity peak widens further. Figure 14b shows the granular temperatures at various radial positions, indicating that the granular temperature of the paddy grain population follows a trend of first decreasing and then increasing. Furthermore, as the impeller speed increases, the granular temperature becomes more pronounced, consistent with the experimental results shown in Figure 9b. Based on this observation, the phase where granular temperature decreases is referred to as the “pooling phase”, while the phase where it increases is referred to as the “diffusion phase”.
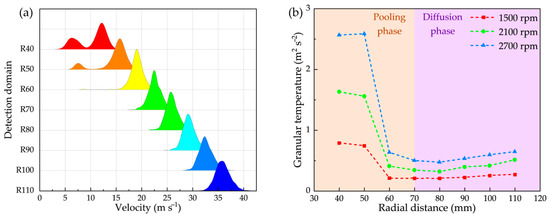
Figure 14.
Velocity differences within the paddy grain population: (a) velocity distribution at various radial locations and (b) granular temperature at different radial positions.
Based on Figure 12, the velocity of paddy grains increases significantly following their initial axial collision with the blade. This transition enables grains originally belonging to the low-velocity peak to shift into the high-velocity peak after contacting the impeller. As demonstrated by the trajectories of grains 3, 5, and 6, variations in collision positions with the impeller result in corresponding differences in the locations where grains enter the high-velocity peak. Once all grains have undergone their first axial collision, the low-velocity peak disappears, marking the end of the pooling stage. As acceleration continues, velocity differences among grains increase due to system instability and inherent grain characteristics, indicating the onset of the diffusion phase.
In summary, the velocity of the paddy grain population increased as the radial distance increased, with the velocity difference initially decreasing and then increasing. During the pooling phase, the paddy grain population exhibited a bimodal velocity distribution due to the varying locations of initial axial collisions. In the diffusion phase, the velocity differences gradually expanded, driven by factors such as system instability and paddy grain characteristics.
3.4. Influence of Airflow on Velocity Differences
The substantial airflow generated by the rotating impeller has frequently been overlooked in previous studies [21]. However, as presented in Section 2.3, the measured airflow velocity reached 9.5–12.5 m s−1 at an impeller speed of 1500 rpm (Figure 8c), which is close to the suspension velocity of paddy grains (8.1–10.1 m s−1) reported by Chen et al. [20]. Neglecting this factor may lead to inaccuracies in the analysis. To clarify the effect of airflow on velocity differences among paddy grains, a controlled experiment was conducted. As shown in Figure 15, granular temperature is markedly lower in the absence of airflow than in its presence, particularly at larger radial distances. Additionally, Figure 4a indicates that airflow velocity increases with radial distance. These results collectively demonstrate that the strong airflow induced by the impeller significantly contributes to increased velocity differences within the paddy grain population.
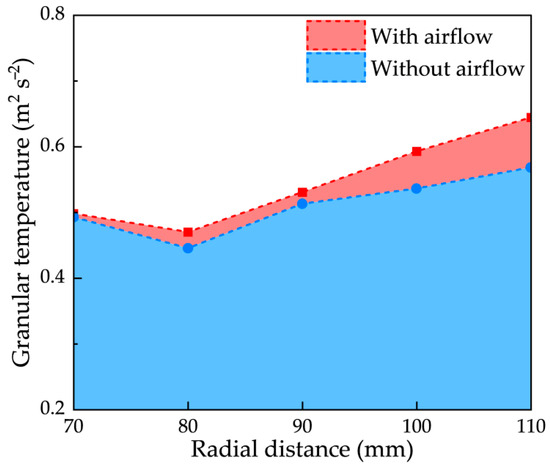
Figure 15.
Comparison of granular temperatures with and without airflow.
3.5. Tilted Curvature Blade Design
The aforementioned studies have confirmed that the bouncing of paddy grains on impeller blades contributes significantly to velocity differences. Reducing the extent of this bouncing effectively diminishes such variations. Therefore, this study calculated the jumping degree (Sv) of curved blades with a 300 mm radius of curvature, with the results presented in Figure 16a. The calculation procedure followed a similar methodology to that outlined in Equations (12)–(17) and is not repeated here. The results demonstrate that curved blades exhibit a stronger tendency for the jumping degree to converge towards 1. Furthermore, tilted blades provide another effective approach by reducing collisions. Based on these insights, a novel blade design incorporating both tilt and curvature was proposed.
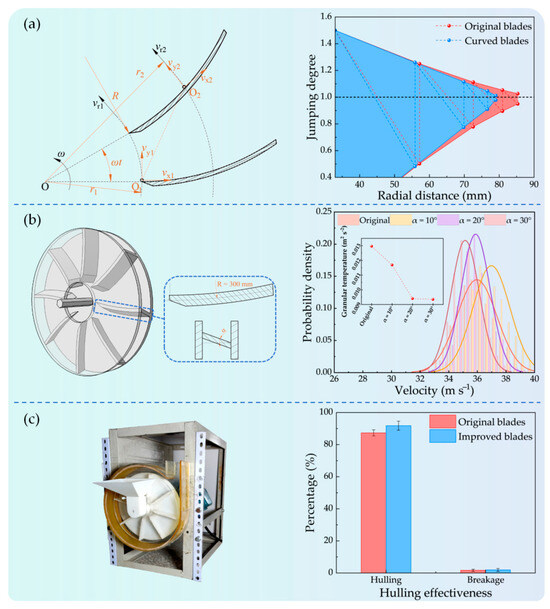
Figure 16.
Blade modification and validation: (a) variation in blade jumping degree (Sv), (b) comparison of velocity differences, and (c) paddy grain hulling experiment.
A single-factor experiment was conducted to determine the optimal blade tilt angle for minimising velocity differences in paddy grains. Three tilt angles (10°, 20°, and 30°) were evaluated, with results presented in Figure 16b. Analysis of granular temperature data revealed that velocity differences initially decreased with increasing tilt angle but stabilised beyond 20°. During this process, the granular temperature, which reflects velocity differences, was reduced by 27.5%. Furthermore, as tilt angle increased, the average grain velocity decreased, necessitating higher impeller speeds to maintain the optimal impact velocity range and consequently increasing energy consumption. Therefore, a 20° tilt angle provides the optimal balance, achieving minimal velocity differences while maintaining a suitable average velocity.
To further validate the practical performance of the modified blade, experiments were conducted using a custom-built centrifugal huller. As shown in Figure 16c, the improved blade design enhances hulling efficiency by 4.5% through reduced velocity differences. These results confirm the effectiveness of the tilted curvature blade and provide both a theoretical foundation and technical support for future design optimisations.
4. Discussion
This study employed a coupled CFD-DEM approach to investigate the formation mechanism of velocity differences among paddy grains within a centrifugal huller, leading to the development of an optimised impeller blade design. Contrary to the intuitive assumption that “higher initial velocities hinder motion stabilisation” [34], our results demonstrate that a greater initial radial velocity (vx1) actually reduces the tendency of grains to bounce on the blade surface. This bouncing behaviour explains why existing theoretical models [12,13,14] struggle to accurately describe the actual motion patterns of grains on the blades. Consequently, the theoretical framework requires extension to improve the predictive accuracy of grain kinematics.
A key advantage of the CFD-DEM methodology lies in its ability to capture synergistic interactions between the mechanical (DEM) and fluid (CFD) phases, which represents an aspect largely overlooked in previous studies [2,21]. Our simulations confirm that impeller rotation generates a complex, high-velocity airflow field within the hulling chamber (Figure 4b). This airflow actively participates in grain kinematics rather than serving as a passive bystander (Figure 15). Grains entrained in the airstream experience acceleration or deceleration compared to theoretical ballistic trajectories [35], consequently broadening the final impact velocity distribution. For lower-density grains such as millet [36,37], the influence of such airflow on their motion during centrifugal hulling is expected to be more pronounced. Subsequent research that integrates relevant findings from centrifugal fan studies [38] to further investigate the specific mechanisms of airflow within centrifugal hullers would provide valuable theoretical guidance for equipment optimisation.
Building upon the mechanistic insights provided by CFD-DEM simulations, this study developed a novel tilted curvature blade design. The achieved 4.5% improvement in hulling efficiency, while numerically modest, constitutes significant progress in an industrial context. It should be noted, however, that the validation of the optimised blade was conducted exclusively through short-term laboratory-scale experiments. Long-term durability tests under continuous industrial operating conditions, along with assessments of blade wear and performance consistency over extended periods, represent necessary steps before widespread implementation can be recommended. Additionally, the optimised blade parameters were developed specifically for the Suijing No. 18 rice variety. While the general optimisation principle of designing blades that promote stable sliding conditions (Sv ≈ 1) through reduced collision intensity remains universally applicable, the specific optimal curvature and tilt angle may require adjustment for varieties with different physical properties such as size, shape, and friction coefficients. Nevertheless, the mechanistic understanding established through numerical simulations continues to provide valuable guidance for optimising the design of centrifugal hullers and similar impact-based hulling equipment [39,40,41].
Several limitations of this study indicate productive directions for future research. First, the modelling assumed uniform grain size and properties, whereas actual processing involves inherent biological variability. Subsequent investigations should incorporate polydisperse particle size distributions to evaluate the robustness of the optimised design. Second, although the role of airflow was identified and its field visualised, more detailed quantification of drag and pressure forces on individual grains would help disentangle mechanical and aerodynamic contributions. Finally, the influence of grain moisture content, a critical factor affecting hulling quality, was not examined. Future work investigating moisture content variations could yield more comprehensive operational guidelines for industrial applications.
5. Conclusions
This study analyses the formation mechanisms of velocity differences among paddy grains through CFD-DEM simulations, leading to the following conclusions:
- The different forms of collision between the paddy grains and the blades during the feeding stage were identified as the primary cause of the velocity differences, with tangential collisions playing a dominant role. These differences increased with higher impeller speeds.
- Axial collisions between paddy grains and blades during the accelerating stage were identified as the primary cause of velocity differences. The jumping degree (Sv) parameter was demonstrated to effectively quantify the relative motion of paddy grains to the blades. Increasing the initial velocity of the paddy grains and reducing the radial distance of the initial collision facilitated the convergence of the jumping degree towards unity, thereby reducing velocity differences.
- The velocity of the paddy grain population increased with radial distance, with velocity differences initially decreasing and then increasing. The velocity distribution of the paddy grain population initially exhibited a bimodal distribution due to varying axial collision positions. Following the transition to a unimodal distribution, velocity differences gradually increased due to system instability and particle characteristics. Notably, the strong airflow generated by the impeller was identified as one of the contributing factors to increased velocity differences.
- A tilted curvature blade design was developed to minimise velocity differences among paddy grains. The results demonstrate that the configuration with a 300 mm radius of curvature and 20° tilt angle achieves a 27.5% reduction in velocity differences. Experimental verification confirmed that this optimised design improves hulling efficiency by 4.5%. This enhancement holds significant practical implications for agricultural processing operations.
Author Contributions
Conceptualization, H.L., H.G., X.W. and X.L.; Data curation, H.L.; Formal analysis, H.G.; Funding acquisition, D.Z.; Investigation, X.W. and H.Y.; Methodology, H.L.; Project administration, D.Z.; Resources, D.Z.; Software, H.L. and X.L.; Supervision, Z.S.; Validation, H.L., H.G. and Z.S.; Visualisation, H.Y.; Writing—original draft, H.L.; Writing—review and editing, H.L. All authors have read and agreed to the published version of the manuscript.
Funding
Heilongjiang Provincial Postdoctoral Science Foundation (Project Nos. LBH-Z23098).
Data Availability Statement
The original contributions presented in the study are included in the article, further inquiries can be directed to the corresponding author.
Conflicts of Interest
The authors declare no conflicts of interest.
Abbreviations
The following abbreviations are used in this manuscript:
| CFD | Computational Fluid Dynamics |
| DEM | Discrete Element Method |
References
- Chu, Y.; Han, Y.; Jia, F.; Wang, Y.; Chen, P.; Meng, X.; Li, A. Analysis of the impact hulling behaviour of paddy grains. Biosyst. Eng. 2022, 220, 243–257. [Google Scholar] [CrossRef]
- Li, A.; Jia, F.; Chu, Y.; Han, Y.; Li, H.; Sun, Z.; Ji, S.; Li, Z. Simulation of the movement of rice grains in a centrifugal huller by discrete element method and the influence of blade shape. Biosyst. Eng. 2023, 236, 54–70. [Google Scholar] [CrossRef]
- Han, Y.; Zhao, D.; Chu, Y.; Zhen, J.; Li, G.; Zhao, H.; Jia, F. Breakage behaviour of single rice particles under compression and impact. Adv. Powder Technol. 2021, 32, 4635–4650. [Google Scholar] [CrossRef]
- Tang, H.; Zhu, G.; Xu, W.; Xu, C.; Wang, J. Discrete element method simulation of rice grains impact fracture characteristics. Biosyst. Eng. 2024, 237, 50–70. [Google Scholar] [CrossRef]
- Tang, H.; Zhu, G.; Sun, Z.; Xu, C.; Wang, J. Impact damage evolution rules of maize kernel based on FEM. Biosyst. Eng. 2024, 247, 162–174. [Google Scholar] [CrossRef]
- Hashmi, A.; Ito, N. Determining effects of impeller peripheral area on husking properties of rice. J. Soc. High Technol. Agric. 2003, 15, 140–148. [Google Scholar] [CrossRef][Green Version]
- Khodabakhshian, R.; Bayati, M. Investigation into the effects of impeller vane patterns and pistachio nut size on hulling efficiency of pistachio nuts using a centrifugal huller. J. Food Process. Technol. 2011, 2, 3. [Google Scholar] [CrossRef]
- Umani, K.C.; Olatunji, O.M.; Ekop, I.E.; Akpan, G.E. Experimental investigation of the effect of rotor speed of a horizontal shaft centrifugal palm nut cracker on optimum whole kernel production and shell particle size. Sci. Afr. 2020, 7, e00238. [Google Scholar] [CrossRef]
- Wang, X.; Ito, N.; Miwa, K.; Kito, K.; Wang, X. Studies on friction and impact characteristics of impeller type rice husker (Part 2)—Design of blade shape with frictional energy. J. Jpn. Soc. Agric. Mach. 1997, 59, 11–19. [Google Scholar] [CrossRef]
- Kamide, J.; Tsuchiya, M.; Akase, A. The study on an impeller type rice huller (II)—The motion of a grain and hulling action on the blade of an impeller. J. Jpn. Soc. Agric. Mach. 1980, 42, 491–497. [Google Scholar] [CrossRef]
- Nishiyama, Y.; Shisai, T. Dynamical analysis of impeller-type rice husker. J. Jpn. Soc. Agric. Mach. 1991, 53, 227–228. (In Japanese) [Google Scholar] [CrossRef]
- Lachuga, Y.; Ibyatov, R.; Ziganshin, B.; Shogenov, Y.; Dmitriev, A. Simulation of the grain trajectory along working bodies of the pneumatic mechanical dehuller. Russ. Agricult. Sci. 2020, 46, 534–538. [Google Scholar] [CrossRef]
- Lachuga, Y.; Ibyatov, R.; Shogenov, Y.; Ziganshin, B.; Dmitriev, A. Method for estimating grain motion trajectory in a pneumomechanical husking machine. Russ. Agricult. Sci. 2021, 47, S106–S110. [Google Scholar] [CrossRef]
- Lachuga, Y.; Ibyatov, R.; Shogenov, Y.; Ziganshin, B.; Dmitriev, A. Results of numerical calculation of grain movement in a pneumatic mechanical huller. Russ. Agricult. Sci. 2022, 48, 521–526. [Google Scholar] [CrossRef]
- Li, A.; Jia, F.; Zhang, J.; Han, Y.; Meng, X.; Chen, P. The effects of filling level on the milling accuracy of rice in the friction rice mill. Powder Technol. 2021, 398, 117052. [Google Scholar] [CrossRef]
- Li, H.; Li, Y.; Fang, G.; Zhan, Z.; Xu, L. CFD-DEM simulation of material motion in air-and-screen cleaning device. Comput. Electron. Agric. 2012, 88, 111–119. [Google Scholar] [CrossRef]
- Yuan, J.; Wu, C.; Li, H.; Qi, X.; Xiao, X.; Shi, X. Movement rules and screening characteristics of rice-threshed mixture separation through a cylinder sieve. Comput. Electron. Agric. 2018, 154, 320–329. [Google Scholar] [CrossRef]
- Amjad, W.; Chen, Z.; Ambrose, K. Design assessment of grain inverters in cross-flow grain dryer via CFD-DEM numerical simulation. Biosyst. Eng. 2024, 239, 147–157. [Google Scholar] [CrossRef]
- Liu, H.; He, Y.; Tang, T.; Zhai, M. Prediction of the non-uniform drying of wet grain in a fluidised-bed based on a modified CFD-DEM drying model. Biosyst. Eng. 2023, 236, 103–119. [Google Scholar] [CrossRef]
- Chen, P.; Han, Y.; Jia, F.; Zhao, D.; Meng, X.; Li, A.; Chu, Y.; Zhao, H. Investigation of the mechanism of aerodynamic separation of rice husks from brown rice following paddy hulling by coupled CFD-DEM. Biosyst. Eng. 2022, 218, 200–215. [Google Scholar] [CrossRef]
- Shitanda, D.; Nishiyama, Y.; Koide, S. Husking characteristics of short and long grain rice by rubber roll husker (part 1)—Dynamic analysis of a single grain motion. J. Jpn. Soc. Agric. Mach. 2001, 63, 55–63. [Google Scholar] [CrossRef]
- Fei, J.; Feng, W.; Jia, F.; Han, Y.; Chen, P.; Li, A.; Wang, Y.; Zhang, J.; Shen, S.; Hao, X. The mechanism of bran layer removal in friction rice mills. Biosyst. Eng. 2023, 229, 85–95. [Google Scholar] [CrossRef]
- Alsharifi, S.; Arabhosseini, A.; Kianmehr, M.; Kermani, A. Effect of moisture content, clearance and machine type on some qualitative characteristics of rice (Tarm hashemi) cultivar. Bulgar. J. Agricult. Sci. 2017, 23, 348–355. [Google Scholar]
- Cavalcanti, P.; Petit, H.; Thomazini, A.; Carvalho, R.; Tavares, L. Modeling of degradation by impact of individual iron ore pellets. Powder Technol. 2021, 378, 795–807. [Google Scholar] [CrossRef]
- Tong, Z.; Yang, R.; Yu, A.; Adi, S.; Chan, H. Numerical modelling of the breakage of loose agglomerates of fine particles. Powder Technol. 2009, 196, 213–221. [Google Scholar] [CrossRef]
- Jiang, S.; Ye, Y.; Tan, Y.; Liu, S.; Liu, J.; Zhang, H.; Yang, D. Discrete element simulation of particle motion in ball mills based on similarity. Powder Technol. 2018, 335, 91–102. [Google Scholar] [CrossRef]
- Han, Y.; Jia, F.; Zeng, Y.; Jiang, L.; Zhang, Y.; Cao, B. Effects of rotation speed and outlet opening on particle flow in a vertical rice mill. Powder Technol. 2016, 297, 153–164. [Google Scholar] [CrossRef]
- Han, Y.; Zhao, D.; Jia, F.; Qiu, H.; Li, A.; Bai, S. Experimental and numerical investigation on the shape approximation of rice particle by multi-sphere particle models. Adv. Powder Technol. 2020, 31, 1574e1586. [Google Scholar] [CrossRef]
- Arocena, V.M.; Danao, L.A.M. Improving the modeling of pressure pulsation and cavitation prediction in a double-volute double-suction pump using mosaic meshing technology. Processes 2023, 11, 660. [Google Scholar] [CrossRef]
- Hua, C.; Liang, W.; Li, F.; Zhu, Q.; Li, Q.; Chen, L. Preliminary design and hydrodynamic study of power-driven float pole system in Pacific saury fishery. Ocean Eng. 2024, 308, 117990. [Google Scholar] [CrossRef]
- GB/T 29898; Grain and Oil Machinery—Rubber Roll Husker. General Administration of Quality Supervision, Inspection and Quarantine of China, Standardization Administration of China: Beijing, China, 2013.
- Brennen, C. Fundamentals of Multiphase Flow; Cambridge University Press: Cambridge, UK, 2005. [Google Scholar]
- Nishiyama, Y. Dynamical Analysis of Impeller-type Rice Husker (Part 1)—Theoretical Equations and the Laws of Proportion for Grain-Impeller Dynamics. J. Jpn. Soc. Agric. Mach. 1991, 53, 71–76. [Google Scholar] [CrossRef]
- Thornton, S.T.; Marion, J.B. Collisions and Systems of Particles, Chapter 9. In Classical Dynamics of Particles and Systems, 5th ed.; Academic Press International Edition: London, UK, 2004. [Google Scholar]
- Ji, S.; Li, A.; Han, Y.; Li, H.; Sun, Z.; Zhao, D.; Gao, H. Numerical study on the influence mechanism of feed rate on separation quality in a multi-baffle separation duct. Biosyst. Eng. 2025, 258, 104258. [Google Scholar] [CrossRef]
- Singh, S.M.; Joshi, J.; Rao, P.S. Technological advancements in millet dehulling and polishing process: An insight into pretreatment methods, machineries and impact on nutritional quality. Grain Oil Sci. Technol. 2024, 7, 186–195. [Google Scholar] [CrossRef]
- Singh, S.M.; Rao, P.S. Impact dehulling of browntop millet: Its physical and nutritional characterization. J. Cereal Sci. 2025, 121, 104078. [Google Scholar] [CrossRef]
- Liang, Z.; Wada, M.E. Parameter optimisation of a centrifugal fan for rice combine harvesters based on airflow resistance coefficients and CFD simulations. Biosyst. Eng. 2025, 259, 104287. [Google Scholar] [CrossRef]
- Gupta, R.K.; Das, S.K. Performance of centrifugal dehulling system for sunflower seeds. J. Food Eng. 1999, 42, 191–198. [Google Scholar] [CrossRef]
- Doehlert, D.C.; Wiesenborn, D.P.; McMullen, M.S.; Ohm, J.B.; Riveland, N.R. Effects of Impact Dehuller Rotor Speed on Dehulling Characteristics of Diverse Oat Genotypes Grown in Different Environments. Cereal Chem. 2009, 86, 653–660. [Google Scholar] [CrossRef]
- Figueiredo, A.K.; Rodríguez, L.M.; Lindström, L.I.; Riccobene, I.C.; Nolasco, S.M. Performance analysis of a dehulling system for safflower grains. Ind. Crops Prod. 2013, 43, 311–317. [Google Scholar] [CrossRef]
Disclaimer/Publisher’s Note: The statements, opinions and data contained in all publications are solely those of the individual author(s) and contributor(s) and not of MDPI and/or the editor(s). MDPI and/or the editor(s) disclaim responsibility for any injury to people or property resulting from any ideas, methods, instructions or products referred to in the content. |
© 2025 by the authors. Licensee MDPI, Basel, Switzerland. This article is an open access article distributed under the terms and conditions of the Creative Commons Attribution (CC BY) license (https://creativecommons.org/licenses/by/4.0/).