Article

The Effect of Rice–Frog Co-Cropping Systems on Heavy Metal Availability and Accumulation in Rice in Reclaimed Fields

1
Provincial Key Laboratory of Wildlife Biotechnology and Conservation and Utilization, Zhejiang Normal University, Jinhua 321004, China
2
Department of Basic Medicine, College of Medicine, Jinhua University of Vocational Technology, Jinhua 321017, China
3
Xingzhi College, Zhejiang Normal University, Jinhua 321100, China
*
Author to whom correspondence should be addressed.
Agriculture 2025, 15(22), 2374; https://doi.org/10.3390/agriculture15222374
Submission received: 14 October 2025 / Revised: 12 November 2025 / Accepted: 13 November 2025 / Published: 17 November 2025
(This article belongs to the Section Agricultural Soils)

Abstract

The accumulation of heavy metals in rice (Oryza sativa L.) compromises food safety and endangers public health. Previous studies have postulated that ecological co-cultivation systems can potentially improve soil quality and reduce crop absorption of heavy metals. Herein, three treatment groups, rice mono-culture (CG), low-density rice–frog co-culture (LRF), and high-density rice–frog co-culture (HRF), were employed to evaluate the effects of rice–frog co-culture on the physicochemical properties of soils in reclaimed rice fields and heavy metal accumulation in rice. Notably, the rice–frog co-culture markedly increased levels of soil organic matter (SOM), dissolved organic carbon (DOC), cation exchange capacity (CEC), pH, and redox potential (Eh) (p < 0.05), particularly under high-density conditions, compared to the mono-culture system. These changes significantly reduced the bioavailable fractions of Cd, As, and Hg in the soil and substantially diminished their uptake in the roots, stems, leaves, and grains of rice. Conversely, the co-cultivation systems increased the bioavailable content and plant uptake of Pb, particularly under high-density conditions. These findings highlight the feasibility of the rice–frog co-cropping systems in improving soil conditions and reducing the accumulation of specific toxic metals within rice, thereby enhancing the safety of rice grown in reclaimed fields. However, increased Pb accumulation warrants further investigation.

1. Introduction

Heavy metal contamination of agricultural soil has become a pervasive environmental issue, primarily driven by intensified anthropogenic activities, including excessive fertilizer and pesticide use, mining, industrial emissions, and wastewater irrigation [1]. Globally, heavy metal pollution accounts for more than half of all reported soil pollution incidents [2,3]. Such pollution issues are particularly pronounced and acute in China. Among the 3.33 million hectares of farmland deemed unsuitable for cultivation due to contamination, the majority is affected by heavy metal pollution [4]. Consequently, approximately 12 million tons of grain are polluted annually, and over 10 million tons are lost due to yield reduction [5,6]. As China’s primary grain crop, ensuring the safe production of rice (Oryza sativa L.) is essential for food supply security. Yet its growth characteristics, in conjunction with polluted environments, make rice a key route for heavy metal transmission into the food chain [7,8,9]. Continuous irrigation in paddy fields enhances the uptake of soil minerals, increasing rice’s capacity to absorb heavy metals, such as Cd, As, Hg, and Pb, compared to other grain crops. Certain elements, such as cadmium and mercury, are absorbed through the root system, transported within the plant, and ultimately accumulate in the grains [10,11]. These pollutants enter the human body through the food chain, posing multifaceted health risks, including the disruption of metabolic processes, organ dysfunction, and increasing the risk of major diseases, such as cancer [12,13]. Addressing heavy metal pollution in rice fields and ensuring rice quality and safety have thus become critical national strategic tasks [14].
The environmental behavior and ecological effects of heavy metals in soil are primarily governed by their mobile fractions and bioavailability. Soil parameters, such as soil organic matter (SOM), pH, redox potential (Eh), and cation exchange capacity (CEC), can regulate heavy metal speciation and mobility [15,16,17,18]. Organic matter, such as humic and fulvic acids, contains numerous functional groups, such as carboxyl, hydroxyl, phenolic, and quinone moieties, which facilitate the formation of stable complexes or chelates with heavy metal ions, thereby limiting their mobility and bioavailability in the environment [19]. In this context, ecological rice farming models represent an effective strategy for mitigating heavy metal pollution by modulating soil conditions, offering a practical solution for controlling metal accumulation in paddy soil systems [20,21,22].
Ecological farming models of rice fields, such as co-cropping rice with fish [23], shrimp [24], and crab [25], are the most extensively practiced and studied symbiotic cultivation modes. Compared to traditional rice monocropping systems, these biodiversity-based systems enhance production efficiency through inter-species synergistic interactions and strengthen the sustainability of agricultural ecosystems [26,27,28,29]. The rice–frog co-cropping model, in particular, exemplified a highly efficient resource-cycling agricultural system, fully embodying the core principles of circular economy and sustainable intensive agriculture. Frog activity and excrement alter soil physicochemical properties and convert biological waste into nutrients, effectively enhancing soil fertility while substantially reducing nonpoint source pollution from nitrogen, phosphorus, and other elements. Their predatory behavior directly suppresses pest and disease incidence, thereby substantially reducing chemical pesticide inputs [30,31,32]. Lin et al. [33] reported that rice–frog co-cultivation increased rice yield by 22.1% compared to conventional rice mono-culture, demonstrating its potential to Enhance land productivity while reducing environmental costs.
Evidence suggests that rice–frog co-cropping can alter the soil environment of reclaimed fields (arable lands restored through engineering interventions that meet cultivation standards despite being formed from non-native soils) [30,31,32,33]. However, the mechanism by which changes in soil physical and chemical properties influence heavy metal bioavailability remains poorly understood. In particular, systematic data on heavy metal bioavailability in reclaimed fields and their accumulation patterns in different rice tissues and organs under varying co-cultivation densities are lacking. Therefore, this study examined the effects of the rice–frog co-cropping model on soil physical and chemical properties, heavy metal bioavailability, and heavy metal concentrations in various rice tissues under different cultivation densities. The objective was to elucidate the mechanisms by which rice–frog co-cropping influences heavy metal concentrations and bioavailability in reclaimed rice fields. The findings of this study provide a theoretical foundation for developing green integrated farming systems that promote food quality and safety.

2. Materials and Methods

2.1. Profile of the Research Site

The study was conducted in Shafan (119°29′36″ E, 28°52′42″ N), situated in Jinhua City of Zhejiang Province, China. The site’s mean yearly rainfall is 1309 mm and boasts 1810.3 h of sunlight annually, with consistent distribution throughout the year. The experimental plot, a reclaimed parcel of previously unused land, is managed under a single-crop system, specifically cultivating late rice once per year.

2.2. Experimental Design

The optimal frog density for achieving the finest combination of ecological and economic returns is 60,000 frogs/ha (6 frogs/m2) [34]. Herein, because the average weight of the black-spotted frog (1–5 g) is heavier than the tiger frog (Rana rugulosa) used in the reference study (15 g), the density of black-spotted frogs is higher in this experiment. Based on the stocking density of the black-spotted frogs, we selected three experimental production fields: a rice monocropping group (GC, 0 frogs/mu), a low-density rice–frog co-cropping group (LRF, 5000 frogs/mu, corresponding to 8 frogs/m2), and a high-density rice–frog co-cropping group (HRF, 10,000 frogs/mu, corresponding to 15 frogs/m2). The co-cropping system employed ‘Ningyou 31’ rice in combination with black-spotted frogs. The frog diet was supplied by Jindadi Feed (Zhejiang Jindadi Biotechnology Co., Ltd., Shaoxing, China), with a daily feeding ration equivalent to roughly 5% of the total frog biomass. Following rice transplantation for 15 days, black-spotted frogs were introduced into the fields, with daily feeding conducted at 17:00. Throughout the experimental period, the three fields received no application of fertilizers or pesticides. The experimental site was surrounded by stakes, with polyethylene netting fences installed along the ridges, standing 1.0–1.5 m tall and buried approximately 0.1 m underground. To prevent black-spotted frogs from escaping, each field had two inlets and outlets, secured with metal wire fences. All experimental plots were enclosed with netting to avert avian predation on the frogs. The frogs were soaked in 2–3% saline solution for 3–5 min to prevent them from contracting the tilted head disease before introduction into the rice fields [35]. The water quality was properly maintained through clean circulation during rearing to prevent pathogen infection that could lead to frog mortality [36]. The experiment was conducted from July to October 2024.

2.3. Sample Collection

2.3.1. Collection of Soil Samples

The study site was selected in an area distant from industrial pollution sources and major transportation routes, surrounded primarily by farmland. This location minimizes the potential interference of external atmospheric pollutant deposition on the experimental results. Soil samples were collected before land reclamation on 6 July 2024, at four key rice growth phases: tillering, heading, full heading, and maturity. Rhizosphere soil sampling (0–20 cm depth) was performed using an S-shaped pattern with five sampling points, which were then mixed to form a single sample. Each experimental group collected three replicate samples, totaling nine samples per stage. Following collection, all samples were immediately stored on ice to preserve a temperature below 0 °C until further processing. Soil impurities were removed, followed by thorough mixing of the samples and division into two portions using the quartering method. One part was sealed in a bag and preserved at −80 °C, whereas the other was set in a cool, well-ventilated space for air-drying. The soil samples were subsequently ground and sieved through a 100-mesh nylon sieve after drying. After sieving, the samples were put into marked sample bags to facilitate the later determination of various physical and chemical properties of the soil [37,38].

2.3.2. Collection of Rice Sample

Rice samples were collected using a randomized complete block design, with three replicates per block for each of the CG, LRF, and HRF groups. At rice maturity, a five-point sampling method was employed within each block, collecting 1 m2 of plants per point, yielding a total of 15 samples per group. Sampling was conducted using a blind method to avoid subjective bias. Whole rice plant samples from each group were collected in mesh bags and transported back to the laboratory, where they were first washed with pure water and separated into roots, stems, leaves, and brown rice. The samples were blanched at 105 °C for 30 min, and subsequently oven-dried at 65 °C until they attained a constant weight. The samples were then ground, sieved through a 100-mesh nylon screen, and stored for subsequent determination of heavy metal content. The samples were coded based on the field and growth stage of the rice. The sample codes for samples from the rice monocropping fields were coded SG1, SG2, SG3, and SG4, corresponding to the four stages of rice growth: tillering, heading, full heading, and maturity stages. Codes for the LRF group are SL1, SL2, SL3, and SL4, while codes for the HRF group are SH1, SH2, SH3, and SH4.

2.4. Measurement of Soil Samples’ Physical and Chemical Properties

We employed the potassium dichromate oxidation method to quantify SOM, followed by titration with ferrous sulfate solution until a brick-red color was obtained [39,40]. Soil CEC was measured using the hexammine cobalt trichloride extraction–spectrophotometric method, with specific procedures referenced from Aran D [41]. Use a PB-10 pH meter (Sartorius, Göttingen, Germany) to measure Soil pH at a soil/water ratio of 1:2.5 [42]. Determination of DOC in soil using a TOC analyzer (Shimadzu, Kyoto, Japan), with a soil-to-water ratio of 1:5 [39]. Soil Eh was determined with the aid of a TDR300 soil redox potential meter (Sartorius, Bohemia, NY, USA). To ensure adequate contact, the electrode was inserted into the soil to a depth of 10–15 cm, and the reading was recorded after stabilization [43].
The bioavailable forms of heavy metals were extracted using mild extractants to obtain water-soluble and exchangeable forms. The residual forms of heavy metals were thoroughly digested using strong acids and oxidizing agents to release them from the silicate lattice [44].
Measure the available forms of soil Pb and Cd using the method of Li et al. [45]. The method involved diethylenetriaminepentaacetic acid extraction followed by inductive coupled plasma emission spectroscopy (GB/T 17141-1997) [46]. The available forms of As in soil were determined using sodium dihydrogen phosphate extraction followed by atomic fluorescence spectroscopy (DB35/T 1459-2014) [47]. In contrast, the available forms of Hg in soil were determined using thioglycolic acid and sodium dihydrogen phosphate extraction followed by atomic fluorescence spectroscopy (DB35/T 1459-2014) [47].
Measure the total Pb and Cd contents using the method of Xu et al. [48]. The soil samples underwent acid digestion with a mixture of HCl, HNO3, HF, and HClO4. As and Hg were determined by digesting the soil samples using aqua regia (3:1 HCl-HNO3). The total Cd and Pb contents were determined using graphite furnace atomic absorption spectrophotometry (GB/T 17141-1997) [46], while the total As and Hg contents were determined using atomic fluorescence spectroscopy (HJ 680-2013) [49]. All determinations were performed in triplicate. Quality control was conducted using blank tests and soil standard samples to ensure results accuracy.

2.5. Analysis of Rice Samples

This experiment used inductively coupled plasma mass spectrometry (ICP-MS) to determine the heavy metal content in various parts of rice. The root, stem, leaf, and brown rice samples (0.5 g each) were weighed separately and subjected to microwave digestion [50]. Heavy metal content analysis was subsequently performed using an inductively coupled plasma mass spectrometer, following the procedures outlined in GB 5009.268-2016 [51]. The microwave digestion and analysis were performed in triplicate. Quality control was conducted using blank tests and plant standard samples (GBW (E) 100348) [52] to ensure results accuracy. The detection limits for each target heavy metal element in this experiment are as follows: Cd at 0.5 μg/kg, As at 1.0 μg/kg, Hg at 0.5 μg/kg, and Pb at 1.0 μg/kg.
Bioconcentration factor (BCF) was calculated using the formula below:
BCF = Heavy metal content in brown rice/Heavy metal content in soil.

2.6. Data Processing

Data normality and homogeneity of variance tests were conducted using Excel 2013 and SPSS 25.0 (IBM, Inc., Armonk, NY, USA), followed by analysis. One-way analysis of variance (ANOVA) was used to test for differences between groups for the soil physical and chemical properties (SOM, DOC, CEC, pH, and Eh) and soil heavy metal bioavailable concentrations of different rice–frog density groups. Within the same period, data labeled with distinct lowercase letters signify statistically significant disparities among groups (p < 0.05). The Shapiro–Wilk test (p > 0.05) was employed to verify whether the data were suitable for one-way ANOVA. Tukey’s test or Dunnett’s T3 test was used for multiple comparisons, with the selection depending on the results of Levene’s test for homogeneity of variances. The result charts were plotted using Origin 2024 (Origin Lab Corporation, Northampton, MA, USA) software.
Multivariate correlation analysis was performed using R 4.4.2. The relationship between the available state of heavy metals in the soil and soil physicochemical factors was analyzed using redundancy analysis (RDA). Pearson correlation coefficients and their significance were calculated using the ‘psych’ package in R, followed by the construction of a correlation network using linkET (0.0.7.4). Visualization plots were finally created using ggplot2 (3.3.3). Excel 2013 and SPSS 25.0 were used to assist with data organization. Statistical analysis methods (significance testing criteria) and result presentation formats (means ± standard deviation, difference markers) were consistent with those used in the intergroup difference analysis. Mantel analysis was conducted to examine associations between rice enrichment factors and soil physicochemical properties, using the mantel () function in R’s vegan package (v2.7-2) with 999 permutations to test significance, and results visualized as shown in the corresponding figure.

3. Results

3.1. Differences in the Physical and Chemical Properties of Paddy Soil

The SOM content of the rice–frog co-cropping group was significantly greater than that of the CG (p < 0.05) across four key stages of rice growth. Notably, the SOM content in HRF was notably higher than that in LRF (Figure 1a). Significant variations in soil organic matter (SOM) content were observed at the tillering stage and the initial phase of the heading stage. SOM differences between LRF, HRF, and CG were most pronounced during the heading stage, with increases of 46.5% and 56.5% compared to CG, respectively. The difference between HRF and LRF in SOM content was greatest during the tillering stage, with HRF increasing by 30.0% compared to LRF. The gap in SOM content between the rice monocropping group and the rice–frog co-cropping treatment group gradually narrowed during the later stages of rice development (full heading stage and maturity stage). For example, LRF had an 8.5% increase in SOM content during the full heading stage and a 7.7% increase during the maturity stage compared to CG.
During the rice tillering stage, the soil DOC content showed no statistically significant variation between the rice–frog co-culture and CG. However, the soil DOC content in the rice–frog co-cropping group was significantly greater than that in the CG. during the heading, full heading, and maturity stages. Noteworthy, the difference in DOC content between the rice–frog co-cropping group and the CG gradually increased with rice development (p < 0.05). The soil DOC content in the LRF and HRF groups during the rice heading stage showed a significant increase compared to CG by 37.5% and 44.1%, respectively. The DOC content in the LRF and HRF groups during the full heading stage was significantly higher than that in the CG by approximately 42.2% and 97.3%, respectively. The DOC content in LRF and HRF during the maturity stage had increased to 2.06 and 2.49 times that of CG, respectively. Notably, the DOC content in all experimental groups exhibited an overall upward trend throughout the entire growth cycle (Figure 1b).
The soil CEC of HRF was notably greater than that of CG and LRF at all rice developmental stages (p < 0.05) (Figure 1c). Of note, the soil CEC under HRF treatment increased by 68.5%, 105.0%, 122.0%, and 85.0% compared to the corresponding stages in CG. CEC is significantly influenced by soil organic colloid content. It was hypothesized that the higher frog activity achieved through the introduction of frogs at a high density increased humus in the rice field, leading to an increase in HRF organic colloid content and a significant increase in CEC. Notably, the soil CEC under LRF was significantly greater than that of CG only during the maturity stage, with no significant differences in CEC between LRF and CG in the other three stages. This phenomenon suggested that a high density of frogs must be introduced in the rice–frog co-cropping model to achieve a significant increase in soil CEC in the short term. A lower density of frogs required a longer time to effectively alter this physicochemical property.
The soil pH in the rice–frog co-cropping model was notably lower than that in the rice monocropping model during the rice tillering stage. However, the soil pH in the rice–frog co-cropping model was slightly higher than that in the rice monocropping model during the heading stage, but the difference was not significant. Noteworthy, the soil pH in the rice–frog co-cropping model showed a significant increase compared to the rice monocropping model during the late growth stage (p < 0.05). The soil pH in HRF significantly increased by 7.9% and 11.1% during the full heading and maturity stages of rice, compared to the corresponding levels in CG (Figure 1d).
The soil Eh values of all experimental groups exhibited the same trend throughout the rice growth process. A general increasing trend was observed from the tillering to the heading stage, followed by a subsequent decline. Nonetheless, the soil Eh values in the rice–frog co-cropping model were higher than those in the rice monocropping model at all stages of rice growth (Figure 1e). Specifically, the soil Eh in LRF and HRF experienced a substantial increase by 40.3% and 62.5%, respectively, during the tillering stage compared to the corresponding stage in CG. During the heading stage, the soil Eh in HRF increased significantly by 24.0% compared to the corresponding stage in CG. In contrast, the soil Eh in LRF increased slightly but did not achieve statistical significance compared to CG. During the full heading stage, the soil Eh of HRF significantly increased by 19.1% compared to the corresponding stage CG, but only increased slightly in LRF. Noteworthy, the soil Eh of LRF and HRF significantly increased by 16.7% and 50.6%, respectively, during the maturity stage compared to the corresponding stage in CG.

3.2. Differences in the Available Forms of Heavy Metals in Paddy Soil

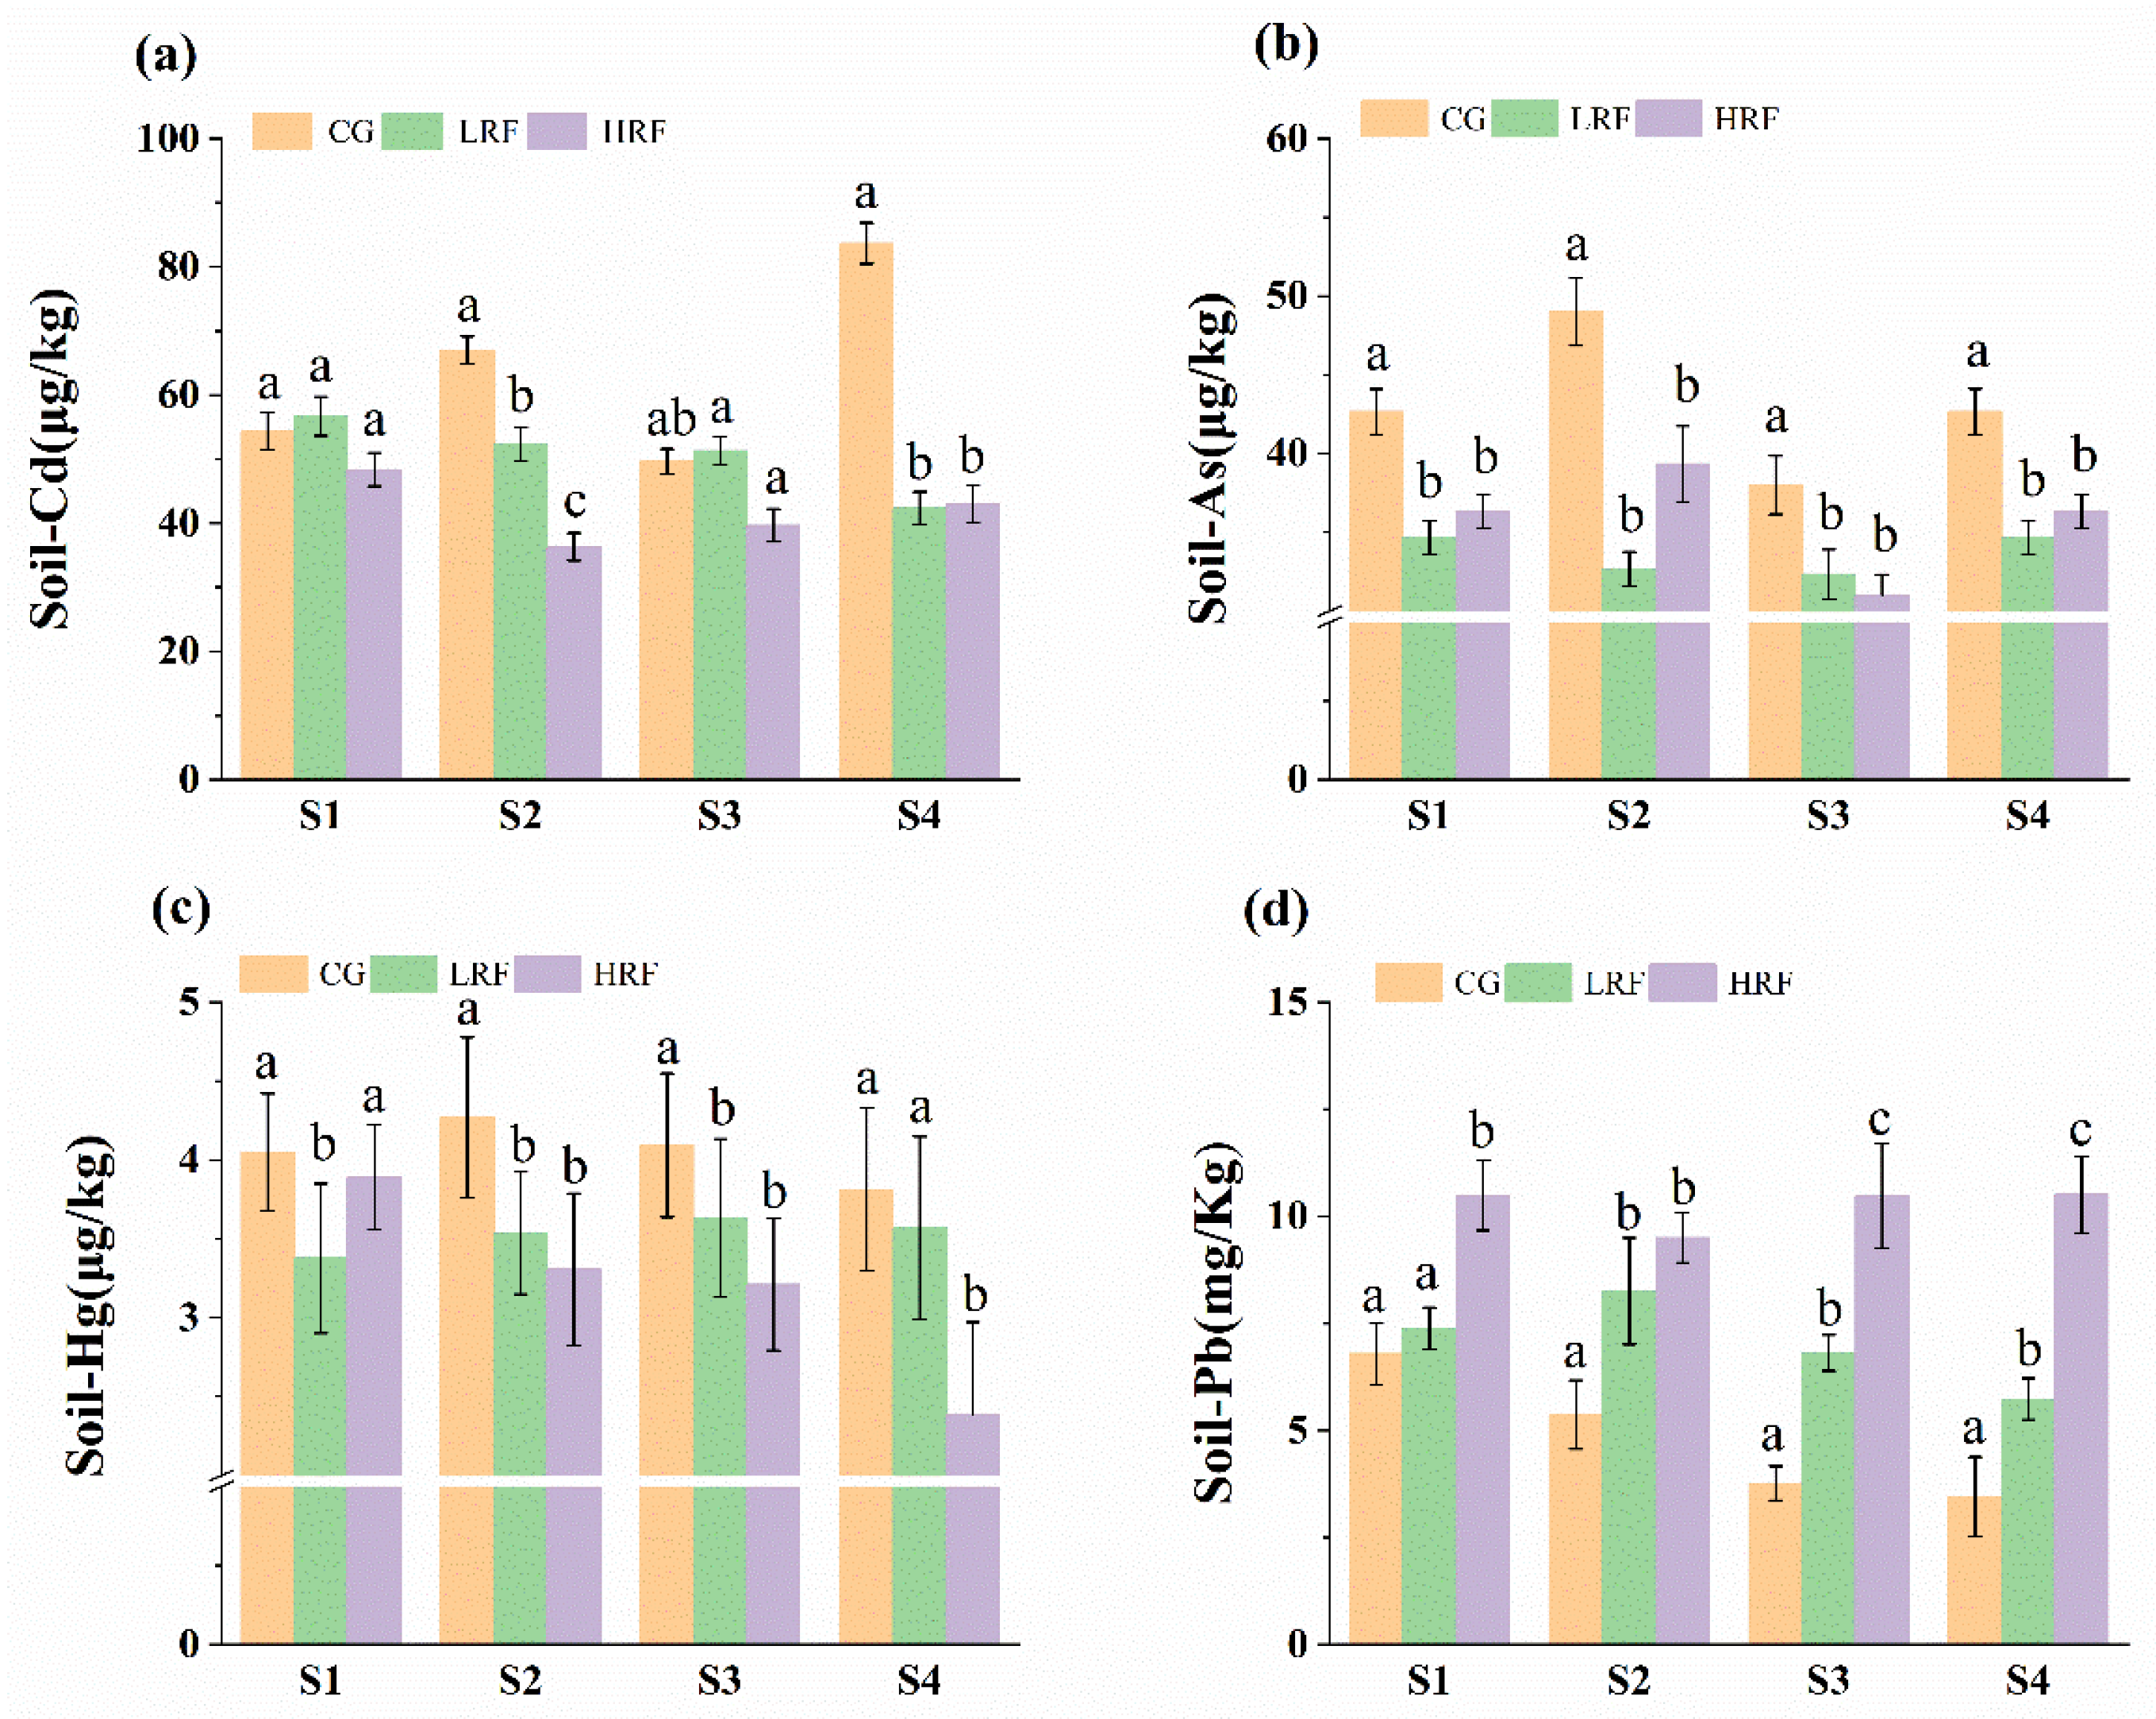
The rice–frog co-cropping model affects the available forms of heavy metals Cd, As, Hg, and Pb in paddy soil. However, this impact differs based on the type of metal. Moreover, different densities of the rice–frog co-cropping model significantly affect the available forms of heavy metals in the soil (Figure 2).
No statistically significant disparity was found in the available form of Cd among the experimental groups during the rice tillering stage. However, there was evident control of Cd in the available form in the rice–frog co-cropping treatment as the rice plants developed. There was an upward trend in the available form of Cd in the soil in the CG. In contrast, it remained relatively stable in the LRF and HRF. The difference in the available Cd content between the rice–frog co-cropping treatment groups and the rice monocropping control group reached its maximum at the rice maturity stage. In the CG, the available Cd content was 1.96 times that of the LRF group and 1.93 times that of the HRF group (Figure 2a).
The rice–frog co-cropping model’s improvement effect on the available content of As in rice fields persisted throughout the whole growth period (Figure 2b). Compared to CG, the content of available As in the soil was notably decreased across all growth stages under both LRF and HRF conditions. Moreover, no significant difference was observed in available As content between LRF and HRF. The soil bioavailable As content in LRF and HRF was significantly reduced by 18.8% and 14.8%, during the tillering stage, 33.3% and 19.7% during the heading stage, 14.9% and 18.4% during the full heading stage, and 18.8% and 14.8% during the rice maturity stage, compared to the corresponding stages in CG.
There were differences in the available mercury (Hg) content in soils of rice fields among different treatments. The available Hg content in CG soils remained relatively stable during rice development, unlike Cd, which exhibited an upward trend during rice development (Figure 2c). The soil bioavailable Hg content in the LRF group exhibited a statistically lower level than that in the CG and HRF groups during the tillering stage. Notably, no significant variation was detected in soil bioavailable Hg content between the LRF and HRF groups during the heading and full heading stages. However, both were significantly lower than the corresponding content in the CG group. Only the HRF group had significantly lower soil bioavailable Hg content than the CG group during the maturity stage. The bioavailable Hg content exhibited a decreasing trend under HRF.
In contrast, the available Pb content in paddy soil among the experimental groups exhibited an opposite trend compared to Cd, As, and Hg. The rice–frog co-cropping model generally exhibited significantly higher available Pb content than the rice monocropping model during rice growth, suggesting that the rice–frog co-cropping model increased the available content of Pb in paddy soil (Figure 2d). During the rice tillering stage, no significant difference was observed in the effective Pb content in soil between the LRF group and the CG group. However, it was significantly higher than the CG group by 53.6%, 80.7%, and 66.0% during the rice heading, full heading, and maturity stage, respectively. Of note, the difference in the bioavailable content of Pb between soils in HRF and CG gradually widened as rice progressed towards maturity. HRF had approximately 54.5%, 76.9%, and 178% higher bioavailable Pb content than CG during the tillering, heading, and full heading stage, respectively. The effective Pb content in the soil reached approximately 3.04 times that in CG at the maturity stage.

3.3. Differences in Heavy Metal Content in Different Parts of Rice Plants

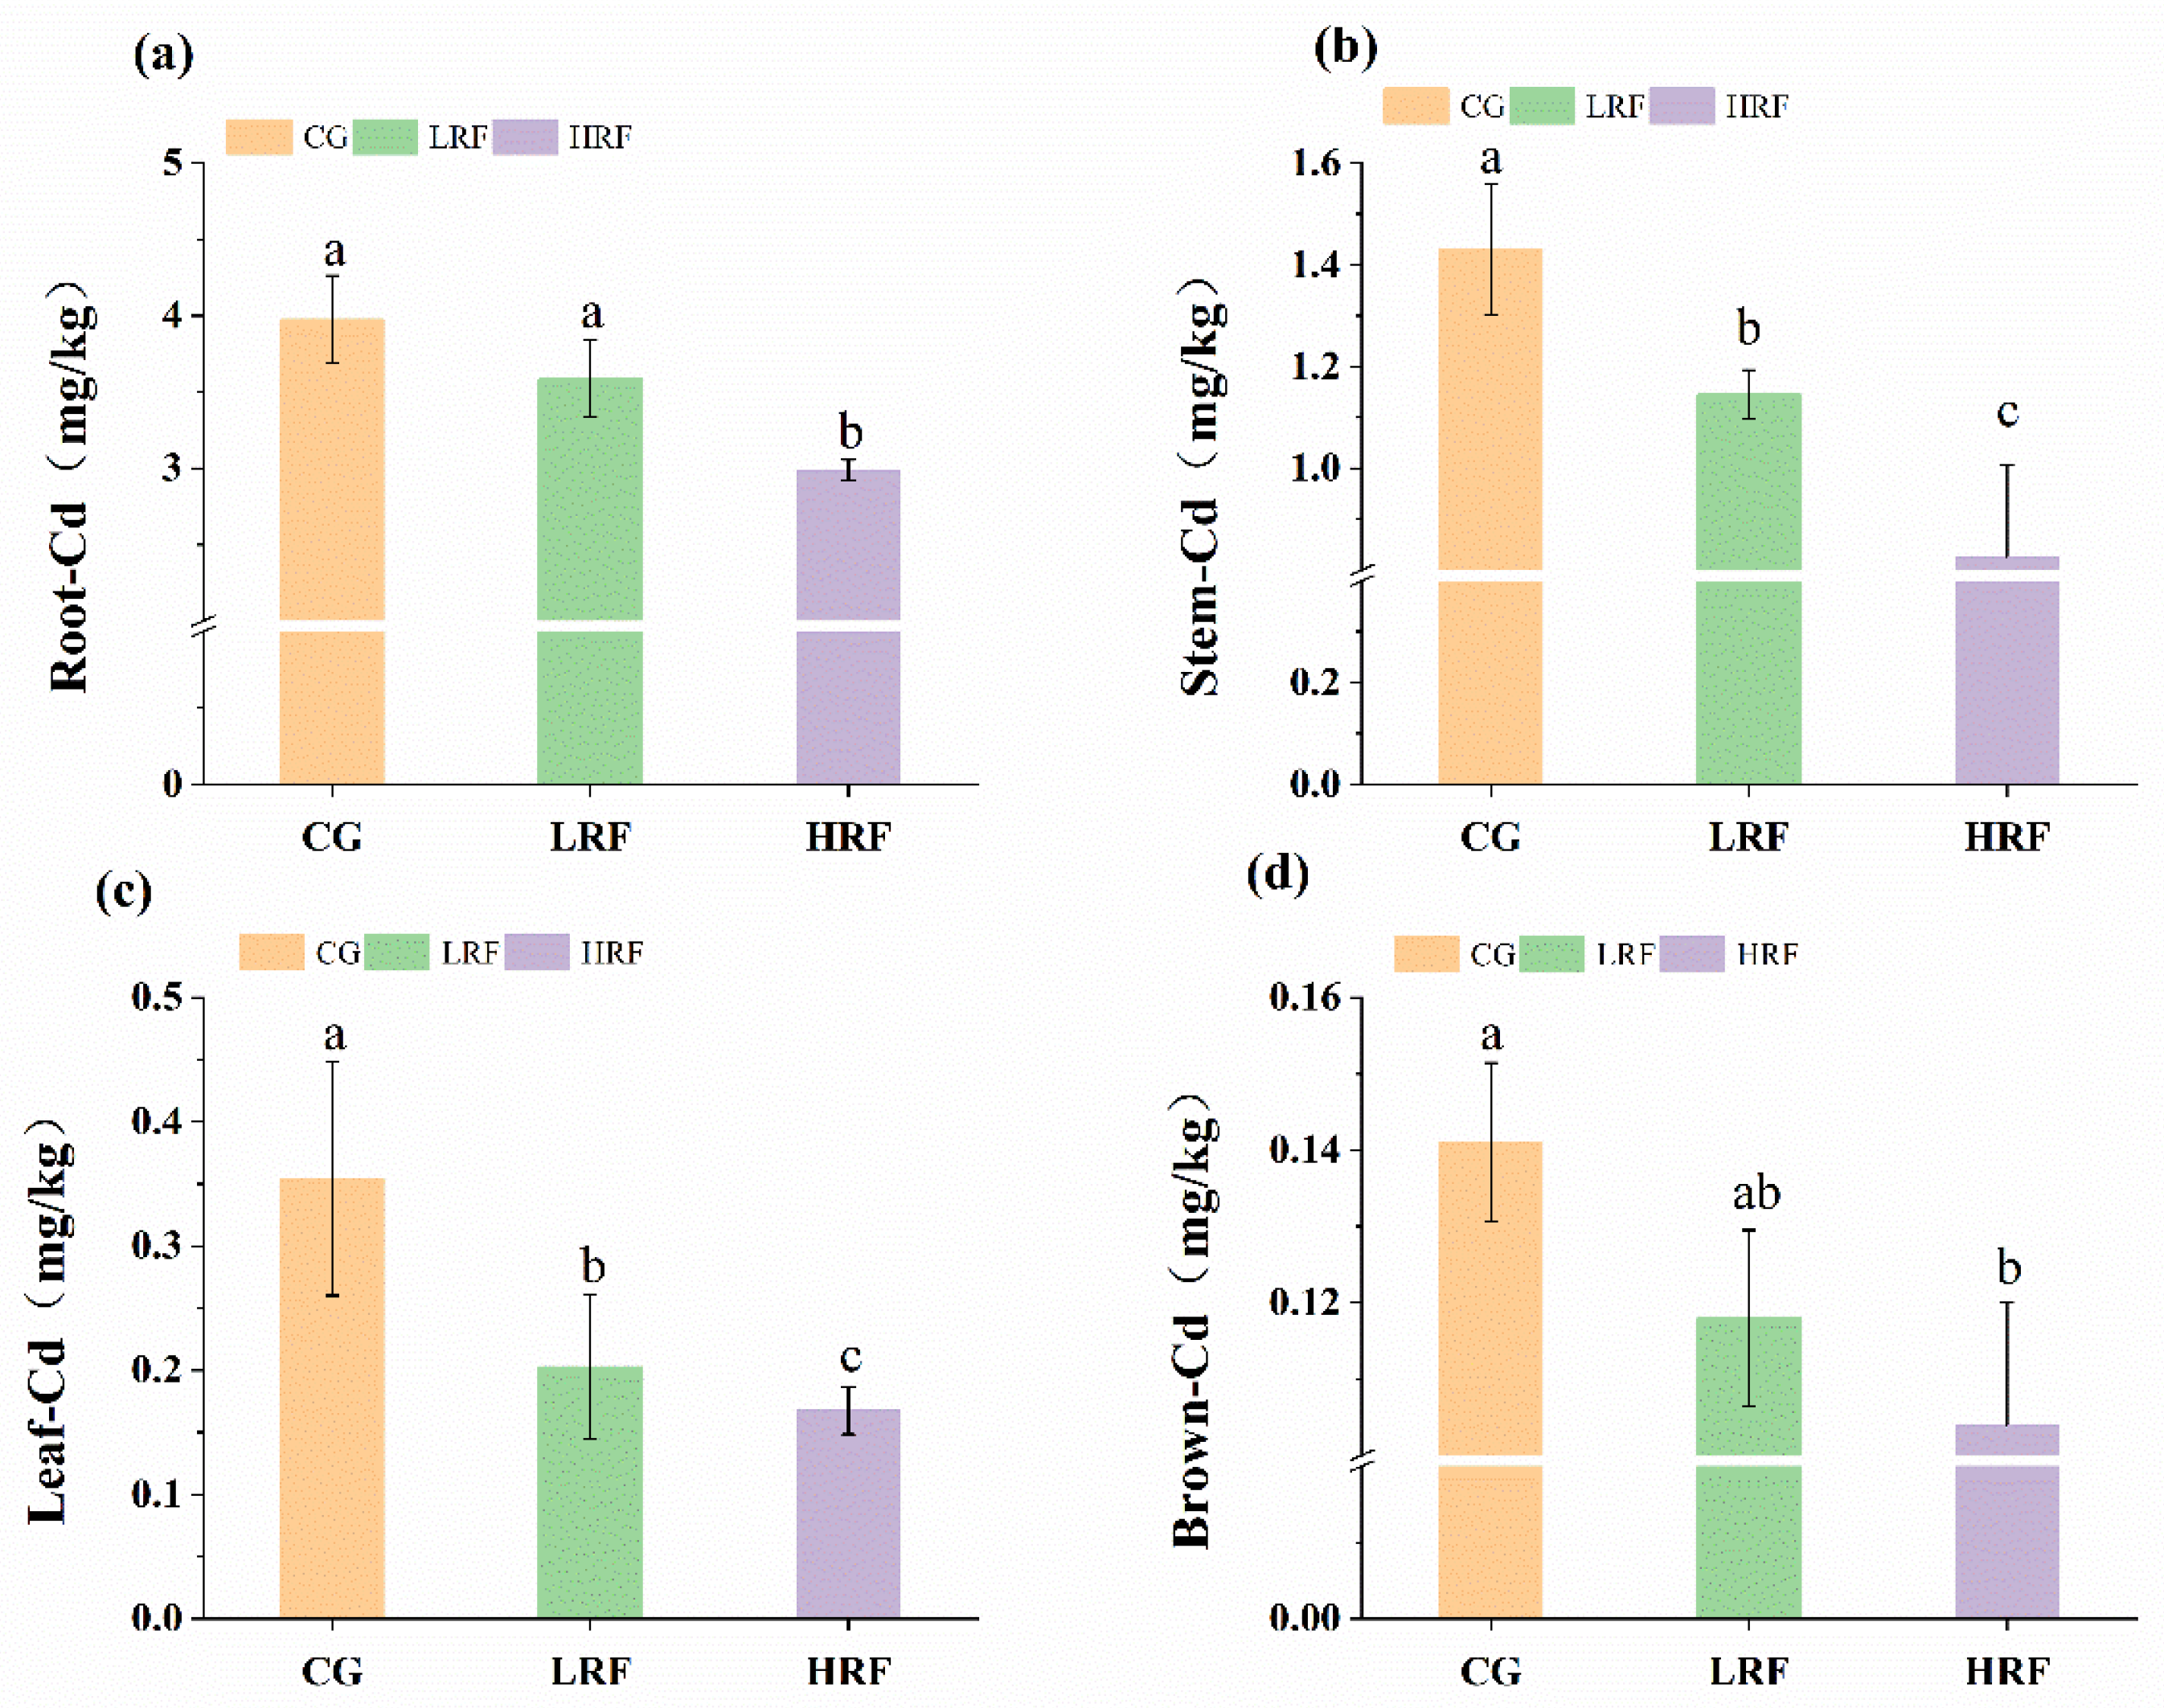
Cd accumulation varied among various rice tissues. The accumulation trend across different parts followed the order of roots > stems > leaves > brown rice (Figure 3). The rice–frog co-cropping model generally exhibited a trend of reduced Cd accumulation in rice plants across different experimental groups compared to the rice monocropping model. HRF significantly reduced Cd accumulation in the roots by 24.8% compared to CG, while LRF showed a slight reduction but did not reach a significant level. Both LRF and HRF significantly reduced Cd accumulation in stems by 19.9% and 42.2%, respectively, compared to CG. Cd accumulation in the leaves of plants under LRF and HRF was approximately 42.8% and 52.7% lower than that in CG, respectively. However, the difference between LRF and HRF was not significant. Cd accumulation in HRF brown rice was 26.2% lower than in CG. In contrast, LRF showed a slight decrease compared to CG but did not reach statistical significance.
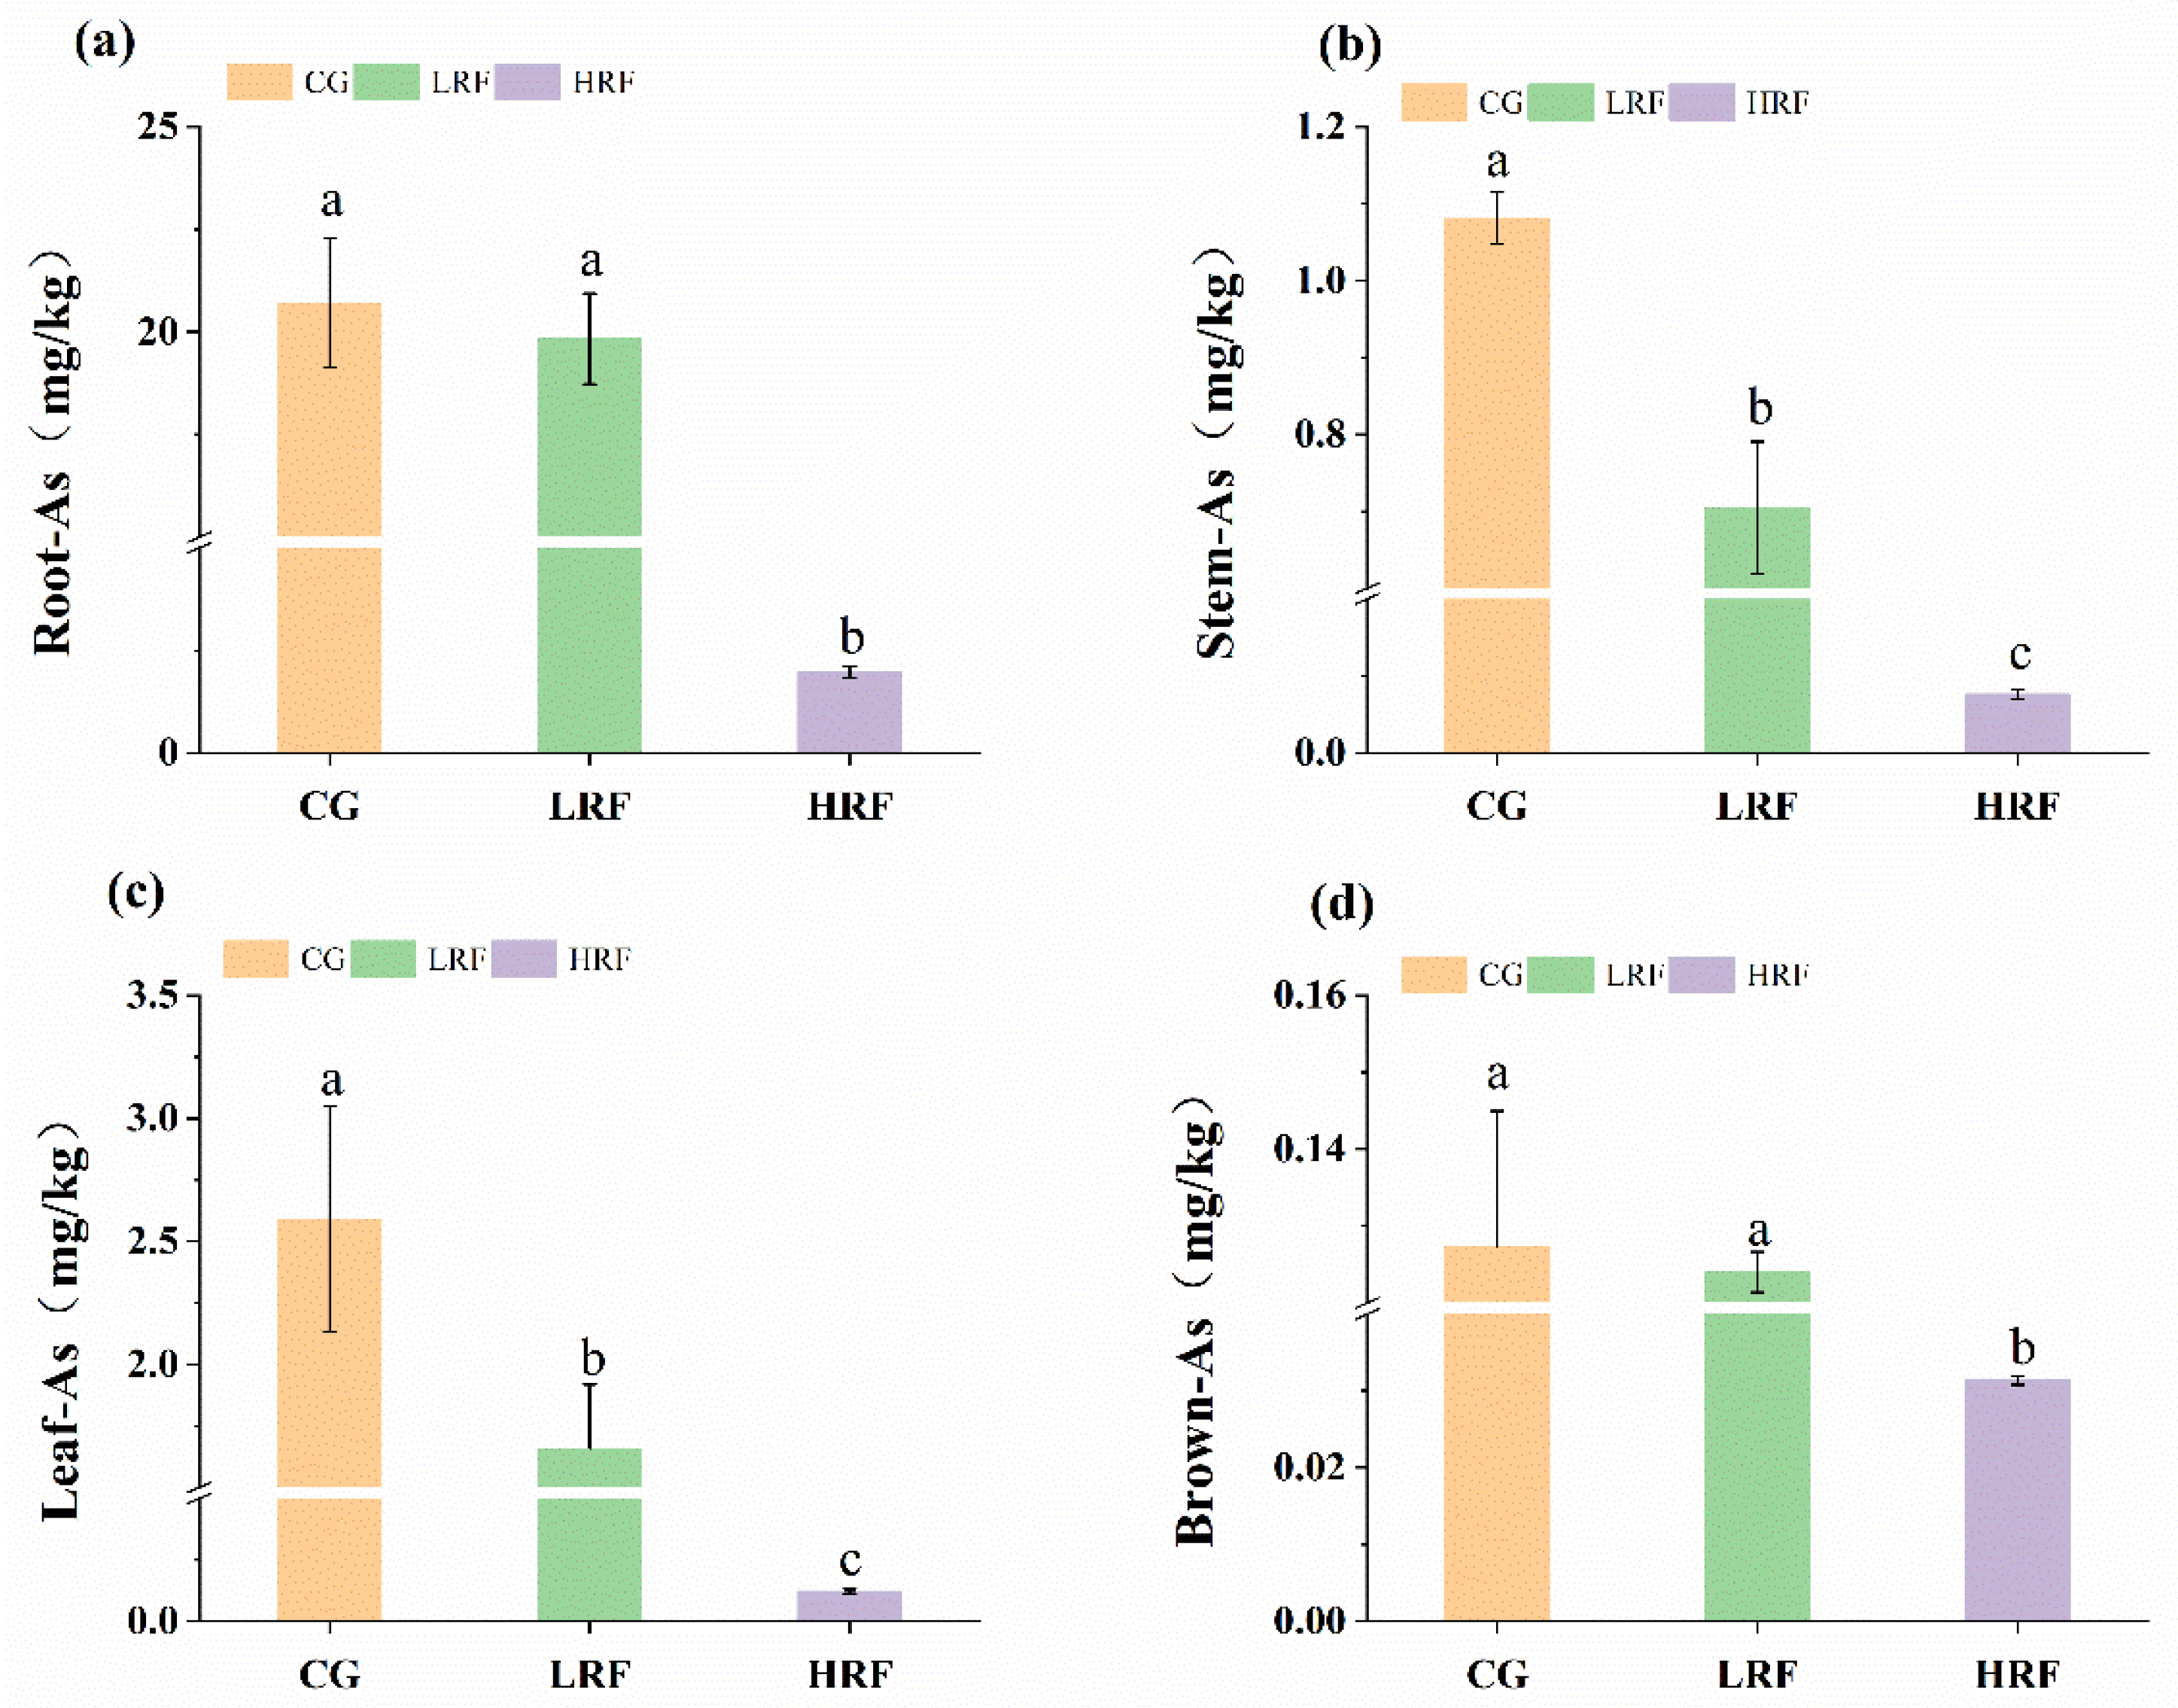
The descending order of As accumulation in rice tissues was roots > leaves > stems > brown rice. (Figure 4). Compared to rice monocropping, the rice–frog co-cropping system led to notably lower As accumulation in rice. As accumulation in the roots, stems, leaves, and brown rice of HRF was significantly lower than that of CG across the four growth stages, decreasing by 90.5%, 92.9%, 95.3%, and 75.4%, respectively. As accumulation in the LRF group was significantly lower only in the stem and leaf tissues, with reductions of 34.9% and 36.0%, respectively, compared to the corresponding levels in the CG group. As accumulation in the root and brown rice tissues of LRF was lower than in the CG, but the reductions did not reach statistical significance.
The descending order of Hg accumulation in rice tissues was root > leaf > stem > brown rice (Figure 5). The accumulation levels in rice roots and brown rice exhibited significant differences in different experimental groups. In contrast, differences in stem and leaf accumulation levels did not reach statistical significance. HRF significantly reduced Hg accumulation in the roots by 25.7% compared to CG, while the difference in LRF did not reach statistical significance. Notably, both LRF and HRF exhibited significant reductions in Hg accumulation in brown rice compared to CG, with LRF reducing Hg accumulation by 90.9%. There was no Hg content detected in HRF brown rice, indicating that the HRF co-cropping model could effectively reduce Hg accumulation in brown rice.
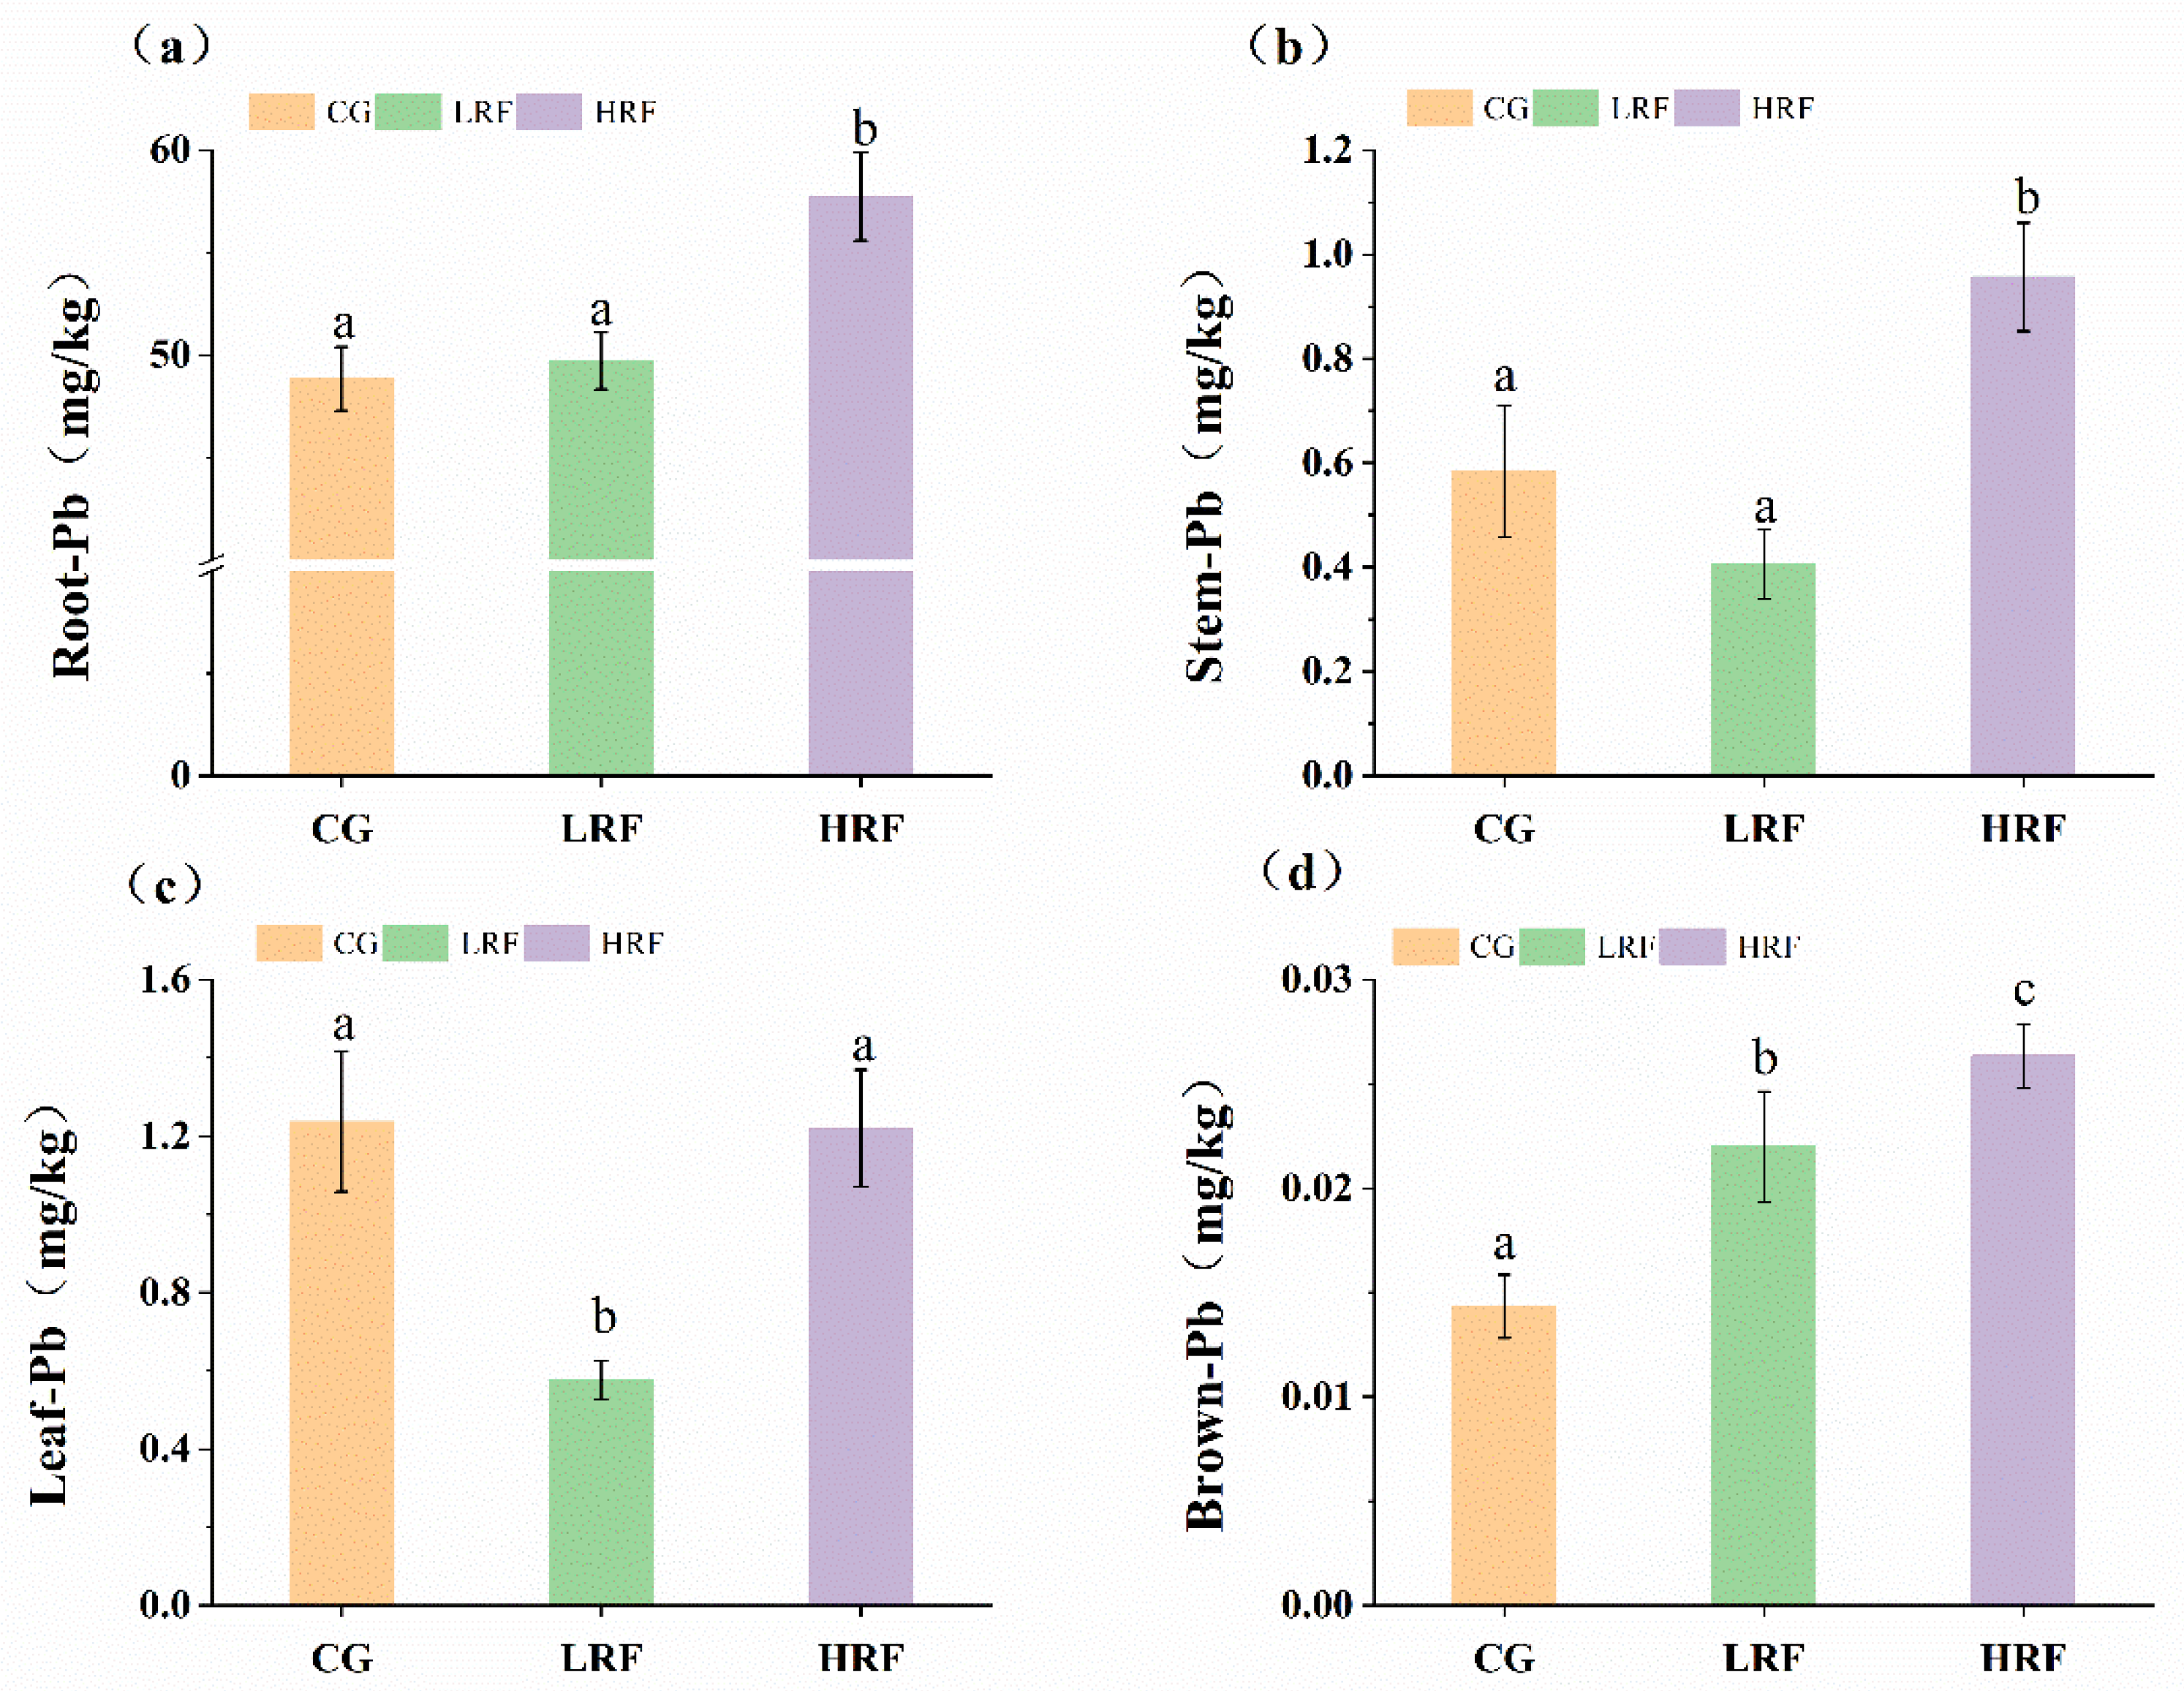
The descending order of Pb accumulation in rice tissues was roots > leaves > stems > brown rice. Notably, the amount of Pb transferred to the aboveground parts of rice plants was relatively low (Figure 6). Generally, there was a trend of increasing Pb accumulation with increasing frog density compared to the rice monocropping model. Pb accumulation in the roots and stems of plants in the LRF group was not significantly different from that of plants in the CG group. However, Pb accumulation in brown rice of LRF was significantly increased by 53.5% compared to the CG group. Pb accumulation in the roots, stems, and brown rice of plants in the HRF group was significantly higher than in the CG group, with increases of 18.2%, 64.0%, and 83.7%, respectively. These findings suggest that the rice–frog co-cropping model has a certain impact on Pb accumulation in rice, with a higher frog density enhancing the rice’s ability to accumulate Pb.

3.4. Heavy Metal Accumulation Characteristics of Rice

A crop’s ability to accumulate heavy metals is characterized using an accumulation coefficient. A higher coefficient indicates a stronger accumulation capacity and vice versa. Herein, the accumulation coefficients for Cd, As, Hg, and Pb in rice are denoted as BCF-Cd, BCF-As, BCF-Hg, and BCF-Pb, respectively. The rice–frog co-cropping model had no significant effect on the Cd bioaccumulation factor of rice, but significantly affected the bioaccumulation factors of As, Hg, and Pb in rice (p < 0.05) (Table 1). There existed no significant disparity in BCF-Cd between the experimental groups. BCF-Cd in LRF and HRF was reduced relative to CG, but the reduction did not attain statistical significance. HRF significantly reduced BCF-As in rice by 58.7% compared to CG, while LRF showed no significant change. LRF significantly decreased BCF-Hg in rice by 91.1% compared to CG, while no Hg was detected in the rice bran of HRF. Both LRF and HRF significantly increased BCF-Pb in rice by 31.2% and 40.6%, respectively, compared to CG.

3.5. Correlation Analysis Between Soil Physicochemical Properties and the Bioavailable Forms of Heavy Metals in Rice Fields

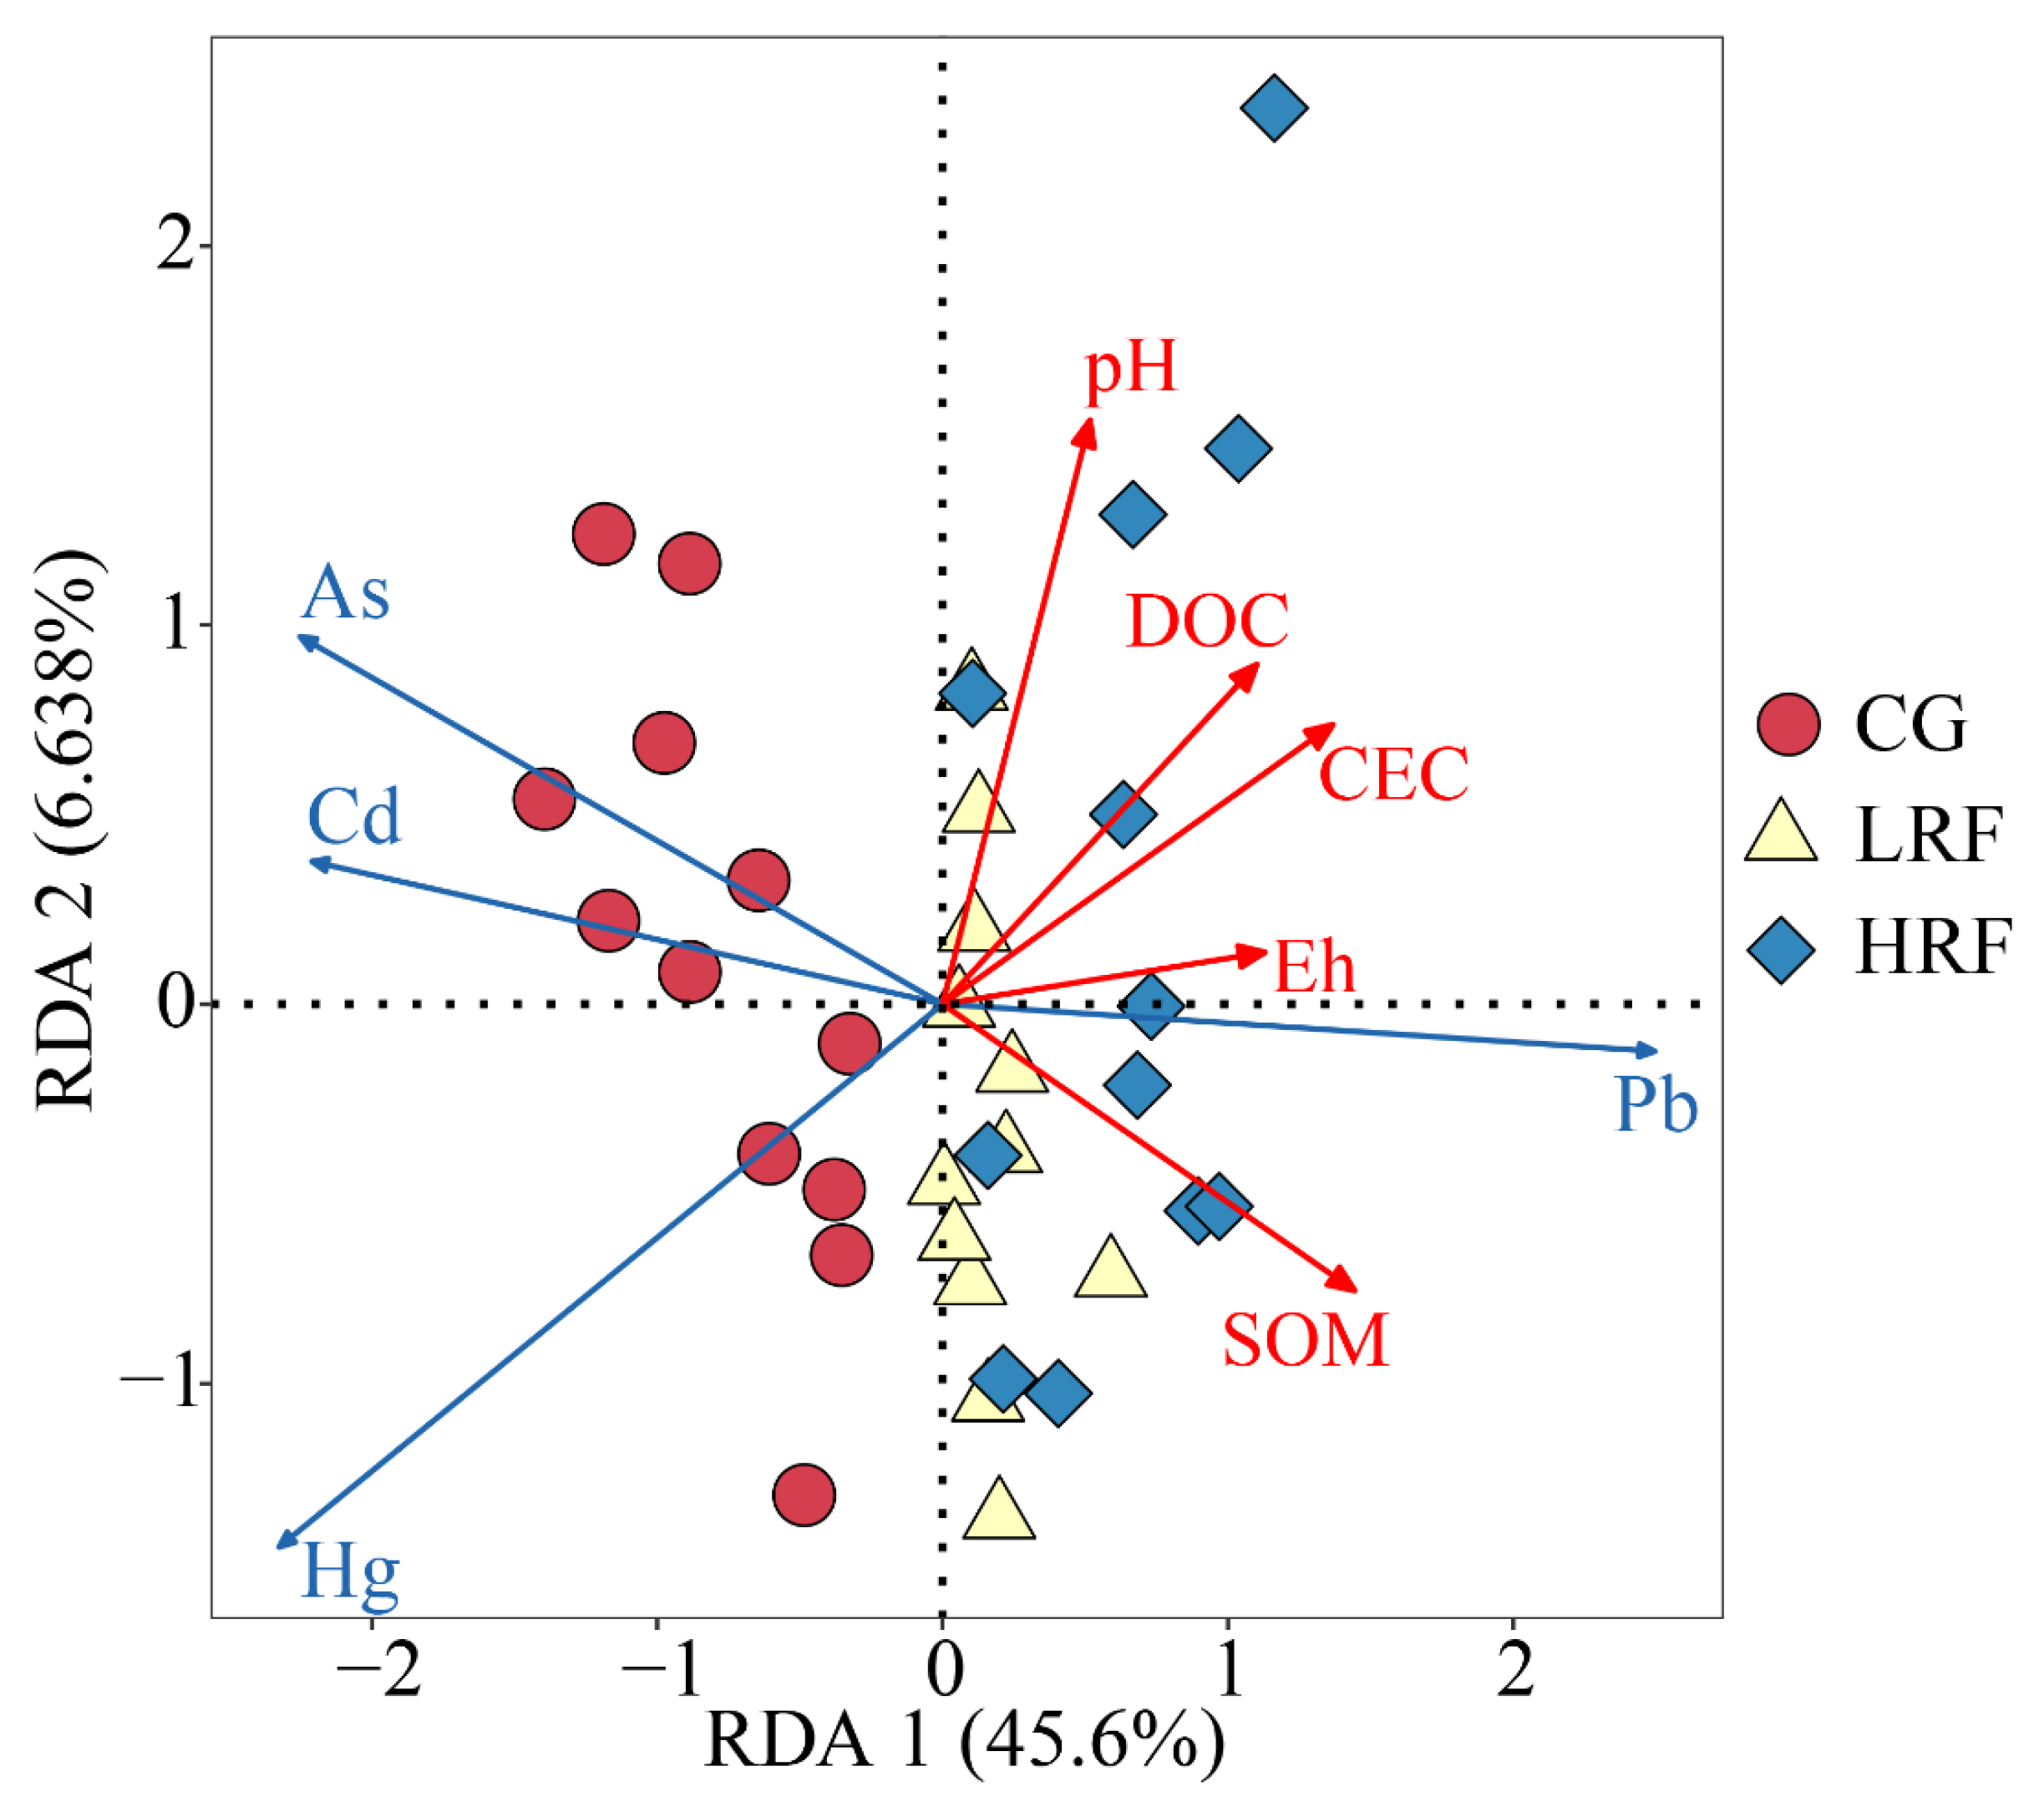
A trend-corrected correspondence analysis (DCA) was conducted on the bioavailable forms of heavy metals in the soils of paddy fields to select the most appropriate analytical method. Redundancy analysis (RDA) was selected because the maximum length of the ordination axis was less than 3 (Figure 7). The eigenvalues of RDA1 and RDA2 in the RDA ordination axes were 45.6% and 6.638%, respectively, collectively explaining 52.238% of the variance between the available forms of heavy metals in soil and soil physical and chemical properties. Notably, SOM, CEC, DOC, and Eh demonstrated significant negative correlated with the available state content of Cd, As, and Hg in soil. In contrast, Soil pH correlated negatively with soil available Hg, Moreover, SOM and CEC correlated positively with available Pb (p < 0.05) (Figure 7).
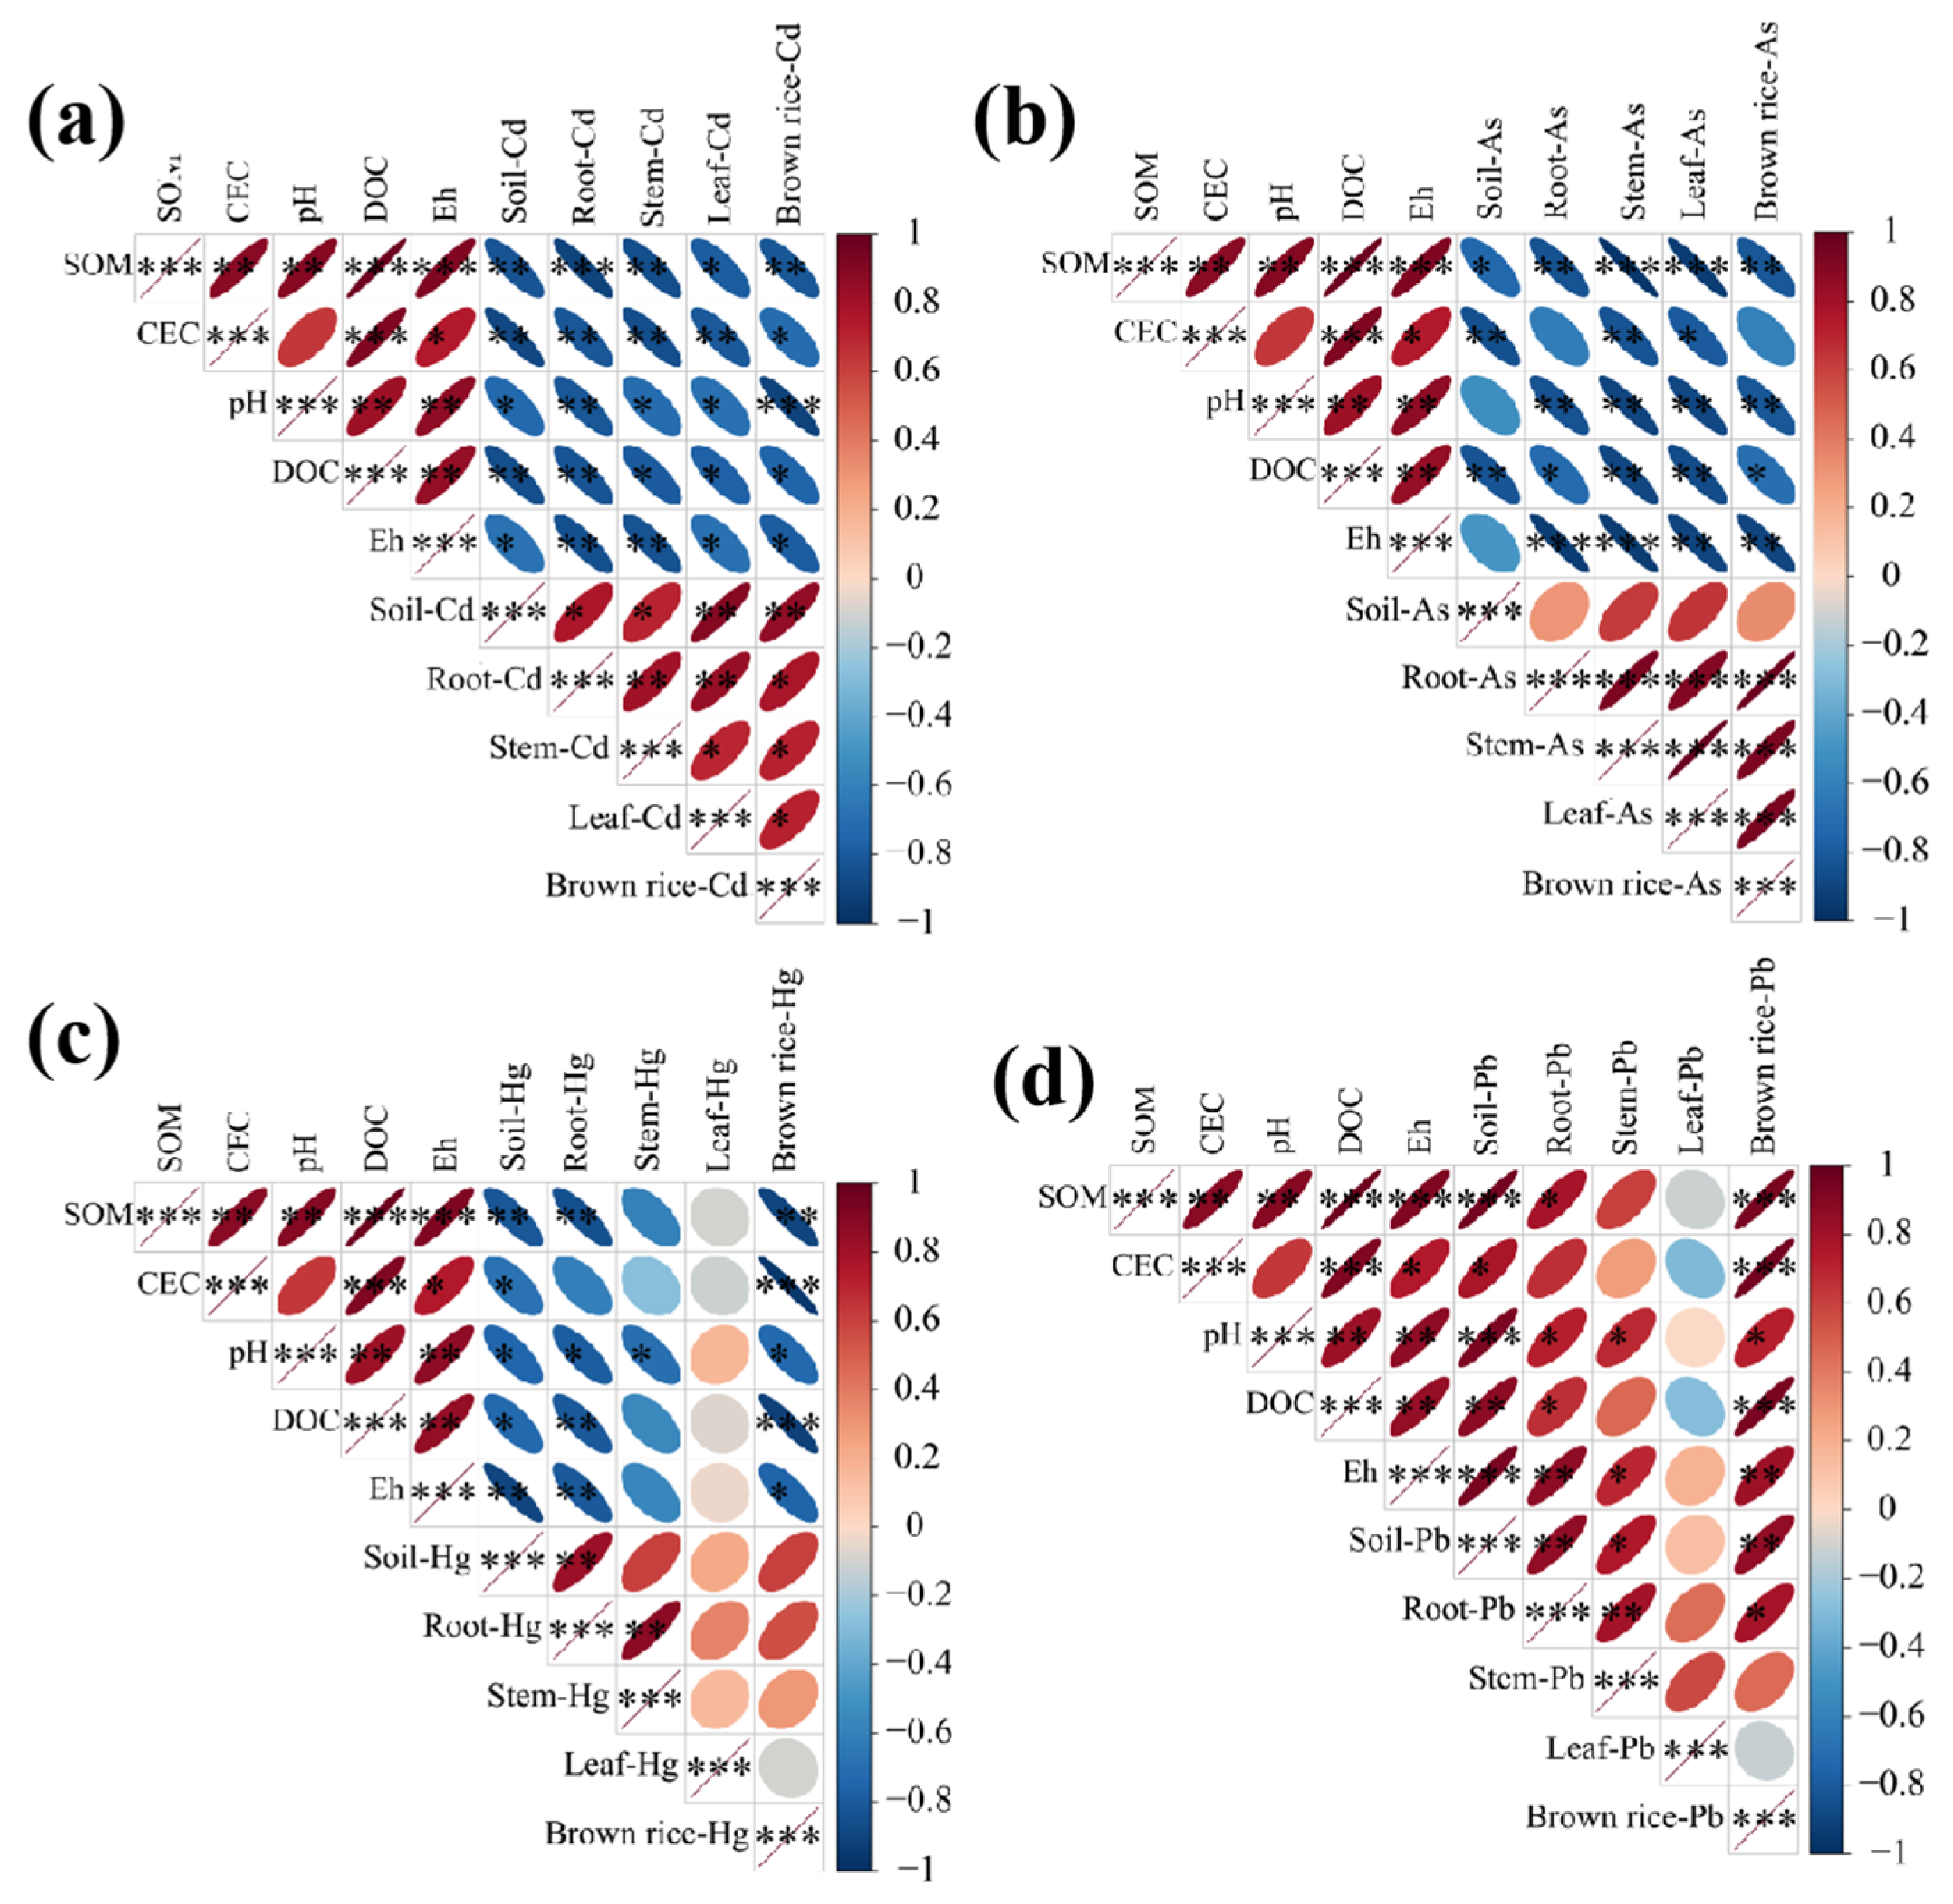
Further analysis on the correlation between heavy metal content in various parts of rice plants and soil physical and chemical properties revealed that SOM, CEC, pH, DOC, and Eh were significantly negatively correlated with the Cd content accumulated in various rice tissues (p < 0.05). In contrast, the content of available Cd showed a significant positive correlation with the Cd content accumulated in various rice tissues (p < 0.05).
SOM, pH, DOC, and Eh showed a notable negative correlation with As accumulation in various rice tissues. In contrast, soil CEC showed a notable negative correlation with the accumulation of As in rice stems and leaves (p < 0.05). The available As content was positively correlated with the accumulation of As in rice roots, stems, leaves, and brown rice, but the accumulation was not statistically significant (Figure 8b).
SOM, pH, DOC, and Eh showed a notable negative correlation with the mercury (Hg) content in the roots and brown rice (p < 0.05). Similarly, the soil CEC showed a notable negative correlation with the mercury (Hg) enrichment levels in brown rice. In contrast, there was a positive correlation between the available Hg content in soil and the enrichment levels of Hg in all rice plant parts, especially in the roots (p < 0.05) (Figure 8c).
SOM and DOC showed a notable negative correlation with the Pb content enriched in the roots and brown rice (p < 0.05). Soil pH, Eh, and the available Pb content were significantly positively correlated with the Pb content enriched in the roots, stems, and brown rice. Soil CEC showed a notable positive correlation with the Pb content enriched in brown rice (p < 0.05) (Figure 8d).
These findings collectively suggested that the rice–frog co-cropping model reduced the accumulation of Cd, As, and Hg in various parts of rice plants by increasing SOM, CEC, pH, DOC, and Eh. However, there was an accumulation of Pb content in various parts of rice plants, especially in the roots, because of the increase in the available Pb content in the soil.
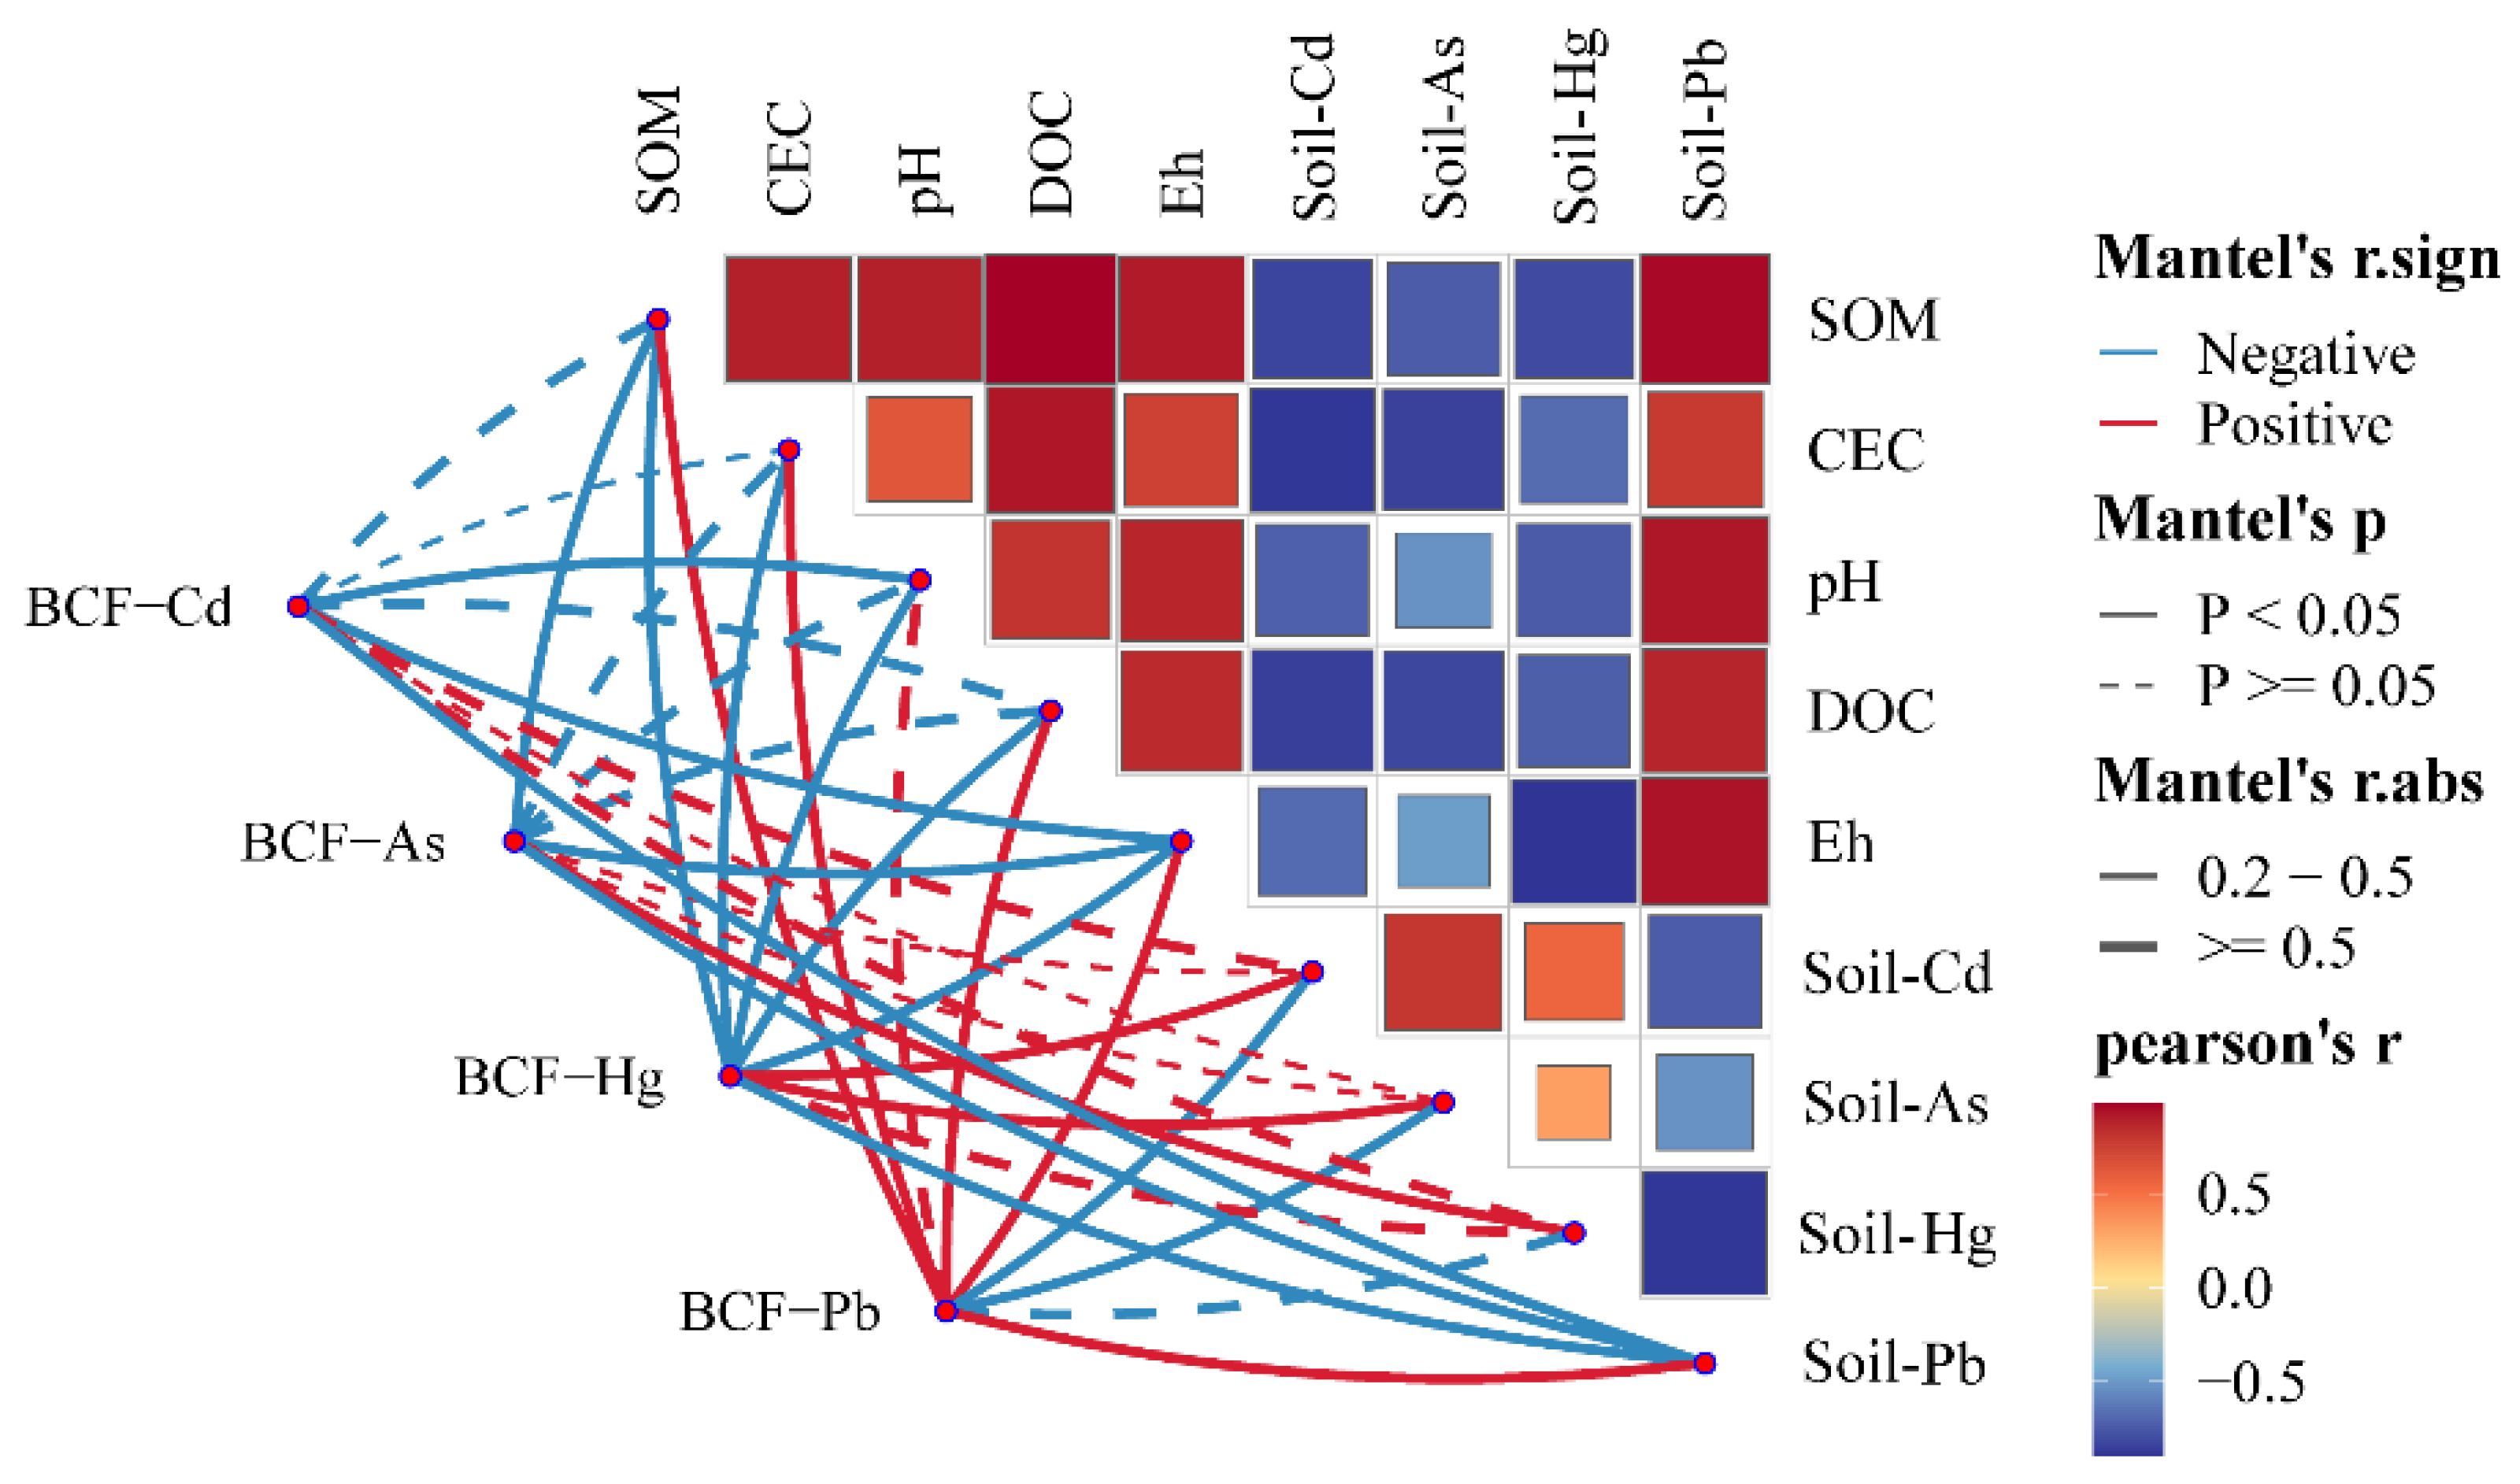
Analysis of the correlation network heat map of rice bioaccumulation factors and the physicochemical properties of paddy soil (Figure 9) revealed a positive correlation between BCF-Cd and the available Cd content in soil. In contrast, BCF-Cd was negatively correlated with SOM, CEC, pH, DOC, and Eh. Notably, the negative correlation between BCF-Cd and soil pH and Eh was significant (p < 0.05). BCF-As was positively correlated with the available state of As in the soil. However, it was negatively correlated with SOM, CEC, pH, DOC, and Eh, with significant negative correlations observed with SOM and Eh (p < 0.05). BCF-Hg exhibited a positive association with soil bioavailable Hg content. However, it was notably negatively correlated with SOM, CEC, pH, DOC, and Eh (p < 0.05). BCF-Pb was significantly positively correlated with bioavailable SOM, CEC, DOC, Eh, and Pb content (p < 0.05). It was also positively correlated with soil pH, but the correlation was not statistically significant.

4. Discussion

4.1. The Effects of the Rice–Frog Co-Cultivation Model on the Physical and Chemical Properties of Paddy Soil

The bioavailability of heavy metals in soil is largely governed by its physicochemical properties [15]. The rice–frog co-cultivation model significantly alters the physical and chemical properties of paddy soil compared to rice mono-culture [53]. Herein, the SOM significantly increased at all growth stages of rice, with a more pronounced increase in HRF under the rice–frog co-cultivation model. Moreover, the promotional effect of the co-cultivation model on the dissolved organic carbon (DOC) was primarily evident in the later phases of rice development, particularly at maturity, where the DOC content in LRF and HRF was 2.06 and 2.49 times that of CG, respectively. Our results are consistent with Wu et al. [54], whose rice-turtle co-farming model revealed that the daily activities of turtles in the rice-turtle co-farming model altered the soil microbial richness, which are the primary decomposers of SOM. Notably, microbial community composition is influenced by the turnover of soil DOC in mineral soils [55]. The activities of black-spotted frogs in reclaimed fields promote soil loosening and increase soil enzyme activity, thereby enriching the soil microbial content, which accelerates the decomposition of straw and other materials in the rice fields [30,34]. The daily excrement of frogs and the input of frog feed are also decomposed by soil microorganisms, thereby increasing the SOM and DOC content in rice fields. Of note, Jiang et al. [56] reported similar findings in a rice–crab co-cultivation system. Nonetheless, there were no significant changes in DOC levels between the three groups during the early growth stage of rice in this study. This phenomenon may be attributed to the small size of the black-spotted frogs, limited fecal output, and insufficient feed input during the early stages, which may not have been sufficient to alter the SOM content in the short term.
Soil pH is primarily influenced by parent material, climate, and agricultural activities. Research indicates that high-temperature and humid environments accelerate soil mineral weathering and base ion leaching, while long-term, excessive application of nitrogen and phosphorus fertilizers, especially ammonium nitrogen fertilizers, releases H+ through nitrification, leading to soil acidification [57,58]. Herein, the impact of the rice–frog co-cultivation model on soil pH exhibited a phased characteristic. The soil pH in the HRF group was significantly higher than that in the CG group during the heading and maturity stages by 7.9% and 11.1%, respectively (Figure 1d). This finding consistent with Sha et al. [59] in their rice–frog co-cultivation study, where black-spotted frogs reduced pesticide use and accumulation of acidic substances produced by the degradation of organophosphorus pesticides by preying on pests [32]. Moreover, frog excrement can provide nutrients, reduce fertilizer use, mitigating the nitrification-induced acidification effects caused by ammonium nitrogen fertilizers [60,61]. This mechanism is similar to the “alkaline input from aquaculture excrement, which alleviates soil acidification” observed in rice–turtle co-cultivation [54]. Herein, the high activity of black-spotted frogs promoted ion exchange between soil and water more effectively, resulting in a greater increase in pH compared to rice–turtle co-cultivation [34,61]. This variance highlights the difference in pH regulation caused by the intensity of the activity of aquatic organisms [60]. Rice–frog co-cultivation affects soil SOC and pH, which in turn influence the CEC of the soil [60,61,62]. In this study, compared to the CG, HRF exhibited significantly higher CEC in all growth stages. In contrast, LRF only exhibited a significant advantage during the maturity stage, further confirming that frog input positively impacts soil CEC, with effects correlated to the number of frogs and their growth stage.
The rice–frog co-cultivation system significantly increases soil Eh in rice fields, compared to rice mono-culture system, the improvement in HRF is more significant. This result contradicts the findings of Yuan et al. [63], whose study on rice–shrimp co-cultivation revealed that this cultivation model reduces soil Eh values. Rice fields are in a long-term irrigated state, which creates an anaerobic environment that leads to a decrease in soil Eh. Frogs exhibit more vigorous jumping and foraging activities in rice fields compared to shrimps. This phenomenon increases dissolved oxygen levels in the water, which promotes gas exchange between soil, water, and the atmosphere, and improves the redox environment in the soil, thereby significantly increasing soil Eh [60]. Comparable patterns have been documented in integrated rice-duck farming systems [64].
This experiment did not measure soil data from the paddy fields prior to reclamation. The current results only reflect changes in soil heavy metals during the experimental period and cannot rule out the potential influence of initial variations. Future studies are advised to prioritize the inclusion of baseline data to enhance comparative analysis.

4.2. Influence of Soil Physicochemical Properties on Bioavailable Forms of Heavy Metals in Rice Fields

RDA of the relationship between soil physicochemical properties and the bioavailable concentrations of heavy metals revealed significant negative correlations between SOM, CEC, DOC, Eh, and pH and the bioavailable concentrations of Cd, As, and Hg in soil. In contrast, SOM and CEC exhibited significant positive correlations with the bioavailable concentration of Pb in soil. SOM is a vital soil component that influences heavy metal bioavailability through a “adsorption-chelation” dual pathway. The carboxyl and phenolic hydroxyl groups in SOM can form stable chelates with Cd, As, and Hg, thereby reducing their bioavailable forms [16,19]. SOM also contains abundant redox groups that participate in electron transfer and mediate electron transfer in the environment, these can influence the redox reactions of heavy metals in the soil environment. This process affects the stability and bioavailability of heavy metals in soil by altering their form and valence state [65,66]. The structure of soil DOC also contains functional groups that can bind to various heavy metal ions, thereby affecting the form and migration of heavy metals [67]. Notably, SOM can influence the available form of Pb in soil. SOM favors the “chelation–dissolution” equilibrium toward dissolution for Pb compared to Cd. The “competitive chelation” of low-molecular-weight organic acids (with higher chelation constants) is more dominant despite the ability of the carboxyl groups of SOM to chelate with Pb2+. This phenomenon leads to the transformation of chelated Pb from “insoluble humic acid complexes” to “soluble organic acid complexes,” which results in an increase in its available state [68].
The CEC of soil is a crucial indicator of the soil’s buffering capacity for cationic substances. The high CEC for heavy metals with small ion radius and high charge densities, such as Cd2+, can convert free Cd2+ into exchangeable form through electrostatic adsorption and ion exchange between clay minerals and humic colloids, thereby reducing its available form [69]. Herein, there was a significant positive correlation between CEC and the available state of Pb (p < 0.05), which was closely associated with the unique chemical properties of Pb2+. Pb2+ has a larger ionic radius and lower binding energy with colloidal surfaces [62]. Moreover, the high amount of NH4+ input from frog excrement in rice–frog co-cultivation competes with Pb2+ for adsorption sites, leading to an increase in CEC that paradoxically promotes the desorption of Pb2+ from colloidal surfaces, thereby increasing its available form [70]. In line with the findings of Yan et al. [70], this study confirms that a higher cation exchange capacity (CEC) is a key factor enhancing lead bioaccessibility. The mechanism involves the greater retention of lead on exchangeable sites in high-CEC soils. This form of lead is more easily mobilized into the soil solution than its immobilized counterparts, thereby increasing the bioaccessible fraction. Eh also plays a significant role in transforming heavy metal forms in the soil. In this study, rice–frog co-cultivation significantly increased soil Eh, especially in the HRF group, which increased by 62.5% compared to the CG group during the tillering stage (Figure 1e), thereby strengthening the oxidative environment of the soil. These oxidative conditions reduce available As by converting As (III) to As (V), which is adsorbed by iron oxides but increases available Pb by inhibiting PbS formation, thereby leaving soluble Pb2+, whose concentration is worsened by higher CEC desorption [71].
The rice–frog co-cultivation model typically alters the soil pH towards neutral or slightly acidic conditions. Numerous studies have confirmed the negative correlation between soil pH and the mobility and bioavailability of heavy metals [72,73]. Rising soil pH levels enhance the precipitation of Cd, As, and Hg as insoluble hydroxides and carbonates, thereby markedly diminishing their bioavailability and limiting transfer into rice tissues [74]. However, some areas of the rice field may create a slightly acidic environment due to frog activity and organic matter decomposition, leading to localized changes in soil pH in the rice–frog co-cultivation group. Pb is more likely to form soluble organic complexes under such acidic conditions, resulting in increased available Pb content in rice field soil [72].
In summary, changes in the soil’s physicochemical properties can affect the bioavailable form of heavy metals in the soil, thereby influencing their bioavailability.

4.3. Effects of Rice–Frog Co-Cultivation Model on Heavy Metal Content in Rice

This study found through the definition of the rice bioaccumulation factor (BCF) and heat map analysis that, compared to the CG, Cd, As, and Hg content in all parts of rice has decreased under the rice–frog co-cultivation model. The reduction in heavy metal content was particularly significant in HRF. We also analyzed the correlation between heavy metal content in different parts of rice and soil physicochemical properties. The results show that in the rice–frog co-culture model, frog activity might lower the effective content of Cd, As, and Hg in soil by affecting SOM, DOC, pH, CEC, and Eh. This in turn impacts how these heavy metals migrate from soil to rice and reduces their accumulation in rice. This finding consists of previous studies on the correlation of heavy metal and nutrient levels in rice under integrated rice-fish farming systems [75]. In contrast to this result, SOM, DOC, pH, CEC, Eh, and the available form of Pb in the soil significantly influence the accumulation of Pb ions in various parts of rice plants. We speculate that the chemical properties of Pb make it more prone to desorption and complexation reactions in similar microenvironments. Noteworthy, frog disturbances alter the redox state of sediments, creating special environments, such as oxidized microdomains [76]. These findings are consistent with those of previous studies on the effects of rice-shrimp co-cultivation on heavy metals in rice fields [77]. Compared to CG, the bioavailable concentrations of Pb and their accumulation in various parts of rice plants were significantly higher in HRF in this study. Therefore, weighing the benefits and drawbacks of balancing economic efficiency and food security, this study recommends appropriately reducing the stocking density of black-spotted frogs to mitigate the threat of Pb to rice safety.
Unlike traditional Chinese rice mono-culture, rice–frog co-cultivation is a novel symbiotic model developed in recent years based on ecological agriculture principles. This approach utilizes rice paddies to provide natural habitats for frogs, which prey on pests to reduce chemical pesticide use. Their excrement also supplies organic nutrients for rice growth [30,31]. Furthermore, this study found that the rice–frog co-cultivation model significantly reduces the levels of heavy metals in the soil and the Cd, As, and Hg content in rice bran. As the edible part of rice, the content of heavy metals in rice bran determines the quality of the food. This finding provides a new ecological regulation pathway for reducing heavy metal exposure risks in rice, thereby enhancing the safety of edible agricultural products. Noteworthy, this study focused on short-term observations on the rice–frog co-cultivation system in a specific region. The stability of the rice–frog co-cultivation system in heavy metal regulation effects should thus be verified under different soil types and long-term continuous cropping conditions. Future studies should consider combining multi-regional field trials to further elucidate their mechanisms of action.

5. Conclusions

This study demonstrates that rice–frog co-cultivation systems significantly improve the physical and chemical properties of reclaimed paddy soil, including the SOM, DOC, CEC, pH, and Eh. Notably, these changes were more pronounced in the high-density group (HRF) and were closely associated with a reduction in the bioavailable fractions of cadmium (Cd), arsenic (As), and mercury (Hg) in the soil and the subsequent reduction in the accumulation of these heavy metals in rice roots, stems, leaves, and grains. However, the mixed cropping system also increased the bioavailability and plant uptake of lead (Pb), particularly under high-density conditions. These differential effects highlight the potential ecological trade-offs that warrant further investigations. Although we have validated and reported that the data meet the assumptions of normality and homogeneity of variance required for ANOVA and RDA through appropriate statistical tests, we acknowledge that both methods have inherent limitations in statistical robustness. For instance, they exhibit low tolerance for potential outliers in the dataset and high sensitivity to deviations in linear relationships between variables. These factors may exert a slight influence on the absolute robustness of the analytical results.
The findings of this study collectively demonstrate the feasibility of the rice–frog co-cropping system in improving soil quality and reducing food safety risks associated with heavy metal contamination in degraded farmlands. These findings provide a theoretical foundation for designing and implementing integrated agroecological systems aimed at soil remediation and sustainable rice production. Future research should explore long-term impacts, regional adaptability, and optimal mixed cropping configurations to maximize environmental and agronomic benefits while mitigating unintended risks.

Author Contributions

Conceptualization, Y.M. and R.Z.; methodology, X.X. and Z.Z.; software, X.X. and Z.W.; validation, X.X., Z.W. and Z.Z.; formal analysis, H.L., Z.W. and Z.Z.; investigation, X.X. and Y.M.; resources, X.X. and Z.Z.; data curation, H.L. and R.Z.; writing—original draft preparation, X.X.; writing—review and editing, X.X., Z.W. and Z.Z.; visualization, R.Z.; supervision, R.Z.; project administration R.Z.; funding acquisition, R.Z. and Z.W. All authors have read and agreed to the published version of the manuscript.

Funding

This research was funded by the National Natural Science Foundation Project (32370454; 31772482), Jinhua Science and Technology Plan Project (2023-2-013) and Jinhua Public Welfare Technology Application Research Project (2024-4-042).

Institutional Review Board Statement

Not applicable.

Data Availability Statement

The original contributions presented in this study are included in the article. Further inquiries can be directed to the corresponding author.

Conflicts of Interest

The authors declare no conflicts of interest.

References

  1. Sánchez-Castro, I.; Molina, L.; Prieto-Fernández, M.Á.; Segura, A. Past, present and future trends in the remediation of heavy-metal contaminated soil-Remediation techniques applied in real soil-contamination events. Heliyon 2023, 9, e16692. [Google Scholar] [CrossRef]
  2. Liu, M.; Zhao, L.; Lin, L.; Zhang, Y.; Huang, H.; Deng, W.; He, Y.; Tao, J.; Hu, Y.; Nan, L.; et al. Distribution characteristics, sources and risk assessment of heavy metals in the surface sediments from the largest tributary of the Lancang River in the Tibet Plateau, China. Env. Geochem. Health 2024, 46, 414. [Google Scholar] [CrossRef]
  3. Li, X.; Yang, Q.; Wang, L.; Song, C.; Chen, L.; Zhang, J.; Liang, Y. Using Caenorhabditis elegans to assess the ecological health risks of heavy metals in soil and sediments around Dabaoshan Mine, China. Environ. Sci. Pollut. Res. Int. 2022, 29, 16332–16345. [Google Scholar] [CrossRef]
  4. Ren, S.; Song, C.; Ye, S.; Cheng, C.; Gao, P. The spatiotemporal variation in heavy metals in China’s farmland soil over the past 20 years: A meta-analysis. Sci. Total Environ. 2022, 806 Pt 2, 150322. [Google Scholar] [CrossRef]
  5. Shi, J.; Zhao, D.; Ren, F.; Huang, L. Spatiotemporal variation of soil heavy metals in China: The pollution status and risk assessment. Sci. Total Environ. 2023, 871, 161768. [Google Scholar] [CrossRef]
  6. Yuan, X.; Xue, N.; Han, Z. A meta-analysis of heavy metals pollution in farmland and urban soils in China over the past 20 years. J. Environ. Sci. 2021, 101, 217–226. [Google Scholar] [CrossRef] [PubMed]
  7. Karunaratne, A.S.; Chaogejilatu; Iizumi, T. A climate impact attribution of historical rice yields in Sri Lanka using three crop models. Sci. Rep. 2025, 15, 15360. [Google Scholar] [CrossRef]
  8. Sun, Q.; Zhao, Y.; Zhang, Y.; Chen, S.; Ying, Q.; Lv, Z.; Che, X.; Wang, D. Heat stress may cause a significant reduction of rice yield in China under future climate scenarios. Sci. Total Environ. 2022, 818, 151746. [Google Scholar] [CrossRef] [PubMed]
  9. Su, H.; Wang, W.; Lu, T.; Hu, W.; Lin, J.; Fu, W.; Liang, Y.; Zeng, Y.; Fu, G.; Xiong, J.; et al. Increased Photosynthetic Capacity and Energy Status Contribute to Higher Grain Yield in Early Rice. Int. J. Mol. Sci. 2025, 26, 1508. [Google Scholar] [CrossRef] [PubMed]
  10. Huang, T.; Deng, Y.; Zhang, X.; Wu, D.; Wang, X.; Huang, S. Distribution, source identification, and health risk assessment of heavy metals in the soil-rice system of a farmland protection area in Hubei Province, Central China. Environ. Sci. Pollut. Res. Int. 2021, 28, 68897–68908. [Google Scholar] [CrossRef]
  11. Ma, X.; Sharifan, H.; Dou, F.; Sun, W. Simultaneous reduction of arsenic (As) and cadmium (Cd) accumulation in rice by zinc oxide nanoparticles. Chem. Eng. J. 2020, 384, 123802. [Google Scholar] [CrossRef]
  12. Briffa, J.; Sinagra, E.; Blundell, R. Heavy metal pollution in the environment and their toxicological effects on humans. Heliyon 2020, 6, e04691. [Google Scholar] [CrossRef] [PubMed]
  13. Deng, M.; Zhu, Y.; Shao, K.; Zhang, Q.; Ye, G.; Shen, J. Metals source apportionment in farmland soil and the prediction of metal transfer in the soil-rice-human chain. J. Environ. Manag. 2020, 260, 110092. [Google Scholar] [CrossRef] [PubMed]
  14. Shahab, A.; Hui, Z.; Rad, S.; Xiao, H.; Siddique, J.; Huang, L.L.; Ullah, H.; Rashid, A.; Taha, M.R.; Zada, N. A comprehensive review on pollution status and associated health risk assessment of human exposure to selected heavy metals in road dust across different cities of the world. Env. Geochem. Health 2023, 45, 585–606. [Google Scholar] [CrossRef] [PubMed]
  15. Tu, C.; Wei, J.; Guan, F.; Liu, Y.; Sun, Y.; Luo, Y. Biochar and bacteria inoculated biochar enhanced Cd and Cu immobilization and enzymatic activity in a polluted soil. Environ. Int. 2020, 137, 105576. [Google Scholar] [CrossRef]
  16. Rajendran, S.; Priya, T.A.K.; Khoo, K.S.; Hoang, T.K.A.; Ng, H.S.; Munawaroh, H.S.H.; Karaman, C.; Orooji, Y.; Show, P.L. A critical review on various remediation approaches for heavy metal contaminants removal from contaminated soils. Chemosphere 2022, 287 Pt. 4, 132369. [Google Scholar] [CrossRef]
  17. Cui, W.; Li, X.; Duan, W.; Xie, M.; Dong, X. Heavy metal stabilization remediation in polluted soils with stabilizing materials: A review. Env. Geochem. Health 2023, 45, 4127–4163. [Google Scholar] [CrossRef]
  18. Guo, W.; Yao, X.; Chen, Z.; Liu, T.; Wang, W.; Zhang, S.; Xian, J.; Wang, Y. Recent advance on application of biochar in remediation of heavy metal contaminated soil: Emphasis on reaction factor, immobilization mechanism and functional modification. J. Environ. Manag. 2024, 371, 123212. [Google Scholar] [CrossRef]
  19. Kou, B.; Yuan, Y.; Zhu, X.; Ke, Y.; Wang, H.; Yu, T.; Tan, W. Effect of soil organic matter-mediated electron transfer on heavy metal remediation: Current status and perspectives. Sci. Total Environ. 2024, 917, 170451. [Google Scholar] [CrossRef]
  20. Gao, H.; Dai, W.; Fang, K.; Yi, X.; Chen, N.; Penttinen, P.; Sha, Z.; Cao, L. Rice-duck co-culture integrated different fertilizers reduce P losses and Pb accumulation in subtropical China. Chemosphere 2020, 245, 125571. [Google Scholar] [CrossRef]
  21. Ngoc, N.P.; Dang, L.V.; Qui, N.V.; Hung, N.N. Chemical processes and sustainability of rice-shrimp farming on saline acid sulfate soils in mekong delta. Heliyon 2023, 9, e13532. [Google Scholar] [CrossRef]
  22. Hou, Y.; Jia, R.; Zhou, L.; Zhang, L.; Sun, W.; Li, B.; Zhu, J. Integrated rice-fish farming dynamically altered the metal resistances and microbial-mediated iron, arsenic, and mercury biotransformation in paddy soil. Environ. Pollut. 2025, 373, 126107. [Google Scholar] [CrossRef]
  23. Yan, T.; Xie, Y.Y.; Zhou, B.; Kuang, X.; Li, Q.Z.; Zhao, F.Q.; Li, Q.D.; He, B. Rice-fish farming improved antioxidant defences, glucose metabolism, and muscle nutrient of Carassius auratus in Sichuan province. Metabolites 2024, 14, 710. [Google Scholar] [CrossRef]
  24. Yan, J.; Yu, J.; Huang, W.; Pan, X.; Li, Y.; Li, S.; Tao, Y.; Zhang, K.; Zhang, X. Initial studies on the effect of the rice-duck-crayfish ecological co-culture system on physical, chemical, and microbiological properties of soils: A field case study in Chaohu Lake Basin, Southeast China. Int. J. Environ. Res. Public Health 2023, 20, 2006. [Google Scholar] [CrossRef]
  25. Yang, G.; Juncang, T.; Zhi, W. Composition and functional diversity of soil and water microbial communities in the rice-crab symbiosis system. PLoS ONE 2025, 20, e0316815. [Google Scholar] [CrossRef]
  26. Li, M.; Li, R.; Zhang, J.; Wu, T.; Liu, S.; Hei, Z.; Qiu, S. Effects of the integration of mixed-cropping and rice-duck co-culture on rice yield and soil nutrients in southern China. J. Sci. Food Agric. 2020, 100, 277–286. [Google Scholar] [CrossRef]
  27. Ahmed, N.; Hornbuckle, J.; Turchini, G.M. Blue-green water utilization in rice-fish cultivation towards sustainable food production. Ambio 2022, 51, 1933–1948. [Google Scholar] [CrossRef] [PubMed]
  28. Hou, Y.; Jia, R.; Zhou, L.; Zhang, L.; Wei, S.; Li, B.; Zhu, J. Alterations in microbial-mediated methane, nitrogen, sulfur, and phosphorus cycling within paddy soil induced by integrated rice-fish farming. J. Environ. Manag. 2025, 388, 126056. [Google Scholar] [CrossRef] [PubMed]
  29. Hou, J.; Styles, D.; Cao, Y.; Ye, X. The sustainability of rice-crayfish coculture systems: A mini review of evidence from Jianghan plain in China. J. Sci. Food Agric. 2021, 101, 3843–3853. [Google Scholar] [CrossRef] [PubMed]
  30. Ma, Y.; Yu, A.; Zhang, L.; Zheng, R. Effects of Rice-Frog Co-Cropping on the Soil Microbial Community Structure in Reclaimed Paddy Fields. Biology 2024, 13, 396. [Google Scholar] [CrossRef]
  31. Wang, N.; Jiang, M.; Zhang, P.; Shu, H.; Li, Y.; Guo, Z.; Li, Y. Amelioration of Cd-induced bioaccumulation, oxidative stress and intestinal microbiota by Bacillus cereus in Carassius auratus gibelio. Chemosphere 2020, 245, 125613. [Google Scholar] [CrossRef] [PubMed]
  32. Zhu, Z.; Li, R.; Ma, Y.; Yu, A.; Zheng, R. Frog Density and Growth Stage of Rice Impact Paddy Field and Gut Microbial Communities in Rice-Frog Co-Cropping Models. Microorganisms 2025, 13, 1700. [Google Scholar] [CrossRef]
  33. Lin, K.; Wu, J. Effect of introducing frogs and fish on soil phosphorus availability dynamics and their relationship with rice yield in paddy fields. Sci. Rep. 2020, 10, 21. [Google Scholar] [CrossRef]
  34. Fang, K.; Dai, W.; Chen, H.; Wang, J.; Gao, H.; Sha, Z.; Cao, L. The effect of integrated rice-frog ecosystem on rice morphological traits and methane emission from paddy fields. Sci. Total Environ. 2021, 783, 147123. [Google Scholar] [CrossRef]
  35. Qiao, M.; Zhang, L.; Chang, J.; Li, H.; Li, J.; Wang, W.; Yuan, G.; Su, J. Rapid and sensitive detection of pathogenic Elizabethkingia miricola in black spotted frog by RPA-LFD and fluorescent probe-based RPA. Fish Shellfish Immunol. Rep. 2022, 3, 100059. [Google Scholar] [CrossRef]
  36. Li, S.; Wang, X.; Lu, Y.; Wang, J.; Yu, D.; Zhou, Z.; Wei, J.; Liu, L.; Liu, J.; Liu, F.; et al. Co-infections of Klebsiella pneumoniae and Elizabethkingia miricola in black-spotted frogs (Pelophylax nigromaculatus). Microb. Pathog. 2023, 180, 106150. [Google Scholar] [CrossRef]
  37. Jia, Y.; Zheng, Y.; He, T.; Tang, H. Effects of integrated rice-frog farming on soil bacterial community composition. Chil. J. Agric. Res. 2023, 83, 525–538. [Google Scholar] [CrossRef]
  38. Bose, H.; Saha, A.; Sahu, R.P.; Dey, A.S.; Sar, P. Characterization of the rare microbiome of rice paddy soil from arsenic contaminated hotspot of West Bengal and their interrelation with arsenic and other geochemical parameters. World J. Microbiol. Biotechnol. 2022, 38, 171. [Google Scholar] [CrossRef]
  39. Nelson, D.W.; Sommers, L.E.; Lauenroth, W.K. Total carbon, organic carbon, and organic matter. In Methods of Soil Analysis. Part 2; Page, A.L., Miller, R.H., Keeney, D.R., Eds.; American Society of Agronomy: Madison, WI, USA, 1982; pp. 539–579. [Google Scholar]
  40. Liu, L.; Cao, H.; Geng, Y.; Zhang, Q.; Bu, X.; Gao, D. Response of soil microecology to different cropping practice under Bupleurum chinense cultivation. BMC Microbiol. 2022, 22, 223. [Google Scholar] [CrossRef] [PubMed]
  41. Aran, D.; Maul, A.; Masfaraud, J.F. A spectrophotometric measurement of soil cation exchange capacity based on cobaltihexamine chloride absorbance. Comptes Rendus Geosci. 2008, 340, 865–871. [Google Scholar] [CrossRef]
  42. Qu, B.; Liu, Y.; Sun, X.; Li, S.; Wang, X.; Xiong, K.; Yun, B.; Zhang, H. Effect of various mulches on soil physico-chemical properties and tree growth (Sophora japonica) in urban tree pits. PLoS ONE 2019, 14, e0210777. [Google Scholar] [CrossRef]
  43. Yao, B.M.; Wang, S.Q.; Xie, S.T.; Li, G.; Sun, G.X. Optimal soil Eh, pH for simultaneous decrease of bioavailable Cd, As in co-contaminated paddy soil under water management strategies. Sci. Total Environ. 2022, 806 Pt. 3, 151342. [Google Scholar] [CrossRef]
  44. Junusbekov, M.M.; Akbasova, A.D.; Seidakbarova, A.D.; Koishiyeva, G.Z.; Sainova, G.A. Ecological assessment of soil contamination by heavy metals affected in the past by the lead-zinc mining and processing complex in Kentau, Kazakhstan. Environ. Monit. Assess. 2023, 195, 586. [Google Scholar] [CrossRef]
  45. Li, L.; Mao, K.; Ippolito, J.A.; Xing, W.; Chen, X.; Zhu, W.; Cheng, Y. Calcium amendments affect heavy metal bioavailability in acidic and calcareous soils. Int. J. Environ. Sci. Technol. 2022, 19, 10067–10076. [Google Scholar] [CrossRef]
  46. GB/T 17141-1997; Soil Quality—Determination of Lead and Cadmium—Graphite Furnace Atomic Absorption Spectrometry. Issuer: State Administration for Market Regulation (Formerly State Bureau of Quality and Technical Supervision): Beijing, China, 1997.
  47. DB35/T 1459-2014; Determination of Available Arsenic and Available Mercury in Acidic Soil—Atomic Fluorescence Spectrometry. Issuer: Fujian Provincial Administration for Market Regulation: Fuzhou, China, 2014.
  48. Xu, L.; Cao, S.; Wang, J.; Lu, A. Which factors determine metal accumulation in agricultural soils in the severely human-coupled ecosystem? Int. J. Environ. Res. Public Health 2016, 13, 510. [Google Scholar] [CrossRef]
  49. HJ 680-2013; Soil and Sediment—Determination of Mercury, Arsenic, Selenium, Bismuth and Antimony—Microwave Digestion/Atomic Fluorescence Spectrometry. Issuer: Ministry of Ecology and Environment of the People’s Republic of China (Formerly Ministry of Environmental Protection): Beijing, China, 2013.
  50. Sun, G.; Zhang, L.; Cheng, P.; Yao, B.M. Silicon fertilizers mitigate rice cadmium and arsenic uptake in a 4-year field trial. J. Soils Sediments 2021, 21, 163–171. [Google Scholar] [CrossRef]
  51. GB 5009.268-2016; National Food Safety Standard—Determination of Multi-Elements in Foods. Issuer: National Health and Family Planning Commission of the People’s Republic of China: Beijing, China, 2016.
  52. GBW(E)100348; Reference Material for Component Analysis of Rice Flour. Developer (Corresponding Issuing Entity): CNAS Testing Technology Co., Ltd.: Beijing, China, 2020.
  53. Chen, B.; Guo, L.; Tang, J.; Li, Y.; Li, C. Comprehensive impacts of different integrated rice-animal co-culture systems on rice yield, nitrogen fertilizer partial factor productivity and nitrogen losses: A global meta-analysis. Sci. Total Environ. 2024, 915, 169994. [Google Scholar] [CrossRef]
  54. Wu, B.; Chen, J.; Huang, L.; Zhang, Y.; Fang, T.; He, J. Dynamics of soil fertility and microbial community response to stocking density in rice-turtle co-culture. Aquac. Rep. 2021, 20, 100765. [Google Scholar] [CrossRef]
  55. Wu, X.; Liu, P.; Wegner, C.E.; Luo, Y.; Xiao, K.Q.; Cui, Z.; Zhang, F.; Liesack, W.; Peng, J. Deciphering microbial mechanisms underlying soil organic carbon storage in a wheat-maize rotation system. Sci. Total Environ. 2021, 788, 147798. [Google Scholar] [CrossRef] [PubMed]
  56. Jiang, X.; Ma, H.; Zhao, Q.L.; Yang, J.; Xin, C.Y.; Chen, B. Bacterial communities in paddy soil and ditch sediment under rice-crab co-culture system. AMB Express 2021, 11, 163. [Google Scholar] [CrossRef] [PubMed]
  57. Dove, N.C.; Barnes, M.E.; Moreland, K.; Graham, R.C.; Berhe, A.A.; Hart, S.C. Depth dependence of climatic controls on soil microbial community activity and composition. ISME Commun. 2021, 1, 78. [Google Scholar] [CrossRef] [PubMed]
  58. Hu, Z.; Delgado-Baquerizo, M.; Fanin, N.; Chen, X.; Zhou, Y.; Du, G.; Hu, F.; Jiang, L.; Hu, S.; Liu, M. Nutrient-induced acidification modulates soil biodiversity-function relationships. Nat. Commun. 2024, 15, 2858. [Google Scholar] [CrossRef] [PubMed]
  59. Sha, Z.; Chu, Q.; Zhao, Z.; Yue, Y.; Lu, L.; Yuan, J.; Cao, L. Variations in nutrient and trace element composition of rice in an organic rice-frog coculture system. Sci. Rep. 2017, 7, 15706. [Google Scholar] [CrossRef]
  60. Fang, K.; Yi, X.; Dai, W.; Gao, H.; Cao, L. Effects of integrated rice-frog farming on paddy field greenhouse gas emissions. Int. J. Environ. Res. Public Health 2019, 16, 1930. [Google Scholar] [CrossRef]
  61. Li, S.; Li, W.; Ding, K.; Shi, X.; Kalkhajeh, Y.K.; Wei, Z.; Zhang, Z.; Ma, C. Co-culture of rice and aquatic animals enhances soil organic carbon: A meta-analysis. Sci. Total Environ. 2024, 955, 176819. [Google Scholar] [CrossRef]
  62. Ramos, F.T.; Dores, E.F.C.; Weber, O.L.D.S.; Beber, D.C.; Campelo, J.H., Jr.; Maia, J.C.S. Soil organic matter doubles the cation exchange capacity of tropical soil under no-till farming in Brazil. J. Sci. Food Agric. 2018, 98, 3595–3602. [Google Scholar] [CrossRef] [PubMed]
  63. Yuan, P.; Wang, J.; Li, C.; Cao, C. Long-term rice-crayfish farming aggravates soil gleying and induced changes of soil iron morphology. Soil Use Manag. 2020, 38, 757–770. [Google Scholar] [CrossRef]
  64. Xu, G.; Liu, X.; Wang, Q.; Yu, X.; Hang, Y. Integrated rice-duck farming mitigates the global warming potential in rice season. Sci. Total Environ. 2017, 575, 58–66. [Google Scholar] [CrossRef]
  65. Yuan, C.; Li, Q.; Sun, Z.; Sun, H. Effects of natural organic matter on cadmium mobility in paddy soil: A review. J. Environ. Sci. 2021, 104, 204–215. [Google Scholar] [CrossRef]
  66. Xiong, R.; Li, Y.; Gao, X.; Xue, Y.; Huang, J.; Li, N.; Chen, C.; Chen, M. Distribution and migration of heavy metals in the sediment-plant system: Case study of a large-scale constructed wetland for sewage treatment. J. Environ. Manag. 2024, 349, 119428. [Google Scholar] [CrossRef]
  67. Zou, Q.; Wei, H.; Chen, Z.; Ye, P.; Zhang, J.; Sun, M.; Huang, L.; Li, J. Soil particle size fractions affect arsenic (As) release and speciation: Insights into dissolved organic matter and functional genes. J. Hazard. Mater. 2023, 443 Pt. B, 130100. [Google Scholar] [CrossRef]
  68. Jalali, M.; Jalali, M.; Antoniadis, V. The release of Cd, Cu, Fe, Mn, Ni, Pb, and Zn from clay loam and sandy loam soils under the influence of various organic amendments and low-molecular-weight organic acids. J. Hazard. Mater. 2023, 459, 132111. [Google Scholar] [CrossRef]
  69. Tan, Y.; Zhou, X.; Peng, Y.; Zheng, Z.; Gao, X.; Ma, Y.; Chen, S.; Cui, S.; Fan, B.; Chen, Q. Effects of phosphorus-containing material application on soil cadmium bioavailability: A meta-analysis. Environ. Sci. Pollut. Res. Int. 2022, 29, 42372–42383. [Google Scholar] [CrossRef] [PubMed]
  70. Yan, K.; Dong, Z.; Wijayawardena, M.A.A.; Liu, Y.; Li, Y.; Naidu, R. The source of lead determines the relationship between soil properties and lead bioaccessibility. Environ. Pollut. 2019, 246, 53–59. [Google Scholar] [CrossRef]
  71. Zhang, Z.; Wu, X.; Tu, C.; Huang, X.; Zhang, J.; Fang, H.; Huo, H.; Lin, C. Relationships between soil properties and the accumulation of heavy metals in different Brassica campestris L. growth stages in a Karst mountainous area. Ecotoxicol. Environ. Saf. 2020, 206, 111150. [Google Scholar] [CrossRef]
  72. Deng, W.; Wang, F.; Liu, W. Identification of factors controlling heavy metals/metalloid distribution in agricultural soils using multi-source data. Ecotoxicol. Environ. Saf. 2023, 253, 114689. [Google Scholar] [CrossRef]
  73. Barłóg, P.; Hlisnikovský, L.; Łukowiak, R.; Kunzová, E. Effect of long-term application of pig slurry and NPK fertilizers on trace metal content in the soil. Environ. Sci. Pollut. Res. Int. 2024, 31, 60004–60022. [Google Scholar] [CrossRef] [PubMed]
  74. Wang, Y.; Zhang, Z.; Li, Y.; Liang, C.; Huang, H.; Wang, S. Available heavy metals concentrations in agricultural soils: Relationship with soil properties and total heavy metals concentrations in different industries. J. Hazard. Mater. 2024, 471, 134410. [Google Scholar] [CrossRef] [PubMed]
  75. Duan, Y.; Li, Q.; Zhang, L.; Huang, Z.; Zhao, Z.; Zhao, H.; Du, J.; Zhou, J. Toxic metals in rice-fish co-culture systems and human health. Ecotoxicol. Environ. Saf. 2022, 241, 113797. [Google Scholar] [CrossRef]
  76. Pan, F.; Xiao, K.; Guo, Z.; Li, H. Effects of fiddler crab bioturbation on the geochemical migration and bioavailability of heavy metals in coastal wetlands. J. Hazard. Mater. 2022, 437, 129380. [Google Scholar] [CrossRef]
  77. Liu, M.; Shen, D.; Zhang, W.; Jiang, Y.; Cao, C. Health risk assessment and bioaccumulation of heavy metal(loid)s in rice from the rice-crayfish coculture system. Environ. Pollut. 2025, 381, 126451. [Google Scholar] [CrossRef] [PubMed]
Figure 1. The effect of different treatments on the soil physical and chemical properties (n = 3). (a): SOM; (b): DOC; (c): CEC; (d): pH; (e): Eh; S1: tillering; S2: heading; S3: full heading; S4: maturity of rice. Values are presented as the mean ± SD. The presence of different lowercase letters within the same period denotes statistically significant differences at p < 0.05.
Agriculture 15 02374 g001
Figure 2. Differences in the contents of active state of soil heavy metals under different treatments (n = 3). (a): Cd effective state content; (b): As effective state content; (c): Hg effective state content; (d): Pb effective state content; S1: tillering stage; S2: heading stage; S3: full heading stage; S4: maturity stage. Values are presented as the mean ± SD. The presence of different lowercase letters within the same period denotes statistically significant differences at p < 0.05.
Agriculture 15 02374 g002
Figure 3. Characterization of differences in Cd content in different parts of rice (n = 3). (a): Cd accumulated in roots; (b): Cd accumulated in stems; (c): Cd accumulated in leaves; (d): Cd accumulated in brown rice. Values are presented as mean ± SD. Different lowercase letters within the same rice location denote significant differences at p < 0.05.
Agriculture 15 02374 g003
Figure 4. Characterization of differences in As content in different parts of rice (n = 3). (a): As accumulated in roots; (b): As accumulated in stems; (c): As accumulated in leaves; (d): As accumulated in brown rice. Values are presented as mean ± SD. Different lowercase letters within the same rice location denote significant differences at p < 0.05.
Agriculture 15 02374 g004
Figure 5. Characterization of differences in Hg content in different parts of rice (n = 3). (a): Hg accumulated in roots; (b): Hg accumulated in stems; (c): Hg accumulated in leaves; (d): Hg accumulated in brown rice. Values are presented as mean ± SD. Different lowercase letters within the same rice location denote significant differences at p < 0.05.
Agriculture 15 02374 g005
Figure 6. Characterization of differences in Pb accumulated in different parts of rice (n = 3). (a): Pb accumulated in roots; (b): Pb accumulated in stems; (c): Pb accumulated in leaves; (d): Pb accumulated in brown rice. Values are presented as mean ± SD. Different lowercase letters within the same rice location denote significant differences at p < 0.05.
Agriculture 15 02374 g006
Figure 7. RDA of soil physicochemical properties and active state content of soil heavy metals.
Agriculture 15 02374 g007
Figure 8. Correlation analysis of the content of heavy metals in various parts of rice with the soil’s physical and chemical properties. (a): Cd; (b): As; (c): Hg; (d): Pb. The color indicates the magnitude of the Pearson correlation coefficient. Red denotes positive correlation, while blue denotes negative correlation. The smaller the width of the ellipse, the larger the correlation coefficient and vice versa. *, **, and *** denote significance levels at p < 0.05, p < 0.01, and p < 0.001, respectively.
Agriculture 15 02374 g008
Figure 9. Heat map analysis of the correlation network between rice enrichment factors and soil physicochemical properties.
Agriculture 15 02374 g009
Table 1. Bioconcentration factors of rice for different heavy metals.
TreatmentBioconcentration Factor (BCF)
BCF-CdBCF-AsBCF-HgBCF-Pb
CG0.7464 ± 0.05740.0197 ± 0.0025 a0.0030 ± 7.8671 × 10⁻⁵ a0.00037 ± 5.803 × 10⁻⁵ a
LRF0.7123 ± 0.06960.0204 ± 0.0004 a0.0003 ± 0.0005 b0.00049 ± 5.5526 × 10⁻⁵ b
HRF0.6101 ± 0.08680.0081 ± 0.0036 b0.0000 b0.00052 ± 1.3703 × 10⁻⁵ b
Note: Different lowercase letters within the same column denote significant differences between trials for the same heavy metal (p < 0.05).
Disclaimer/Publisher’s Note: The statements, opinions and data contained in all publications are solely those of the individual author(s) and contributor(s) and not of MDPI and/or the editor(s). MDPI and/or the editor(s) disclaim responsibility for any injury to people or property resulting from any ideas, methods, instructions or products referred to in the content.