Abstract
This paper proposes a policy-oriented framework to evaluate agricultural sustainability and productivity within agri-food supply chains (AFSCs), focusing on the Tunisian context. The Analytic Hierarchy Process (AHP) was applied to identify the most appropriate Total Factor Productivity (TFP) methods, based on criteria derived from expert interviews and literature review. Three approaches, the Solow Residual, Törnqvist–Theil, and Divisia indices, were assessed. The Divisia (AHP weight = 0.918) and Törnqvist–Theil (AHP weight = 0.547) indices achieved the highest rankings, reflecting their suitability for multi-output systems and robust productivity decomposition. Sustainability-related Key Performance Indicators (KPIs) were categorized as inputs and outputs and monetized using shadow prices sourced from academic, institutional, and field data. Applied to 2015–2020 data, overall TFP declined by 59.5%, mainly due to reduced resource-use efficiency, declining agricultural value added, and increasing input costs. Unlike prior studies focused on farm-level productivity, this framework integrates TFP with a multi-criteria sustainability assessment to enhance evidence-based policymaking. The results demonstrate that methodological choices substantially shape sustainability conclusions and highlight the added value of price-aware, multi-output indices for complex agricultural systems. Overall, the proposed AHP–TFP approach provides a transparent, adaptable, and policy-relevant tool for evaluating sustainable productivity in the agri-food sector.
1. Introduction
Policymakers and other decision-makers in agri-food supply chains (AFSCs) play a key role in advancing sustainable strategies, particularly in regions facing significant social, economic, and environmental constraints [1]. Sustainability assessment must shift from traditional economic indicators to a multidimensional perspective that integrates environmental, social, and governance dimensions, as climate change, resource depletion, and socioeconomic volatility increase AFSC vulnerability [2]. Developing empirically based frameworks to assess the actual sustainability performance of policy interventions across diverse capitals, while accounting for institutional capacity and data limitations, remains challenging [3]. Despite numerous studies on TFP at macro and farm levels, few have explicitly addressed sustainability assessment at the institutional level in Tunisia, considering data limitations and recent policy reforms.
In this regard, total factor productivity (TFP), which calculates the ratio of total outputs to a bundle of inputs, is widely recognized as an index of resource-use efficiency [4,5]. Although TFP has traditionally been employed to assess technical or economic performance, recent studies are increasingly exploring it as a composite sustainability metric that takes into account input substitution, technological advancement, and structural changes influenced by public policies [6,7]. TFP provides a comprehensive depiction of system efficiency, which is suitable for evaluating long-term effects across environmental, social, and economic dimensions, in contrast to single-factor productivity measures.
A thorough methodological analysis is necessary to evaluate AFSC policymakers’ sustainability performance. Although TFP is commonly used in agricultural economics, its potential for assessing sustainability, especially at the level of institutions, remains largely unexplored. Several approaches exist to measure TFP, each with its own strengths and limitations, and they are generally grouped into growth accounting, frontier-based, and index-based methods. Most research to date has focused on macro levels, such as national, regional, or farm-level analyses. For example, Afzal et al. [8] applied a growth accounting framework to study long-term productivity at the national level in Pakistan, while [9] examined technical change and efficiency across regional crop systems. Liu et al. [10] and Wang et al. [11] used frontier-based techniques, including data envelopment analysis (DEA), slack-based measures (SBMs), and Malmquist decomposition, to capture scale efficiency and innovation in Chinese agricultural regions. While these methods provide valuable insights for broad benchmarking, they are less suited for assessing the specific contributions of institutional actors responsible for designing and implementing sustainability-oriented policies. While previous research has largely focused on Asian contexts, the applicability of these methods to Tunisia’s agricultural policies and institutional frameworks remains largely unexplored.
Frontier methods such as DEA, SBM, and Malmquist indices are widely employed to evaluate green or sustainable productivity [11,12]. They are robust tools for measuring relative efficiency and managing multiple inputs and outputs [13], particularly when price data are scarce or unreliable. However, their effectiveness diminishes for strategic policy evaluations that require dynamic decomposition of productivity changes over time, especially when actor-specific or price-based metrics are needed [14], and they face limitations in capturing institutional-level impacts and data-scarce environments. Although global studies [15,16] track productivity growth using market-based price weights, these approaches remain rarely applied in sustainability assessments at the institutional level. Some sectoral studies [17] employed Törnqvist–Theil indices to examine input–output dynamics, and a few regional studies [18] incorporated undesirable outputs to account for environmental concerns. These methods, while effective for benchmarking and cross-sectional comparisons, often lack direct linkage with the institutional constraints, data limitations, and policy priorities that shape real-world agricultural decision-making, particularly in developing regions. Despite these efforts, comprehensive evaluations integrating economic, environmental, and social dimensions with price-based productivity indices are still lacking.
This study seeks to answer the following research question: How can TFP methods be adapted and applied to assess the sustainability performance of institutional policymaking in Tunisia’s agri-food sector, considering data limitations and policy priorities?
The Tunisian context is characterized by ongoing agricultural policy reforms, limited availability of high-quality data, and institutional constraints, highlighting the need for regionally grounded sustainability assessment frameworks.
To fill this gap, this paper proposes an adapted framework for institutional policymaking in Tunisia, which applies carefully selected TFP methods to evaluate the sustainability performance of a policymaking institution within AFSC. Rather than introducing a completely new methodology, the study contextualizes and operationalizes existing approaches to enhance their relevance and applicability for decision-makers in data-constrained agricultural institutions. Given the diversity of TFP approaches and the complexity of sustainability issues, decision-support methods such as multi-criteria decision-making (MCDM), with particular attention to the Analytic Hierarchy Process (AHP) [19,20], provide a structured means of ranking alternatives by combining expert insights with quantitative evaluation [21].
Unlike previous studies that have mainly focused on farm-level or macroeconomic TFP estimation, this research extends the use of productivity indices to an institutional policymaking context, where decisions directly influence resource allocation and sustainability outcomes. The contribution of this study lies not in proposing a fully new method but in demonstrating how an integrated AHP–TFP framework can be tailored to institutional and policy needs, providing a practical and regionally grounded application of existing productivity theories. The integration of the AHP method allows for the systematic selection of the most suitable TFP approach based on expert criteria, while the incorporation of multi-capital key performance indicators (economic, environmental, and social) into a unified, monetized productivity framework strengthens its operational value for policy design. This hybrid AHP–TFP structure not only bridges methodological and contextual gaps in the existing literature but also enhances the transparency and reproducibility of sustainability assessment for decision-makers in agri-food governance.
This paper aims to design a decision-support framework for selecting and applying appropriate TFP methods to assess the sustainability-related performance of a policymaking institution in Tunisia’s agri-food sector. The study pursues two main objectives:
- (i)
- Identify and prioritize the most suitable TFP methods using AHP;
- (ii)
- Empirically apply the top-ranked TFP methods to a real-world policymaking case in Tunisia, providing insights into performance gaps and areas for improvement.
The paper is structured as follows: Section 2 outlines the TFP methods, selection criteria, and the implementation of AHP. Section 3 describes the case study and the data employed. Section 4 presents the empirical results, including the AHP ranking, the sustainability assessment, and the sensitivity analysis. Section 5 discusses the main findings, emphasizing their implications, validity, and limitations. Finally, Section 6 concludes the study and highlights avenues for future research.
2. Materials and Methods
This section aims to evaluate both the sustainability and performance of policymakers’ activities using the TFP index deemed most appropriate via the AHP. To achieve this, a three-phase approach has been developed, as illustrated in Figure 1.
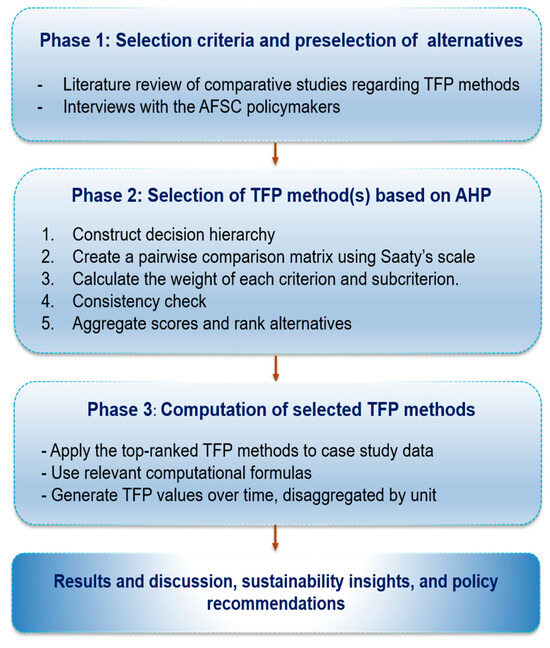
Figure 1.
Overview of the methodological framework.
2.1. Selection Criteria
In Phase 1, based on interviews with AFSC policymakers and a comprehensive review of comparative studies on TFP approaches [5,16,22,23], two main criteria were defined, each encompassing relevant sub-criteria aimed at capturing the methodological, contextual, and empirical dimensions that determine a method’s suitability. Insights from semi-structured interviews with AFSC policymakers directly informed the choice of criteria and sub-criteria. For example, policymakers emphasized the need for results to be clear and interpretable, which motivated the inclusion of the “Communication” sub-criterion within C1. Similarly, concerns regarding data representativeness and reliability highlighted the importance of the sub-criteria under C2, such as “number of units analyzed” and “nature of the data”. This direct linkage between interview findings and criterion selection ensures that the AHP framework reflects both methodological rigor and the practical priorities of policymakers. These criteria and sub-criteria are summarized in Table 1 and serve as the foundation for Phase 2 of the methodology. As far as we are aware, this study is the first to develop a structured set of criteria and sub-criteria for selecting a TFP index using AHP. The selection process was guided by a systematic literature review and supplemented by consultations with AFSC policymakers, ensuring that the factors considered are both relevant to the research context and effective in identifying the most appropriate and pertinent methods.

Table 1.
Criteria and sub-criteria established for selecting TFP methods.
2.2. Preselection of Alternatives
TFP is a central measure of how efficiently inputs are transformed into outputs in a production process. Conceptually, it captures the portion of output growth not explained by measured inputs, reflecting technological progress, managerial efficiency, and other intangible factors [4]. Calculating TFP typically involves distinguishing input and output variables and, in many methods, assigning “shadow prices” to value their marginal contribution when market prices are unavailable or distorted [29].
Methodologically, TFP can be classified into three main families. First, growth accounting methods, such as the Solow Residual, interpret TFP as the unexplained component of output growth after accounting for observed input growth, under assumptions of competitive markets and a correctly specified production function [22,30]. Second, index number approaches compute TFP changes from input–output growth rates weighted by prices. Within this family, the Divisia Index provides a continuous-time measure [31], the Törnqvist–Theil Index offers a discrete-time approximation consistent with flexible functional forms [32,33], and the Fisher Index ensures exact aggregation under certain conditions [24]. Third, frontier-based methods define productivity relative to an efficient frontier. This category includes data envelopment analysis (DEA), which employs a non-parametric linear programming approach, and stochastic frontier analysis (SFA), a parametric technique that separates inefficiency from random noise [34]. Dynamic extensions, such as the Malmquist Productivity Index, derived from DEA, further decompose productivity change into efficiency and technological progress components [35]. Each family differs in theoretical foundations, data requirements, and assumptions regarding returns to scale, noise, and prices [24,35,36].
For this work, which focuses on aggregate national accounts and macroeconomic time series, methods had to be theoretically robust, compatible with time-series data, and interpretable for policy evaluation [22]. Based on these criteria, three non-frontier TFP methods were selected: A1: Törnqvist–Theil Index, A2: Divisia Index, and A3: Solow Residual. These methods were chosen for their methodological rigor, suitability for aggregate time series, and ability to produce results in monetary terms, enhancing interpretability for decision-makers [27,37].
The exclusion of other methods is justified by the study’s objectives and data constraints:
- Fisher index: Although theoretically appealing [38], it fails the circularity test for multi-period comparisons and requires complete and reliable price data for all inputs and outputs, which are often unavailable or distorted in real-world contexts, particularly in public sectors or markets with distortions.
- Frontier methods (DEA, SFA, Malmquist): While effective for micro-level benchmarking, these methods are unsuitable for a single aggregate time series because they require cross-sectional data to construct a meaningful production frontier. Moreover, the Malmquist index relies on strong technological assumptions, such as convexity, monotonicity, and constant returns to scale, which are difficult to justify at the macro level [39].
Among the selected methods, the Törnqvist–Theil Index offers a second-order approximation to an unknown production function, accommodating changes in input and output shares over time [40]. The Divisia Index serves as a continuous-time theoretical benchmark, while the Solow Residual estimates the portion of output growth not explained by input growth, remaining a cornerstone of empirical growth accounting [30]. Together, these methods provide a balanced combination of methodological rigor, minimal data requirements, and practical relevance, ensuring consistency with macroeconomic time series and meeting the interpretive needs of policymakers.
2.3. AHP for TFP Selection
The AHP was then applied to assess the criteria and sub-criteria identified in Phase 1. The main steps of the AHP procedure were outlined in the following manner:
Step 1: Construction of the decision hierarchy: The hierarchy in the AHP method was organized into four levels: the overall objective at the top level, the evaluation criteria at the second level, the sub-criteria at the third level, and the TFP method alternatives (or options), A1, A2, and A3, at the fourth level. Figure 2 illustrates the hierarchical structure developed for the AHP. The objective of the hierarchy is to rank TFP methods.
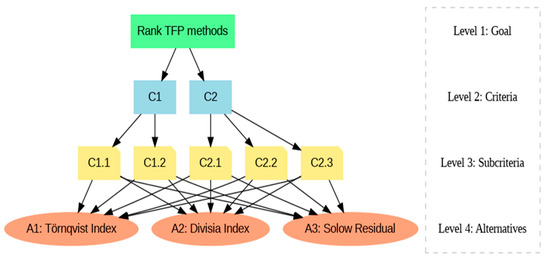
Figure 2.
AHP hierarchy structure.
Step 2: Pairwise comparisons: Conducted by three AFSC policymakers, including one senior RCAD official responsible for strategic planning and two technical staff with expertise in agricultural monitoring and evaluation. Each expert independently evaluated the criteria and sub-criteria using Saaty’s nine-point scale (Table 2) [19]. The individual judgments were aggregated using the geometric mean to produce a final comparison matrix for each criterion and sub-criterion.
Table 2.
Saaty scale for pairwise comparisons.
Step 3: Weight calculation: Each comparison matrix was normalized by dividing each column by its sum, and the eigenvector method was applied to compute priority vectors, yielding the calculated importance values of the criteria and sub-criteria, along with the overall scores of the alternatives. Figure 3 illustrates the AHP weight calculation process. Starting from a pairwise comparison matrix, each column is normalized by its sum, and the priority vector is derived using the eigenvector method. The resulting values indicate the relative significance of each criterion and sub-criterion and are subsequently used to determine the overall scores of the alternatives.
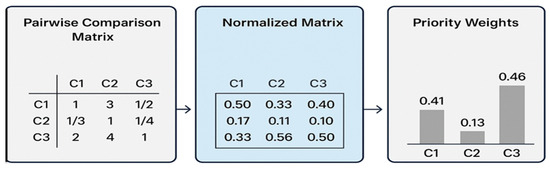
Figure 3.
Illustration of weight calculation in AHP.
Step 4: Consistency check: The reliability of the AFSC policymakers’ judgments was evaluated using the consistency index () and the consistency ratio (), computed as:
where represents the number of criteria or sub-criteria compared in the matrix, denotes the matrix’s largest eigenvalue, and is the random index, whose value varies with the size of the matrix (for its values, please refer to [20]). Consistency ratios were calculated for each individual expert’s comparison matrix as well as for the aggregated matrices obtained via the geometric mean. A value below 0.10 was considered acceptable; otherwise, Steps 2 and 3 were repeated until the required consistency was achieved.
Step 5: Aggregation and ranking of alternatives: The final ranking of TFP alternatives was determined by combining the importance values of criteria and sub-criteria with the performance scores of each alternative. This aggregation is typically computed using the following weighted sum formula [19]:
where
- : overall score of alternative
- : weight of criterion (or sub-criterion) obtained from AHP,
- : performance score of alternative with relative to criterion
- : total number of criteria (or sub-criteria).
After computing , the alternatives were ranked in descending order, with the highest score indicating the most preferred alternative.
The AHP procedure can be fully replicated, as all steps of the process are clearly described. Calculations were performed using Python 3.11 with the ‘ahpy’ package, and individual expert judgments were aggregated using the geometric mean method. KPI scores were normalized using min–max scaling to a 0–1 range prior to inclusion in the AHP computations. The consistency of each pairwise comparison matrix was systematically verified. Additional details on the calculation steps and intermediate results are provided in the Supplementary Materials to facilitate methodological transparency and replication by other researchers.
2.4. Computation of TFP Methods
Phase 3 focuses on computing the selected TFP methods by applying the relevant formulas to the case study dataset, thus generating disaggregated TFP values over time. To assess TFP in this study, a non-frontier, ratio-based approach is adopted. TFP is defined as the ratio of aggregated output to aggregated input, providing a concise measure of the efficiency with which resources are converted into outcomes. Formally, it is expressed as [22]:
With weights and , allowing for normalized and scale-independent comparison.
Due to the heterogeneous units of the physical indicators (e.g., kWh, hours, index values), all variables were converted into a common monetary unit using average shadow prices. This monetization step ensures consistency when aggregating the variables. In addition, undesirable outputs (e.g., pollution, waste) are incorporated as negative contributions in the output aggregation using a weighting factor θ to reflect their relative impact:
The log-mean weights () used in the Divisia and Törnqvist–Theil indices are computed as the average of the two consecutive periods. The indices presented in this study are expressed in a fixed-base form, comparing the end year directly to the base year, as no intermediate annual data were available. In studies with complete annual data, the same formulation can be extended to a chain-linked (year-on-year) approach.
The discrete approximation of the Divisia Index is computed as follows [31]:
where and are average weights over the two time periods. This method captures continuous growth changes in a theoretically consistent way.
The Törnqvist–Theil Index is expressed as [32]:
This method offers a robust and flexible way to measure productivity changes when input and output shares differ between two periods.
The final step involves analyzing these results to identify trends, uncover performance gaps, and derive sustainability insights that can support evidence-based policy recommendations.
3. Case Study and Data
3.1. Case Study Description
The governorate of Nabeul, located in Tunisia’s Cap Bon region, is renowned for its agricultural diversity and favorable Mediterranean climate, supporting key crops such as citrus fruits, particularly Maltese oranges, olive trees, vegetables, and greenhouse horticulture. This study was conducted within the framework of the SMALLDERS project, which aims to assess and enhance the sustainability performance of AFSC actors in Tunisia. This diversity makes Nabeul a major agricultural hub and a strategic area for national development. The Regional Commission for Agricultural Development (RCAD) of Nabeul, a decentralized body under the Ministry of Agriculture, Water Resources, and Fisheries, implements agricultural policies locally with a focus on supporting smallholder farmers. Its mandate includes integrated water resource management, technical and financial assistance, promotion of sustainable practices, and coordination of rural development projects. The RCAD has engaged in initiatives such as the reuse of treated wastewater for irrigation, in collaboration with national and international partners [41]. Despite its potential, the region faces challenges such as water scarcity, groundwater overexploitation, soil salinization, climate vulnerability, land fragmentation, and limited mechanization. To address these challenges, the RCAD fosters resilience through awareness campaigns, capacity building, and the adoption of locally adapted innovative technologies. In this context, the next section introduces the KPIs used by the RCAD to monitor and guide agricultural development strategies in the region.
3.2. Provided Dataset
The set of sustainability indicators defined in [42,43] covers four types of capital: natural, financial, intellectual, and internal social. The list of capitals and associated indicators is presented in Table 3, along with their corresponding values for 2015 and 2020, as reported by the policymaker. The KPI data were collected through a structured questionnaire with the policymaker, and all values were cross-checked against RCAD institutional records and official statistics, providing transparent documentation of data provenance and validation. This classification of KPIs follows a multi-capital perspective, which accounts for the different forms of capital contributing to sustainable development. For a detailed discussion of this multi-capital approach, see previous work on sustainability assessment [43,44].
Table 3.
Sustainability KPIs reported by RCAD (2015–2020) [42].
Under natural capital, four indicators were defined [43]. The cultivated land utilization index measures how effectively agricultural land is used relative to its potential, reflecting land efficiency principles promoted by [45]. Energy consumption for regional production quantifies the total energy inputs required for agricultural activities, including electricity, fuel, and renewables, consistent with OECD’s environmental performance indicators [27]. Water stress captures the pressure exerted on freshwater resources by agricultural withdrawals, while water use efficiency evaluates the economic return generated per unit of water consumed, both essential for sustainable water management.
Financial capital includes regional agricultural added value, which reflects the sector’s economic contribution, and agricultural yield, measuring crop output per hectare, a core indicator of productive performance [27]. Regional investment captures financial commitments from public and private actors in support of agricultural development. The substantial decrease in “Regional (government and private) investment” from 4,000,000 TND in 2015 to 60,000 TND in 2020 reflects the actual disbursement patterns of agricultural investment programs during the study period. This variation is attributable to the activation of specific initiatives, notably the agricultural modernization and revitalization program launched in 2016 [46]. This program aimed to enhance farmers’ incomes, strengthen agricultural production, and create rural employment in the Nabeul region. Although this program falls outside the 2015–2020 study period, it underscores the government’s ongoing commitment to supporting the agricultural sector. The vulgarization program for smallholders refers to the extent of agricultural extension services provided to farmers, thereby fostering capacity building and innovation.
Finally, social capital is represented by the percentage of permanent employees, indicating employment stability, and regional labor hours, which reflect the annual labor input. Both indicators align with the International Labor Organization’s decent work framework [47].
Some KPIs were affected by limited data availability, particularly for financial and intellectual capital indicators. All KPI data were checked for completeness and consistency prior to analysis. Minimal missing values were addressed using linear interpolation or, when appropriate, expert-informed imputation. Outliers were reviewed and confirmed with the responsible policymakers to ensure data integrity and comparability.
3.3. Classification of KPIs
The sustainability indicators used in this paper are classified into inputs and outputs based on their role in the agricultural production process. This distinction is fundamental for understanding system efficiency and provides the basis for TFP measurement. Inputs refer to the resources mobilized or consumed during production, including energy, water, labor, capital, and land. Indicators such as energy consumption, water stress, water use efficiency, regional labor hours, and the proportion of permanent employees fall into this category, as they capture the operational, environmental, and social costs associated with agricultural activities. Outputs, in contrast, represent the results generated from these inputs, reflecting system performance in terms of productivity, economic returns, and institutional engagement. The vulgarization program for smallholders is explicitly classified as an output indicator, reflecting the outcome of capacity-building and extension services provided to farmers. Examples include the cultivated land utilization index, regional agricultural added value, crop yield, regional investment, and participation in agricultural extension programs. This input–output classification is crucial for evaluating both the efficiency and sustainability of the AFSC, as an optimal system seeks to maximize desirable outputs while minimizing resource-intensive inputs. Figure 4 illustrates this classification by mapping the indicators accordingly, supporting the development of computational models for performance assessment and evidence-based decision-making.
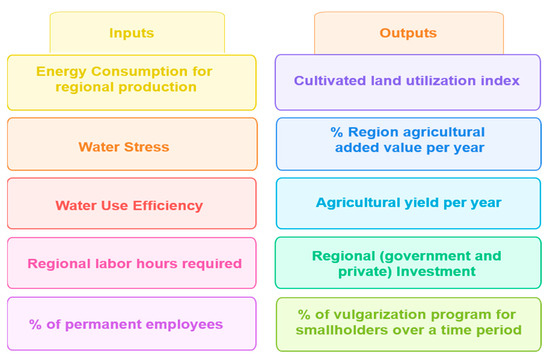
Figure 4.
Inputs and outputs KPIs for sustainability evaluation.
3.4. Mean Shadow Price-Based Valuation of KPIs
To enable TFP index computation, each sustainability KPI was assigned a shadow price representing its estimated marginal value in Tunisian dinars (TND) per unit. Shadow prices standardize heterogeneous indicators by expressing them in monetary terms, ensuring consistency and comparability in aggregation. All shadow prices were obtained from specific, documented sources. Where the original data were reported in foreign currencies (USD or EUR), values were converted to TND using the official exchange rates for the corresponding year, as published by the Central Bank of Tunisia. This conversion ensures that the valuation reflects local economic conditions. For example, energy consumption values were sourced from [48,49], labor costs from [50,51], and agricultural yields and land utilization indices from ONAGRI and DGACH national reports. Table 4 presents the final shadow prices in TND for 2015 and 2020, along with the corresponding unit and source. This detailed documentation ensures transparency and allows reproducibility of the TFP computations within the Tunisian agricultural context.
Table 4.
Mean estimated shadow values of each KPI in Tunisia (2015 and 2020).
4. Results
This section presents and interprets the findings from the AHP and TFP analyses, implemented using Python. The relative importance of the criteria and sub-criteria was derived from policymakers’ judgments, while the performance scores of the TFP alternatives were calculated accordingly. Based on these results, the TFP methods were subsequently ranked. The detailed findings are reported in Section 4.1 and Section 4.2.
4.1. AHP Results and Elasticity Analysis
The weights of the criteria and sub-criteria derived from the AHP evaluation are presented in Figure 5. The “Data Availability and Quality (C2)” criterion emerges as the top priority, with a weight of 71.3%, highlighting the central role of data-related aspects in the evaluation process. In contrast, the “Specificities and Objectives (C1)” criterion accounts for 28.7% of the total weight. At the sub-criterion level, within C2, the “Number of Units” sub-criterion is the most influential, followed by the “Nature of the Data” and “Available Variables.” For C1, the “Communication” sub-criterion carries more weight than “Multi-output Considerations.” Overall, these results emphasize the importance of robust and well-structured data, as well as effective communication, in guiding the selection of an appropriate TFP method.
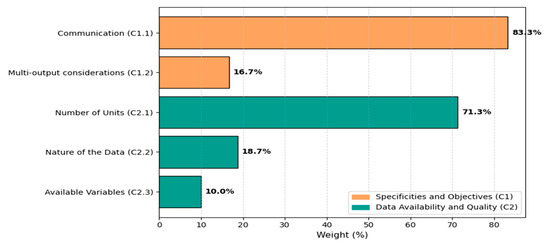
Figure 5.
Results of AHP related to criteria and sub-criteria weights.
Figure 6 presents the aggregate scores of the three TFP methods, along with their individual performances for each sub-criterion. The Solow Residual shows a marked advantage in the “number of units” sub-criterion, indicating its suitability for small datasets, although its performance is weaker in terms of data diversity and communication. The Divisia Index exhibits a balanced profile, excelling in the “nature of data” and “type of available variables” sub-criteria, which reflects its adaptability to diverse datasets when reliable time-series data are available. The Törnqvist–Theil Index achieves the highest score in “multi-output considerations” and performs strongly in “communication,” highlighting its suitability for aggregating multiple outputs while maintaining interpretability.
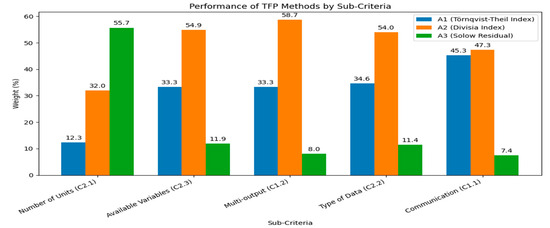
Figure 6.
Aggregate and sub-criterion scores of alternatives.
Overall, the results reveal complementary strengths: the Solow Residual for limited datasets, the Divisia Index for versatile data handling, and the Törnqvist–Theil Index for robust multi-output analysis with clear communication. Table 5 summarizes these findings, presenting the aggregate scores and rankings of the three methods. The Divisia Index ranks first, confirming its theoretical robustness and flexibility. The Törnqvist–Theil Index ranks second, emphasizing its strength in multi-output contexts. The Solow Residual ranks third, reflecting its more limited applicability in complex productivity assessments. Based on these results, the Divisia Index and Törnqvist–Theil Index are retained for subsequent analyses, as they provide the best balance between methodological rigor and practical relevance according to the AHP evaluation.
Table 5.
Aggregate scores and ranking results for TFP methods.
The consistency of expert judgments was assessed for all sub-criterion matrices using and , as previously defined. Table 6 summarizes the results for each set of sub-criteria.
Table 6.
CI and CR for sub-criteria matrices.
All values are below the recommended threshold of 0.10, indicating that the expert judgments were coherent and reliable. These results confirm the robustness of the weighting process applied in the AHP evaluation. To further support the reliability of the analysis, the consistency ratios for all pairwise comparison matrices were examined, and all values remained below 0.10 (see Appendix A, Table A2). Additionally, a sample pairwise comparison matrix illustrating the structure applied to all criteria and sub-criteria is provided in Appendix A, Table A1. Together, these elements demonstrate the internal coherence of the AHP evaluation and the soundness of the derived weights.
In summary, the AHP analysis results confirm that each TFP method offers specific strengths, yet the Divisia Index ranks highest overall for its balanced combination of adaptability, robust data processing, and interpretability. The Törnqvist–Theil Index follows, particularly suited to multi-output contexts, while the Solow Residual remains more appropriate for small or simple datasets. These results provide a clear, evidence-based foundation for selecting the most suitable TFP calculation methods in subsequent analyses.
To assess the robustness of the AHP-based ranking of TFP methods, an elasticity analysis was conducted by perturbing the weights of the main criteria. Variations of ±10% were selected following standard practice in AHP-based studies to capture moderate uncertainty in expert judgments, while ±20% perturbations were also applied to explore more extreme scenarios. Previous studies have shown that weight perturbations can significantly affect ranking outcomes in AHP and highlighted the importance of analyzing their impact on uncertainty and dispersion in results. The exact numerical variations are presented in Table 7, while Figure 7 visualizes the relative impact of each criterion, allowing for a quick and intuitive comparison of sensitivity across the TFP methods.
Table 7.
Elasticity analysis of AHP-derived scores for TFP methods.
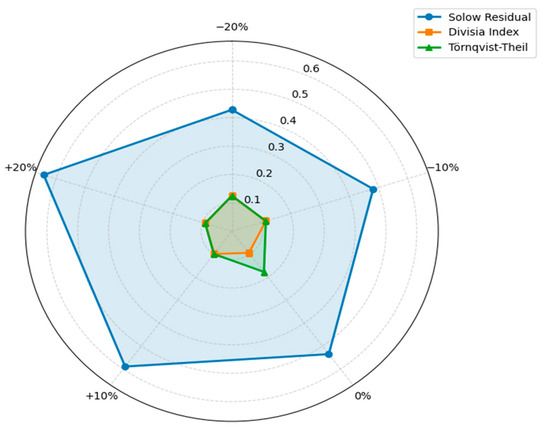
Figure 7.
Sensitivity analysis of TFP methods under AHP weight perturbations.
Applying these perturbations, the Divisia Index remained highly stable, the Törnqvist–Theil Index exhibited moderate sensitivity, and the Solow Residual was the most sensitive to changes in criteria weights, confirming the robustness of the ranking obtained from the base-case AHP scores.
4.2. TFP Computation Results and Sensitivity Analysis
The results are summarized in Table 8 and Table 9, which present the monetized input indicators () in TND and their associated weights () for 2015 and 2020, as well as the monetized output indicators () with their respective weights (). The TFP calculation is based on data for 2015 and 2020 only, as no intermediate annual data were available. The year 2015 was used as the reference year for computing productivity changes, and the analysis evaluates the single-period variation between 2015 and 2020 using ratio-based, Divisia, and Törnqvist–Theil indices. These values are expressed in TND, as detailed in the previously described shadow price-based valuation process, ensuring consistency and comparability across indicators. Together, these tables constitute the final dataset for TFP calculation, with all components harmonized for integration into the defined formulas.
Table 8.
Weights of input KPIs valued in TND (2015–2020).
Table 9.
Weights of output KPIs valued in TND (2015–2020).
As a preliminary step, before applying the selected TFP index methods, a traditional ratio-based TFP was computed using aggregated, monetized inputs and outputs for 2015 and 2020. The resulting TFP declined sharply from 0.232 in 2015 to 0.094 in 2020, corresponding to a −59.54% change. This significant drop indicates a decrease in productivity, reflecting inefficiencies in converting inputs into outputs over the study period. Although some physical productivity indicators improved, rising input costs, particularly for energy and labor, were the primary drivers of this decline. This ratio-based TFP thus serves as a baseline, emphasizing the need for more flexible, index-based methods that can better capture structural changes in the input–output relationship.
To address this, TFP was further calculated using the Törnqvist–Theil and Divisia indexes, which were identified as the most suitable methods through the AHP analysis. Both approaches incorporate the economic value and relative weight of each KPI, allowing for a more nuanced and accurate assessment of productivity changes.
Using the Divisia Index, the logarithmic variation in TFP between 2015 and 2020 is:
This corresponds to a productivity of −54.26%, closely matching the ratio-based result and thus confirming the observed efficiency decline.
In contrast, the Törnqvist–Theil Index yields a less pronounced reduction:
This represents a relative decrease of −23.70%, suggesting that although productivity declined, the magnitude of the reduction varies depending on the index method used. Nevertheless, all three approaches consistently indicate a downward trend in TFP over the five-year period.
To further assess the impact of data uncertainty on TFP outcomes, a sensitivity analysis was performed by varying shadow prices by ±10% and ±20% for all input and output KPIs. The recalculated TFP scores for each method are illustrated in Figure 8, which presents the results using a radar chart. This visualization highlights the variations in absolute scores and confirms the consistency of the relative rankings across different shadow price assumptions.
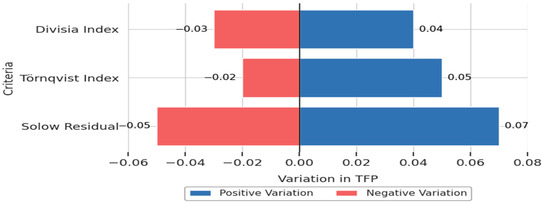
Figure 8.
Sensitivity of TFP Scores to Shadow Price Variations.
The results indicate that the relative ranking of the TFP computation methods remained stable under both ±10% and ±20% variations in shadow prices. This stability demonstrates the robustness of the findings despite moderate uncertainties in data valuation. The analysis provides a critical examination of how shadow pricing uncertainty influences TFP outcomes, thereby enhancing the transparency and credibility of the methodological results.
5. Discussion
This section interprets the findings from the AHP and TFP analyses. The detailed findings are reported in Section 5.1, Section 5.2 and Section 5.3.
5.1. AHP Insights
The AHP analysis indicates that the availability and quality of data dominate the evaluation process, carrying a weight of 71.3%. This result is particularly relevant in the Tunisian context, where agricultural data are often fragmented, incomplete, or outdated, posing challenges for effective policymaking. The findings confirm that the selection of a TFP method must be guided by the characteristics of the dataset and the specific analytical objectives [30,37]. In other words, even the most sophisticated productivity methods cannot provide reliable evidence without high-quality and representative data. Similar concerns are highlighted in previous studies [23,26], which emphasize that data representativeness forms the foundation of meaningful TFP analysis.
At the sub-criterion level, the number of units has the greatest influence (71.34%), reflecting policymakers’ sensitivity to sample size and coverage. Other sub-criteria, including type of data (18.66%) and availability of variables (10%), further underscore the importance of dataset structure and representativeness, particularly given Tunisia’s landscape of small and dispersed farms. Additionally, the high weight attributed to communication (83.3%) illustrates policymakers’ preference for methods that produce interpretable and actionable results. These priorities align with the performance of the three TFP methods: the Solow Residual performs best for small datasets, the Divisia Index demonstrates adaptability to varied data types, and the Törnqvist–Theil Index excels in multi-output scenarios. Overall, the AHP results emphasize that methodological choices must account not only for statistical and data requirements but also for institutional needs and policy communication [37,59].
5.2. Discussion of TFP Results
The TFP computations for the period 2015–2020 reveal a consistent decline across all indices, though the magnitude varies by method. The ratio-based TFP shows a pronounced drop of −59.54%, highlighting a marked reduction in efficiency when aggregating inputs and outputs into simple ratios. The Divisia Index also indicates a steep decline (−54.26%), reflecting its high sensitivity to changes in input prices, consistent with previous findings [24] showing that Divisia-based calculations tend to exaggerate productivity losses under inflationary conditions. In contrast, the Törnqvist–Theil Index reports a smaller decline (−23.7%), as its logarithmic averaging mitigates extreme fluctuations, enhancing robustness in multi-output contexts. This supports observations by [59], who noted the Törnqvist–Theil Index’s suitability for agricultural systems with multiple and heterogeneous outputs.
Overall, these results highlight the complementary strengths of the Divisia and Törnqvist–Theil indices: they balance methodological rigor, flexibility, and interpretability, while the Solow Residual remains most appropriate for smaller or simpler datasets. Figure 9 visually compares the three TFP indices, with 2015 as the reference year (base 100) and 2020 values scaled proportionally. This illustration reinforces that the perceived severity of productivity decline is strongly influenced by the chosen method, an insight crucial for policy analysis and recommendations.
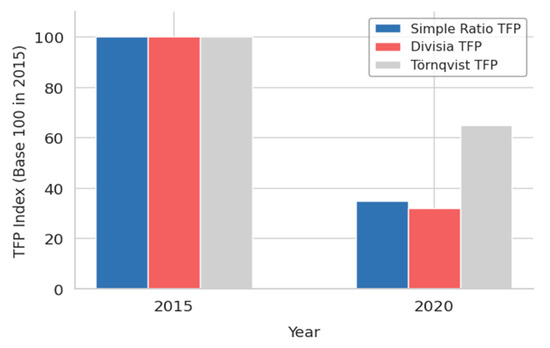
Figure 9.
Comparison of TFP Indices between 2015 and 2020.
Disaggregated input–output analysis clarifies the drivers of this decline. On the input side, energy consumption fell by 14%, but rising unit costs meant that efficiency gains were offset by inflationary pressures. Labor hours remained stable, yet labor costs increased significantly, revealing structural inefficiencies. On the output side, agricultural value added dropped by 42%, exerting the most substantial negative impact on TFP. Land utilization and water efficiency also decreased, despite modest improvements in yield per hectare and water stress. These mixed trends suggest that physical improvements alone are insufficient when cost dynamics and resource use remain inefficient. Such findings align with evidence from Mediterranean agriculture [24], where input price pressures can outweigh productivity gains, yet they contrast with experiences in Brazil, where technological advances supported sustained TFP growth [16]. This detailed input–output examination can be interpreted as a qualitative Solow-type decomposition of productivity change. The decline in TFP thus primarily reflects cost-side inefficiencies, especially in energy and labor, rather than a uniform deterioration in physical productivity. Such interpretation provides causal insight into the mechanisms behind the observed productivity losses and reinforces the analytical depth of Figure 9.
5.3. Contextual Interpretation of TFP Decline
The observed decline in TFP between 2015 and 2020 is primarily attributable to higher input costs, particularly for energy and labor, and a slowdown in regional investment, rather than structural policy shortcomings. Input–output variations highlight the contributions of each KPI to productivity change. External shocks, including the 2019–2020 COVID-19 disruption and short-term fluctuations in input prices, also affected agricultural performance across Tunisia. Comparison of the Divisia and Törnqvist–Theil indices confirms consistent productivity trajectories, with only minor divergences, reinforcing the robustness of the findings. These results provide a transparent and contextually grounded interpretation of TFP dynamics, demonstrating that the observed decline reflects both economic and operational factors rather than index-specific artifacts.
These results elucidate the drivers of productivity changes while illustrating the decision-support potential of the AHP–TFP framework. For instance, a policy reducing post-harvest losses through storage subsidies would increase effective yield per hectare; when incorporated via monetized KPIs and AHP weighting, this would enhance the overall sustainability index, demonstrating how policymakers can anticipate intervention impacts on productivity and resource efficiency. This contextual interpretation provides a basis for drawing both theoretical and practical implications discussed in the following subsection.
5.4. Implications, Validity, and Limitations
This section discusses the broader implications of the study, including theoretical and practical contributions, as well as considerations regarding validity and limitations. Together, these elements provide a comprehensive understanding of the study’s significance and scope.
5.4.1. Theoretical and Practical Implications
The joint interpretation of AHP and TFP results offers several important insights. First, the divergence between the Divisia and Törnqvist–Theil indices demonstrates that the choice of methodology directly influences policy conclusions: while one index suggests a moderate decline in productivity, the other indicates a more severe drop. This underscores the value of a transparent decision-making framework, such as AHP, which justifies method selection based on both analytical objectives and dataset characteristics [19]. Second, the consistent downward trend observed across all indices highlights that Tunisia’s agricultural policies have not effectively mitigated rising input costs and declining resource-use efficiency. The five-year period analyzed confirms this pattern, echoing previous studies [43] that reported persistent structural inefficiencies in the Tunisian agricultural sector.
This subsection integrates theoretical grounding and cross-country comparisons. Tunisia’s observed TFP decline (−59%) is contrasted with 23% in Morocco [24], highlighting the relative severity of efficiency losses. These findings are interpreted using the Resource-Based View (RBV) and institutional theory, linking structural inefficiencies to suboptimal resource allocation and institutional constraints. This discussion informs actionable policy recommendations, including targeted interventions for energy efficiency, labor productivity enhancement, capacity-building programs, and sustainable resource allocation.
5.4.2. Validity and Limitations
Several limitations and validity considerations should be acknowledged to ensure transparency. First, the analysis covers a relatively short period (2015–2020), which may limit the detection of long-term structural changes. Second, the use of shadow prices to monetize sustainability indicators introduces estimation uncertainty, although sensitivity analyses (±10% and ±20%) confirmed the robustness of the TFP rankings. Third, the absence of undesirable outputs (such as GHG emissions or environmental degradation indicators) restricts the comprehensiveness of sustainability assessment [60]. Potential measurement errors in administrative data could also affect results despite the cross-validation procedures implemented. Recognizing these factors strengthens the study’s methodological transparency and enhances confidence in its findings.
External validity is also discussed. Although calibrated for Tunisia, the adapted AHP–TFP framework can be transferred to other Mediterranean or Maghreb contexts, provided that local KPI sets and reliable datasets are available. This adaptability confirms the framework’s broader applicability for sustainability-oriented productivity assessments.
5.4.3. Future Research
Future research should extend the temporal scope to capture long-term structural trends and apply the adapted AHP–TFP framework in other Mediterranean and Maghreb countries for comparative insights. Incorporating a broader set of environmental and social indicators would further enhance comprehensiveness, guided by survey-based approaches for KPI development and structured, expert-informed frameworks [61,62]. Evaluating alternative multi-criteria decision-making methods, such as TOPSIS or PROMETHEE, could validate or refine the rankings obtained through AHP. Subsequent work should also be directly grounded in empirical findings, with potential extensions including the integration of DEA–AHP hybrid models to assess efficiency frontiers under stochastic conditions, expansion of temporal coverage with additional KPIs (e.g., biodiversity and soil quality), and the development of policy dashboards explicitly linked to TFP and sustainability metrics. These directions strengthen the methodological framework and enhance its practical relevance for informing policy and management decisions in Tunisian agriculture and comparable regional contexts.
Despite these constraints, the study’s contribution remains significant in both theoretical and applied terms. The AHP–TFP framework bridges the gap between productivity measurement and decision-making in the context of sustainable agriculture. It provides a transparent and adaptable methodology supporting diverse stakeholders, smallholders, cooperatives, and policymakers in designing evidence-based strategies for sustainable productivity. This dual contribution reinforces the study’s novelty and aligns with the journal’s standards for methodological rigor and policy relevance.
6. Conclusions and Perspectives
This paper proposed an integrated methodology based on the TFP index to evaluate the sustainability of AFSC, with a particular focus on the Tunisian context. The approach followed a sequential process, including the identification and understanding of strategic KPIs, the formulation of criteria and sub-criteria for selecting the most suitable TFP method, and the application of AHP to structure expert judgments and derive relative weights. This decision-making framework enabled the prioritization of TFP methods based on multiple dimensions, including interpretability, data availability, and analytical objectives. The empirical results show that the Divisia Index emerged as the most appropriate method for TFP assessment in this context. This choice is primarily justified by its theoretical consistency and its capacity to decompose productivity growth over time using continuous data. The application of the selected TFP method provided valuable insights into the sustainability performance of the regional agricultural system between 2015 and 2020, highlighting productivity trends as well as the influence of policy decisions. Beyond these empirical findings, the study contributes methodologically by offering a replicable framework that integrates expert-based judgments and multi-criteria decision-making tools. This approach is adaptable to other regions or sectors where sustainability evaluation requires balancing data constraints, interpretability, and policy relevance.
Future research can take several directions. First, policymakers can leverage the Divisia and Törnqvist–Theil indices to guide budget allocation, prioritize interventions, and monitor efficiency improvements. Second, targeted measures, such as investments in energy-efficient irrigation, labor productivity enhancement programs, and strategic subsidy reallocation, can mitigate structural inefficiencies. Third, applying multi-capital KPIs allows comprehensive sustainability monitoring, while regular TFP assessments provide evidence-based guidance for adaptive policy design. Finally, the framework can be extended to other regions or sectors, facilitating benchmarking, evaluation of alternative interventions, and support for data-driven decision-making.
Overall, this study contributes to a structured and evidence-based assessment of sustainability within agricultural systems, emphasizing the significance of context-sensitive, data-driven, and integrative methodological approaches. Implementing targeted policy measures, such as promoting energy-efficient irrigation technologies, strengthening labor capacity through training programs, and optimizing subsidy allocation, can mitigate existing structural inefficiencies in Tunisia’s agricultural sector. The results highlight the relevance of expert-informed and context-aware decision-making frameworks to effectively support sustainable agricultural development.
Supplementary Materials
The following supporting information can be downloaded at https://www.mdpi.com/article/10.3390/agriculture15222313/s1, Supporting Dataset Part 1: Expert Judgments for AHP, Part 2: Raw KPI Data (2015–2020) & Data Dictionary, Part 3: Data Processing Flowchart, and Part 4: Shadow Prices & Pseudo-Code.
Author Contributions
Conceptualization, A.F. and S.C.; methodology, A.F., L.S. and S.C.; software, A.F.; validation, S.C., L.S. and A.F.; formal analysis, A.F. and S.C.; investigation, A.F.; resources, S.C.; data curation, A.F.; writing—original draft preparation, A.F.; writing—review and editing, S.C., A.F. and L.S.; visualization, A.M.; supervision, A.M.; project administration, L.S.; funding acquisition, L.S. All authors have read and agreed to the published version of the manuscript.
Funding
This work is part of the research project entitled ‘Smart Models for Agri-food Local Value Chain based on Digital Technologies for Enabling COVID-19 Resilience and Sustainability’ (SMALLDERS), funded by the PRIMA Program—Section 2 Call multi-topics 2021, through the Ministry of Higher Education and Scientific Research (Tunisia) and covered by the ANPR—SMALLDERS Project, Agence Nationale de Promotion de la Recherche Scientifique, Tunis, Tunisia.
Institutional Review Board Statement
Ethical review and approval were waived in accordance with Tunisian academic practice and national regulations (Organic Act No. 63 of 27 July 2004, Articles 66–68; Organic Law No. 42 of 30 May 2017), which exempt non-interventional studies without sensitive personal data from formal IRB approval; verbal consent was obtained from all participants.
Data Availability Statement
The raw data supporting the conclusions of this article, as well as the associated pseudo-code, are provided as Supplementary Materials with the revised manuscript.
Conflicts of Interest
The authors declare no conflicts of interest.
Abbreviations
The following abbreviations are used in this manuscript:
| AFSC | Agri-Food Supply Chains |
| TFP | Total Factor Productivity |
| AHP | Analytical Hierarchy Process |
| KPIs | Key Performance Indicators |
| DMU | Decision-Making Unit |
| RCAD | Regional Commission for Agricultural Development |
| TND | Tunisian dinars |
| CI | Consistency Index |
| CR | Consistency Ratio |
Appendix A
Appendix A.1
Table A1.
Sample Pairwise Comparison Matrix for Main Criteria.
Table A1.
Sample Pairwise Comparison Matrix for Main Criteria.
| Criteria | Specificities and Objectives | Availability and Quality of Data |
|---|---|---|
| Specificities and Objectives | 1 | 1/3 |
| Availability and Quality of Data | 3 | 1 |
Normalized Weights:
| Criteria | Normalized Weight |
| Specificities and Objectives | 0.25 |
| Availability and Quality of Data | 0.75 |
| Note: This table illustrates the format and typical values of a main criteria matrix used in the AHP. Full pairwise matrices for sub-criteria and alternatives are available in the Supporting Dataset—Expert Judgments and Raw KPIs. | |
Appendix A.2
Table A2.
Consistency Ratios (CRs) for Each Matrix.
Table A2.
Consistency Ratios (CRs) for Each Matrix.
| Matrix | CR | Acceptable (<0.10) |
|---|---|---|
| Main Criteria | 0.06 | Yes |
| Availability and Quality of Data | 0.04 | Yes |
| Specificities and Objectives | 0.03 | Yes |
| Number of Units | 0.05 | Yes |
| Type of Data | 0.02 | Yes |
| Available Variables | 0.07 | Yes |
| Communication | 0.05 | Yes |
| Multi-output | 0.03 | Yes |
Note: Each matrix corresponds to a main or sub-criterion. All CR values are below 0.10, confirming that expert judgments are consistent and reliable for deriving AHP weights.
References
- Boerger, V.; Bojic, D.; Bosc, P.; Clark, M.; Dale, D.; England, M.; Hoogeveen, J.; Koo-Oshima, S.; Moreno, P.M.; Muchoney, D.; et al. The State of the World’s Land and Water Resources for Food and Agriculture–Systems at Breaking Point; Synthesis Report; Food and Agriculture Organization: Rome, Italy, 2021. [Google Scholar] [CrossRef]
- Pretty, J.; Benton, T.G.; Bharucha, Z.P.; Dicks, L.V.; Flora, C.B.; Godfray, H.C.J.; Goulson, D.; Hartley, S.; Lampkin, N.; Morris, C.; et al. Global assessment of agricultural system redesign for sustainable intensification. Nat. Sustain. 2018, 1, 441–446. [Google Scholar] [CrossRef]
- Sachs, J.D.; Schmidt-Traub, G.; Mazzucato, M.; Messner, D.; Nakicenovic, N.; Rockström, J. Six transformations to achieve the sustainable development goals. Nat. Sustain. 2019, 2, 805–814. [Google Scholar] [CrossRef]
- Sickles, R.C.; Zelenyuk, V. Measurement of Productivity and Efficiency; Cambridge University Press: Cambridge, UK, 2019. [Google Scholar]
- Coelli, T.J.; Rao, D.P. Total factor productivity growth in agriculture: A Malmquist index analysis of 93 countries, 1980–2000. Agric. Econ. 2005, 32, 115–134. [Google Scholar] [CrossRef]
- Latruffe, L. Competitiveness, productivity and efficiency in the agricultural and agri-food sectors. In Handbook of Agricultural Economics, 2nd ed.; Organisation for Economic Co-operation and Development: Paris, France, 2010; Volume 3, pp. 154–196. [Google Scholar] [CrossRef]
- Chavas, J.P.; Chambers, R.G.; Pope, R.D. Production economics and farm management: A century of contributions. Am. J. Agric. Econ. 2010, 92, 356–375. [Google Scholar] [CrossRef]
- Afzal, H.; Hassan, S.; Bashir, M.K.; Ali, A. Estimation of total factor productivity growth of agriculture sector in Pakistan: Growth, yield and economic analysis of dry-seeded basmati rice. Sarhad J. Agric. 2021, 37, 1298–1305. [Google Scholar] [CrossRef]
- Meja, M.F.; Alemu, B.A.; Shete, M. Total factor productivity of major crops in Southern Ethiopia: A disaggregated analysis of the growth components. Sustainability 2021, 13, 3388. [Google Scholar] [CrossRef]
- Liu, J.; Dong, C.; Liu, S.; Rahman, S.; Sriboonchitta, S. Sources of total-factor productivity and efficiency changes in China’s agriculture. Agriculture 2020, 10, 279. [Google Scholar] [CrossRef]
- Wang, X.; Yang, C.; Qiao, C. Agricultural service trade and green development: A perspective based on China’s agricultural total factor productivity. Sustainability 2024, 16, 7963. [Google Scholar] [CrossRef]
- Zhou, R.; Zhang, Y. Measurement of urban green total factor productivity and analysis of its temporal and spatial evolution in China. Sustainability 2023, 15, 9435. [Google Scholar] [CrossRef]
- Yang, L.; Guan, Z.; Chen, S.; He, Z. Re-measurement and influencing factors of agricultural eco-efficiency under the ‘dual carbon’ target in China. Heliyon 2024, 10, e24944. [Google Scholar] [CrossRef]
- Luan, X.; Yasmeen, R.; Shah, W.U.H. Assessing energy efficiency, regional disparities in production technology, and factors influencing total factor energy productivity change in the agricultural sector of China. Heliyon 2024, 10, e35043. [Google Scholar] [CrossRef]
- Fuglie, K. Accounting for growth in global agriculture. Bio-Based Appl. Econ. 2015, 4, 201–234. [Google Scholar] [CrossRef]
- Avila, A.F.D.; Evenson, R.E. Total factor productivity growth in agriculture: The role of technological capital. In Handbook of Agricultural Economics, 2nd ed.; Organisation for Economic Co-operation and Development: Paris, France, 2010; Volume 4, pp. 3769–3822. [Google Scholar] [CrossRef]
- Kamarudin, O.; Amir Hussin, B. The total factor productivity in strategic food crops industry of Malaysia. Asian J. Agric. Rural Dev. 2015, 5, 124–136. [Google Scholar] [CrossRef]
- Chen, Y.; Miao, J.; Zhu, Z. Measuring green total factor productivity of China’s agricultural sector: A three-stage SBM-DEA model with non-point source pollution and CO2 emissions. J. Clean. Prod. 2021, 318, 128543. [Google Scholar] [CrossRef]
- Saaty, T.L. The Analytic Hierarchy Process: Planning, Priority Setting, Resource Allocation; McGraw-Hill International: London, UK, 1980. [Google Scholar]
- Saaty, T.L. Decision making with the analytic hierarchy process. Int. J. Serv. Sci. 2008, 1, 83–98. [Google Scholar] [CrossRef]
- Ishizaka, A.; Labib, A. Review of the main developments in the analytic hierarchy process. Expert Syst. Appl. 2011, 38, 14336–14345. [Google Scholar] [CrossRef]
- Diewert, W.E. The measurement of aggregate total factor productivity. In Handbook of Econometrics; Elsevier: Amsterdam, The Netherlands, 2008; Volume 6. [Google Scholar]
- Organisation for Economic Co-operation and Development (OECD). TFP Growth Accounting Framework and Guidelines; Technical Report; Organisation for Economic Co-operation and Development (OECD): Paris, France, 2018. [Google Scholar]
- Bureau, J.C.; Antón, J. OECD Food, Agriculture and Fisheries Papers: Agricultural Total Factor Productivity and the Environment; Organisation for Economic Co-operation and Development (OECD): Paris, France, 2022; Available online: https://coilink.org/20.500.12592/xjw647 (accessed on 16 September 2025).
- Stepenuck, K.F.; Green, L. Individual- and Community-Level Impacts of Volunteer Environmental Monitoring: A Synthesis of Peer-Reviewed Literature. Ecol. Soc. 2015, 20, 19. [Google Scholar] [CrossRef]
- Coelli, T.J.; Rao, D.S.P.; O’Donnell, C.J.; Battese, G.E. An Introduction to Efficiency and Productivity Analysis, 2nd ed.; Springer: New York, NY, USA, 2005. [Google Scholar] [CrossRef]
- Organisation for Economic Co-Operation and Development (OECD). Measuring Productivity, Measurement of Aggregate and Industry-Level Productivity Growth; OECD: Paris, France, 2001. [Google Scholar] [CrossRef]
- Mekouar, M.A. Food and Agriculture Organization of the United Nations (FAO). Yearb. Int. Environ. Law 2023, 29, 448–468. [Google Scholar] [CrossRef]
- Kuosmanen, T.; Post, T.; Sipiläinen, T. Shadow price approach to total factor productivity measurement: With an application to Finnish grass-silage production. J. Prod. Anal. 2004, 22, 95–121. [Google Scholar] [CrossRef]
- Solow, R.M. Technical change and the aggregate production function. Rev. Econ. Stat. 1957, 39, 312–320. [Google Scholar] [CrossRef]
- Divisia, F. L’indice monétaire et la théorie de la monnaie. Rev. Écon. Polit. 1925, 39, 842–1151. [Google Scholar]
- Törnqvist-Theil, L. The Bank of Finland’s Consumption Price Index. Bank. Finl. Mon. Bull. 1936, 10, 27. [Google Scholar]
- O’Donnell, C.J. Measuring and decomposing agricultural productivity and profitability change. Aust. J. Agric. Resour. Econ. 2010, 54, 527–560. [Google Scholar] [CrossRef]
- Spolador, H.F.S.; Danelon, A.F. New evidence of the driving forces behind Brazil’s agricultural TFP growth: A stochastic frontier analysis with climatic variables and land suitability index. Aust. J. Agric. Resour. Econ. 2024, 68, 366–385. [Google Scholar] [CrossRef]
- Wimmer, S.; Dakpo, K.H. Components of agricultural productivity change: Replication of US evidence and extension to the EU. Appl. Econ. Perspect. Policy 2023, 45, 1332–1355. [Google Scholar] [CrossRef]
- Fekih, A.; Chabouh, S.; Sidhom, L.; Mami, A.K. An overview of total factor productivity approaches for sustainable smallholders in agri-food supply chains. In Proceedings of the IEEE 16th International Conference on Logistics and Supply Chain Management—LOGISTIQUA 2025, Casablanca, Morocco, 28–30 May 2025. [Google Scholar] [CrossRef]
- Hulten, C.R. Total factor productivity: A short biography. In New Developments in Productivity Analysis; University of Chicago Press: Chicago, IL, USA, 2001; pp. 1–54. Available online: http://www.nber.org/system/files/chapters/c10122/c10122.pdf (accessed on 15 September 2025).
- Diewert, W.E. Fisher ideal output, input, and productivity indexes revisited. J. Prod. Anal. 1992, 3, 211–248. [Google Scholar] [CrossRef]
- Lovell, C.K. The decomposition of Malmquist productivity indexes. J. Prod. Anal. 2003, 20, 437–458. [Google Scholar] [CrossRef]
- Caves, D.W.; Christensen, L.R.; Diewert, W.E. The economic theory of index numbers and the measurement of input, output, and productivity. Econometrica 1982, 50, 1393–1414. [Google Scholar] [CrossRef]
- FAO. Profil Pays: Tunisie—Organisation des Nations Unies Pour l’Alimentation et l’Agriculture. Available online: https://www.fao.org/tunisie/en (accessed on 4 April 2025).
- Chabouh, S.; Sidhom, L.; Zammiti, A.; Mami, A. Assessing Agri-Food Supply Chain Multi-Capital Sustainability Using Simple Multi-Attribute Rating Technique: The Policy Maker Case Study. In Proceedings of the 10th International Food Operations & Processing Simulation Workshop, Tenerife, Spain, 18–20 September 2024. [Google Scholar] [CrossRef]
- Amamou, A.; Chabouh, S.; Sidhom, L.; Zouari, A.; Mami, A. Agri-Food Supply Chain Sustainability Indicators from a Multi-Capital Perspective: A Systematic Review. Sustainability 2025, 17, 4174. [Google Scholar] [CrossRef]
- Fekih, A.; Chabouh, S.; Sidhom, L.; Zouari, A.; Mami, A. A Multi-Expert FQFD and TRIZ Framework for Prioritizing Multi-Capital Sustainability KPIs: A Smallholder Case Study. Sustainability 2025, 17, 8277. [Google Scholar] [CrossRef]
- Molden, D.; Oweis, T.; Steduto, P.; Bindraban, P.; Hanjra, M.A.; Kijne, J. Improving agricultural water productivity: Between optimism and caution. Agric. Water Manag. 2010, 97, 528–535. [Google Scholar] [CrossRef]
- Governorate of Nabeul. Stimulus Program for Boosting the Investment and Modernization of Farms. Available online: https://www.nabeul.gov.tn/en/stimulus-program-for-boosting-the-investment-and-the-modernization-of-farms/ (accessed on 1 September 2025).
- International Labour Organization. Rural Employment and Decent Work; ILO: Geneva, Switzerland, 2010; Available online: http://openknowledge.fao.org/server/api/core/bitstreams/72070c29-47d6-47ef-8059-e78168c2fb69/content (accessed on 22 August 2025).
- International Energy Agency. Energy Consumption in African Agriculture [IEA Statistics]; IEA: Paris, France, 2020. [Google Scholar]
- Agence Nationale pour la Maîtrise de l’Énergie. Energy Efficiency in Agriculture [Rapport ANME]; ANME: Tunis, Tunisia, 2019. [Google Scholar]
- Abokyi, E.; Strijker, D.; Asiedu, K.F.; Daams, M.N. The Impact of Output Price Support on Smallholder Farmers’ Income: Evidence from Maize Farmers in Ghana. Heliyon 2020, 6, e04827. [Google Scholar] [CrossRef] [PubMed]
- Ministère de l’Agriculture et des Ressources Hydrauliques. Agricultural Extension Programs [Policy Brief MAER]; Ministère de l’Agriculture et des Ressources Hydrauliques: Tunis, Tunisia, 2021. [Google Scholar]
- International Labor Organization. Labor Market Trends in Tunisia; ILO Reports; ILO: Geneva, Switzerland, 2020. [Google Scholar]
- Institut National de la Statistique. Annual Labor Survey; INS Publications; INS: Montrouge, France, 2021. [Google Scholar]
- African Development Bank. Employment Trends in North Africa; AfDB Publications; African Development Bank: Abidjan, Côte d’Ivoire, 2019. [Google Scholar]
- Ministère de l’Emploi et de la Formation Professionnelle. Employment in the Agricultural Sector; MTESS Annual Report; Ministère de l’Emploi et de la Formation Professionnelle: Tunis, Tunisia, 2020. [Google Scholar]
- Direction Générale des Aménagements et des Constructions Hydrauliques (DGACH). Land Use Statistics; Ministry of Agriculture: Tunis, Tunisia, 2019. [Google Scholar]
- Observatoire National de l’Agriculture. Agricultural Productivity Indicators; ONAGRI Bulletin; Observatoire National de l’Agriculture: Tunis, Tunisia, 2020. [Google Scholar]
- Global Water Partnership-Mediterranean. Water Stress Indicators in North Africa [GWP Technical Report]; Global Water Partnership-Mediterranean: Stockholm, Sweden, 2021. [Google Scholar]
- Ball, V.E. Output, input, and productivity measurement in US agriculture 1948–1979. Am. J. Agric. Econ. 1985, 67, 475–486. [Google Scholar] [CrossRef]
- OECD. Environmental Performance of Agriculture in OECD Countries: Key Trends and Insights; OECD Publishing: Paris, France, 2025. [Google Scholar] [CrossRef]
- Eliseu, E.E.; Lima, T.M.; Gaspar, P.D. A KPI-Based Framework for Evaluating Sustainable Agricultural Practices in Southern Angola. Sustainability 2025, 17, 7019. [Google Scholar] [CrossRef]
- Alonso-Martínez, D.; Jiménez-Parra, B.; Cabeza-García, L. Theoretical Framework to Foster and Assess Sustainable Agriculture Practices: Drivers and Key Performance Indicators. Environ. Sustain. Indic. 2024, 23, 100434. [Google Scholar] [CrossRef]
Disclaimer/Publisher’s Note: The statements, opinions and data contained in all publications are solely those of the individual author(s) and contributor(s) and not of MDPI and/or the editor(s). MDPI and/or the editor(s) disclaim responsibility for any injury to people or property resulting from any ideas, methods, instructions or products referred to in the content. |
© 2025 by the authors. Licensee MDPI, Basel, Switzerland. This article is an open access article distributed under the terms and conditions of the Creative Commons Attribution (CC BY) license (https://creativecommons.org/licenses/by/4.0/).