Article

DEM-CFD Simulation of Organic–Inorganic Fertiliser Mixing-Spreading: Optimizing Inorganic Fertiliser Placement for Uniformity

1
College of Engineering, Nanjing Agricultural University, Nanjing 210031, China
2
Key Laboratory of Intelligent Agricultural Equipment of Jiangsu Province, Nanjing 210031, China
3
College of Intelligent Manufacturing and Equipment, Jiangmen Polytechnic, Jiangmen 529090, China
*
Author to whom correspondence should be addressed.
Agriculture 2025, 15(21), 2256; https://doi.org/10.3390/agriculture15212256
Submission received: 24 September 2025 / Revised: 17 October 2025 / Accepted: 23 October 2025 / Published: 29 October 2025
(This article belongs to the Section Agricultural Technology)

Abstract

Organic–inorganic compound fertilizer application technology is a key technology for chemical fertilizer efficiency improvement, and stable grain yield increase. However, current agricultural machinery is unable to achieve uniform application of both organic and inorganic fertilisers. This study has compared two modeling methods and optimally selected the EDEM-Fluent coupled method. It aims to investigate the mechanism by which four factors—namely inorganic fertilizer drop location (Polar angle: −80° to 80°, polar radius: 60 mm to 180 mm), organic fertilizer flow rate (875–3500 g·s−1), inorganic fertilizer proportion (10–50%), and fertilizer spreading disc rotational speed (300–700 r·min−1)—influence inorganic fertilizer uniformity. A Box–Behnken test was designed with the pole angle and pole diameter of the drop location, organic fertiliser flow rate, spreading disc rotational speed, and coefficient of variation in the uniformity of the inorganic fertilisers as indexes. The Box–Behnken test divided the fertiliser drop location into left and right parts and established a mathematical model of fertiliser drop location, rotational speed, and organic fertiliser flow rate. Finally, the predictive performance of the model was verified in the field by testing four scenarios: low speed–low flow rate, low speed–high flow rate, high speed–low flow rate, and high speed–high flow rate. The root mean square error (RMSE) between the EDEM-Fluent coupled test and the bench test is 1.53, which is better than the RMSE (2.55) between the EDEM test and the bench test. Before optimization, the coefficients of variationof inorganic fertilizer (ICV) under four operating conditions were 28.93%, 32.43%, 38.17%, and 29.32% respectively. After optimization, the corresponding values were 19.34%, 23.78%, 21.45%, and 23.10% respectively. Compared with the pre-optimization results, the organic fertilizer coefficient of variation (OCV) remained stable, while the inorganic fertilizer coefficient of variation (ICV) decreased by an average of 10.29%. This study greatly improved the uniformity of inorganic fertiliser in the organic–inorganic spreader and provides a basis for subsequent intelligent spreaders.

1. Introduction

Organic–inorganic mixing can reduce the overuse of chemical fertilizers, solve surface water pollution, and improve soil properties [1,2,3]. Agricultural machinery is essential for applying mixed organic and inorganic fertilizers. Such machinery must meet the requirements of controlling the flow rates of organic and inorganic fertilizers [4], controlling the mixing ratio [5], controlling the fertilization width [6], and ensuring uniformity [7].
In terms of flow and proportion control. The method of mixing before spreading the fertiliser may cause a bias of granules and powders; therefore, existing spreaders use organic and inorganic fertilisers in separate fertiliser tanks, control the flow rate separately, and then mix them on the spreading discs. Currently, the regulation of organic fertiliser flow typically relies on feedback from the ground wheel speed to modulate the discharge chain plate [8] or churning mechanism [9,10], thereby controlling the discharge of organic fertiliser. Similarly, the management of inorganic fertilisers involves the utilisation of data from ground wheels or speed sensors to adjust the rotational velocity of the chute wheel [11,12]. Although some systems incorporate sophisticated control algorithms, such as PID and compensation algorithms [13,14], for precise control over the discharge of inorganic fertilisers, whether the stability of the supplied quantities of fertilisers translates into a uniform distribution on the ground remains unclear.
Improving uniformity is a key objective in fertilizer spreader research. The mechanism of mechanical–fertiliser interaction [15,16] should be investigated, and based on the findings, the structural parameters should be optimised [17,18]. For inorganic fertilizer spreading, Kömekçi et al. [15] optimized the structural parameters of dual-disc fertilizer spreaders, enabling the relatively uniform spreading of urea and compound fertilizers; Zhou et al. [19] designed a dual-channel compound fertilizer spreading device and optimized the blade deflection angle and blade inclination angle using the discrete element method (DEM); Sharipov et al. [20] by utilizing a total station prism and an IMU (Inertial Measurement Unit) sensor, found that optimizing the disc tilt angle allows the spreader to adapt to sloped terrain, avoiding local over-fertilization or under-fertilization; and Bivainis et al. [21] compared two advanced fertilizer spreaders, the Amazone ZA-M-1001 and Amazone ZA-M-1201, and demonstrated that adjusting blade length and deflection angle can effectively improve the uniformity of granular organic fertilizer. For organic fertilizer spreading, Xu et al. [16] applied the DEM to design and optimize a crushing mechanism for a type of organic fertilizer, enhancing its adaptability to lumpy organic fertilizer, while Xie et al. [22] placed two discs at an incline to achieve the lateral spreading of organic fertilizer. However, few studies have been reported on the simultaneous and uniform spreading of mixed organic–inorganic fertilizers.
The uniform spreading of mixed fertilizers is complex: the entire spreading system transforms from a mechanical-fertilizer interaction system to a mechanical-inorganic fertilizer-organic fertilizer interaction system. Inorganic fertilizers are subject to the adhesion and coating effects of organic fertilizers, which further complicates the action mechanism. However, this is not an unsolvable problem. Through theoretical analysis and experiments, S. Villette et al. [23,24] and Jiang et al. [25] found that adjusting the fertilizer drop location can modify the chemical fertilizer distribution, thereby improving uniformity. Therefore, this study also aims to improve uniformity by optimizing the drop location of inorganic fertilizers, but the influence of organic fertilizers should also be considered in this system.
In terms of research methods, studies on fertilizer spreading devices typically use the discrete element method (DEM) to simulate particle movement; this method saves time and financial costs in research and development but has certain limitations. Zhou et al. [19] and Fan et al. [26,27] respectively studied inorganic fertilizers and organic fertilizers using the DEM, and both noted in the model validation section that since the DEM cannot account for air resistance, there is a significant discrepancy between the simulated fertilizer distribution and actual conditions, restricting the method to only quantitative analysis. In recent years, the developed coupled simulation technology of EDEM and Fluent can simulate the resistance exerted on particles in the air [28], which is expected to further improve the accuracy of simulations.
This study focused on optimising the inorganic fertiliser drop location to adapt to different inorganic fertiliser percentages, organic fertiliser flow rates, and spreading disc speeds. We hypothesize that adjusting the inorganic fertiliser drop location can effectively reduce the coefficient of variation (CV) of inorganic fertiliser under varying operating conditions. Using a coupled discrete element method–computational fluid dynamics (DEM-CFD) simulation approach, the impacts of four distinct variables—the flow rate of organic fertiliser, percentage of inorganic fertiliser, rotational velocity of the fertiliser-spreading disc, and location of inorganic fertiliser deposition—on the coefficient of variation (CV) associated with inorganic fertiliser were investigated. Then, a location–flow–rotational speed-controlled CV model of inorganic fertiliser uniformity was established through the Box–Behnken test. It is expected that based on this model, the prediction of optimal fertilizer drop location coordinates under different operating conditions will be completed.

2. Materials and Methods

2.1. Structure and Principles of Inorganic and Organic Fertiliser Spreader

The organic–inorganic fertiliser spreader disperses organic and inorganic fertilisers simultaneously (Figure 1a). The organic and inorganic fertilisers are preloaded into their respective fertiliser compartments. A chain conveyor plate is installed at the bottom of the organic fertiliser compartment to facilitate the transportation of the organic fertiliser through the rotational movement of the plate. The discharge volume is regulated by adjusting the rotational speed of the chain conveyor plate and aperture of the fertiliser compartment door. This regulation, in conjunction with the speed of the vehicle, allows for precise control over the quantity of organic fertiliser being spread. The lower part of the inorganic fertiliser tank is equipped with a grooved wheel fertiliser discharger powered by a motor, whose speed can be controlled in combination with the speed of the vehicle to regulate the flow of inorganic fertiliser. The location of the inorganic fertiliser drop can be adjusted using the adjustment device, horizontally through the bolt holes and vertically through the wire rail (Figure 1b). After discharge, both the organic and inorganic fertilisers fall onto the fertiliser spreading disc, and the periphery of the fertiliser spreading disc is arranged with a guard plate so that the direction of fertiliser spreading can be controlled.

2.2. Analysis of the Movement of Particles on Disc

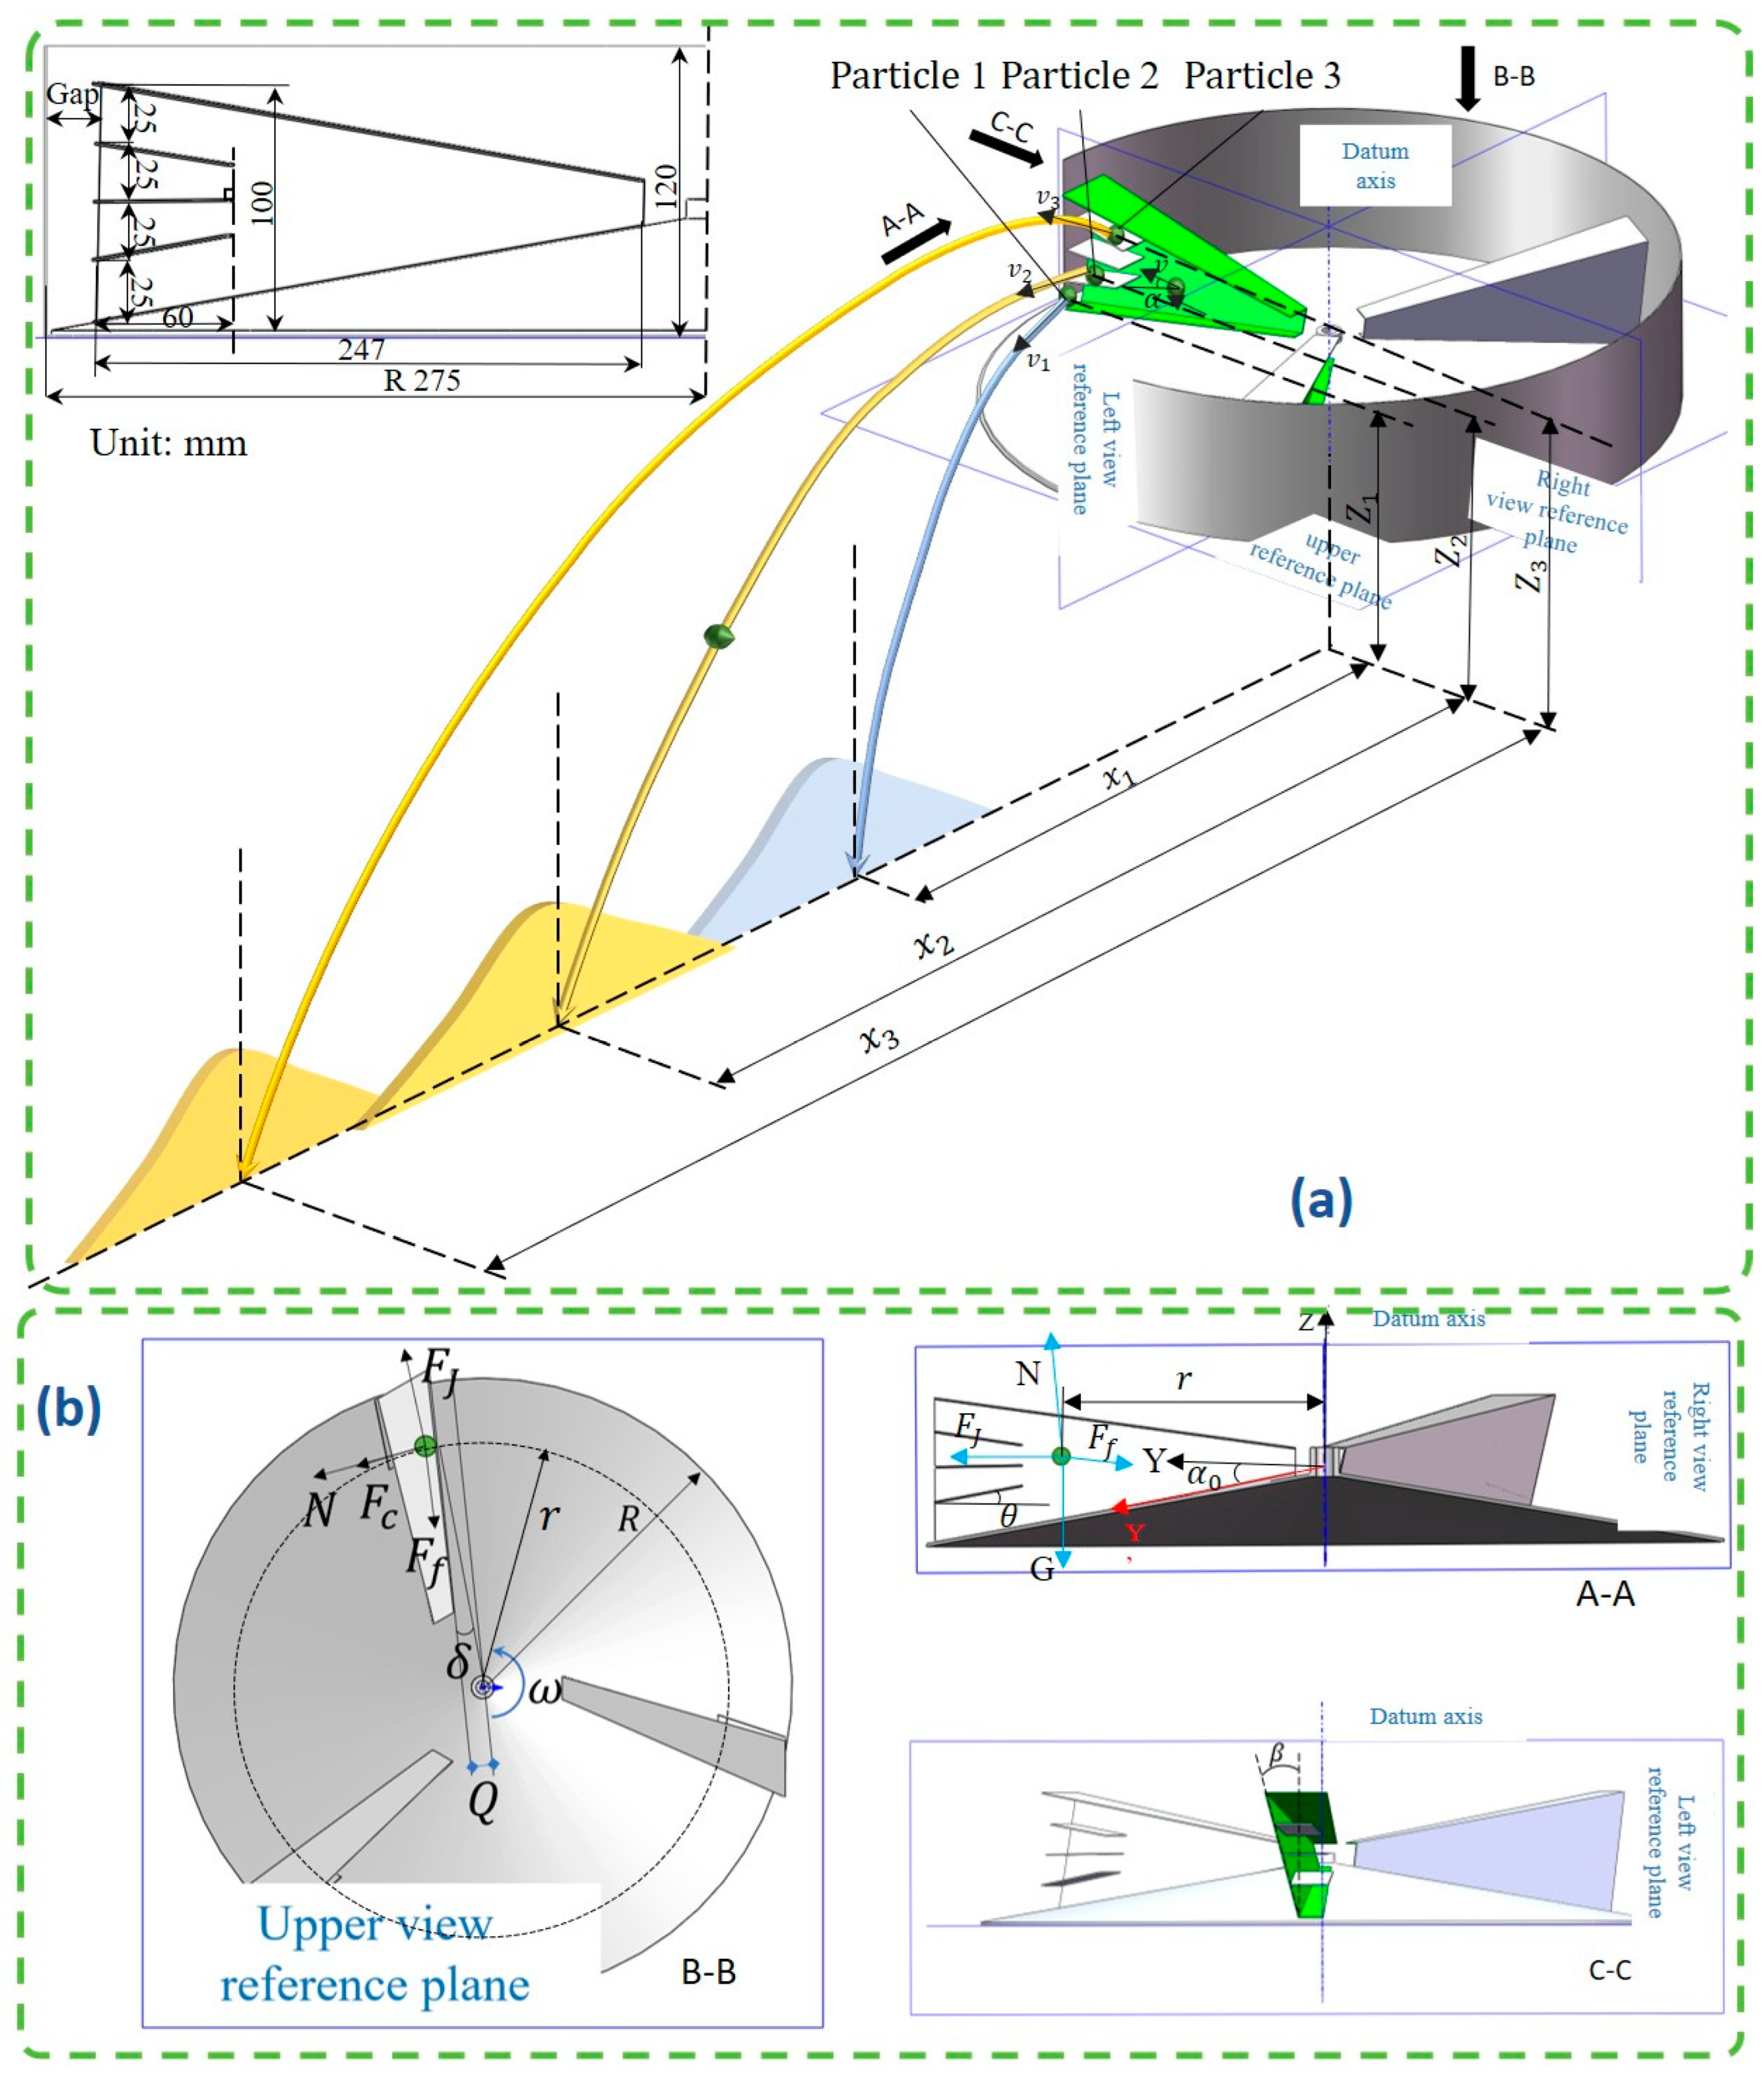
Without considering the effect of organic fertiliser on the inorganic fertiliser, the movement of the inorganic fertiliser in the spreading device is divided into two cases: spreading from the gap between the spreading disc and guard plate, and free spreading at the opening. The motions of the inorganic fertiliser particles in the two cases correspond to the blue and yellow particles in Figure 2a, respectively.
As is evident from the aforementioned information, the centrifugal side-throwing fertiliser distribution apparatus involves many scenarios of fertiliser particles being propelled to varying distances, thereby facilitating a more uniform distribution. Nevertheless, it is conceivable that a small quantity of inorganic fertiliser may exhibit only one or two projection scenarios, resulting in an uneven distribution. The force analysis of the individual inorganic fertiliser particles is depicted in Figure 2b.
The force equations for the fertiliser particles accelerating on the surface of the spreading disc along the X , Y , and Z directions are given in Equation (1):
F X = F c N x F f x F X = m a X F Y = F J N y F f y F Y = m a Y F Z = N z G F f z F z = m a Z
where F i denotes the combined force of organic fertiliser particles in direction i, i = X, Y, Z; a i denotes the acceleration of organic fertiliser particles in the i direction, i = X, Y, Z; F f i denotes the friction force of organic fertiliser particles in the i direction, i = x , y , z ; N i denotes the support force of the fan blade on the particles in the i direction; and m denotes the mass of organic fertiliser particles.
The values for F J ,   F c ,   G ,   a n d   F f are given in Equation (2).
F J = m ω 2 r F c = 2 m ω v sin α G = m g F f = μ N ,
where ω denotes the rotational speed of the fertiliser-spreading disc r a d · s 1 ; g denotes the acceleration of gravity m · s 2 ; and α is the angle between the motion direction of the organic fertiliser particles and y-direction, measured in degrees (°).
The direction of the support force is perpendicular to the wall surface in the upper right, as shown in Figure 2. Furthermore, by substituting Equation (2), N is expressed using Equation (3).
N = G s i n β · c o s δ + F c c o s δ · c o s β .
where β is the fan blade inclination angle (°); and δ , pitch angle of the vane.
The support force is then decomposed in three directions, X, Y, and Z, and we obtain
N x = N cos β · c o s δ N y = N · c o s β · s i n δ N z = N sin β .
where N i denotes the support force of the organic fertiliser particles in direction i , i   =   X ,   Y ,   Z .
The friction force on the fertiliser particles is decomposed in the X, Y, and Z directions as follows: Substituting Equation (3) into Equation (2) yields the frictional force F f ; subsequently, the frictional force F f acting on the fertilizer particles is decomposed into the X, Y, and Z directions as follows:
F f x = μ N s i n α · s i n δ F f y = μ N sin α · c o s δ F f z = μ N cos α .
By combining the above Equations (1), (2), (4) and (5) with respect to the y direction, the equation of motion for organic fertilizer particles along the Y-axis in the Cartesian coordinate system O-XYZ is given by Equation (6). The second-order partial differential equation is then solved.
d 2 y d t 2 + b d y d t 2 + c d y d t + d = 0
Among them:
b = tan 2 δ r [ 1 + s i n δ c o s β ( c o s β s i n β + μ s i n α c o s δ ) ] ; c = 2 ω 2 tan δ + ( cos β cos δ 2 tan δ sin δ cos β ) ( cos β sin β + μ sin α cos δ ) ; d = ( g s i n β c o s δ + ω 2 r s i n δ c o s β ) ( c o s β s i n β + μ sin α cos δ ) ω 2 r ;
According to the solution method for second-order nonhomogeneous differential equations, it is obtained that
x ( t ) = d c + e t b 2 b 2 + 4 c 2 3 c b 2 + 4 c 200 d b 2 + 4 c + 3 b c 200 b d 400 c b 2 + 4 c e t b 2 + b 2 + 4 c 2 b b 2 + 4 c ( 3 c 200 d ) 400 c b 2 + 4 c
Therefore, v x ( t ) can be solved for
v x ( t ) = e t b 2 + b 2 + 4 c 2 b b 2 + 4 c b 2 + b 2 + 4 c 2 ( 3 c 200 d ) 400 c b 2 + 4 c e t b 2 b 2 + 4 c 2 b 2 b 2 + 4 c 2 3 c b 2 + 4 c 200 d b 2 + 4 c + 3 b c 200 b d 400 c b 2 + 4 c
Since the radius of the fertiliser spreading disk is R, the time that the particles spend on the fertiliser spreading disk is set as t.
0 t x t d t = r r i
Since the above equation expresses r as a function of t , its inverse function is denoted as t = φ ( r ) , r ( r i , R ) . When r = R r i , the fertiliser particles leave the fertiliser spreading disk, and at this moment.
The angle that the fertiliser particles rotate along with the disk at this moment is denoted as ε .
ε = ω · φ ( R r i )
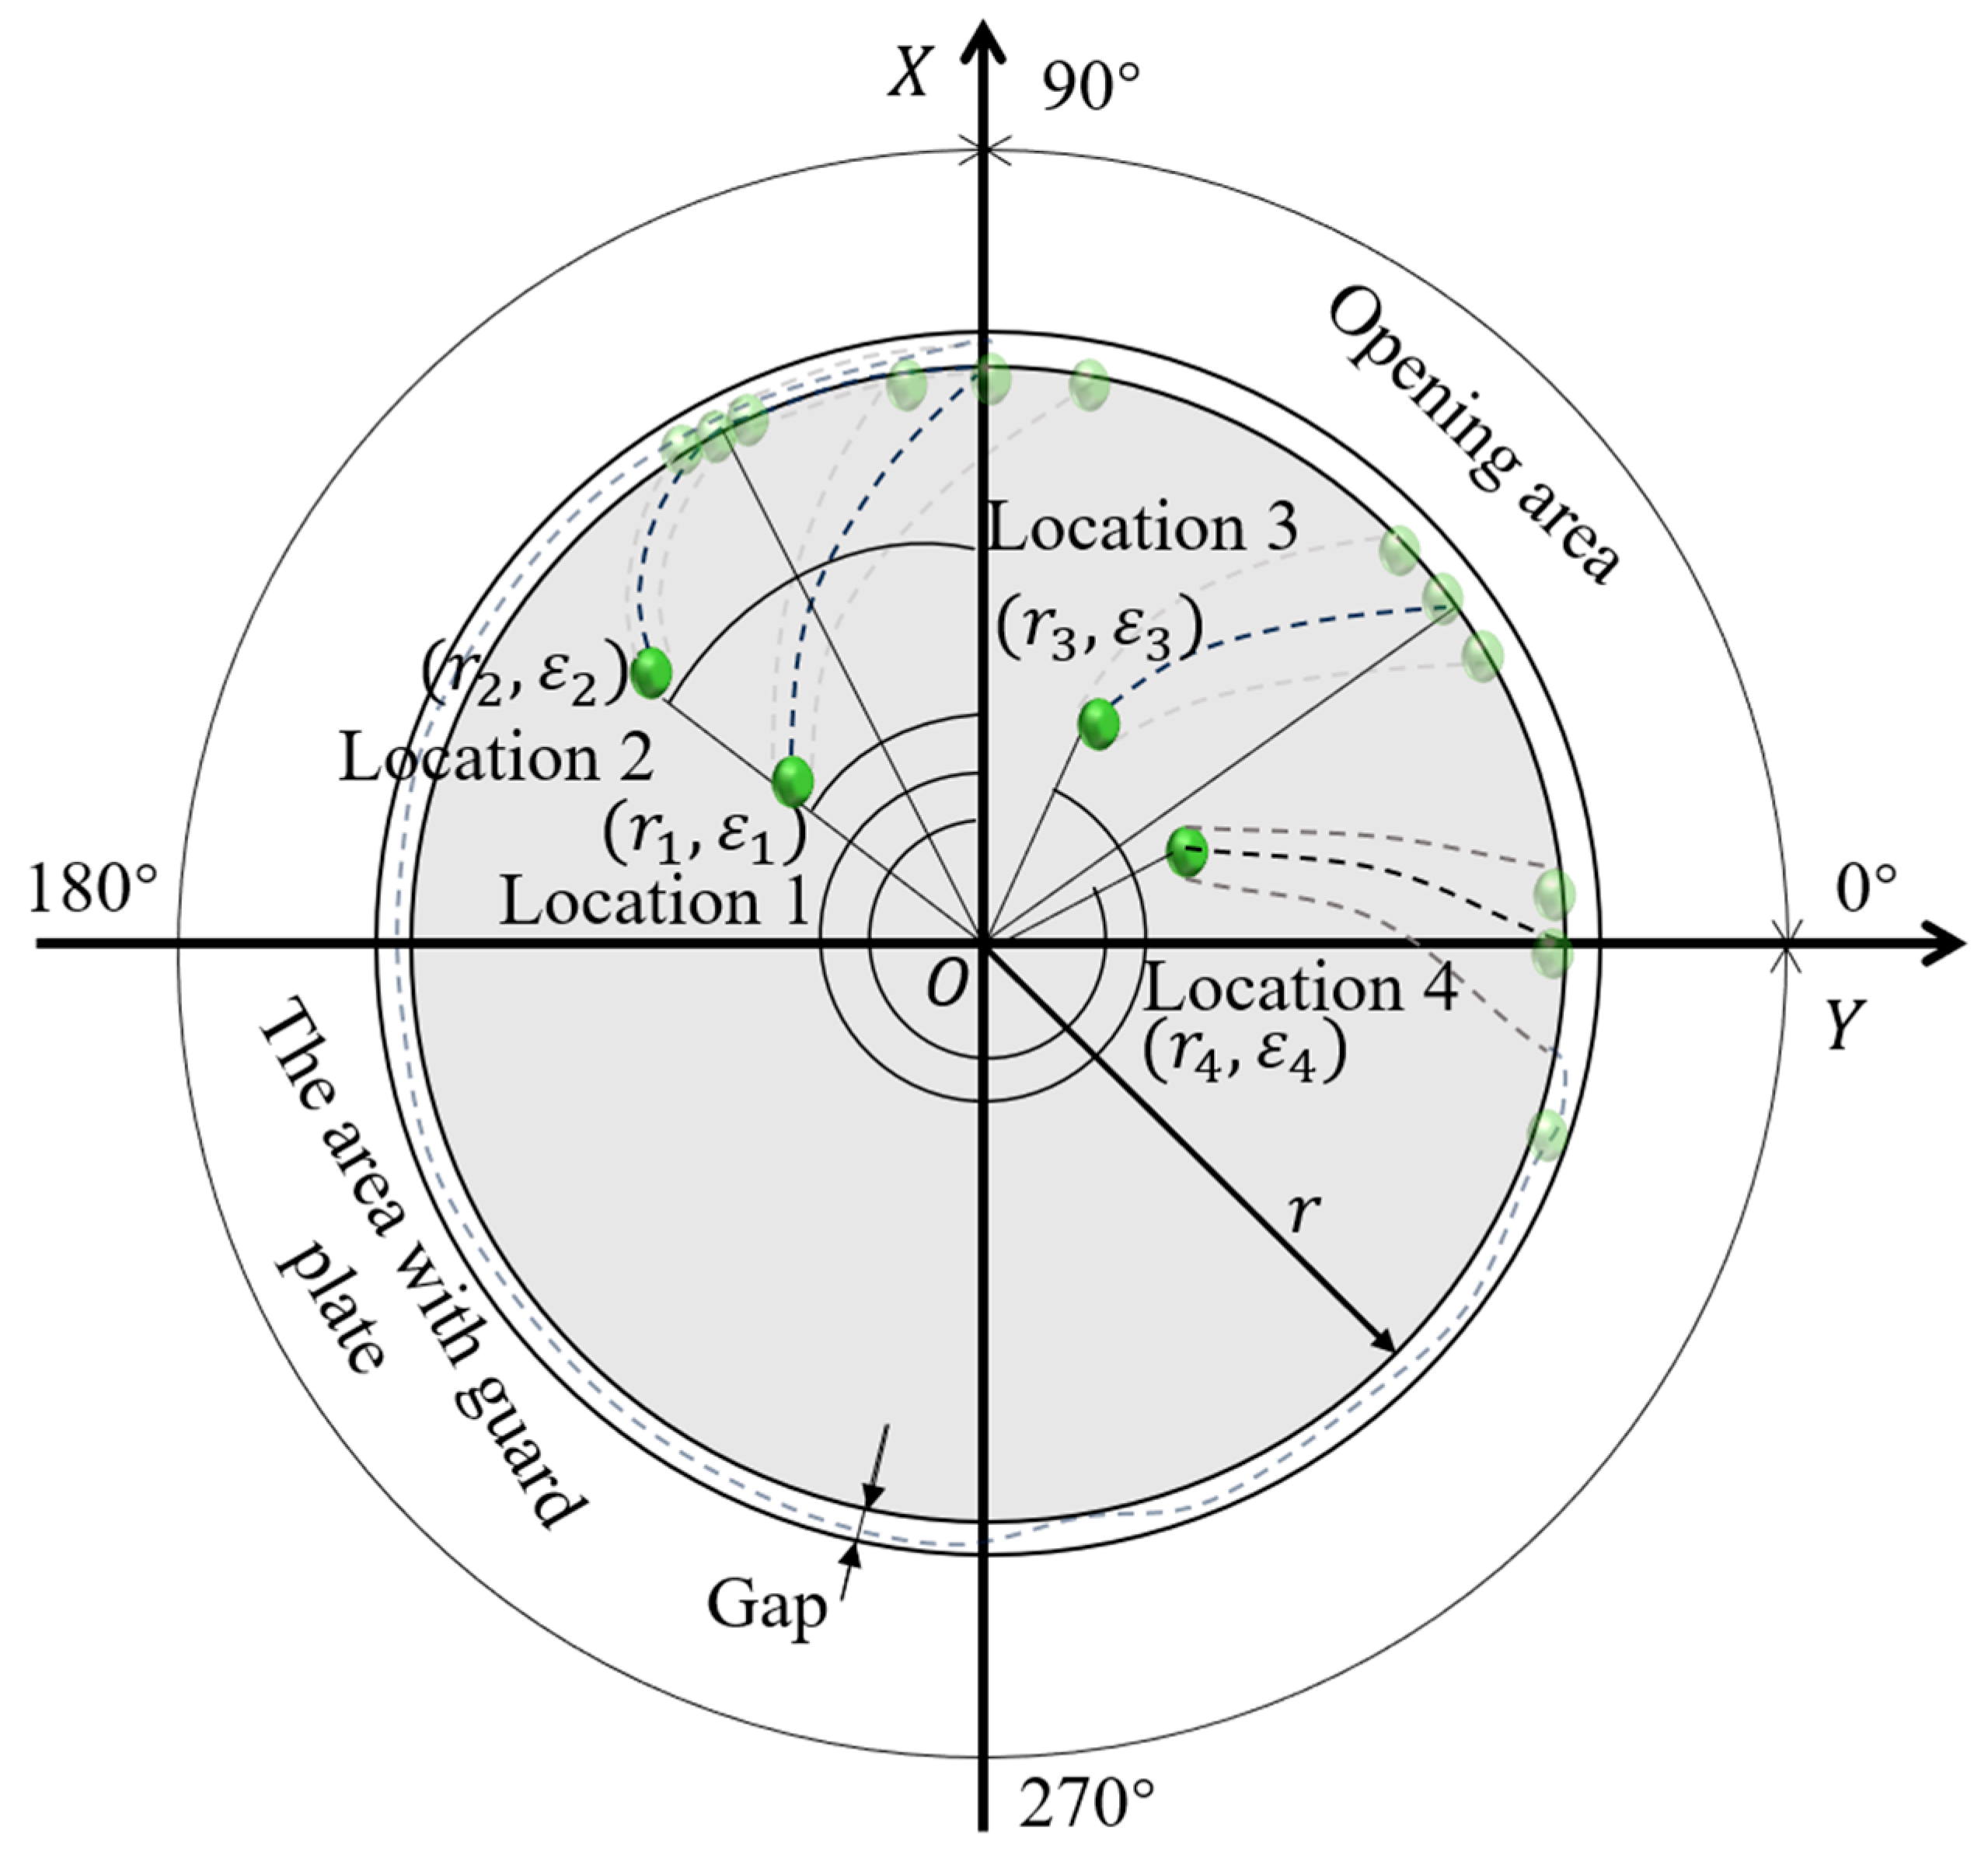
As shown in Figure 1b, the location of the fertiliser in the upper semicircular area of the fertiliser spreading disk is adjustable. Four representative positions were selected to analyze the influence of different dropping locations of fertiliser on the spreading trajectory. These locations are represented by polar coordinates, where the polar angle corresponding to the opening area from 0° to 90°. Locations 1 and 2 have the same polar angle but different polar radii, while Locations 1, 2, and 3 have the same polar radius but different polar angles. By combining the analysis of Equation (11), If ε i ε ( 0 ° , 90 ° ) , the particles will leave from the opening, with their ground distribution corresponding to Particle 2 and Particle 3 as shown in Figure 2. Else if ε i ε ( 90 ° , 360 ° ) , the particles cannot leave directly from the opening; instead, they need to move a certain distance through the gap between the guard plate and the fan blades before exiting the fertiliser spreading disk, and their ground distribution is consistent with Particle 1 in Figure 2. In Figure 3, Location 1 and 2 have the same polar angle ε i ; however r 1 < r 2 , so the ε of location 1 is greater, making it more likely for the particles to leave from the opening. At this point, the particles at Location 2 basically follow the distribution of Particle 1 in Figure 2, while the particles at Locayion 1 may exhibit the distributions of Particles 1 to 3 simultaneously. Therefore, the fertiliser at Location 1 is more likely to have a more uniform distribution. Locations 1, 3, and 4 have the same polar radius r i , but there are significant differences in their polar angles ε i ( ε 1 > ε 2 > ε 3 ), as shown in the figure. Particles at Location 3 may completely fall into the categories of Particle 2 and Particle 3 in Figure 2. Location 4 is relatively special: a portion of its particles belong to the categories of Particle 2 and Particle 3 in Figure 2, while the other portion rotates 3/4 of a circle within the fertiliser spreading disk before leaving the disk, falling into the category of Particle 1. Therefore, the particles dropped at Location 4 also exhibit a relatively uniform distribution on the ground. Based on the comprehensive analysis above, when fertilisers leave the fertiliser spreading disc, they form peaks at a relatively short distance (e.g., Particle 1) and also at relatively long distances (e.g., Particles 2 and 3). Adjusting the dropping position of inorganic fertiliser can regulate the height of these two peaks—i.e., the distribution amount. Through the regulation of the two peaks, the uniform distribution of inorganic fertiliser is achieved. Combined with Equation (11), it is observed that the uniformity of fertiliser distribution has a significant relationship with the rotational speed of the fertiliser spreading disk. In addition, since a large amount of organic fertiliser still exists inside the fertiliser spreading disk, the uniformity may also be related to the flow rate of the organic fertiliser.

2.3. Analysis of Fertiliser Particle Motion in Air

After leaving the centrifugal disk, fertiliser particles move through the air under the combined influence of multiple forces including gravity, buoyancy, air resistance, and forces generated by inter-particle collisions, ultimately settling on the ground. Therefore, the following assumptions are made for kinematic analysis: Assuming uniform air density; Negligible rotational effects on particle velocity and direction during motion; Exclusion of inter-particle interactions throughout the trajectory; Initial velocity equivalence to the detachment speed from the centrifugal disk; Oblique projectile motion at an angle φ to the horizontal plane post-detachment.
When fertiliser particles undergo oblique projectile motion (as illustrated in Figure 4), the air resistance conforms to Stokes’ law: F f = 6 π η r V , where V denotes the relative velocity between fertiliser particles and air.
Resolving the air resistance acting on the fertiliser particle into horizontal and vertical components, the equations of motion along both directions are given by Newton’s second law:
d 2 x d t 2 = F f c o s φ m d 2 y d t 2 = F f s i n φ m g
where η represents the dynamic viscosity of air, Pa·s.
Given the initial conditions, at t = 0, x = 0, d x d t = V 0 c o s φ , and at t = 0, y = H, d y d t = V 0 s i n φ . The equations of motion for fertiliser particles under air resistance are derived as follows:
x = m V 0 c o s φ k 1 e k t m
y = m 2 g + k m V 0 s i n φ k 2 1 e k t m m g t k + H
m is obtained from Equation (13):
t = m k l n 1 k x m V 0 c o s φ
Substituting (15) into Equation (14),
y = m g + k V 0 s i n φ k V 0 c o s φ x + m 2 g l n 1 k x m V 0 c o s φ k 2 + H
When y = 0,
x = H k V 0 c o s φ m g + k V 0 s i n φ + m 2 g V 0 c o s φ k m g + k V 0 s i n φ . l n m V 0 c o s φ l n m V 0 c o s φ k x
In Equation (17), the x-value represents the throw range L. While the initial height H remains constant, the initial angle φ and velocity V0 can be controlled by adjusting the detachment location from the fan blades. However, the air resistance coefficient k varies with particle size, leading to differential deceleration effects. Therefore, the ejection location for inorganic fertiliser particles must be readjusted during optimization. Simultaneously, simulation experiments must account for air resistance modeling.

2.4. EDEM-Fluent Coupled Simulation Approach

2.4.1. Discrete Element Model Parameterisation

Sheep manure was the organic fertiliser applied by the professional cooperative of fruits and vegetables in Chenbao Town, Taizhou City, and its density was determined to be 672 kg·m−3 by the liquid intrusion method. The average volumetric moisture content of the organic fertiliser was determined as 15–23% using the oven-drying method. The particle size distribution of the organic fertiliser particles was determined using the Taylor sieve screening method. The average of three stacking angle measurements was 33.15° (Figure 5).
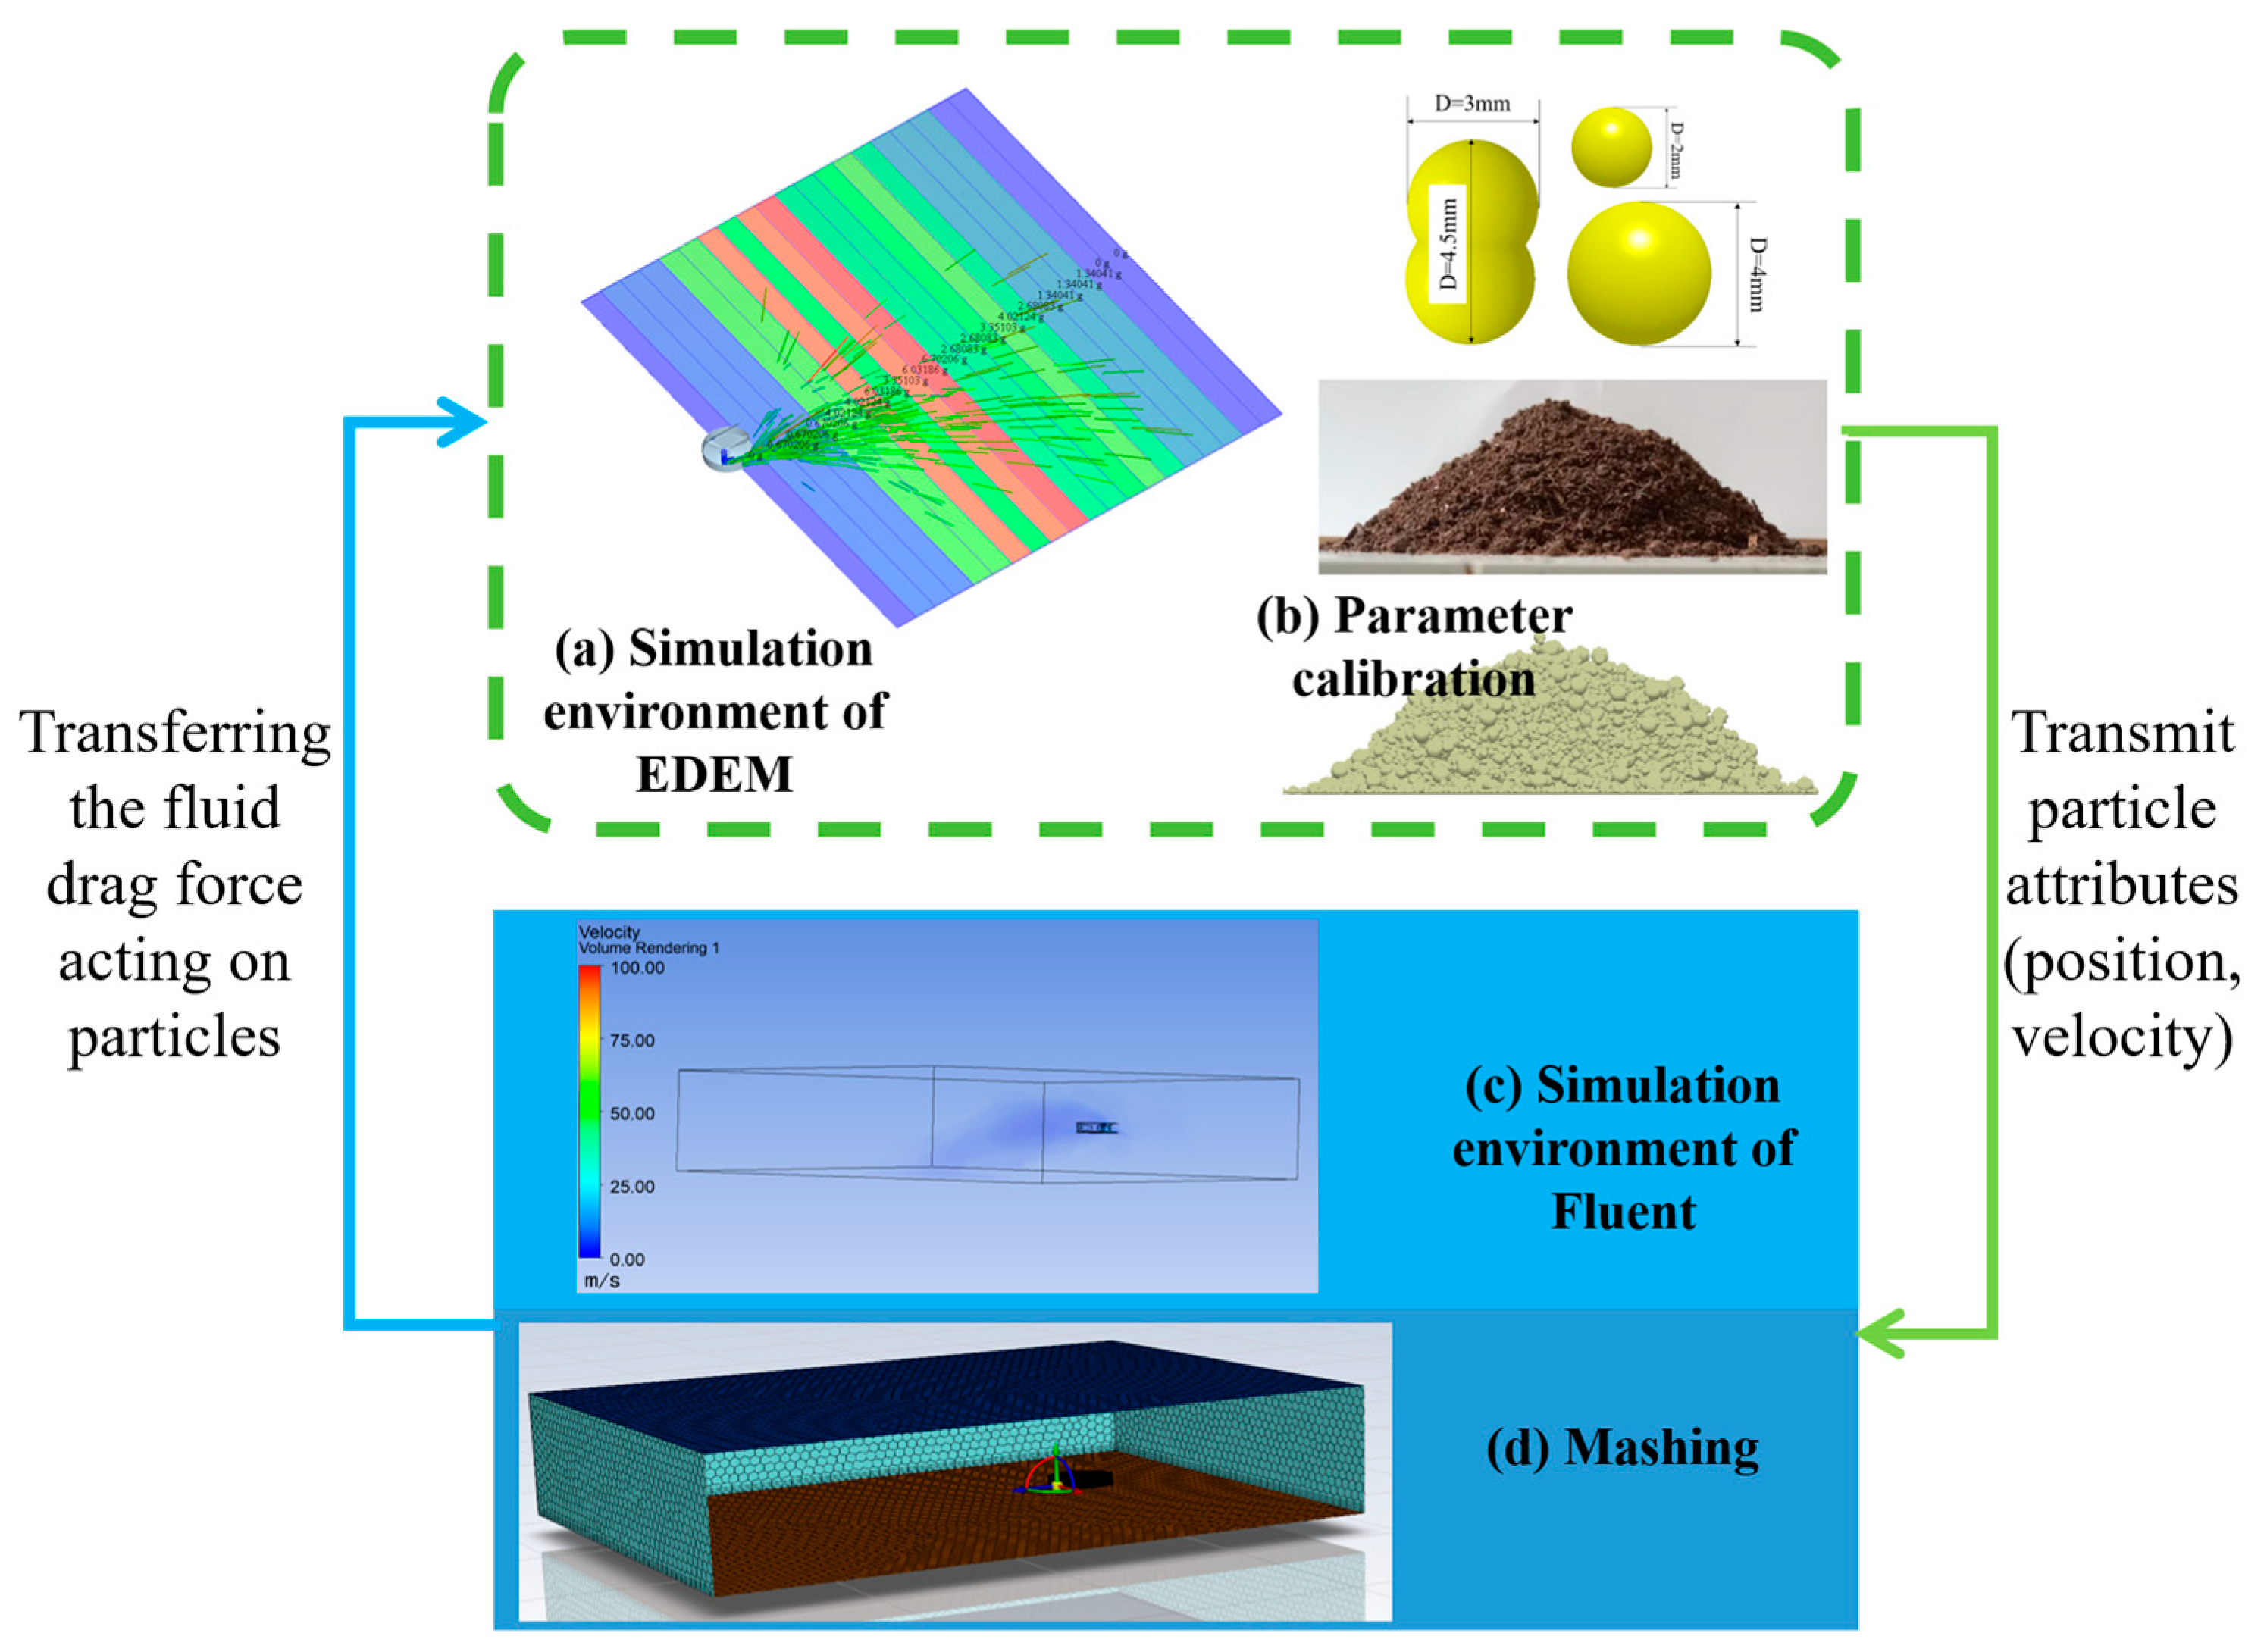
The interaction model employed between particles and mechanical components is the Hertz–Mindlin (no-slip) model. To simulate particle–particle contacts, we adopted the Hertz–Mindlin with Johnson–Kendall–Roberts (JKR) model, which integrates the Hertz-Mindlin and JKR cohesion models. Adhesion exists between particles, so the JKR model is employed. Meanwhile, the higher the moisture content, the greater the JKR surface energy coefficient. The Hertz–Mindlin model, grounded in Hertz theory, is widely used to depict mechanical contacts between particles or solid surfaces, accounting for elastic and rigid body deformations to deduce the stress distribution and deformation in the contact zone. The JKR model, a classical cohesion model, characterizes the contact behaviour at the micron scale by considering the surface cohesion and plastic deformation of the contact surface. Combining the elastic strain from the Hertz–Mindlin model with the cohesion from the JKR model provides a more precise description of the mechanical contacts between particles or solid surfaces. To achieve a reasonably practical simulation time, a particle model was established based on particle scale theory [29,30], as shown in Figure 5b, which mainly comprised spindle-shaped and spherical fertilisers. The particle size distribution is fixed. The calibrated stacking angle is 32.80°, with a relative error of 1.05%. The simulation parameters are listed in Table 1.

2.4.2. Simulation and Boundary Condition Settings

The structure of the fertiliser spreading device was simplified to facilitate mesh delineation and boundary condition processing as well as to ensure computational efficiency. As shown in Figure 5c, a 3D simplified model of the fertiliser spreading device was built in SolidWorks 2022, which includes the rotational domain around the fertiliser spreading discs and the area used for fertiliser throwing. The model was meshed using the Fluent 2023R1 mesh module (poly-hexcore mesh) with a mesh number of 396,843 (Figure 5d). As boundary conditions, the airflow inlet and airflow outlet were adopted as pressure inlet and pressure outlet, respectively, and a realisable k–ε turbulence model was used to solve the airflow motion [33]. The computing platform configuration is as follows: two AMD EPYC 7542 CPUs (32-core, 64-thread, with a base clock of 2.8 GHz), eight Micron DDR4 REC memory modules (32 GB each, 3200 MHz), and one NVIDIA RTX 5080T graphics card with 16 GB of memory.
The coupled interface of computational fluid dynamics and digital elevation model adopted the Eulerian method. The time step required by EDEM is smaller than that of Fluent, so the time steps of EDEM 2024 and Fluent 2023R1 were set to 2 × 10⁻⁶ s and 1 × 10⁻⁴ s, respectively. The number of iterations was set to 20,000, and the computation time was 10 s to ensure the computational speed and stability. The fertiliser spreading disc rotational speed and organic and inorganic fertiliser flow rates were determined through the tests detailed below.

2.5. Methodology for Calculating Indicators

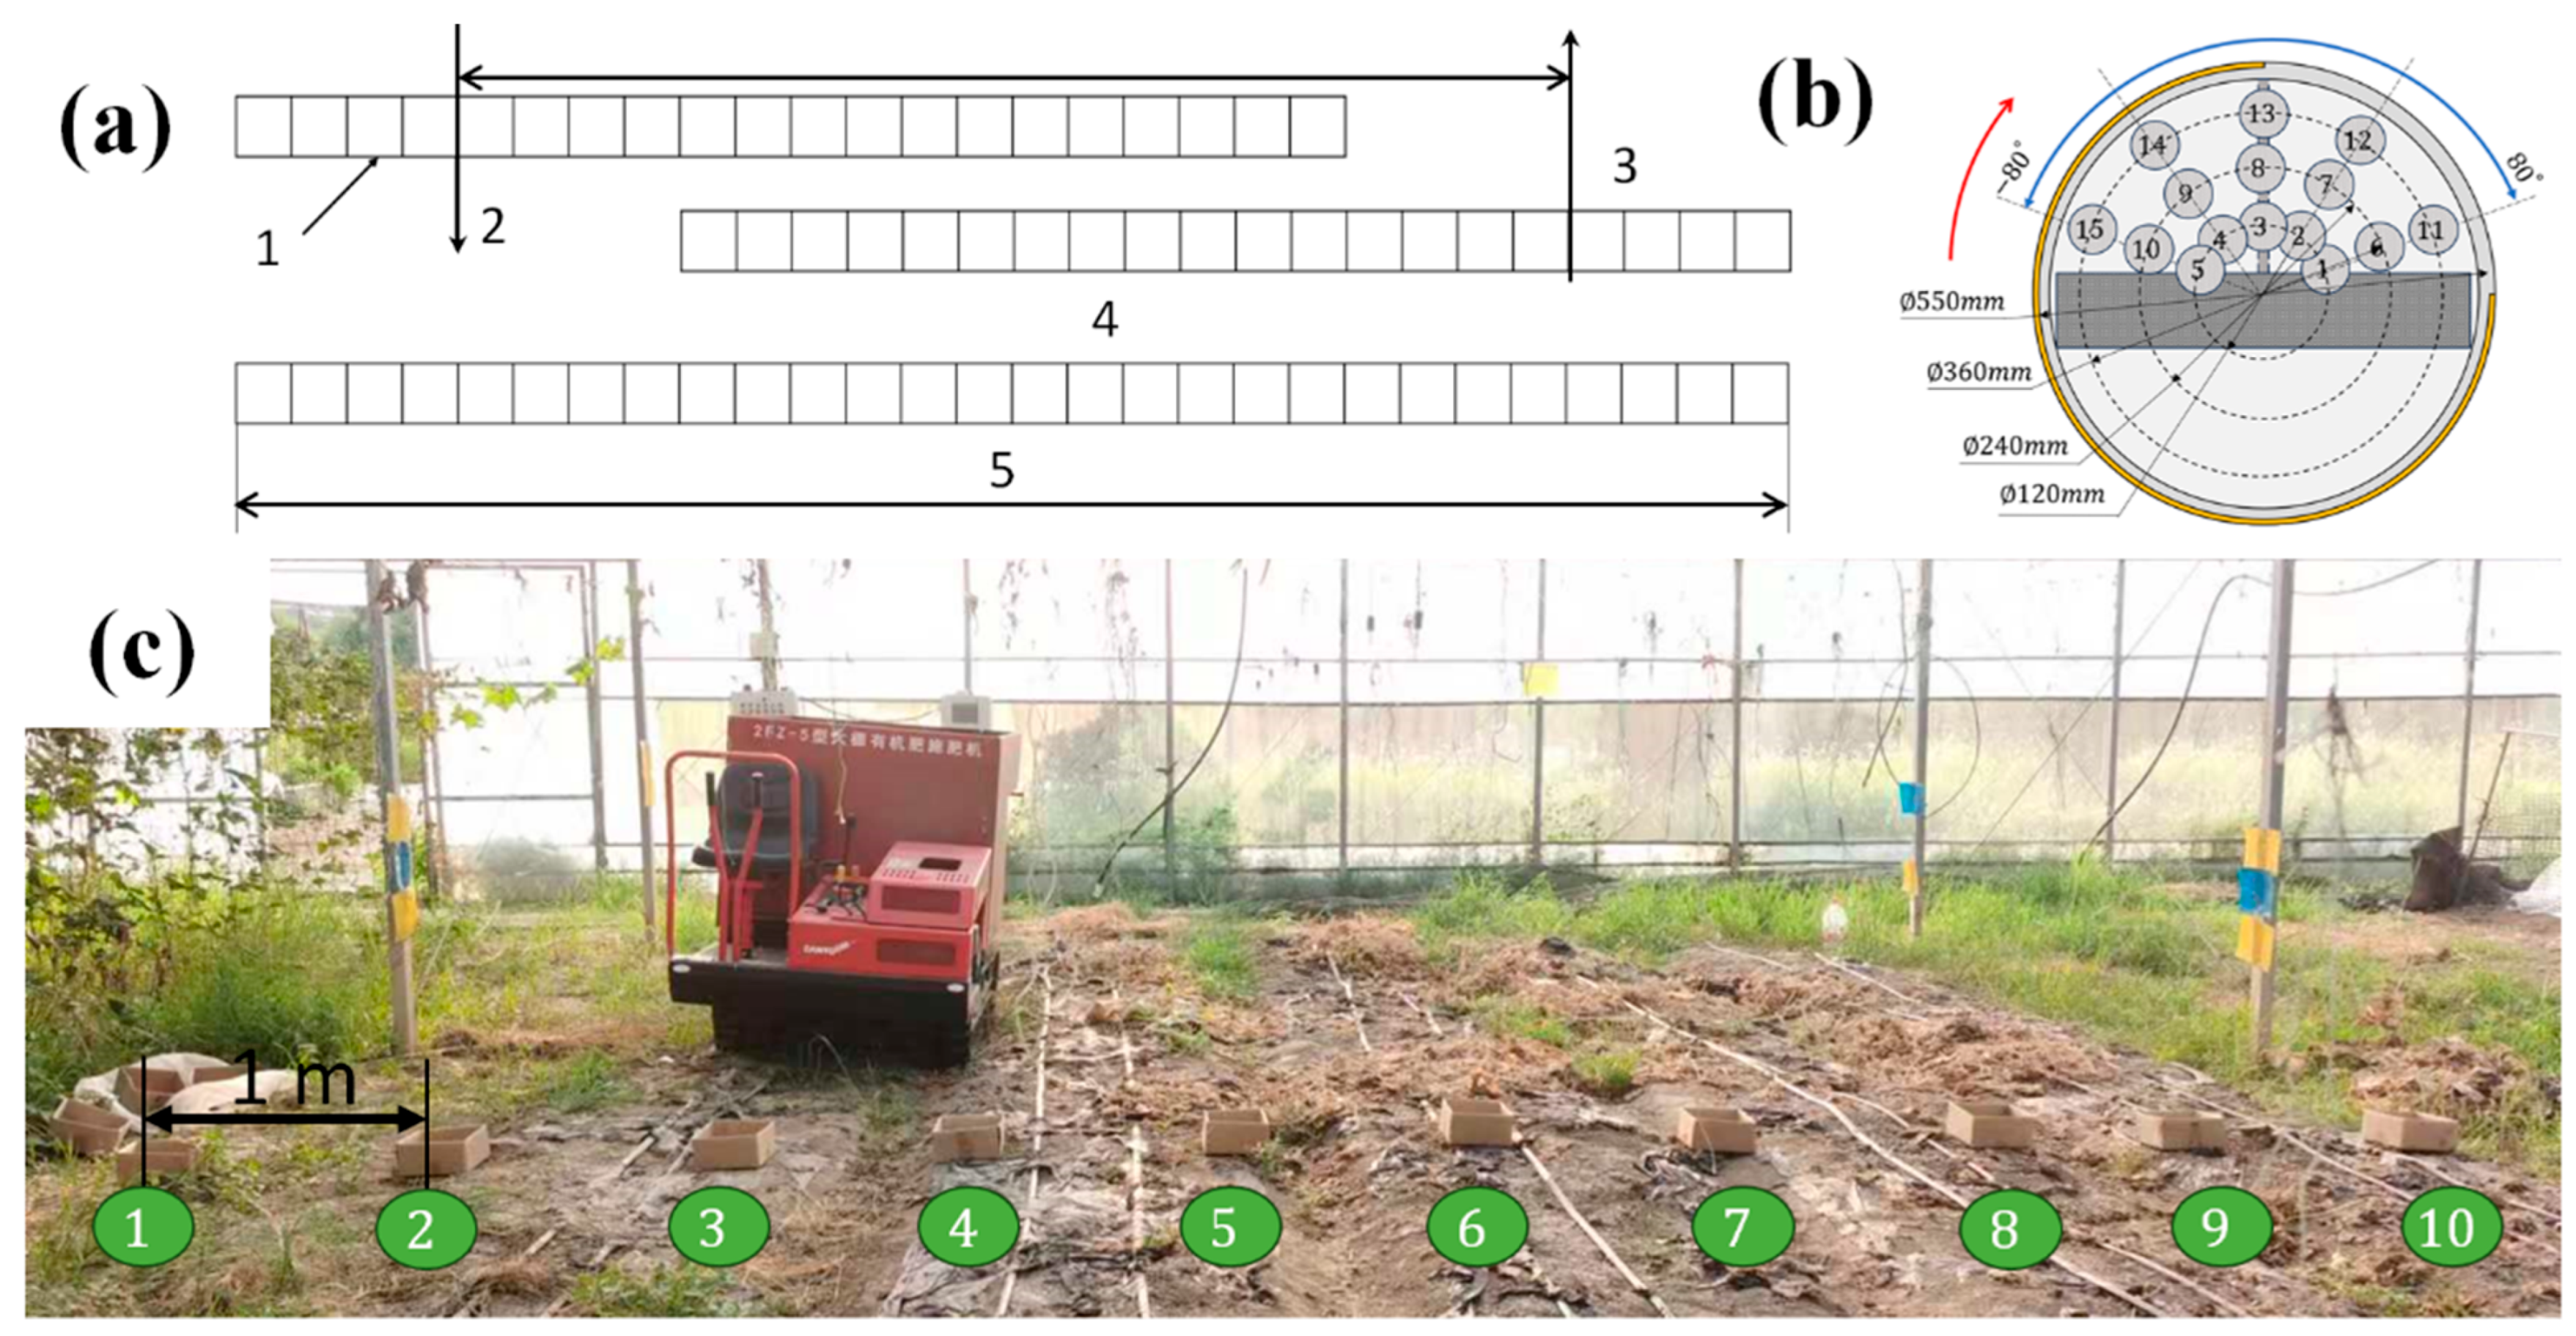
Using the Group function of EDEM, an area (5.0 m × 5.0 m) was established and divided into 20 zones, each measuring 0.25 m × 5.0 m. The masses of organic and inorganic fertiliser particles in each zone were counted. To visually compare the distribution of inorganic and organic fertilisers, the ratio of the mass of each grid to the total mass of all grids was used as the vertical coordinate and was calculated by Equation (18). With reference to the national standard GB/T 25401-2010 [34], the line superlocation simulation method was used to collect the one-dimensional distribution on both sides of the mirror image to simulate the reciprocating operation of the fertiliser spreader (Figure 6a). The wind speed at the experimental site was below 0.5 m·s−1, which was considered calm. After superlocation, the CV within the effective width was calculated as an index as follows:
C V = S D X ¯ × 100 %
S D = i = 1 n ( X i X ¯ ) 2 n 1
X ¯ = 1 n i = 1 n X i
where CV is the coefficient of variation in particle distribution; SD is the standard deviation of fertiliser particle mass (kg); X ¯ is the mean value of the mass of fertiliser particles in each column (kg); Xi is the mass of fertiliser particles in column i (kg); and n is the number of zones for the simulation test and number of collection boxes in the corresponding width for the field test, the number of collection boxes counted varies at different fertiliser spreading disc speeds, 300–700 r·min−1, corresponding in turn to an effective width of 3–5 m, as in Figure 6a.
Additionally, for the convenience of displaying the distributions of organic and inorganic fertilizers in a single figure, we use the percentage of each region as the ordinate of the statistical distribution. This percentage can be calculated using Equation (21).
k i = X i n × X ¯ × 100 %
where k i is the proportion of the mass of the i-th grid on the ground to the total mass.

2.6. Simulation Experiment Design

2.6.1. One-Factor Simulation Experimental Design

A one-way experiment was conducted to assess the effects of various factors on the distribution of organic fertiliser. The factors tested included the rotational speed of the spreading disc, mass flow rate of organic fertiliser, percentage of inorganic fertiliser, location of inorganic fertiliser drop, and CV of inorganic fertiliser (ICV). The lateral CV of organic fertiliser (OCV) was observed, as well as the location of the median value of the distribution of fertiliser. The detailed experimental parameters are listed in Table 2.

2.6.2. Box–Behnken Fertiliser Drop Location Optimisation Test

The objective of this test section is to ascertain the optimal drop location for inorganic fertiliser given varying rotational speeds and organic fertiliser flow rates. To achieve this, it is imperative to establish a mathematical model that encapsulates the relationship between the rotational speed, organic fertiliser flow rate, and fertiliser drop location, thereby enabling the regulation of the CV in inorganic fertiliser uniformity. The location of fertiliser drops is a discrete variable that cannot be directly optimised as a standalone factor. In this paper, the fertiliser drop location is represented using the polar coordinate system (angle and diameter). Subsequently, the ranges of values for the four parameters—fertiliser spreading disc rotational speed, organic fertiliser mass flow rate, polar angle, and polar diameter of the fertiliser drop location—are determined. These parameters are then encoded as low (−1), medium (0), and high (1), as illustrated in Table 3. Response surface analysis experiments were designed using Design-Expert 13, with the ICV of the lateral distribution of inorganic fertiliser as the evaluation index. There were 29 sets of experiments, which can be divided into two main categories: 24 sets of star point experiments and 5 sets of centre point experiments, which were used to estimate the error of the experiments.

2.7. Performance Test with Spreader

To verify the validity of the rotational speed–organic fertiliser flow rate–drop location model obtained from the optimisation experiments, a field trial was conducted at Zhuyu Sanhe Field Complex (Sanhe Farm), Liuhe District, Nanjing City. The field test was operated by opposite side casting, and the fertiliser spreader was operated in second gear, with the middle location of the throttle (the speed was approximately 2.4 km·h−1). The test counted the distribution of inorganic fertiliser in response to the collection box within the effective width. The size of the collection box was 200 × 200 × 100 mm3, and the location of the collection box is shown in Figure 6c. At the end of the experiment, the boxes were weighed using an electronic scale with an accuracy of 0.01 g. The field experiment was performed three times. The wind speed at the experimental site was below 0.5 m/s, which was considered calm.

3. Results and Discussion

3.1. Model Validation Test Results

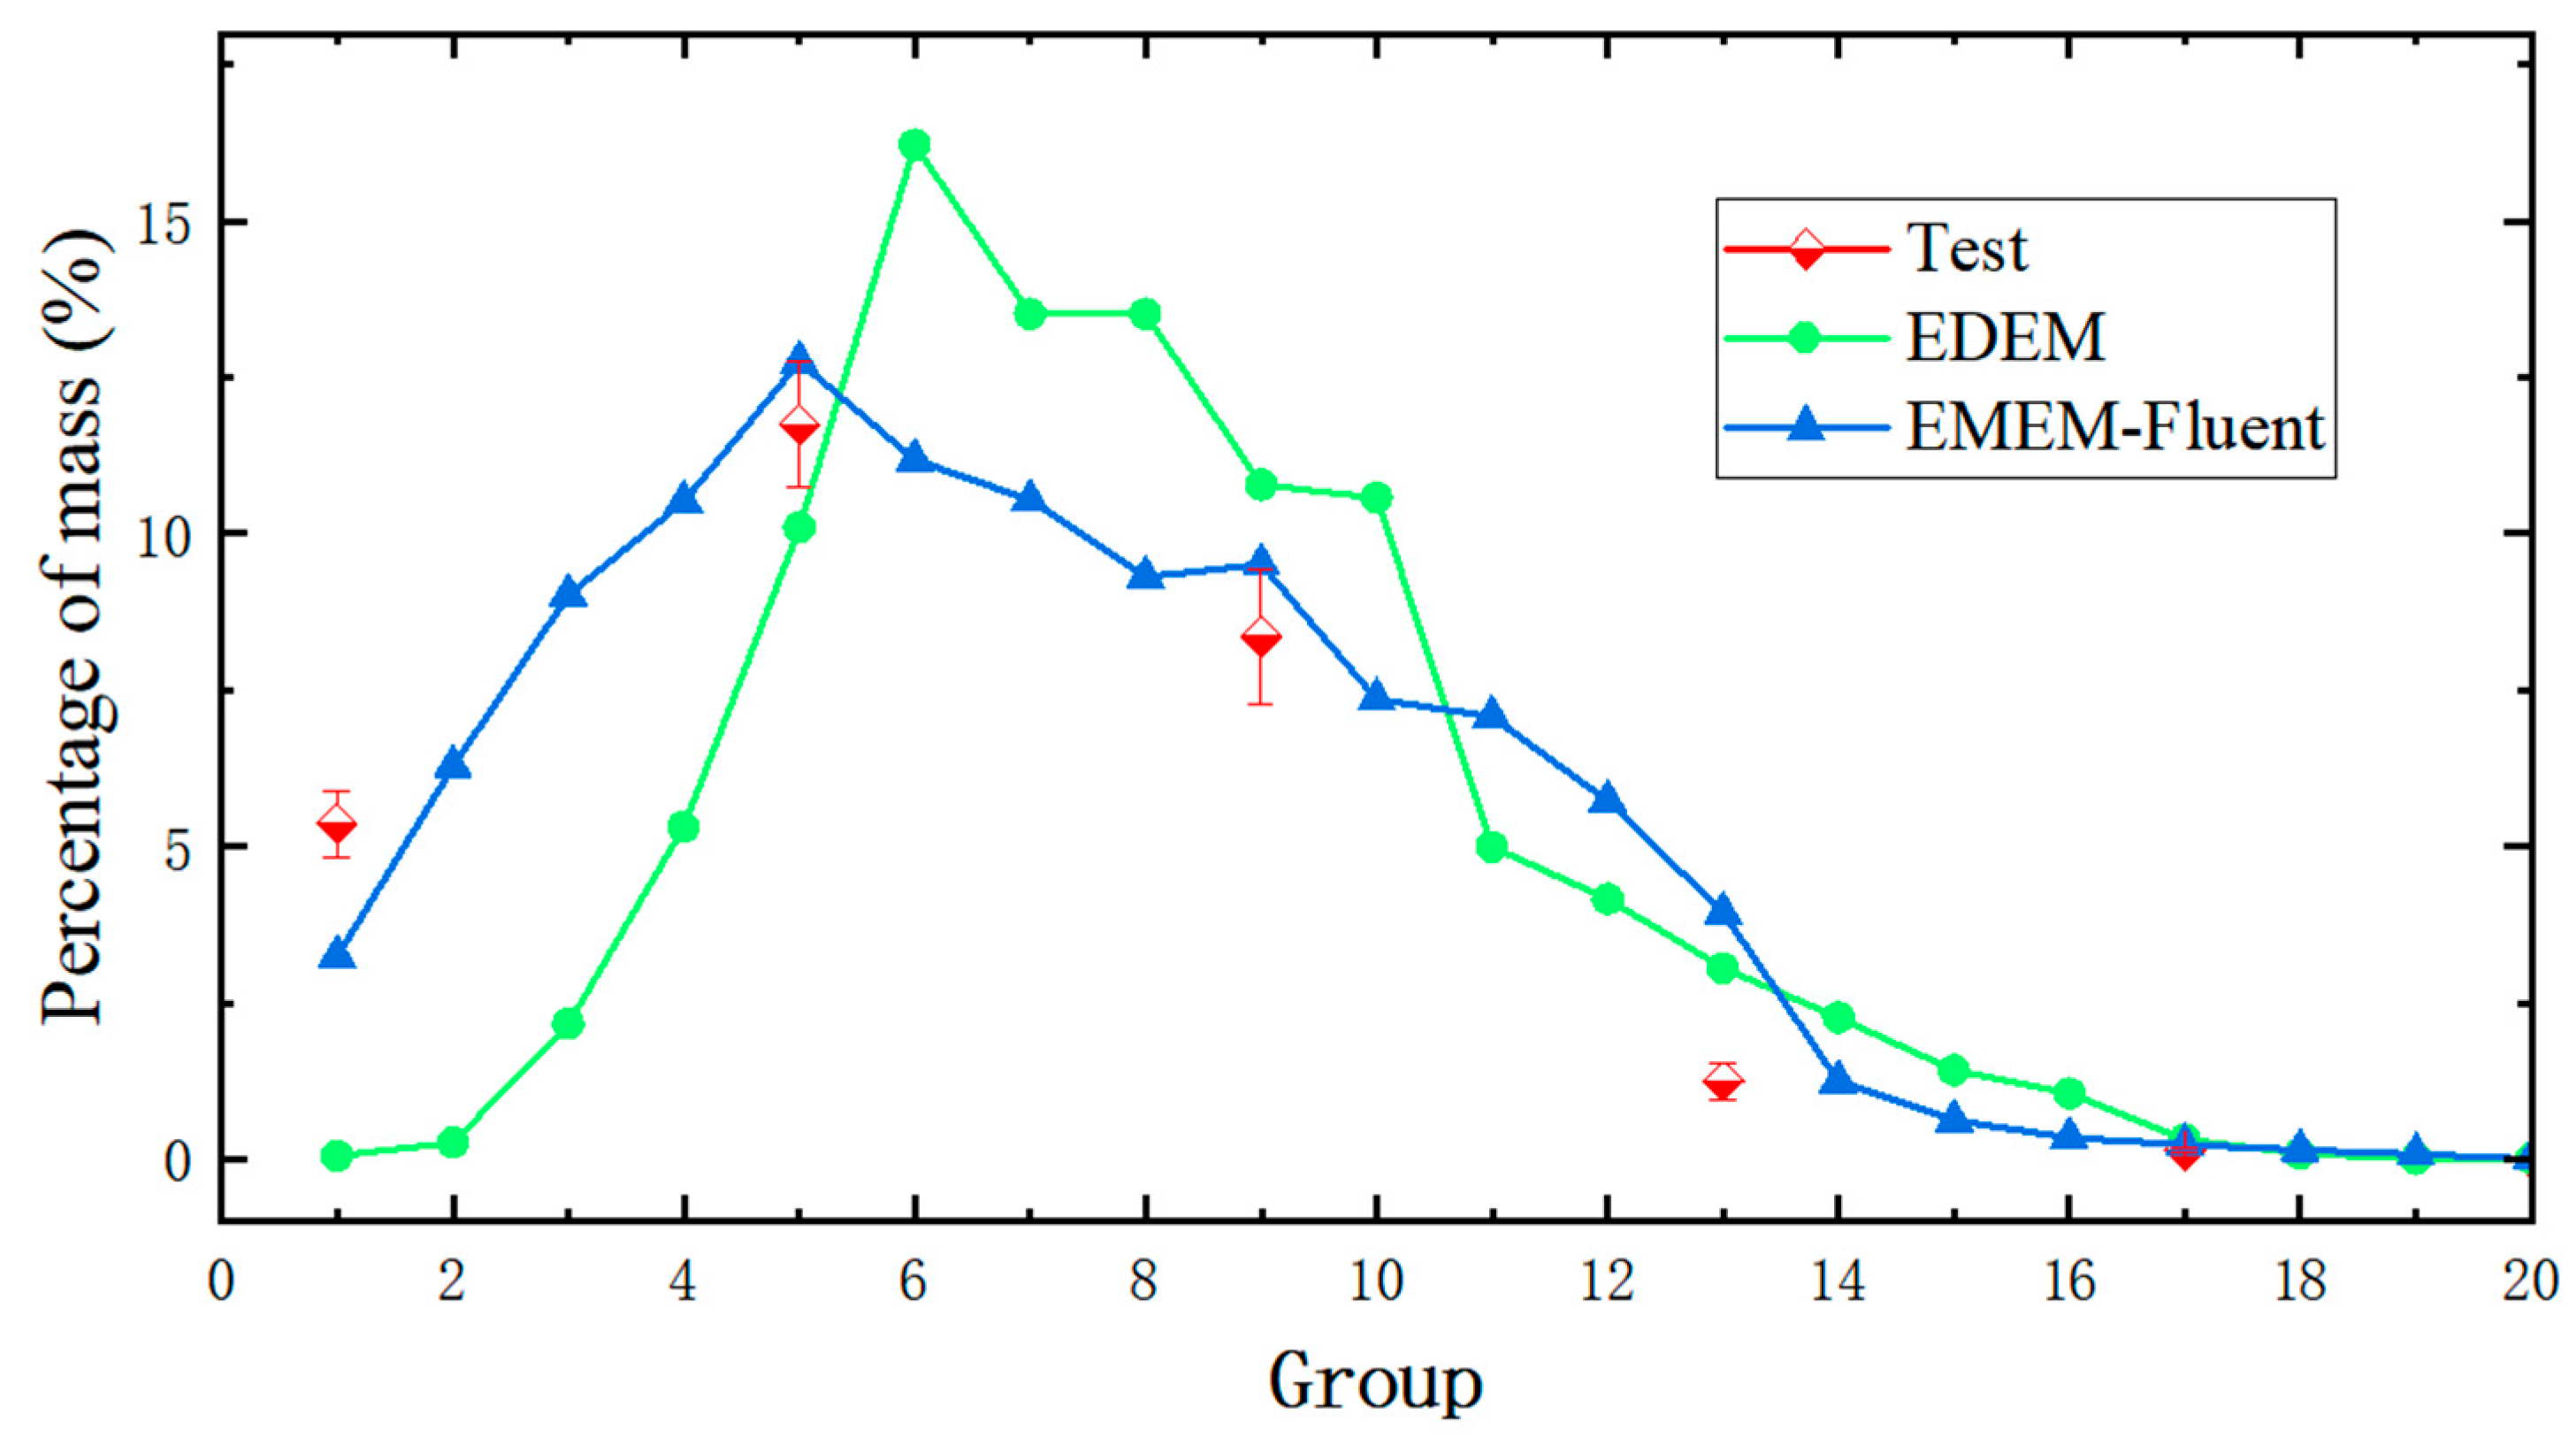
Where the amount of inorganic fertiliser remains constant at 585 g·s−1, organic fertiliser was set at 2187.5 g·s−1, the inorganic fertiliser drop location was location 7, and the speed of the spreading disc was 400 r·min−1. Owing to the challenges in achieving a consensus between experimental and simulated displacement amounts, the displacement amount was normalised for comparative analysis. The bench test was conducted in triplicate, with the standard deviation serving as the error boundary for the scatter plot. The results of both the EDEM simulation test and the EDEM-Fluent coupled simulation test are shown in Figure 7. The observed distribution trend indicates that the EDEM-Fluent coupled simulation aligns more closely with the experimental results, particularly in terms of proximal fertiliser distribution. Notably, the proximal fertiliser distribution in the bench test exceeded that in the EDEM simulation test. The EDEM-Fluent coupled simulation results, as depicted in Figure 7, exhibit minimal discrepancies with the experimental results, thereby offering significant guidance for spreader design and parameter optimisation. Additionally, to quantitatively evaluate the performance of the two simulation models, we calculated the Root Mean Square Error (RMSE) at points corresponding to the bench test positions. The RMSE between the EDEM test results and the bench test results is 2.55, while the RMSE between the EDEM-Fluent coupled test results and the bench test results is 1.53. Therefore, the accuracy of the EDEM-Fluent coupled simulation test is better than that of the EDEM test.

3.2. Results of the One-Way Test

3.2.1. Effect of Organic Fertiliser Flow Rate on Inorganic Fertiliser Uniformity

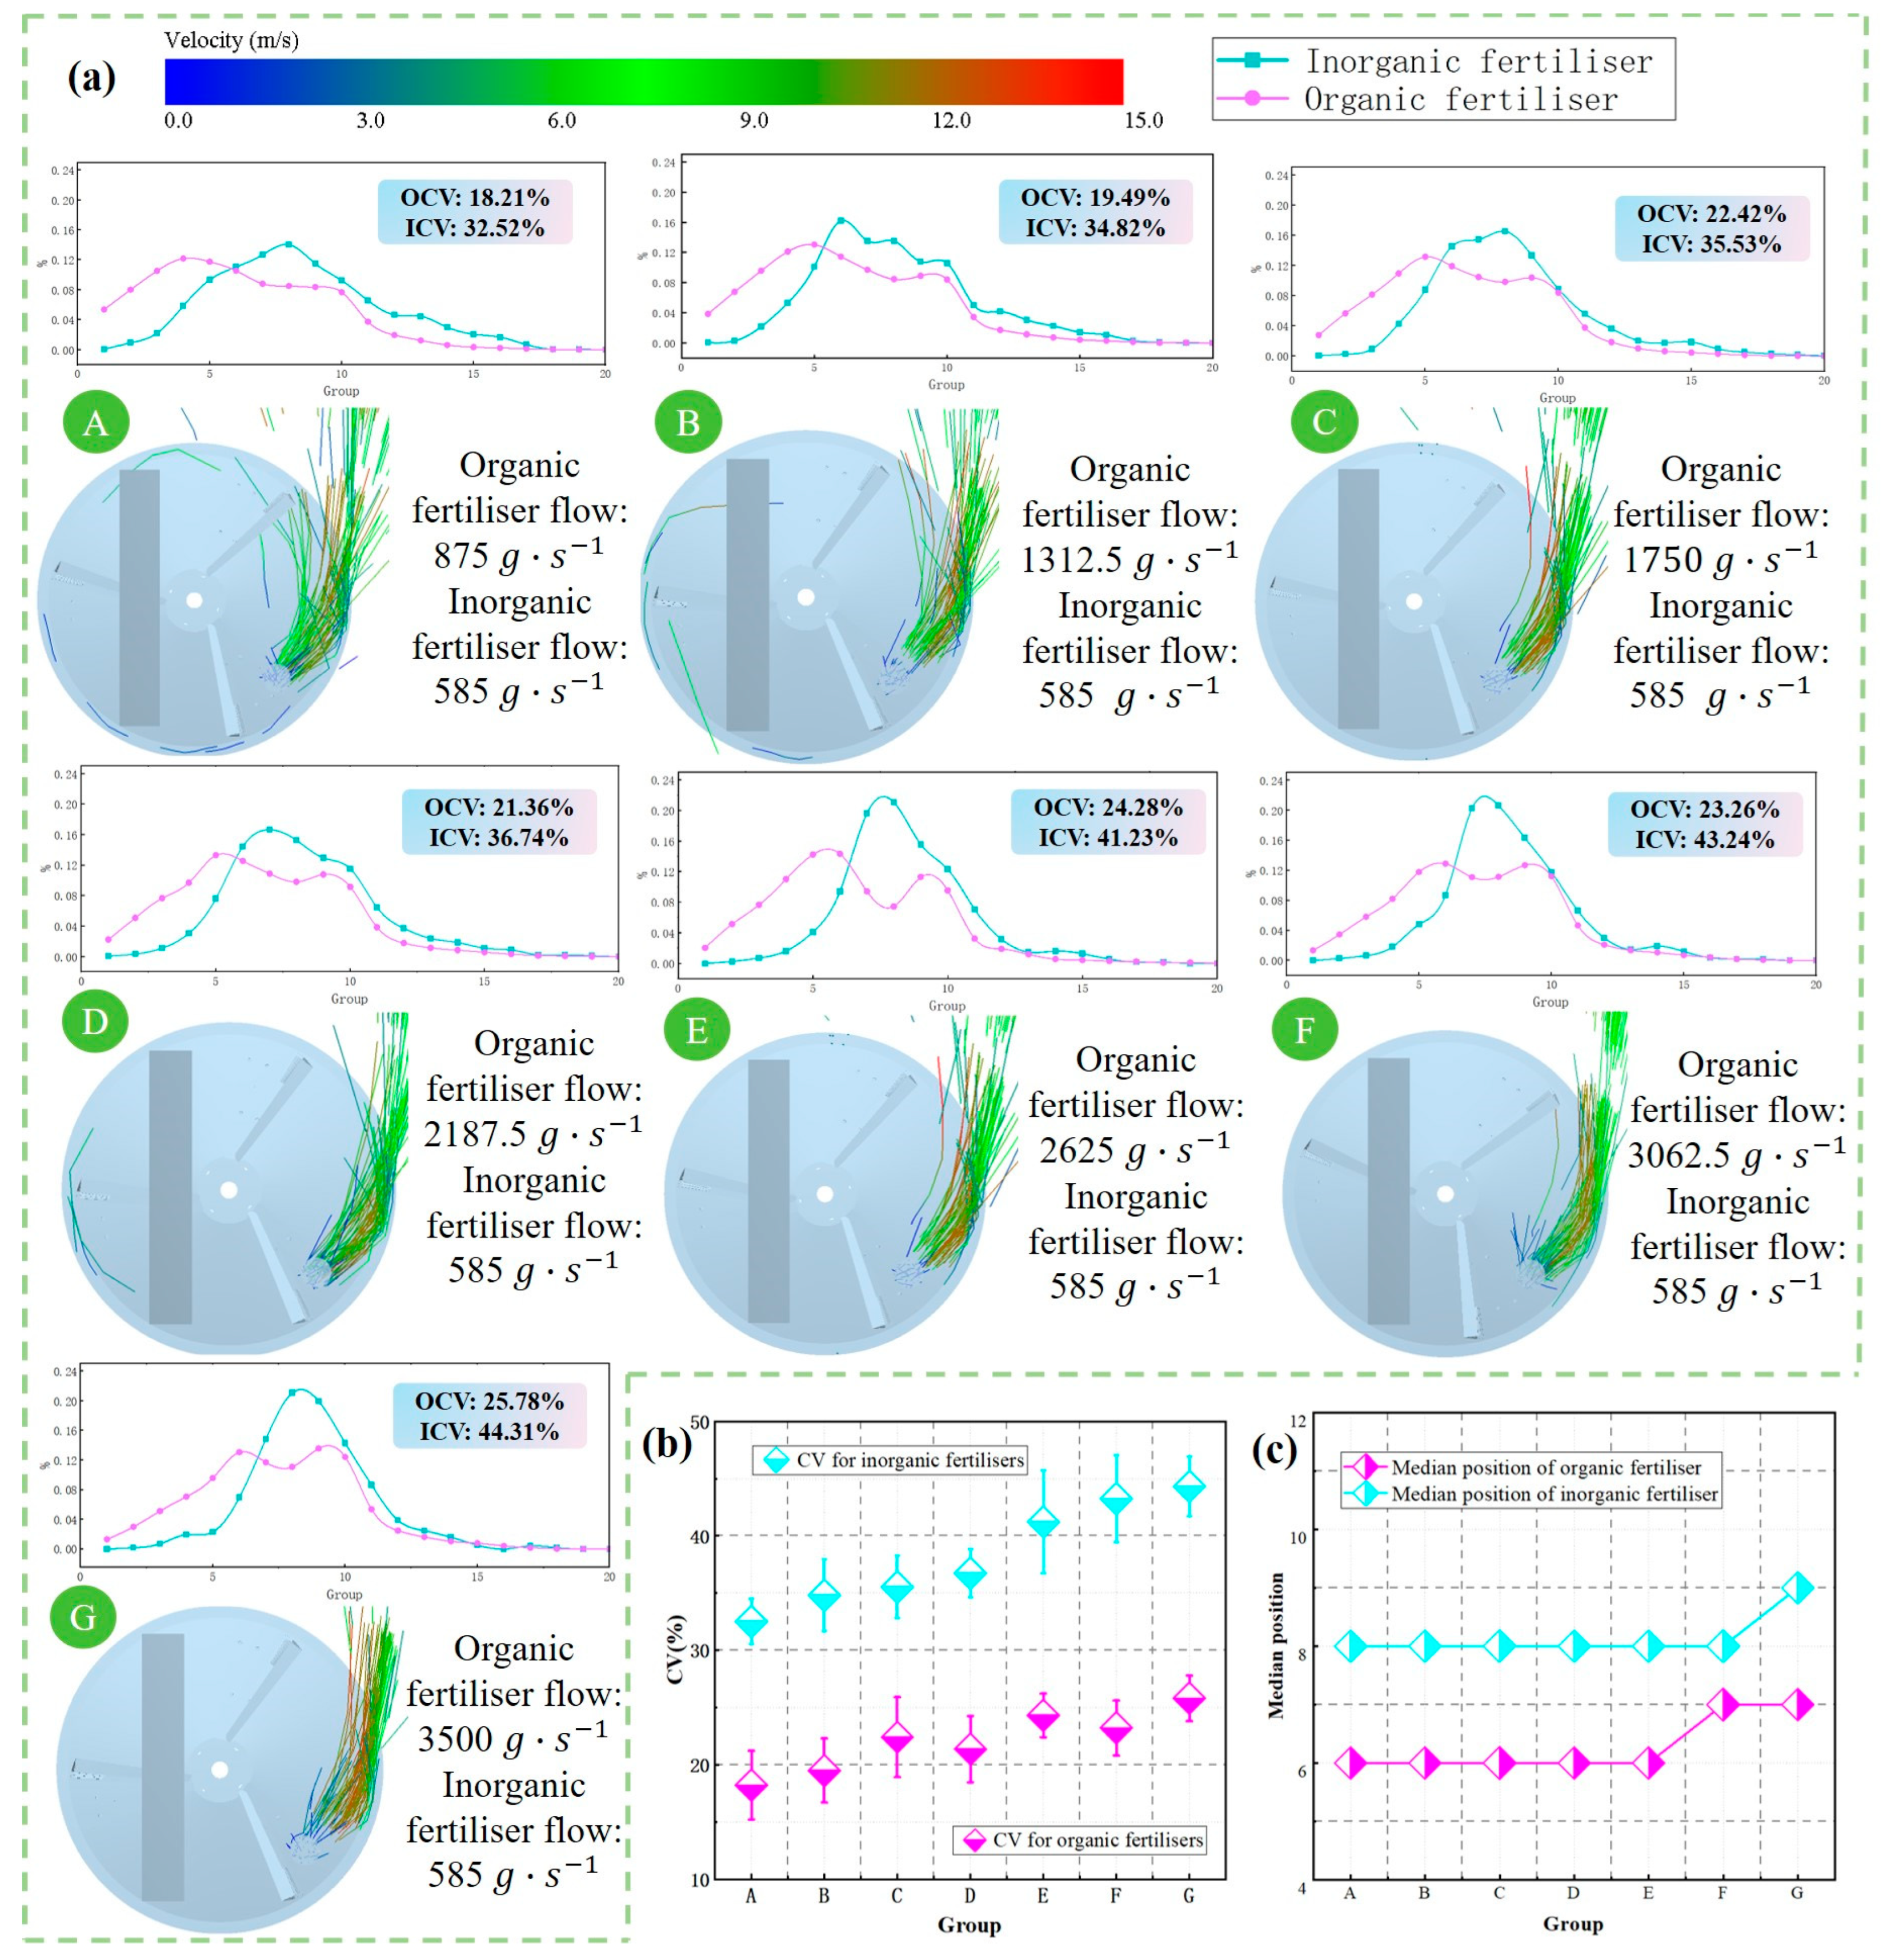
The required amount of organic fertiliser differed for different plots; therefore, it is necessary to study the effect of organic fertiliser flow on inorganic fertiliser in the dispensing machinery. The organic fertiliser is designed with 6 gradients, in which the amount of inorganic fertiliser is always constant at 585 g·s−1, and the organic fertiliser is designed with 7 gradients of 875–3500 g·s−1, which covers the organic fertiliser in most areas. The location of inorganic fertiliser drop is the 7th location, and the speed of the fertiliser spreading disc is 400 r·min−1. Figure 8 demonstrates the distribution of organic and inorganic fertilisers with different organic fertiliser flow rates. The distribution of inorganic fertiliser is further away from that of organic fertiliser. The distribution of organic fertiliser shows a bimodal distribution, with the first peak around column 5 and the second peak around column 10. Inorganic fertiliser shows a single-peak distribution, with the peak location around column 8. With an increase in the amount of organic fertiliser, the inorganic fertiliser jet gradually concentrates to the periphery of the spreading disc (Figure 8a). This results in the distribution curve of the inorganic fertiliser presenting a higher and narrower distribution characteristic, leading to an increase in the CV of the inorganic fertiliser.
When the flow of organic fertiliser is high, the activity of inorganic fertiliser is limited under the effect of centrifugal movement, and it can only be wrapped up by organic fertiliser up to the periphery of the fertiliser spreading disc, where they are thrown out together. When the flow of organic fertiliser is low, there is sufficient space for inorganic fertiliser particles to move; the inorganic fertiliser is in direct contact with the granular fertiliser spreading discs and is more dispersed in the collision; thus, the distribution of inorganic fertiliser is more dispersed. As shown in Figure 8b, the CV of the organic fertiliser uniformity were all low, and the CV of the inorganic fertiliser increased gradually with an increase in the organic fertiliser flow rate. Further, Figure 8c shows the median values of organic and inorganic fertiliser to be in the ranges of 6–7 and 8–9, respectively.
Taken together, the organic fertiliser flow rate can affect the movement of inorganic fertiliser on the disc, which in turn can affect the spreading of the inorganic fertiliser.

3.2.2. Effect of Inorganic Fertiliser Percentage on Inorganic Fertiliser Uniformity

The proportions of organic and inorganic fertilisers differ for different plots; therefore, it is crucial to study the effect of the proportion of inorganic fertiliser on uniformity when the total flow rate is fixed. Given the spreader’s minimum speed (2 km·h−1) and typical organic fertiliser application rate (7500 kg·ha−1), the minimum organic fertiliser flow rate is 3210 g·s−1, which was therefore set as the constant total flow rate for all trials. Based on this, five one-way gradient trials were conducted with inorganic fertiliser proportions of 10%, 20%, 30%, 40%, and 50%, a fixed inorganic fertiliser drop location (location 7), and a disc rotational speed of 400 r·min−1.
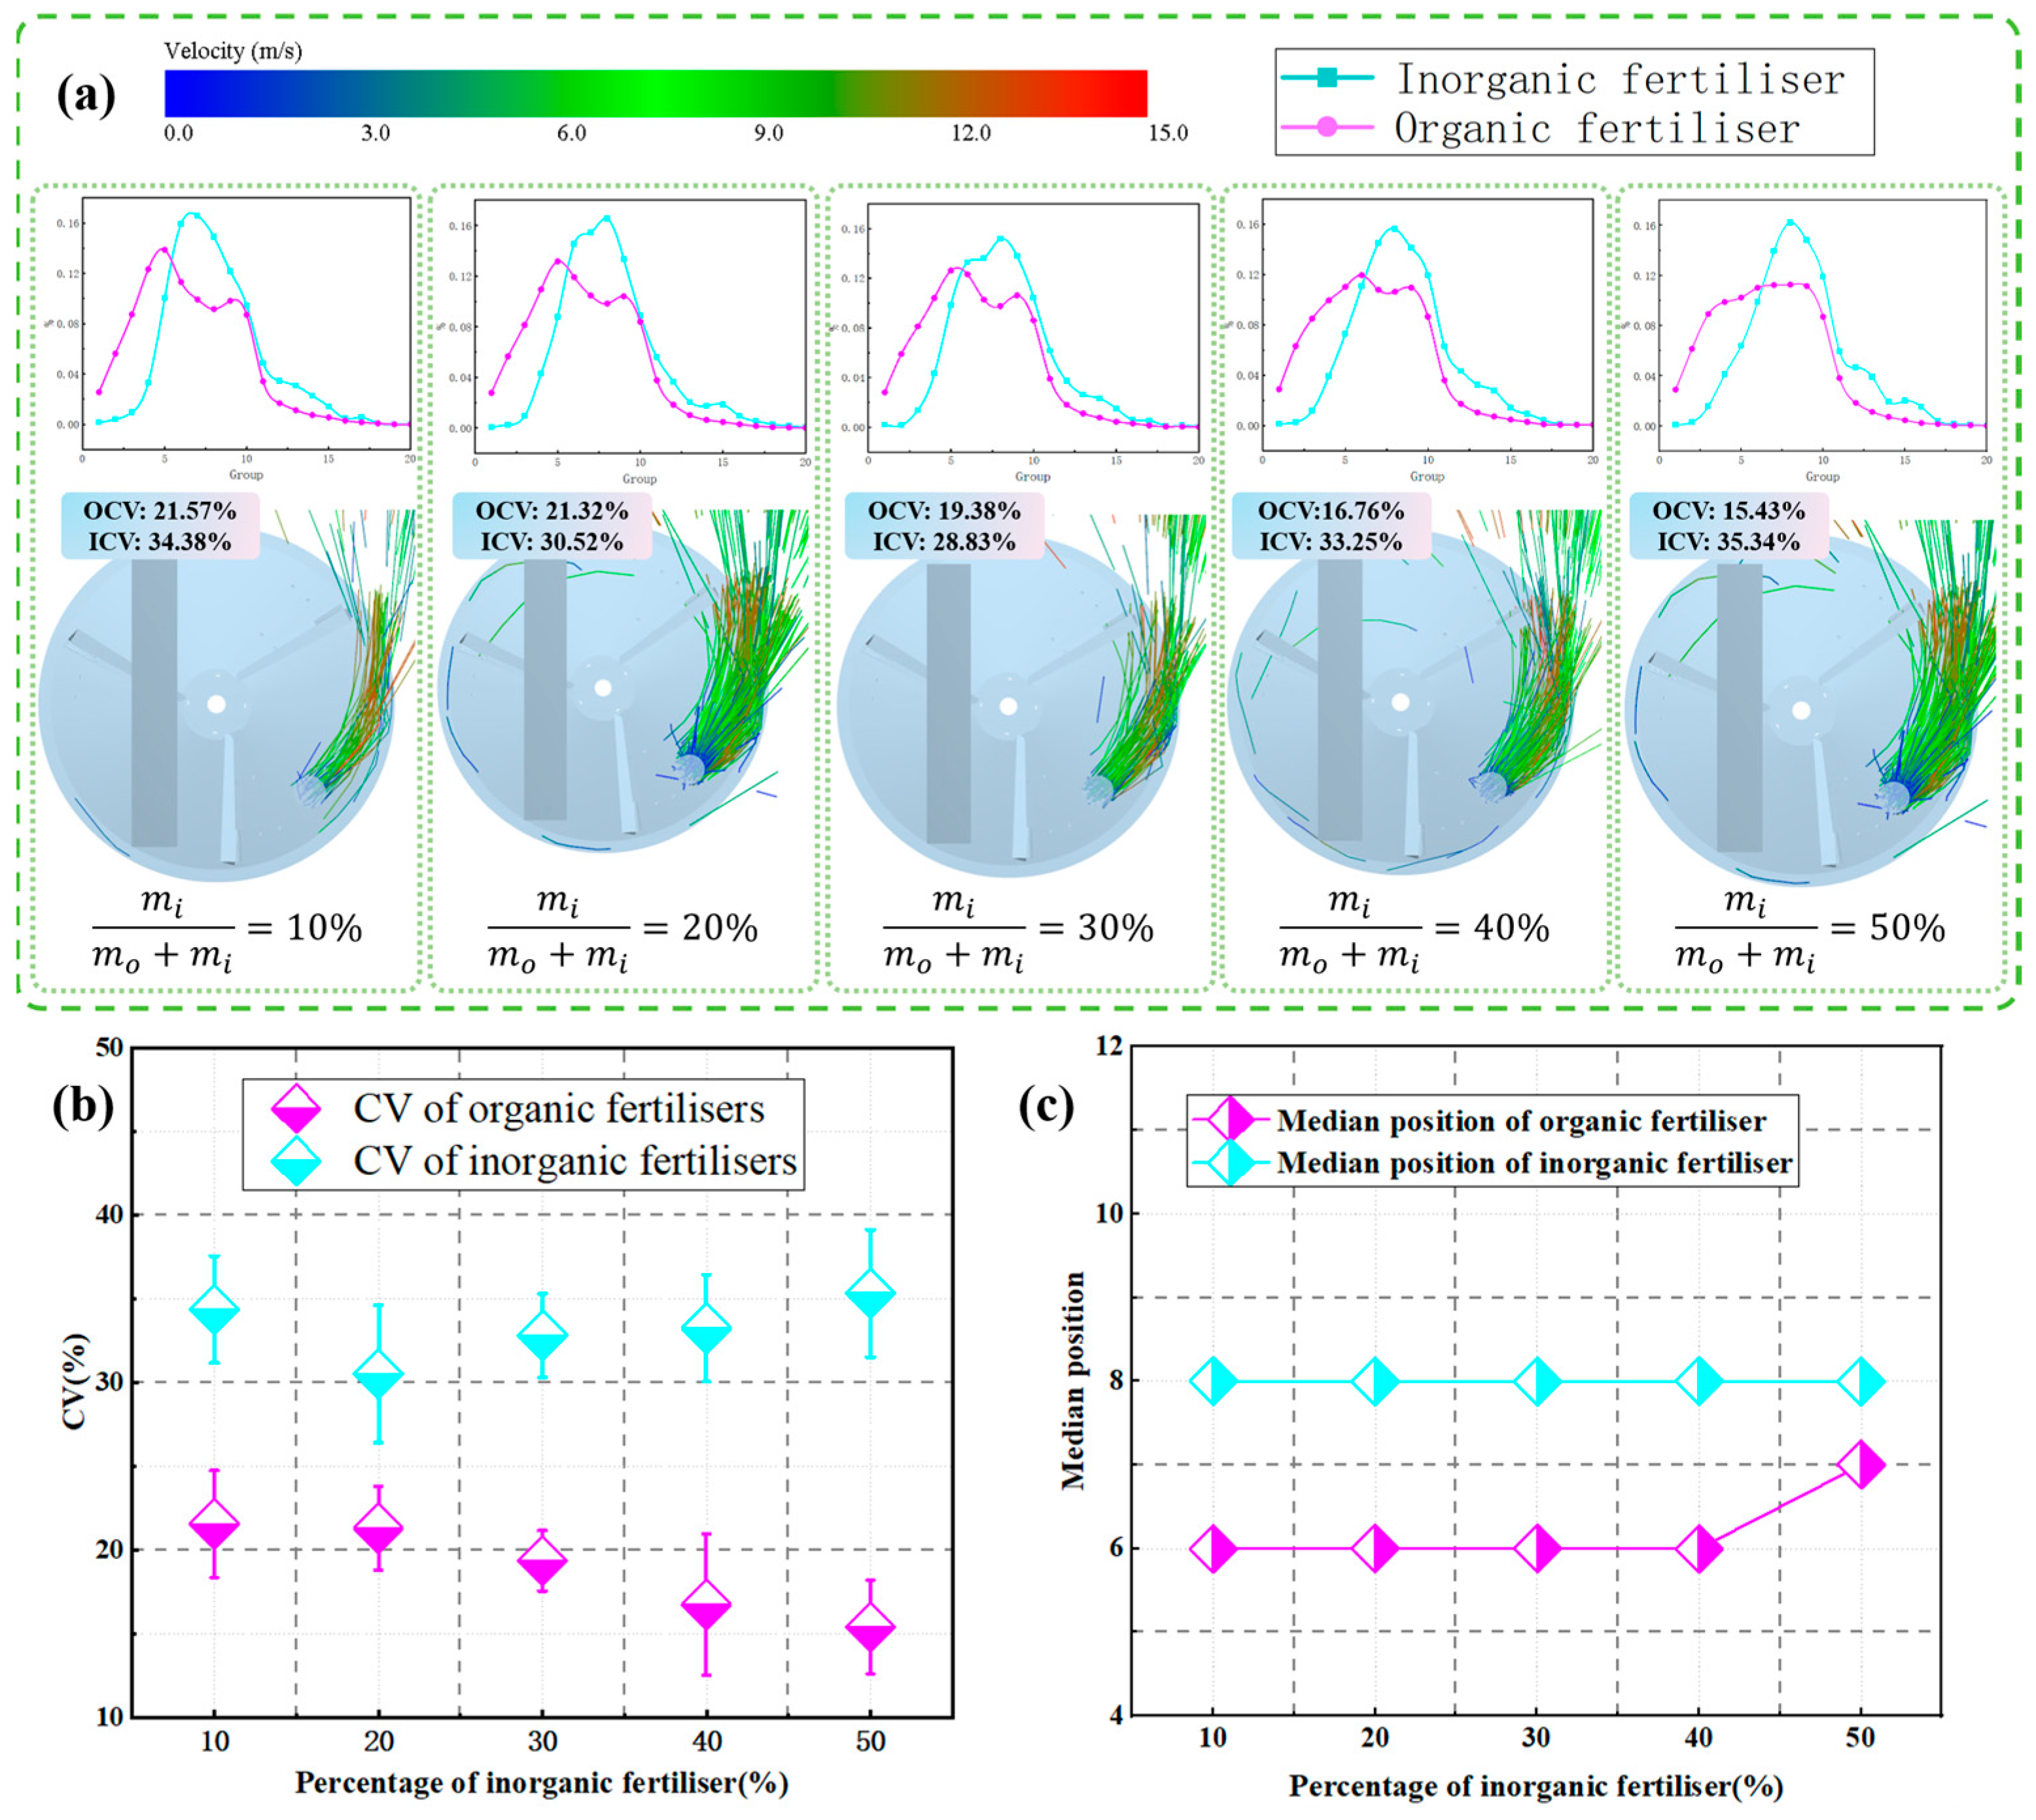
As shown in Figure 6a, the organic fertiliser distribution peak is ahead of the inorganic fertiliser peak, with the former being bimodal and the latter unimodal. Increasing the inorganic fertiliser proportion reduces the prominence of the organic fertiliser’s bimodal peaks (Figure 9c), thereby lowering the organic fertiliser’s CV. As shown in Figure 9a, the inorganic fertiliser flow width increases with its flow rate. However, this widening does not reduce the inorganic fertiliser’s CV (Figure 9b).
In summary, for a 550 mm diameter spreading disc, adjusting the inorganic fertiliser proportion (even up to 50%) has no significant effect on uniformity. It should be noted that if the diameter of the spreading disc is reduced, the impact of this parameter may become significant. In conjunction with Section 3.2.1, only a change in the amount of organic fertiliser can alter the contact and movement dynamics within the spreading discs, which in turn affects uniformity.

3.2.3. Effect of Rotational Speed of Fertiliser Spreading Discs on the Uniformity of Inorganic Fertilisers

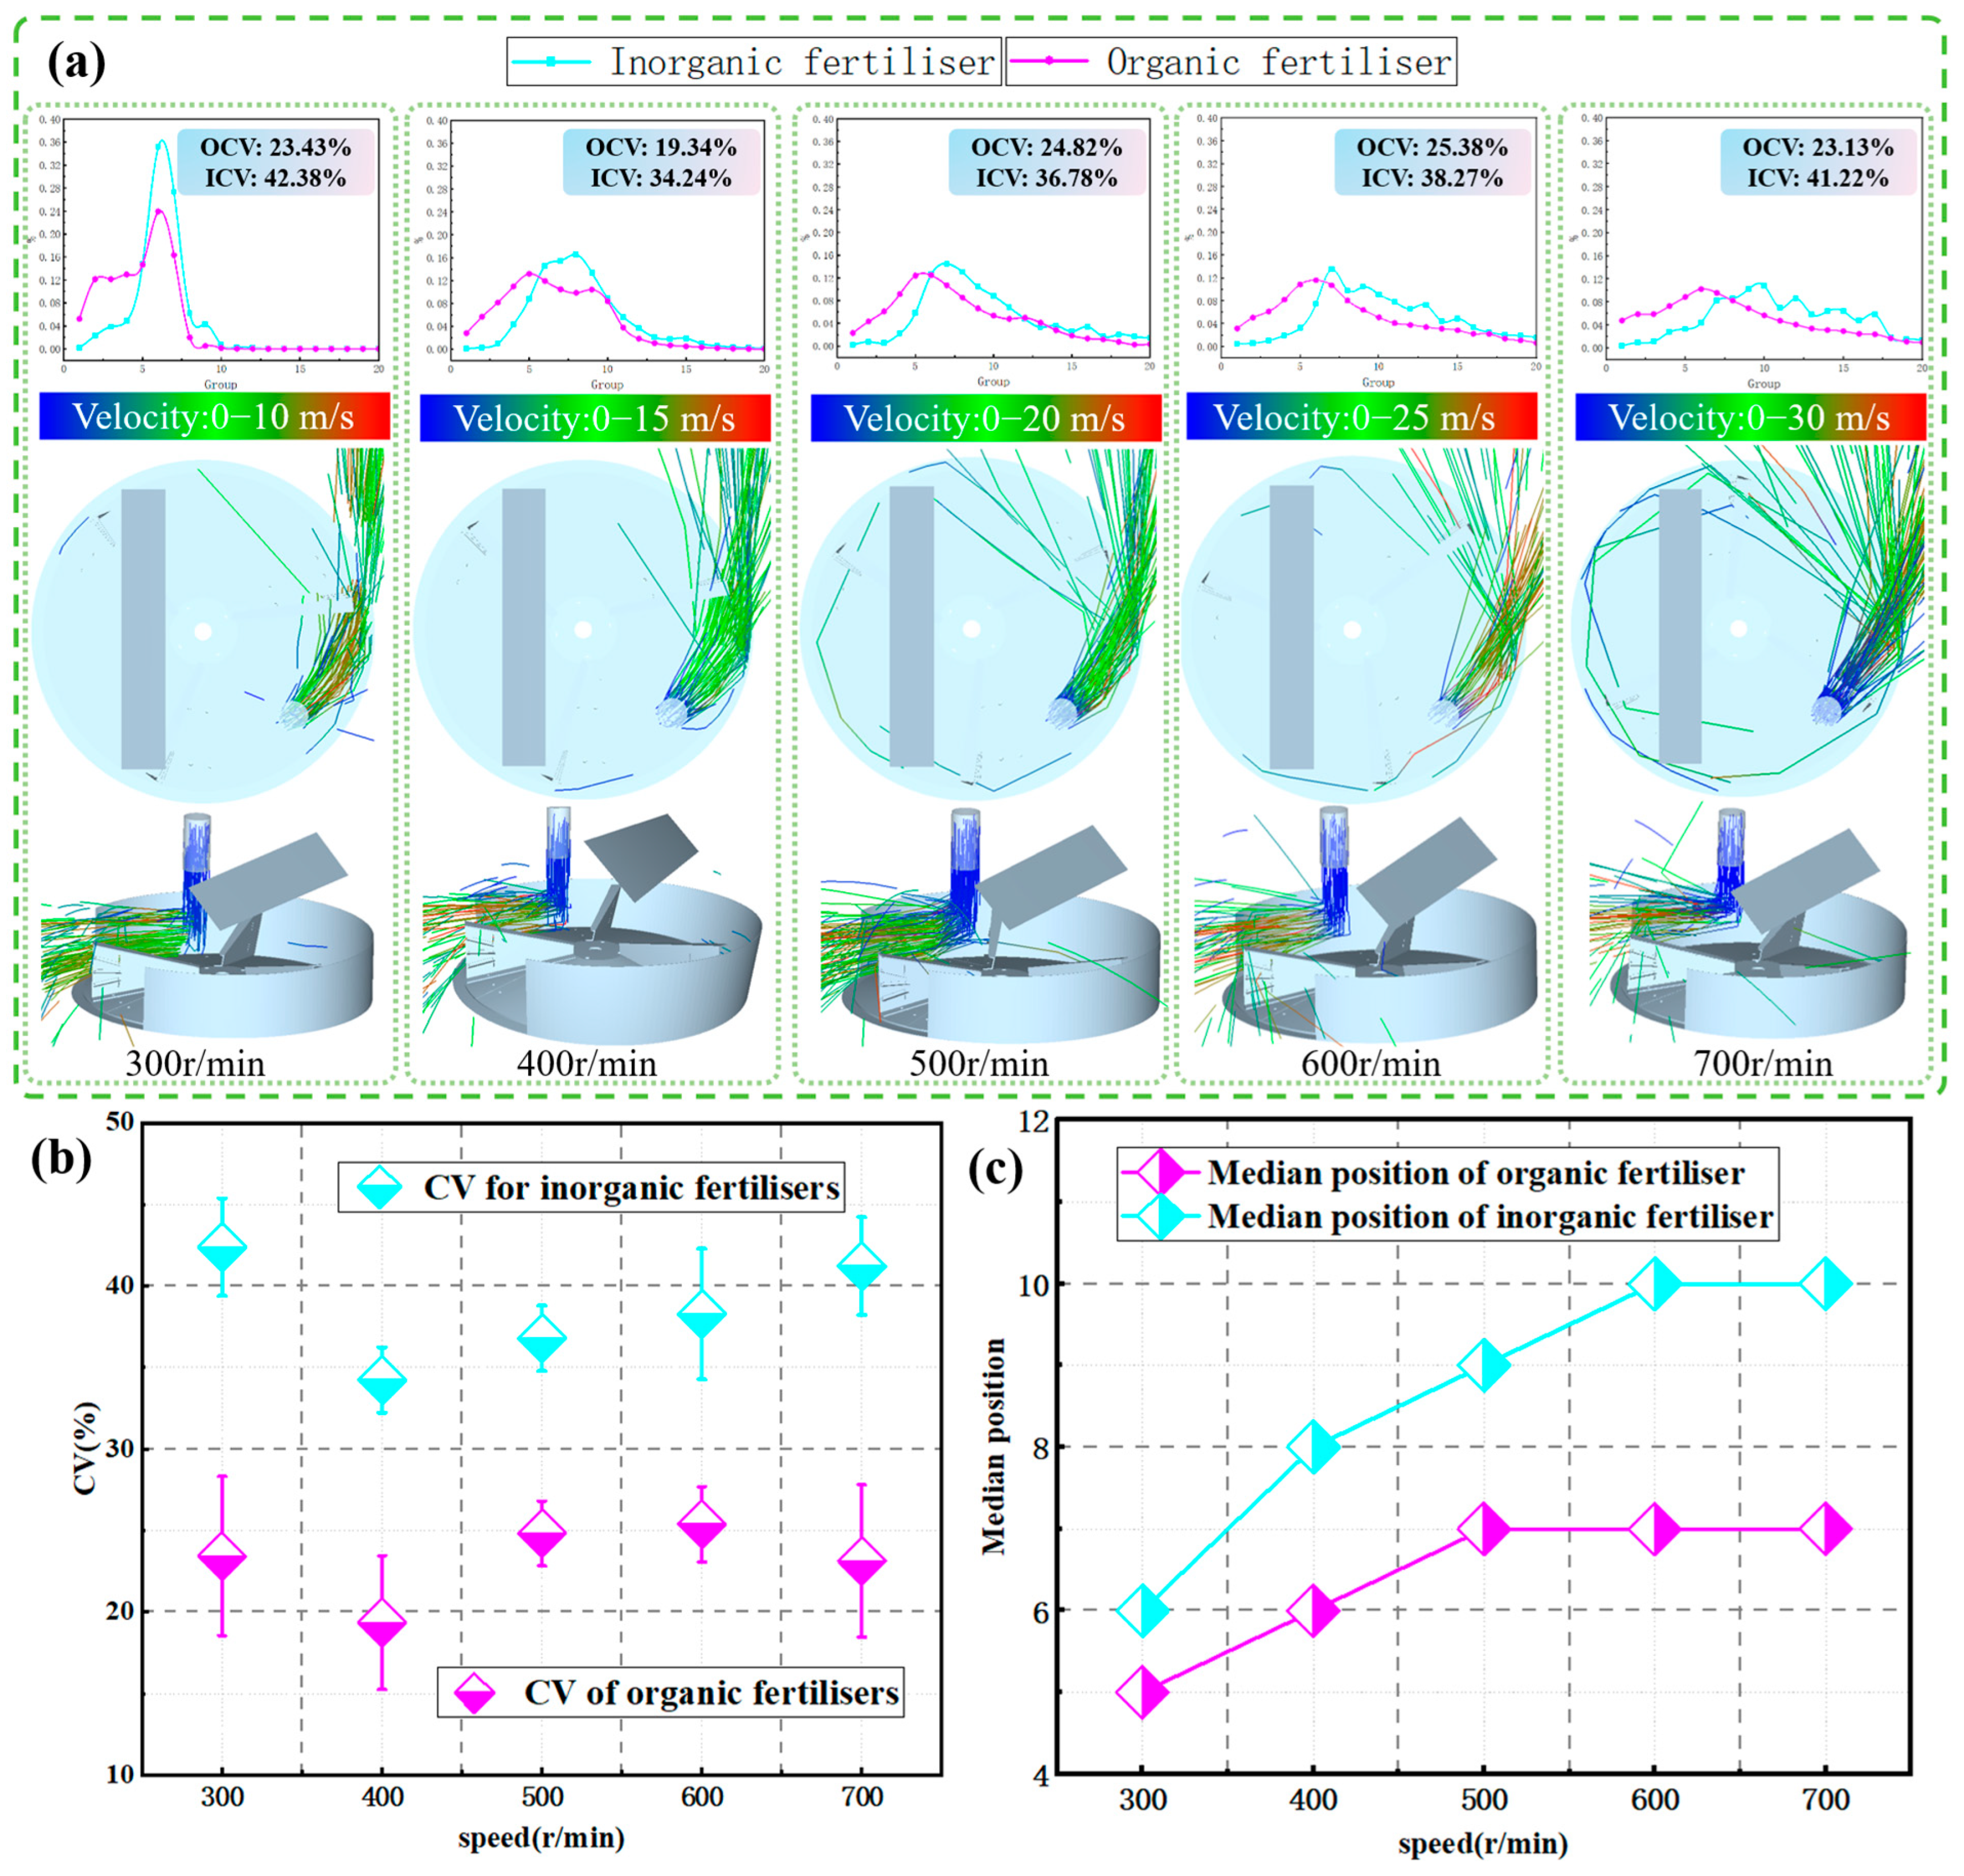
The effective width of the organic fertiliser spreader is designed to be 3–5 m, and the corresponding rotational speed of the spreading disc is 300–700 r·min−1. Therefore, a one-factor test of the rotational speed of the spreading disc was designed with five gradients set from 300 to 700 r·min−1 in increments of 100 r·min−1. The fertiliser drop location was location 7, the power of the organic fertiliser was 2187.5 g·s−1, and that of the inorganic fertiliser was 585 g·s−1. Figure 10 shows that with an increase in the rotational speed, the peak value of the distribution of organic fertiliser is basically unchanged. Meanwhile, as the peak value decreases, the effective width gradually increases. With an increase in the rotational speed, the peak of the inorganic fertiliser clearly moves to the right. At 400 r·min−1, the peaks of the distributions of organic and inorganic fertiliser basically overlapped, and then the gap between the two peaks gradually increases thereafter. From the median changes in the distributions of organic and inorganic fertiliser in Figure 10c, it can also be seen that the median of the organic fertiliser is located in columns 5–7, with little change, but the distribution of inorganic fertiliser changed significantly, showing an upward trend.
From the screenshots of the discrete element simulation process, the distribution of inorganic fertiliser particles inside the spreading disc changes significantly with an increase in rotational speed. At low rotational speed, the inorganic fertiliser is rotated and piled up in the gap between the fan blade and guard plate, and the inorganic fertiliser is spread within a closer distance; even if some organic fertiliser is spread by the fan blade, it will be distributed closer owing to the low rotational speed of the fan blade and low initial speed, at which time the peak value is higher. When running at medium speed (400–600 r·min−1), part of the inorganic fertiliser fills the gap between the fan blade and guard plate gap and part is thrown out by the fan blade, with a ratio of close to 1:1; the former is distributed nearby, and the latter is distributed in farther away. At this time, the peak value is significantly lower, accounting for only 16% of the total inorganic fertiliser volume. With a further increase in the rotational speed, the proportion of organic fertiliser thrown from the fan blade increases; there is no obvious peak, the distribution is more uniform, and the effective width increases. In summary, the rotational speed of the spreading disc has a significant effect on the distribution of inorganic fertiliser in this spreading structure.

3.2.4. Effect of Inorganic Fertiliser Drop Location on Uniformity

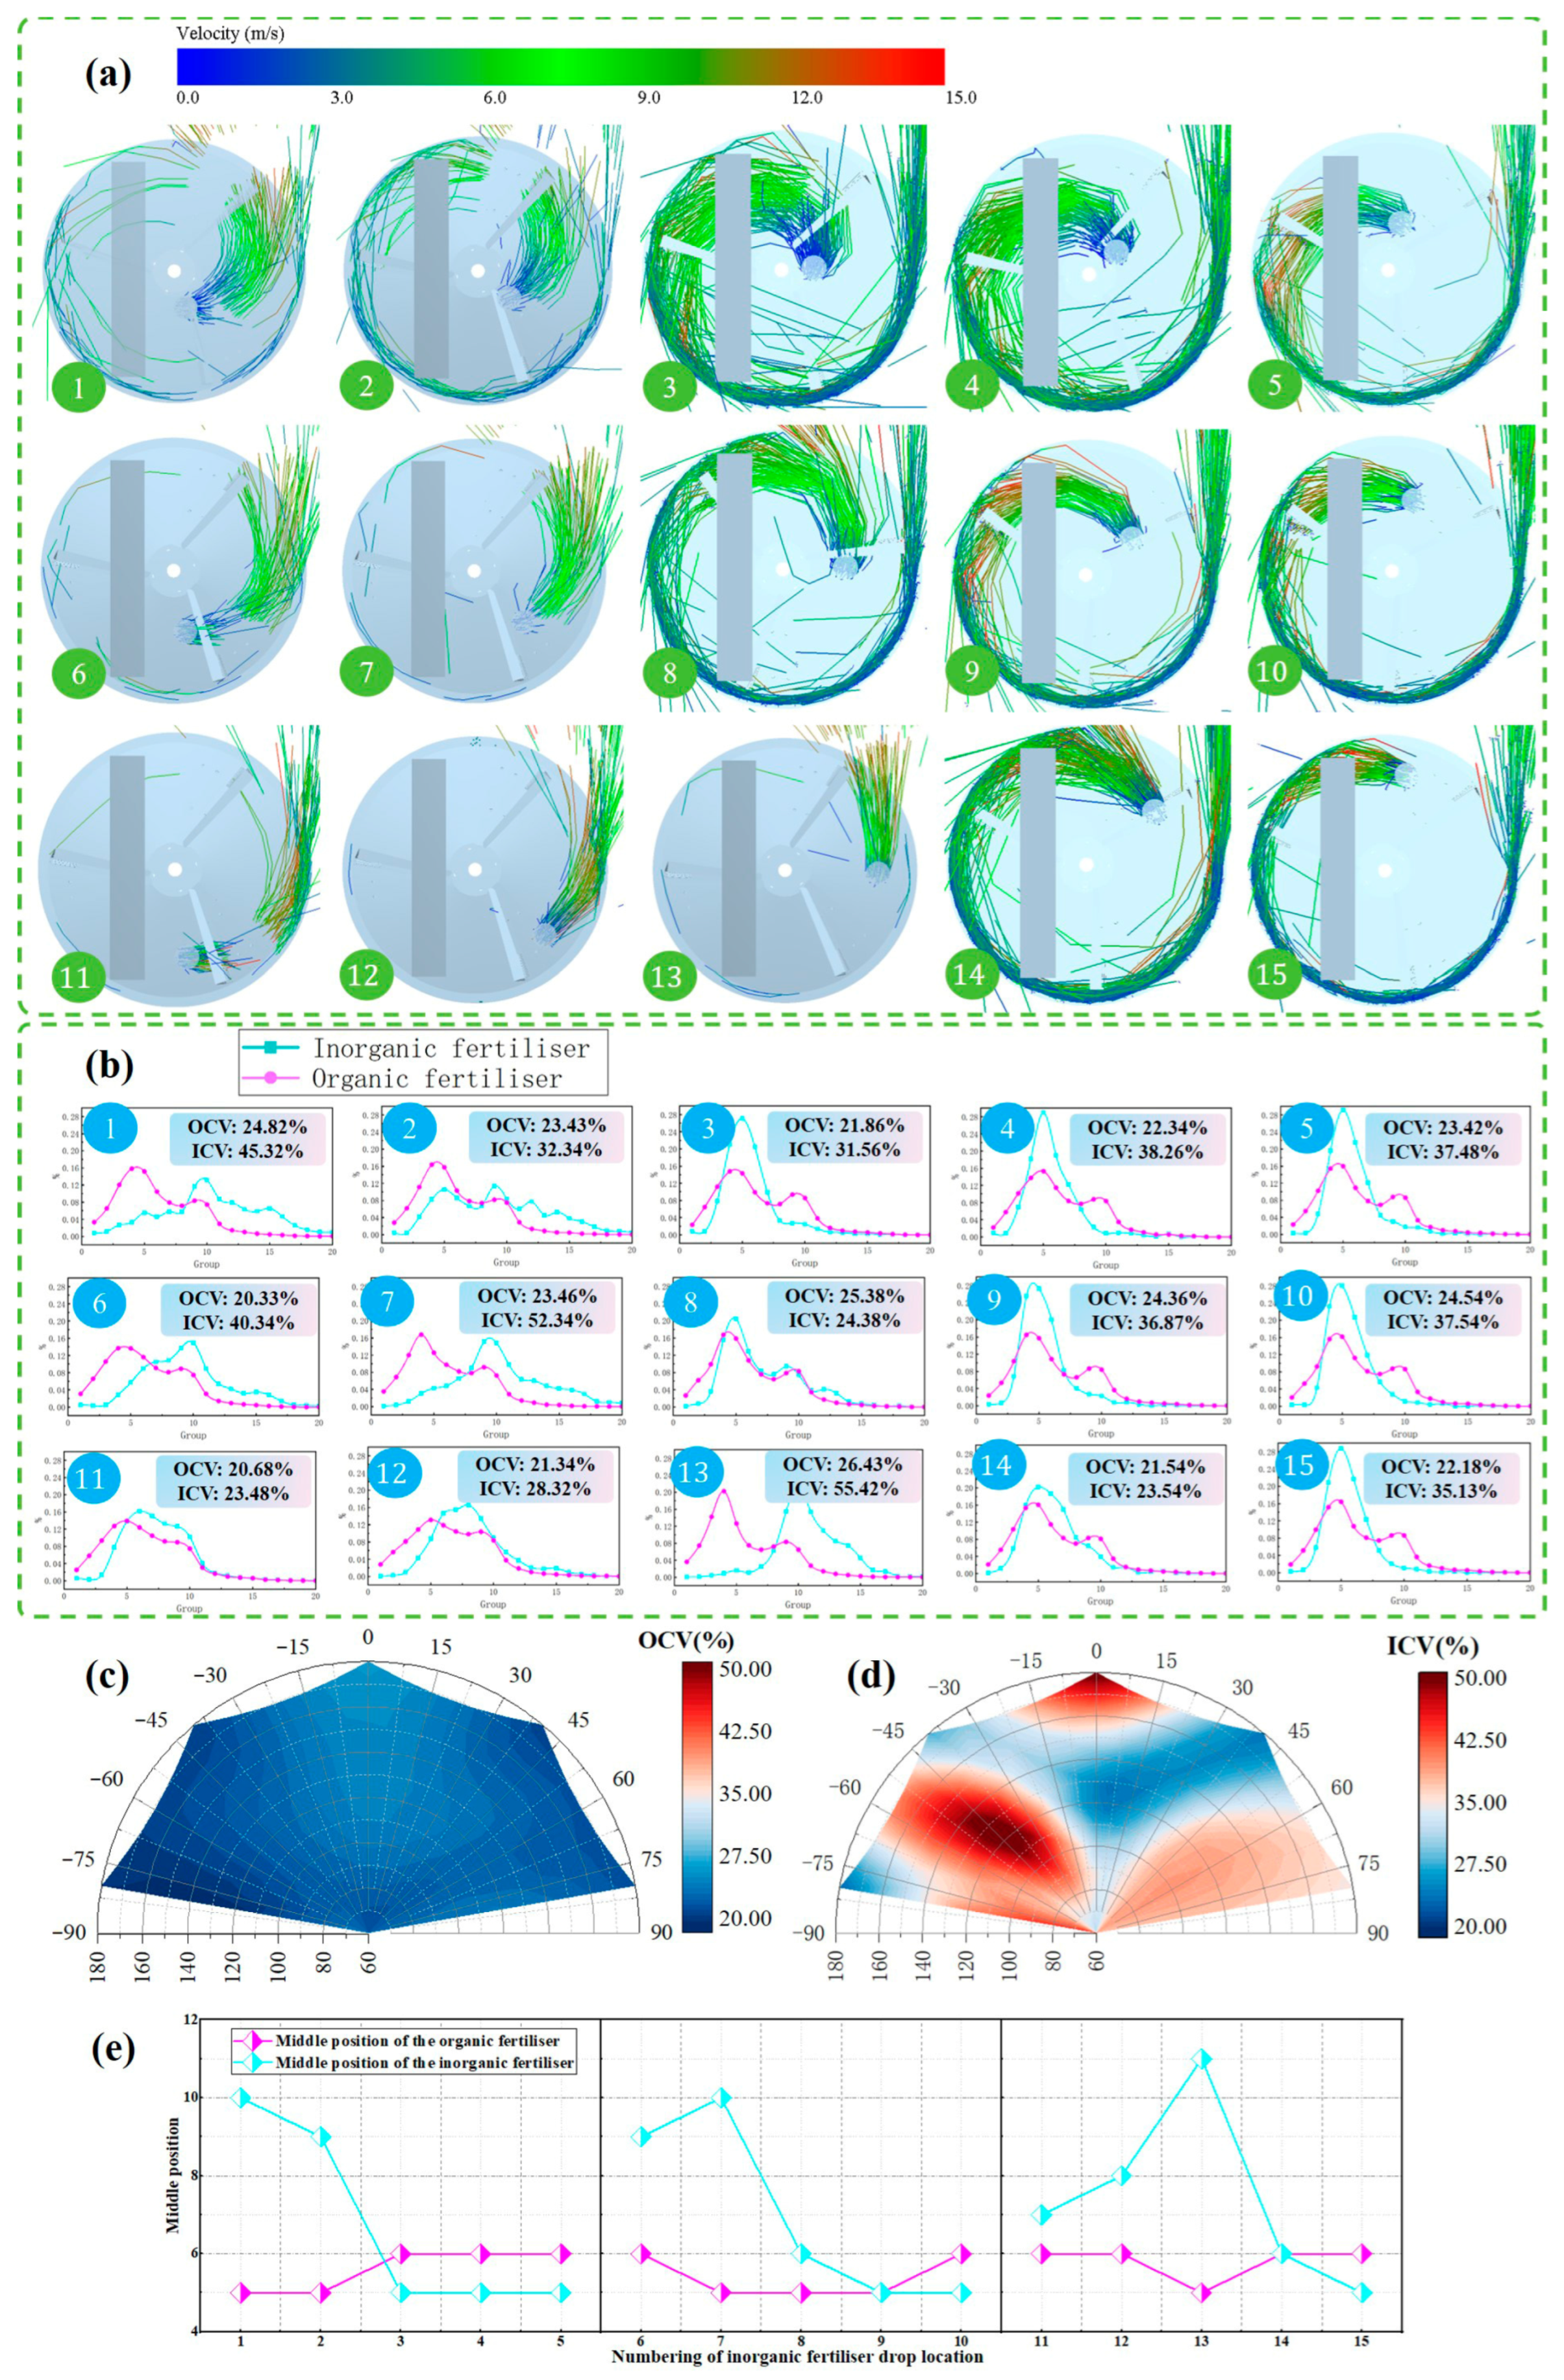
In this study, the design of the fertiliser spreader corresponds to a circumferential angle of 160° in the effective fertiliser drop area, with a range of polar diameters of 60–180 mm. The diameter of the inorganic fertiliser drop port is 45 mm. As shown in Figure 6b, 15 fertiliser drop locations are designed in the effective fertiliser drop area. The state of the inorganic fertiliser jet can be divided into three categories (Figure 11a): (1) The inorganic fertiliser is thrown out through the outlet of the fertiliser spreading disc under the action of the fan blade. At this time, the distribution of inorganic fertiliser is concentrated in a more distant location, such as the 13th location. (2) All the inorganic fertiliser is thrown out to the periphery before leaving the disc and thrown out through the gap between the disc and guard plate with the driving force of organic fertiliser; at this time, the distribution of organic fertiliser is concentrated in a closer location, such as location 3. (3) The excessive version of the first and second categories, which can be divided into two sub-categories.
The first is similar to locations 2 and 8; this situation is where part of the inorganic fertiliser fills the gap between the fan blade and guard plate and part of the inorganic fertiliser is thrown out by the fan blade. The other is similar to locations 11 and 12, where part of the inorganic fertiliser from the gap is thrown out, followed by part of the inorganic fertiliser by the fan blade. The existence of the above three situation categories causes a large difference in the ICV (ICV: 23.48–52.34%). In summary, the inorganic fertiliser distribution CVs for the third category are all low under the current speed and flow conditions, whereas the CVs for the first and second categories are both high, exceeding 50%. The distribution of inorganic fertiliser in the third category is similar to that of organic fertiliser, and the CV calculated in this study for the effective width of organic fertiliser is better.
In contrast, the OCV distribution was low for different inorganic fertiliser drop locations (Figure 11c,d), with only OCV (location 13) = 26.43%. This is because the inorganic fertiliser drop location is exactly at the exit, which blocks the inorganic fertiliser from being thrown far away, resulting in a significant reduction in organic fertiliser at the far end. Overall, as the OCV is low, the inorganic fertiliser drop location does not have a significant effect on the distribution of organic fertiliser.
As shown in Figure 11e, the location of the median organic fertiliser does not vary much, further indicating that the distribution does not vary much; however, the location of the median inorganic fertiliser varies significantly, further indicating that the distribution of inorganic fertiliser is significantly affected by the location. At the same time, in general, the CV of the distribution of inorganic fertiliser is also smaller when the locations of the median distributions of inorganic and organic fertiliser are closer to each other. Special cases are discussed below.

3.2.5. Discussion on the Location of the Fertiliser Drop

The above one-way test indicates that the percentage of inorganic fertiliser does not significantly affect the distribution of inorganic fertiliser; the organic fertiliser flow rate and speed of the spreading disc affect the distribution of both inorganic and organic fertilisers; the location of the inorganic fertiliser drop almost exclusively affects the inorganic fertiliser. Three representative cases are presented in Appendix A to illustrate how adjusting the fertilizer drop location can achieve better inorganic fertilizer distribution.
Based on these three cases, the organic fertiliser flow rate, rotational speed of the spreading disc, and inorganic fertiliser drop location all affect the distribution of inorganic fertiliser and the CV, and there is an obvious interaction between these three factors. Under different combinations of rotational speed and organic fertiliser flow rate, an optimal fertiliser drop location is likely to make the inorganic fertiliser distribution more uniform, as quantitatively determined in the following experiments.

3.2.6. Optimisation Test Results

The pre-tests found that if the range of polar angles (−80°, 80°) is followed, then the model fits poorly and lacks generalisation by forcing it to be fitted with a higher-order equation. The main reason for this is that the location of different organic fertiliser drops does not continuously change, and there are abrupt changes, such as at locations 7 to 8. Therefore, dividing the fertiliser drop area into two parts, (−80°, 0°) and (0°, 80°), and fitting the mathematical model separately is expected to achieve better results (Table 4).
The analysis of variance of the established regression model (Table 5 and Table 6) indicates that the F-values of the two models are 41.79 and 35.31, respectively, which implies that the model is significant. There is only a 0.01% chance that an F-value this large could occur due to noise. The coefficients of determination (R2) for the two models are 0.9766 and 0.9684, respectively, indicating that the regression models are consistent with the results of the Box–Behnken design test. Meanwhile, the values of appropriate precision were 21.6183 and 24.590, respectively; according to the instructions of the Design-Expert 13 software, “sufficient precision” to measure the signal-to-noise ratio usually requires a value greater than 4. The values of adequate precision in the model indicate that the model has good reliability. The regression equation exhibited good reliability.
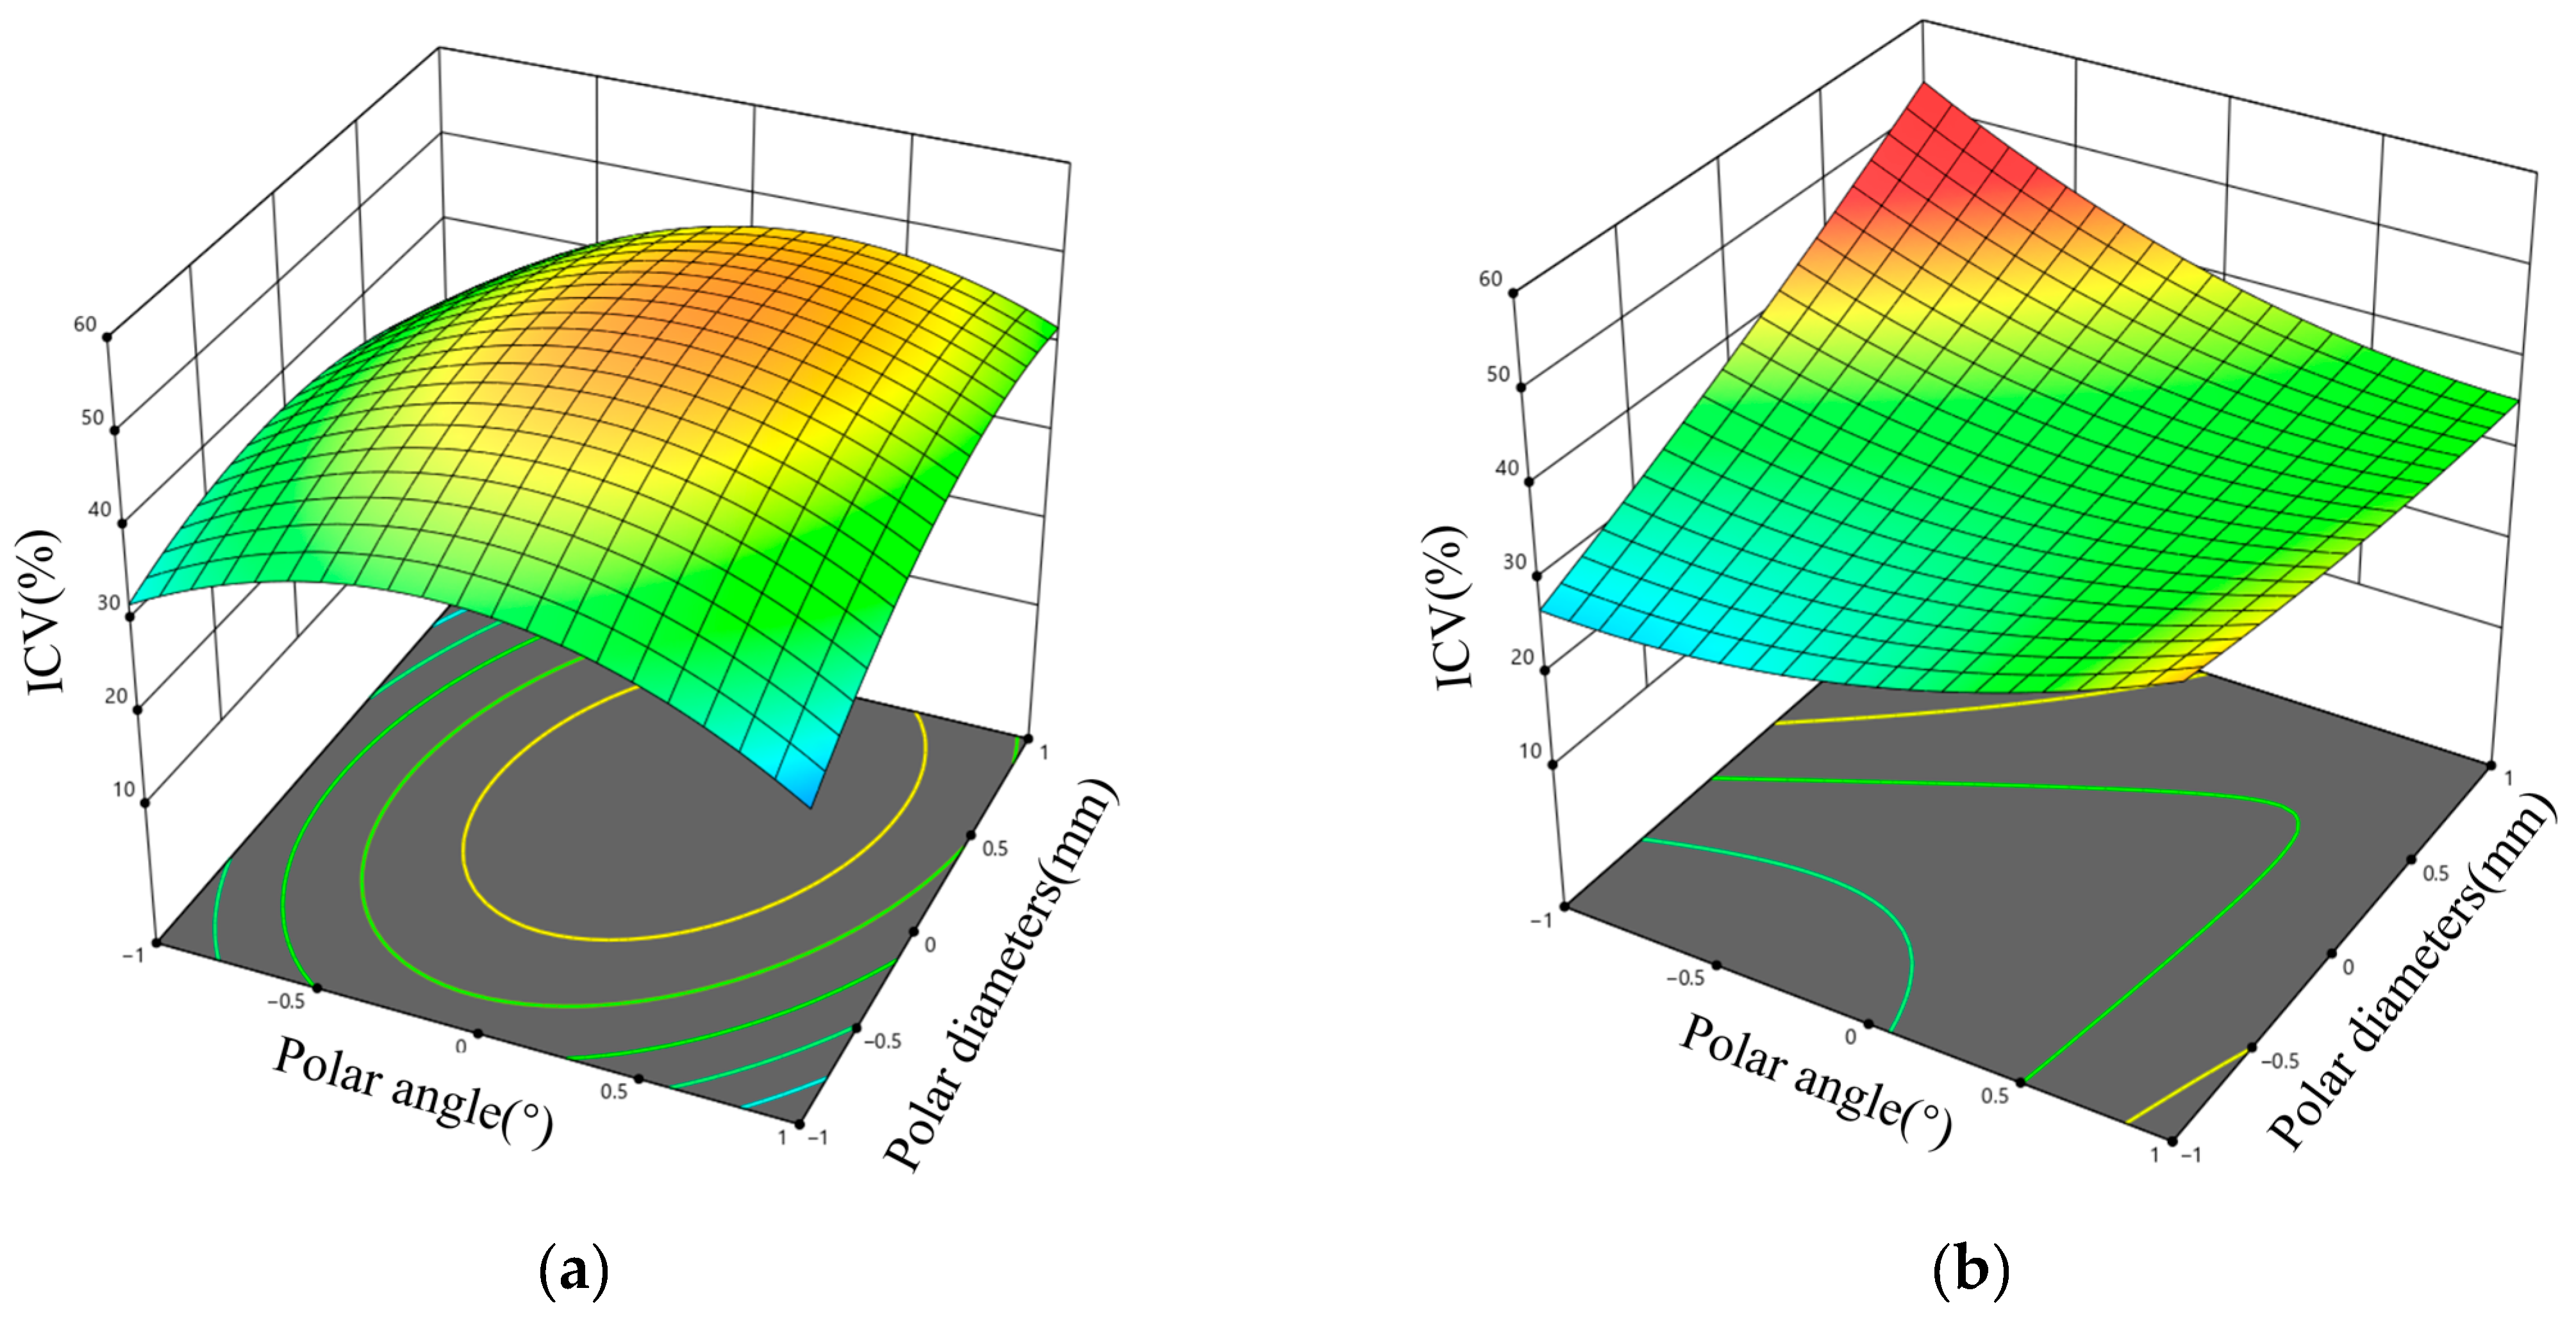
As shown in Figure 12, the variation in the inorganic fertiliser CV under different fertiliser drop locations followed a similar trend to the one-factor experiment, while a better simulation effect was achieved using quadratic polynomial fitting. Table 5 shows that some interaction and quadratic terms are not significant (p > 0.05). After eliminating the non-significant terms, the final two regression models were obtained as follows:
I C V L = 52.09 1.98 A 1.41 B 1.74 C + 2.22 D + 3.05 A C   + 7.81 B C + 1.45 B D + 3.86 C D 9.50 A 2 9.50 B 2   10.23 C 2 5.49 D 2
I C V R = 32.11 0.08 A 0.21 B + 3.02 C + 1.26 D + 1.01 A B   0.84 A C 2.95 A D + 3.44 B D 5.06 C D + 0.53 A 2   0.62 B 2 + 2.21 C 2

3.2.7. Validation of Optimal Parameter Combinations

To verify the correctness of the regression model obtained from the simulation test, four representative operational parameters were selected for the test in this section: low rotational speed (400 r·min−1)–low flow rate (1500 g·s−1), high rotational speed (600 r·min−1)–low flow rate (1500 g·s−1), low rotational speed (400 r·min−1)–high flow rate (2800 g·s−1), and high rotational speed (600 r·min−1)–high flow rate (2800 g·s−1). The four operating parameters are introduced into the two regression models, and the optimisation objectives are
A = A t a r g e t B = B t a r g e t C r a n g e D r a n g e min I C V , I C V I C V L , I C V R
where A t a r g e t is the target value of rotational speed, and B t a r g e t is the target value of the organic fertiliser flow rate, as in the four sets of tests in Table 7.
Through the optimisation of two regression models, two sets of optimal pole angles (C) and pole diameters (D) were obtained. Each set of tests was repeated three times for each condition to ensure accuracy, followed by the calculation of both OCV and ICV. Additionally, a control group was established for each experimental set, where the inorganic fertiliser drop location remains non-optimised and is fixed at location 7 (pole angle −40°, pole diameter 120 mm). The control group tests were also conducted three times for consistency, and the CVs (denoted as OCV’ and ICV’) were calculated accordingly. This rigorous methodology ensures a comprehensive evaluation and comparison of the optimised and non-optimised configurations.
From the results of the experiment, O C V ¯ = 16.98 % and I C V ¯ = 32.21 % , while O C V ¯ = 16.79 % and I C V ¯ = 21.92 % . The CV of organic fertiliser remained basically stable, and the average CV of inorganic fertiliser decreased by 10.29%.

3.3. Discussion

The uniformity of inorganic fertiliser represents a pivotal constraint impeding the dissemination of techniques for the application of blended organic–inorganic fertilisers. In this study, we examined the mixing mechanics of inorganic and organic fertilisers on a spreading disc. We elucidated the interplay among the locationing of inorganic fertiliser droplets, the flow rate of organic fertiliser, and the rotational velocity of the spreading disc, in addition to their collective influence on the coefficient of variation in uniformity. The field trial demonstrated that the mean coefficient of variation ( O C v ¯ ) for organic fertiliser amounted to 16.79%, fulfilling the criterion stipulated in NY/T4366-2023 [35], which stipulates a maximum value of 30%. Furthermore, this O C v ¯ figure aligns with the highest tier of comparable products [16]. Additionally, the average coefficient of variation ( I C v ¯ ) for inorganic fertiliser was recorded as 21.92%, adhering to the standard outlined in GB/T 20346.1-2021 [36], which specifies a limit of 30%.
Although we have designed the fertiliser spreader to meet operational and extension requirements, there is still much to be done. Emphasis should be placed on intellectualization. The mathematical model presented in this study constitutes the cornerstone for the control system. Subsequently, the incorporation of sensor technology and intelligent control mechanisms can be envisioned, ultimately culminating in the design of a sophisticated organic–inorganic fertiliser mixer and spreader. This system will seamlessly integrate sensing and monitoring capabilities for the spreading disc’s rotational speed and organic fertiliser flow rate, coupled with model-based calculations for fertiliser drop locationing and motor-driven automatic adjustment of these locations.
Additionally, in the side-throwing fertilization process mentioned in Section 2.3, the velocity vector of fertilizer particles leaving the spreading disc (i.e., the initial angle φ and velocity V 0 ) determines their distribution. Besides the structure and rotational speed of the spreading disc, the forward speed of the spreader also affects this velocity vector—therefore, forward speed is indeed a parameter that requires attention. In the field experiments of this study, the machine was set to the middle position of gear 2, resulting in a forward speed of approximately 2.4 km·h−1. This setting prioritized operational efficiency, and this speed is relatively high for greenhouse environments. Future research will consider scenario-specific speed adjustments: for small arch sheds, the speed may need to be reduced, while for large fields, it could be increased, as these variations may affect uniformity. Additionally, unstable operational speed can disrupt the velocity vector of particles leaving the disc, so maintaining a stable speed during operation is recommended.
Lastly, It should be noted that this study has some limitations. (1) The model established only applies to our fertilizer spreading disc. Changing the structure of the spreading disc requires re-establishing the adjustment model for the inorganic fertilizer drop location. (2) The simulation model we established only considers the impact of the flow field on particles; in fact, particles also have an impact on the flow field. All the above aspects should be further studied in the future. (3) More advanced algorithms can be adopted in the establishment of the prediction model, which can further enhance the model’s generalization ability.

4. Conclusions

In this study, a coupled EDEM-Fluent model was developed to investigate the fertiliser distribution mechanism of an organic–inorganic spreader. The model incorporates the influence of air on both organic and inorganic fertilisers. The following conclusions were drawn:
Through a series of univariate tests, it was observed that the quantity of inorganic fertiliser, rotational velocity of the spreading disc, and location of inorganic fertiliser discharge significantly affect the distribution of inorganic fertiliser. Furthermore, correctly adjusting the location of inorganic fertiliser discharge was found to effectively decrease ICV related to the uniformity of inorganic fertiliser, under varying operational parameters.
A model for regulating the ICV was established based on location, flow, and speed. The validity of the model was confirmed through field experiments conducted under varying operational parameters. Compared with the previous discharge location, the optimised fertiliser drop location resulted in an average decrease in the ICV of 10.29%. Consequently, the critical issue of achieving inorganic fertiliser uniformity in organic–inorganic fertilisation was addressed and resolved.

Author Contributions

Conceptualization, C.F. and R.H.; methodology, Y.S.; software, C.F. and J.S.; validation, R.H., Y.S. and G.X.; formal analysis, G.X.; investigation, C.F.; resources, R.H.; data curation, C.F. and Y.L.; writing—original draft preparation, C.F.; writing—review and editing, R.H. and Y.L.; visualization, C.F.; supervision, R.H. and Y.L.; project administration, R.H.; funding acquisition, R.H. All authors have read and agreed to the published version of the manuscript.

Funding

This research was funded by Ministry of Science and Technology of the People’s Republic of China, grant number: 2022YFD2300700.

Institutional Review Board Statement

Not applicable.

Data Availability Statement

Data are contained within the article.

Acknowledgments

This study was financially supported by the National Key R&D Program of China (grant number: 2022YFD2300700). We are grateful for your suggestions.

Conflicts of Interest

The authors declare no conflicts of interest.

Appendix A

Case 1: In the one-factor experiment with organic fertiliser flow, the distribution of inorganic fertiliser was significantly greater than that of organic fertiliser, and as the amount of organic fertiliser increased, the inorganic fertiliser became increasingly concentrated on the far side. Based on Section 3.2.4, if location 7 rotates counterclockwise to location 11 or moves to location 8, the distribution of proximal inorganic fertiliser can be supplemented, leading to a better distribution of inorganic fertiliser.
Case 2: In the single-factor test of fertiliser spreading disc speed, when the speed is 300 r·min−1, the peaks of the inorganic and organic fertiliser distributions match, but the difference in the CV is large, and inorganic fertiliser is missing from the nearer side. As discussed in Section 3.2.4, if location 7 is rotated counterclockwise to location 11, the distribution of inorganic fertiliser on the near side can be supplemented, leading to a better distribution of inorganic fertiliser.
Case 3: In the inorganic fertiliser drop location test, locations 4, 5, 9, and 10 had more inorganic fertiliser distributed on the near side, which was lacking for measuring inorganic fertiliser. At this time, the fertiliser drop location could be moved to the lower or right side so that the organic fertiliser can be thrown out directly from the outlet under the action of the fan blades to replenish the amount of inorganic fertiliser on the far side. Combined with the fertiliser spreading disc speed one-factor test, it can be expected that locations 4, 5, 9, and 10 are suitable for a higher speed of fertiliser spreading disc, because high speed is conducive to the inorganic fertiliser being thrown out faster, and part of the inorganic fertiliser is thrown out directly from the outlet under the action of the fan blades to supplement the amount of far measured inorganic fertiliser.

References

  1. Zhang, J.; Li, H.; Wang, Y.; Deng, J.; Wang, L. Multiple-year nitrous oxide emissions from a greenhouse vegetable field in China: Effects of nitrogen management. Sci. Total Environ. 2018, 616–617, 1139–1148. [Google Scholar] [CrossRef]
  2. Zhang, J.; Zhuang, M.; Shan, N.; Zhao, Q.; Li, H.; Wang, L. Substituting organic manure for compound fertiliser increases yield and decreases NH3 and N2O emissions in an intensive vegetable production systems. Sci. Total Environ. 2019, 670, 1184–1189. [Google Scholar] [CrossRef]
  3. Kang, Y.; Lee, J.; Chun, J.; Yun, Y.; Atef Hatamleh, A.; Al-Dosary, M.; Oh, T. Influence of individual and co-application of organic and inorganic fertilizer on NH3 volatilisation and soil quality. J. King Saud Univ. Sci. 2022, 34, 102068. [Google Scholar] [CrossRef]
  4. Cui, J.; Zhu, R.; Wang, X.; Xu, X.; Ai, C.; He, P.; Zhu, P. Effect of high soil C/N ratio and nitrogen limitation caused by the long·term combined organic–inorganic fertilisation on the soil microbial community structure and its dominated SOC decomlocation. structure and its dominated SOC decomlocation. J. Environ. Manag. 2022, 303, 114155. [Google Scholar] [CrossRef]
  5. Zhu, Z.; Zhou, J.; Shahbaz, M.; Tang, H.; Liu, S.; Zhang, W.; Ge, T. Microorganisms maintain C:N stoichiometric balance by regulating the priming effect in long·term fertilised soils. Appl. Soil Ecol. 2021, 167, 104033. [Google Scholar] [CrossRef]
  6. Wang, X.; Zhou, Z.; Chen, B.; Zhong, J.; Fan, X.; Hewitt, A. Distribution uniformity improvement methods of a large discharge rate disc spreader for UAV fertiliser application. Comput. Electron. Agric. 2024, 220, 108928. [Google Scholar] [CrossRef]
  7. Abbou-ou-Cherif, E.M.; Piron, E.; Chateauneuf, A.; Miclet, D.; Lenain, R.; Koko, J. On-the-field simulation of fertiliser spreading: Part 2—Uniformity investigation. Comput. Electron. Agric. 2017, 141, 118–130. [Google Scholar] [CrossRef]
  8. Hu, J.; He, J.; Wang, Y.; Wu, Y.; Chen, C.; Ren, Z.; He, P. Design and study on lightweight organic fertiliser distributor. Comput. Electron. Agric. 2020, 169, 105149. [Google Scholar] [CrossRef]
  9. Chen, G.; Wang, Q.; Li, H.; He, J.; Lu, C.; Xu, D.; Sun, M. Experimental research on a propeller blade fertiliser transport device based on a discrete element fertiliser block model. Comput. Electron. Agric. 2023, 208, 107781. [Google Scholar] [CrossRef]
  10. Chen, G.; Wang, Q.; Xu, D.; Li, H.; He, J.; Lu, C. Design and experimental research on the counter roll differential speed solid organic fertiliser crusher based on DEM. Comput. Electron. Agric. 2023, 207, 107748. [Google Scholar] [CrossRef]
  11. Sun, X.; Niu, L.; Cai, M.; Liu, Z.; Wang, Z.; Wang, J. Particle motion analysis and performance investigation of a fertiliser discharge device with helical staggered groove wheel. Comput. Electron. Agric. 2023, 213, 108241. [Google Scholar] [CrossRef]
  12. Zhang, J.; Liu, G. Effects of control sequence optimisation on the performance of bivariate fertiliser applicator. Comput. Electron. Agric. 2022, 192, 106594. [Google Scholar] [CrossRef]
  13. Shi, Y.; Hu, Z.; Wang, X.; Odhiambo, M.O.; Ding, W. Motion analysis and system response of fertiliser feed apparatus for paddy Variable-Rate fertiliser spreader. Comput. Electron. Agric. 2018, 153, 239–247. [Google Scholar] [CrossRef]
  14. Yu, H.; Ding, Y.; Fu, X.; Liu, H.; Jin, M.; Yang, C.; Dou, X. A solid fertiliser and seed application rate measuring system for a seed-fertilizer drill machine. Comput. Electron. Agric. 2019, 162, 836–844. [Google Scholar] [CrossRef]
  15. Kömekçi, F.; Kömekçi, C.; Doğu, D.; Aykas, E. Effects of number of vanes, vane angle and disc peripheral speed on the distribution uniformity of twin-disc granular fertiliser broadcaster. Heliyon 2024, 10, e37922. [Google Scholar] [CrossRef]
  16. Xu, B.; Cui, Q.; Guo, L.; Hao, L. Design and parameter optimization of a combined rotor and lining plate crushing organic fertilizer spreader. Agronomy 2024, 14, 1732. [Google Scholar] [CrossRef]
  17. Li, A.; Jia, F.; Chu, Y.; Han, Y.; Li, H.; Sun, Z.; Ji, S.; Li, Z. Simulation of the movement of rice grains in a centrifugal huller by discrete element method and the influence of blade shape. Biosyst. Eng. 2023, 236, 54–70. [Google Scholar] [CrossRef]
  18. Guan, Z.; Mu, S.; Jiang, T.; Li, H.; Zhang, M.; Wu, C.; Jin, M. Development of centrifugal disc spreader on tracked combine harvester for rape undersowing rice based on DEM. Agriculture 2022, 12, 562. [Google Scholar] [CrossRef]
  19. Zhou, W.Q.; Lu, Q.; Wang, Y.; Tang, H.; Wang, J.W.; Wang, Y.J.; Sun, X.B. Evaluating the influence of double-channel inclined spreading blades on the effect of fertiliser granule spreading: DEM modelling and simulations. Biosyst. Eng. 2025, 257, 22. [Google Scholar] [CrossRef]
  20. Sharipov, G.M.; Heiß, A.; Eshkabilov, S.L.; Griepentrog, H.W.; Paraforos, D.S. Considering field topography in the model-based assessment of a centrifugal spreader’s variable rate application accuracy. Comput. Electron. Agric. 2023, 213, 108234. [Google Scholar] [CrossRef]
  21. Bivainis, V.; Jotautienė, E.; Lekavičienė, K.; Mieldažys, R.; Juodišius, G. Theoretical and experimental verification of organic granular fertiliser spreading. Agriculture 2023, 13, 1135. [Google Scholar] [CrossRef]
  22. Xie, Y.T.; Liu, H.X.; Shang, J.J.; Guo, L.F.; Zheng, G.X. Effect of Angle Between Center-Mounted Blades and Disc on Particle Trajectory Correction in Side-Throwing Centrifugal Spreaders. Agriculture 2025, 15, 32. [Google Scholar] [CrossRef]
  23. Villette, S.; Piron, E.; Miclet, D.; Martin, R.; Jones, G.; Paoli, J.-N.; Gée, C. How mass flow and rotational speed affect fertiliser centrifugal spreading: Potential interpretation in terms of the amount of fertiliser per vane. Biosyst. Eng. 2012, 111, 133–138. [Google Scholar] [CrossRef]
  24. Villette, S.; Cointault, F.; Piron, E.; Chopinet, B. Centrifugal Spreading: An Analytical Model for the Motion of Fertiliser Particles on a Spinning Disc. Biosyst. Eng. 2005, 92, 157–164. [Google Scholar] [CrossRef]
  25. Jiang, B.; Zhang, H.; Chen, X.; Liu, M.; Xiao, L.; Yu, J.; Huang, X. Design and experiment of centrifugal fertilizer spreading mechanism with double drop point feeding. Acta Agric. Univ. Jiangxiensis 2025, 47, 521–533. [Google Scholar] [CrossRef]
  26. Fan, C.; Liu, X.; Shi, J.; Shi, Y.; He, R. Structural analysis and optimal design of a centrifugal side-throw organic fertiliser spreader. Comput. Electron. Agric. 2025, 234, 110309. [Google Scholar] [CrossRef]
  27. Fan, C.; He, R.; Shi, Y.; He, L. Structure and operation mode of centrifugal side-throwing organic fertiliser spreader for greenhouses. Powder Technol. 2024, 438, 119457. [Google Scholar] [CrossRef]
  28. Zhang, Z.; Shi, G.; Li, J.; Wang, X.; Ding, L.; Wang, L. Analysis of jujube movement characteristics under positive and negative pressure airflow based on CFD-DEM. Comput. Electron. Agric. 2023, 210, 107902. [Google Scholar] [CrossRef]
  29. Thakur, S.C.; Ooi, J.Y.; Ahmadian, H. Scaling of discrete element model parameters for cohesionless and cohesive solid. Powder Technol. 2016, 293, 130–137. [Google Scholar] [CrossRef]
  30. Yousefi, A.; Ng, T.-T. Dimensionless input parameters in discrete element modelling and assessment of scaling techniques. Comput. Geotech. 2017, 88, 164–173. [Google Scholar] [CrossRef]
  31. Yuan, F.; Yu, H.; Wang, L.; Shi, Y.; Wang, X.; Liu, H. Parameter calibration and systematic test of a discrete element model (DEM) for compound fertilizer particles in a mechanized variable-rate Application. Agronomy 2023, 13, 706. [Google Scholar] [CrossRef]
  32. Yuan, Q.; Xu, L.; Ma, S.; Niu, C.; Yan, C.; Zhao, S. The effect of paddle configurations on particle mixing in a soil-fertiliser continuous mixing device. Powder Technol. 2021, 391, 292–300. [Google Scholar] [CrossRef]
  33. Chu, K.; Chen, J.; Yu, A. Applicability of a coarse-grained CFD-DEM model on dense medium cyclone. Miner. Eng. 2016, 90, 43–54. [Google Scholar] [CrossRef]
  34. GB/T 25401-2010; Agricultural Machinery—Manure Spreaders—Environmental Protection—Requirements and Test Methods. General Administration of Quality Supervision, Inspection and Quarantine of the People’s Republic of China, Standardization Administration of the People’s Republic of China: Beijing, China, 2010.
  35. NY/T4366-2023; Operating Quality of Fertilizer Spreader. Ministry of Agriculture and Rural Affairs of the People’s Republic of China: Beijing, China, 2023.
  36. GB/T 20346.1-2021; Equipment for Distributing Fertilizer-Part 1: Full Width Fertilizer Distributors. State Administration for Market Regulation, Standardization Administration of the People’s Republic of China: Beijing, China, 2021.
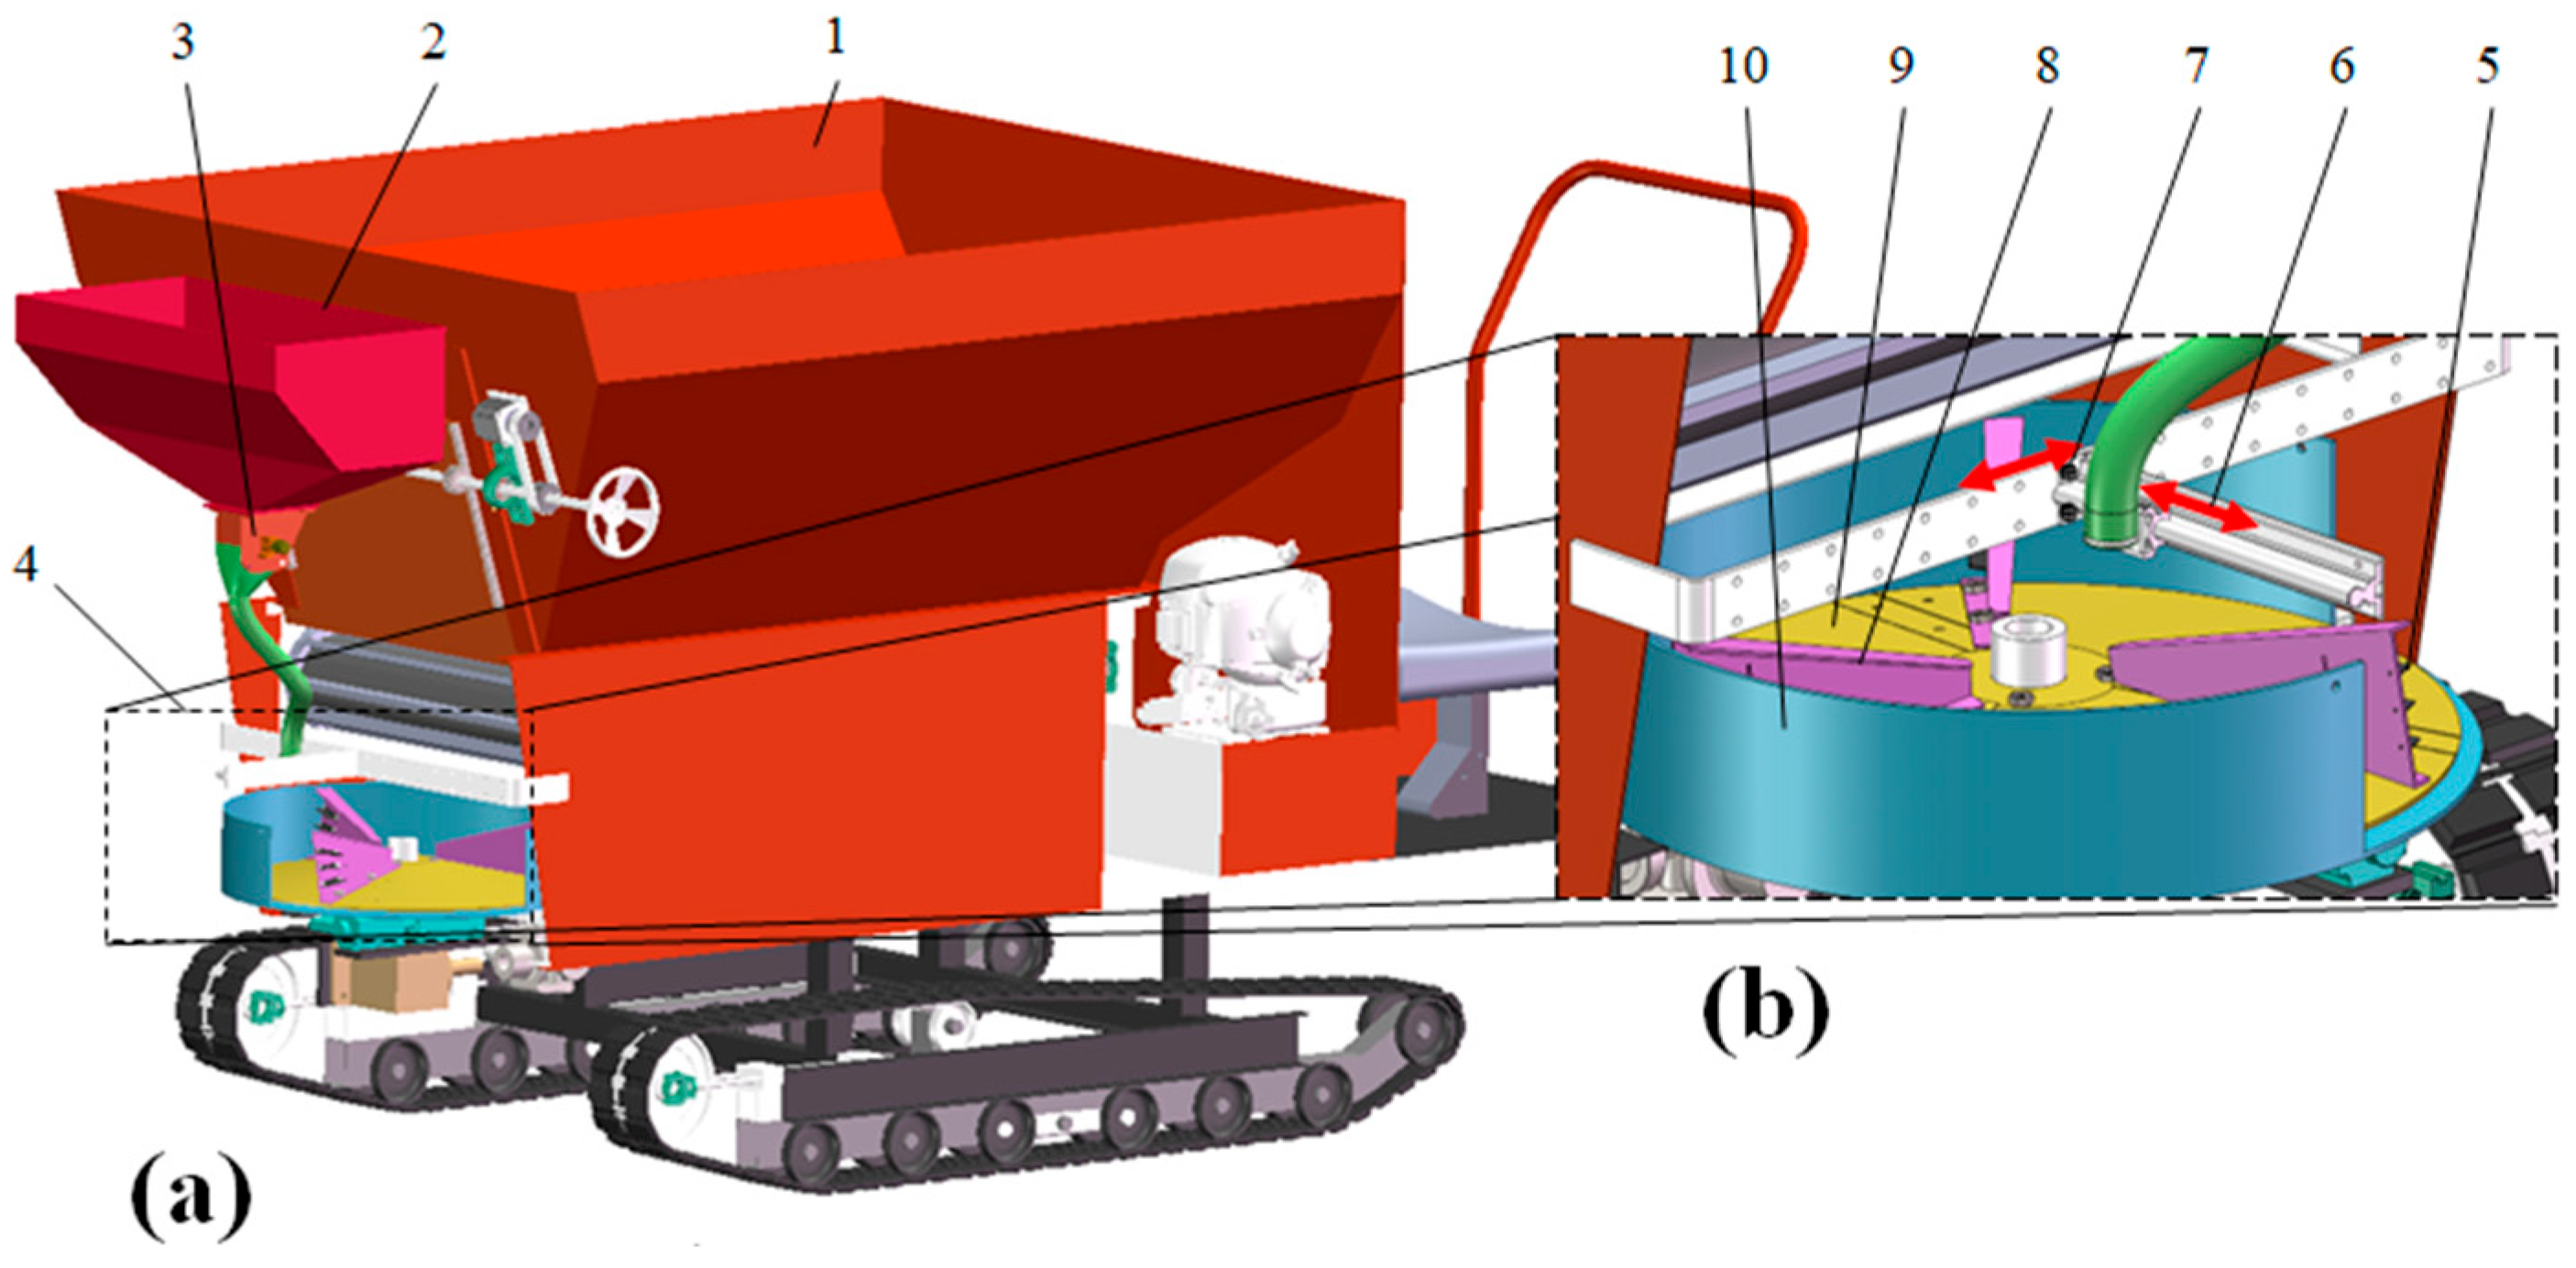
Figure 1. Organic and inorganic fertiliser spreader and fertiliser spreading device. (a) Organic and inorganic fertiliser spreader; (b) Inorganic fertiliser drop location adjustment device. 1 Organic fertiliser tank; 2 Inorganic fertiliser tank; 3 Inorganic fertiliser discharge; 4 Centrifugal side-throwing fertiliser spreading device; 5 Deflector blade; 6 Longitudinal adjusting slide; 7 Transverse adjusting bolt; 8 Fan blade; 9 Fertiliser spreading disc; 10 Guard plate.
Agriculture 15 02256 g001
Figure 2. Force and motion analysis of particles inside the fertiliser spreading disk: (a) three-dimensional figure, and (b) force analysis of individual fertiliser.
Agriculture 15 02256 g002
Figure 3. Movement trajectories at different fertiliser dropping locations.
Agriculture 15 02256 g003
Figure 4. Flight trajectories of different types of fertilisers.
Agriculture 15 02256 g004
Figure 5. EDEM-Fluent coupling methods. (a) Simulation environment of EDEM; (b) Parameter calibration; (c) Simulation environment of Fluent; (d) Mashing.
Agriculture 15 02256 g005
Figure 6. Performance test of the spreader. (a) Calculation of CV in the superimposed paths of the simulation trials: 1. Group of the simulation environment 2. Direction of travel 3. Direction of travel 4. Interface for calculating the CV 5. Effective width after reciprocating operation; (b) Inorganic fertiliser drop location; (c) Field trials.
Agriculture 15 02256 g006
Figure 7. Deviation between simulated and actual values.
Agriculture 15 02256 g007
Figure 8. Distribution of organic and inorganic fertilisers at different organic fertiliser flows. (a) Simulation process and fertiliser distribution (The vertical axis represents k i , calculated by Equation (21)); (b) Boxplot of CV; (c) Dot plot of median fertiliser distribution.
Agriculture 15 02256 g008
Figure 9. Effect of proportions of inorganic and organic fertilisers on the distribution of inorganic fertilisers. (a) Simulation process and fertiliser distribution (The vertical axis represents k i , calculated by Equation (21)); (b) Boxplot of CV; (c) Dot plot of median fertiliser distribution.
Agriculture 15 02256 g009
Figure 10. Effect of spreading disc speed on organic and inorganic fertilisers. (a) Simulation process and fertiliser distribution (The vertical axis represents k i , calculated by Equation (21)); (b) Boxplot of CV; (c) Dot plot of median fertiliser distribution.
Agriculture 15 02256 g010
Figure 11. Fertiliser drop location simulation results. (a) Simulation process; (b) fertiliser distribution (The vertical axis represents k i , calculated by Equation (21)); (c) CV of organic fertiliser uniformity at different manure drop locations; (d) CV of inorganic fertiliser uniformity at different fertiliser drop locations; (e) Dot plot of median fertiliser distribution.
Agriculture 15 02256 g011
Figure 12. Response surface test results. (a) Relationship between the left half of the fertiliser drop location and ICV; (b) Relation between the right half of the fertiliser drop location and ICV.
Agriculture 15 02256 g012
Table 1. Parameters of organic fertiliser materials.
ConsiderationsOrganic Fertiliser
Organic fertiliser density (kg· m 3 )672 a
Water content (%)15–23 a
Particle size of Organic fertiliser (mm)[0, 0.5):[0.5, 1):[1, 1.5): > 1.5 = 1:1:1:1 a
Organic fertiliser Poisson’s ratio0.25 b
Organic fertiliser shear modulus (Pa)1.25 × 10⁷ b
Inorganic fertiliser density (kg· m 3 )1348 a
Particle size of Inorganic fertiliser (mm)Length:Width:Height = 2.0:1.5:1.1 a
Inorganic fertiliser Poisson’s ratio0.24 b
Inorganic fertiliser shear modulus (Pa)1.15 × 10⁷ b
Density of steel (kg·m−3)7861 a
Poisson’s ratio of steel0.3 b
Shear modulus of steel (Pa)7.9 × 10¹⁰ b
O-O restitution coefficient0.4 b
O-O static friction coefficient0.65 b
O-O rolling friction coefficient0.15 b
O-I restitution coefficient0.20 b
O-I static friction coefficient0.65 b
O-I rolling friction coefficient0.20 b
O-S restitution coefficient0.40 b
O-S static friction coefficient0.70 b
O-S rolling friction coefficient0.15 b
I-I restitution coefficient0.40 b
I-I static friction coefficient0.70 b
I-I rolling friction coefficient0.35 b
I-S restitution coefficient0.60 b
I-S static friction coefficient0.40 b
I-S rolling friction coefficient0.10 b
O-O JKR0.02 b
O-I JKR1 b
I-I JKR0.01 b
Note: O is organic fertiliser, I is inorganic fertiliser, S is steel, JKR is surface energy, a indicates that the value was actually measured, and b indicates that the value was taken from the literature [9,10,25,31,32] and then calibrated.
Table 2. Simulated one-way test parameters.
NumberFactorLevelConditions
1–6Spreading disc speed/r·min−1300, 400, 500, 600, 700Organic fertiliser mass flow rate 2625 g·s−1, Inorganic fertiliser mass flow rate 585 g·s−1, Fertiliser drop location: 7
7–13Organic fertiliser mass flow rate/g·s−1875, 1312.5, 1750, 2187.5, 2625, 3262.5, 3500Inorganic fertiliser mass flow rate 585 g·s−1, speed: 400 r·min−1, fertiliser drop location: 7
14–19Percentage of inorganic fertiliser10%, 20%, 30%, 40%, 50%Speed: 400 r·min−1, Fertiliser drop location: 7, Organic fertiliser flow + Inorganic fertiliser flow = 3210 g·s−1
20–34Inorganic fertiliser drop locationSetting 15 fertiliser drop locations (Figure 6b)Organic fertiliser mass flow rate 2287.5 g·s−1, Inorganic fertiliser mass flow rate 585 g·s−1, Speed: 400 r·min−1
Table 3. Response surface test factor levels.
LevelLevel
−101−101
Spreading disc speed/r·min−1300500700300500700
Organic fertiliser flow/g·s−18752187.535008752187.53500
Polar angle/°−80−40004080
Polar diameter/mm6012018060120180
Table 4. Box–Behnken response surface test results.
NumberA: Fertiliser Spreading Disc Speed
(r·min−1)
B: Organic Fertiliser Flow
(g·s−1)
C: Polar Angle
(°)
D: Polar Diameter
(mm)
ICVL
(%)
ICVR
(%)
110−1029.5033.41
2−100141.3637.72
300−1136.5436.91
4000052.6431.92
5010−132.2825.67
6101034.1637.84
7−101031.1938.29
8110029.7631.73
9−10−1038.7330.50
1001−1024.8337.15
11000052.2831.57
12011037.9932.33
13000051.2932.56
14000053.1232.39
150−11024.4342.33
160−10141.0930.41
170−1−1042.5223.89
18000051.1432.77
191−10031.4630.77
20−110030.9330.79
21010140.8535.48
2200−1−140.5425.70
23001−126.2841.04
240−10−138.3034.35
25100136.9031.20
26001137.7432.02
27−100−138.9528.31
28100−131.4933.59
29−1−10035.8233.88
Table 5. Response surface test results of left half of the fertiliser drop location.
SourceSum of SquaresdfMean SquareF-Valuep-Value
Model1878.6514134.1941.79<0.0001
A-A46.85146.8514.590.0019
B-B24.03124.037.480.0161
C-C36.3136.311.30.0047
D-D59.14159.1418.420.0007
AB2.5412.540.79220.3885
AC37.21137.2111.590.0043
AD2.2512.250.70060.4166
BC244.141244.1476.02<0.0001
BD8.3518.352.60.1291
CD59.75159.7518.610.0007
A2585.51585.5182.32<0.0001
B2585.341585.34182.27<0.0001
C2678.271678.27211.21<0.0001
D2195.651195.6560.92<0.0001
Residual44.96143.21
Lack of Fit42.02104.25.710.0538
Pure Error2.9440.7355
Cor Total1923.6128
Note: A: Fertiliser spreading disc speed; B: Organic fertiliser flow; C: Polar Angle; D: Polar diameter.
Table 6. Response surface test results of right half of the fertiliser drop location.
SourceSum of SquaresdfMean SquareF-Valuep-Value
Model495.691338.1335.31<0.0001
A-A0.076610.07660.07090.7937
B-B0.506210.50620.46870.5040
C-C109.651109.65101.54<0.0001
D-D18.93118.9317.530.0008
AB4.114.13.80.0704
AC2.8112.812.610.1273
AD34.84134.8432.26<0.0001
BC135.221135.22125.22<0.0001
BD47.27147.2743.78<0.0001
CD102.261102.2694.7<0.0001
A21.9211.921.770.2028
B22.6112.612.420.1408
C232.77132.7730.35<0.0001
D20.28310.2830.2490.6255
Residual16.2151.08
Lack of Fit15.24111.395.790.0523
Pure Error0.957940.2395
Cor Total511.8828
Note: A: Fertiliser spreading disc speed; B: Organic fertiliser flow; C: Polar Angle; D: Polar diameter.
Table 7. Validation test results.
NumTarget ValueOptimal Fertiliser Drop LocationNum of BoxOCV (%)ICV (%) O C V (%) I C V (%) O C V (%) I C V (%)
1 A t a r g e t   =   0.5 ;
B t a r g e t = −0.47
I C V = 23.13 % ;
C = −0.8°;
D = 70.2 mm
3 to 816.4519.3417.3828.930.939.59
2 A t a r g e t   =   0.5 ;
B t a r g e t = −0.47
I C V = 24.36 % ;
C = −0.6°;
D = 71.4 mm
2 to 918.7223.7818.1032.43−0.628.65
3 A t a r g e t   =   0.5 ;
B t a r g e t = 0.47
I C V = 22.23 % ;
C = 12.96°;
D = 60.36 mm
3 to 814.3921.4515.6238.171.2316.72
4 A t a r g e t   =   0.5 ;
B t a r g e t = 0.47
I C V = 25.15 % ;
C = −66.18°;
D = 179.82 mm
2 to 917.6123.1016.8329.32−0.786.22
Mean value16.7921.9216.9832.210.1910.29
Note: O C V = O C V − OCV; I C V = I C V − ICV.
Disclaimer/Publisher’s Note: The statements, opinions and data contained in all publications are solely those of the individual author(s) and contributor(s) and not of MDPI and/or the editor(s). MDPI and/or the editor(s) disclaim responsibility for any injury to people or property resulting from any ideas, methods, instructions or products referred to in the content.