Abstract
High temperatures during grain filling degrade rice quality, yet the metabolite-level basis of varietal tolerance—particularly root contributions—remains unclear. We compared the heat-tolerant ‘Fusaotome’ and the widely grown ‘Akitakomachi’ under control and high-temperature conditions. Panicles and roots were sampled at heading and profiled by capillary electrophoresis–mass spectrometry (CE–MS), followed by PCA, univariate testing, and KEGG pathway analysis. PCA resolved treatment and cultivar differences in an organ-specific manner. In panicles, ‘Fusaotome’ showed 8 increased metabolites (≥1.5-fold) and 11 decreased (≤1/1.5), whereas ‘Akitakomachi’ showed 19 increases and 6 decreases (p < 0.05). In roots, 12 metabolites increased in ‘Fusaotome’ and 9 in ‘Akitakomachi’; no significant decreases were detected. Pathway analysis indicated activation in ‘Fusaotome’ panicles of tryptophan, nicotinate/nicotinamide, arginine/proline, glycolysis/TCA, pyruvate, and vitamin B6 pathways, while ‘Akitakomachi’ emphasized phenylpropanoid, isoquinoline alkaloid, caffeine, and ubiquinone/terpenoid–quinone biosynthesis. In roots, ‘Fusaotome’ prioritized phenylalanine/phenylpropanoid, aromatic amino acids, lysine degradation, branched-chain amino acids, glycerophospholipids, and alkaloids, whereas ‘Akitakomachi’ favored nitrogen- and antioxidant-related routes. Collectively, the tolerant cultivar maintained antioxidant capacity and energy supply while coordinating root–panicle metabolism, whereas the susceptible cultivar shifted toward secondary defenses. These signatures nominate candidate metabolic markers and targets for breeding and management to stabilize rice production under warming climates.
1. Introduction
Global warming has exerted a profound impact on global food production, and, in particular, high temperatures from the heading stage to grain filling substantially reduce both yield and quality in rice crops. High temperature impairs pollen viability, accelerates grain filling, and decreases grain weight, ultimately leading to yield loss and poor appearance quality [1,2]. In warm regions of Japan, deterioration of brown rice quality—most notably an increase in chalkiness—has been widely documented, with significant rises in chalky grains reported alongside rising air temperatures [3,4].
Two principal physiological constraints underlie heat-induced grain quality deterioration: (1) a shortage of photoassimilate supply to the endosperm (source limitation) and (2) reduced endosperm capacity for starch biosynthesis (sink limitation), which together lead to insufficient starch accumulation and consequently inferior grain appearance and quality [5,6]. High temperature disrupts starch granule packing, enhances protein body deposition, and alters amyloplast development, all of which contributes to chalk formation [6,7]. With ongoing climate change, these drivers are likely to intensify, warranting urgent elucidation of the physiological mechanisms that confer tolerance to high temperature during the heading-to-grain-filling period.
To decipher heat stress responses, omics approaches, including metabolomics, have been increasingly employed in recent years. Yamakawa and Hakata [6] showed, through the integration of grain metabolome and transcriptome datasets, that high temperature suppresses the expression of starch biosynthetic genes while inducing amino acid accumulation. Proteomic analyses have likewise indicated conspicuous heat-induced changes in enzymes involved in starch metabolism and stress-responsive proteins [8]. Moreover, high temperature—especially when associated with elevated night temperatures—broadly perturbs central metabolism (glycolysis and the tricarboxylic acid (TCA) cycle), amino acid metabolism, and polyamine-related metabolism [6,9]. Additionally, heat stress increases the production of reactive oxygen species (ROS), triggering oxidative stress. Plants maintain redox homeostasis through antioxidant enzymes and low-molecular-weight antioxidants [10], and enhanced antioxidant enzyme activities may contribute to heat tolerance in rice [11,12].
However, most previous studies have focused on aboveground organs (panicles and leaves), where heat injury is most directly observed. In contrast, less is known about roots, which are metabolically active under environmental stress and indirectly support photosynthesis and starch deposition by supplying water and nutrients. Heat has been reported to impair root system formation, respiration, and water and nutrient uptake in rice [13,14].
To address this gap, we compared the metabolite dynamics in panicles and roots under high-temperature conditions between a heat-tolerant cultivar, ‘Fusaotome’, and a widely cultivated Japanese cultivar, ‘Akitakomachi’. Specifically, we established control and high-temperature treatments, sampled tissues at heading, and conducted comprehensive metabolomic profiling using capillary electrophoresis–mass spectrometry (CE-MS). Our objectives were to clarify (1) the impacts of high temperature on metabolite levels in panicles and roots and (2) cultivar-specific strategies for pathway activation. The outcomes provide a physiological basis for heat tolerance during grain filling and foundational knowledge for developing metabolic markers to support breeding programs and refine cultivation practices.
2. Materials and Methods
2.1. Plant Materials and Cultivation
Experiments were conducted at the experimental field of the Akita Prefectural University (140°05′ E, 39°80′ N) in 2022. Two cultivars were used: the heat-tolerant ‘Fusaotome’ and the widely cultivated Japanese cultivar ‘Akitakomachi’. Seeds were sown on 28 April 2022, in a growth chamber using Inaho granular soil (Inaho-Kako Co., Ltd., Toyama, Japan) and grown as seedlings. On 25 May 2022, single seedlings were transplanted into 1/5000-a Wagner pots filled with 3 L of Inaho granular soil. Slow-release fertilizers (Ecolong Total 391-70 and 391-140; National Federation of Agricultural Cooperative Associations, Tokyo, Japan) were each added at 0.6 g per pot. Plants were cultivated under flooded conditions. Specifically, plants were grown in 1/5000-a Wagner pots with water maintained at approximately 5 cm above the soil surface throughout the experiment. Three biological replicates were prepared for each treatment and cultivar.
2.2. Experimental Treatments
High-temperature treatment began on 30 July 2022, when pots were moved into a plastic greenhouse located within the experimental field. The treatment was maintained until sampling. Both control and high-temperature treatments were conducted outdoors. The high-temperature condition was achieved inside an outdoor plastic greenhouse that naturally accumulated solar heat, without artificial heating. Air temperature in each treatment was recorded hourly using Em5b+RT-1 sensors (Decagon Devices, Pullman, WA, USA). Soil temperature was not measured.
2.3. Sampling
Panicles and roots were sampled immediately after heading. Sampling dates for ‘Akitakomachi’ were 9 August (high temperature) and 16 August 2022 (control), and 16 August (high temperature) and 22 August (control) for ‘Fusaotome’. Sampling dates differed between cultivars and treatments because tissues were harvested immediately following each group’s heading date. Panicles were immediately frozen in liquid nitrogen upon harvest. Entire root systems were carefully washed within 5 min and frozen in liquid nitrogen. Frozen samples were lyophilized using a freeze dryer (FDU-2200; Tokyo Rikakikai Co., Ltd., Tokyo, Japan), pulverized using a Multi-Beads Shocker (model MB455AU (S); Yasui Kikai, Osaka, Japan), and a randomly selected subsample was used for metabolomic analysis.
2.4. Metabolomic Analysis
The extraction and CE–TOF–MS procedures followed Soga et al. [15]. Approximately 10 mg of lyophilized tissue was extracted with 600 μL of methanol containing 50 μM internal standards, and homogenized on ice using a cell disruptor (BMS-M10N21; Bio Medical Science Inc., Tokyo, Japan) (4 °C, 1500× g, 2 min × 2). Chloroform (500 μL) and Milli-Q water (200 μL) were added, followed by centrifugation (2300× g, 4 °C, 5 min). The aqueous phase was transferred to an ultrafiltration tube (Ultrafree-MC PLHCC HMT 5 kDa; Millipore (Billerica, MA, USA)) and centrifuged (9100× g, 4 °C, 120 min) using a high-speed refrigerated centrifuge (Himac CF 15R; Hitachi Koki Co., Ltd., Tokyo, Japan). Filtrates were dried and reconstituted in 50 μL of Milli-Q water. Samples were analyzed by CE–TOF–MS (Agilent CE–TOF–MS; Agilent, Palo Alto, CA, USA). Metabolomic analysis was outsourced to Human Metabolome Technologies, Inc. (Tsu-ruoka, Yamagata, Japan). CE–MS predominantly detects polar metabolites; non-polar metabolites were not specifically targeted in this workflow.
2.5. Data Analysis
For metabolite datasets, principal component analysis (PCA) and t-tests were performed using JMP 8 (SAS Institute Inc., Cary, NC, USA). Tables and graphs were prepared using Microsoft Excel for Microsoft 365 (Microsoft Corporation, Redmond, WA, USA). Volcano plots and heat maps were created using OriginPro 2024 statistical software (OriginLab Corporation, Northampton, MA, USA). Pathway analysis and network analysis were conducted with MetaboAnalyst 6.0 (https://new.metaboanalyst.ca/home.xhtml (accessed on 24 October 2025), and pathway impact values were calculated [16]. In addition to pathway analysis, correlation network analysis was performed using the Correlation Analysis module of MetaboAnalyst 6.0. Pairwise correlations among amino acids were computed using the Pearson method, and network edges were drawn for |r| ≥ 0.6 (p < 0.05) [16].
3. Results
3.1. Temperature Conditions in Treatments
Temporal changes in air temperature during the experimental period are shown in Figure 1. During daytime under the treatment, the mean temperatures in ‘Akitakomachi’ were 26.5 °C (control) and 31.8 °C (high temperature), and those in ‘Fusaotome’ were 26.7 °C (control) and 30.5 °C (high temperature). Thus, the high-temperature treatments in ‘Akitakomachi’ and ‘Fusaotome’ were +5.3 °C and +3.8 °C above the controls, respectively (Table 1). The nighttime means were 22.3 °C (control) and 24.6 °C (high temperature) for ‘Akitakomachi’, and 22.1 °C (control) and 24.8 °C (high temperature) for ‘Fusaotome’, i.e., +2.3 °C and +2.7 °C relative to the control, respectively. The variation in average temperature among cultivars and treatments stems from differences in the period between the date of high-temperature treatment and the sampling date at heading. These differences confirm that the high-temperature treatment was properly implemented.
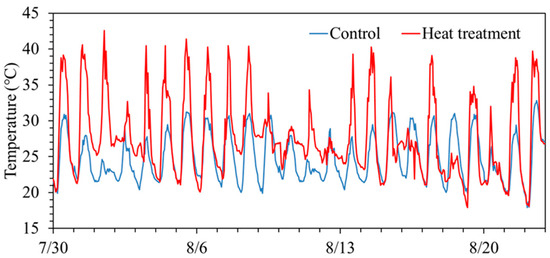
Figure 1.
Temporal changes in air temperature in high-temperature and control treatments during the cultivation period.

Table 1.
Temperatures for each treatment from the start of heat treatment to sampling.
3.2. Effects of High Temperature on Metabolite Profiles in Panicles and Roots
We detected 308 metabolites in panicles and 260 in roots. Complete lists of detected metabolites are provided in Supplementary Tables S1 (panicles, n = 308) and S2 (roots, n = 260). PCA was used to visualize treatment- and cultivar-dependent separations (Figure 2). In panicles, control and high-temperature samples separated clearly along PC2, indicating pronounced heat-induced metabolic shifts. Cultivar differences under high temperature were also evident between ‘Fusaotome’ and ‘Akitakomachi’. In the roots, ‘Akitakomachi’ showed clear control vs. high-temperature separation along PC2, whereas ‘Fusaotome’ separated along PC1 but with a smaller magnitude of difference.
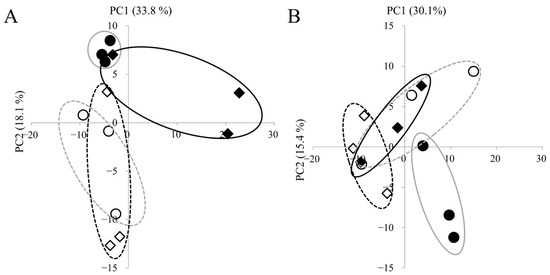
Figure 2.
PCA of metabolites in the panicles (A) and roots (B) of the two cultivars. PCA scores based on PC1 and PC2 are shown. Circles indicate ‘Akitakomachi’ and squares indicate ‘Fusaotome’. Open symbols indicate control and fill symbols indicate high temperature. Percent variance explained by each PC is shown in parentheses.
3.3. Metabolite-Level Responses to High Temperature
Metabolites differing significantly between control and high temperature were extracted and visualized by volcano plots (Figure 3). Compounds showing significant changes at p < 0.05 with ≥1.5-fold increases or ≤1/1.5-fold decreases are summarized in Table 2 and Table 3.
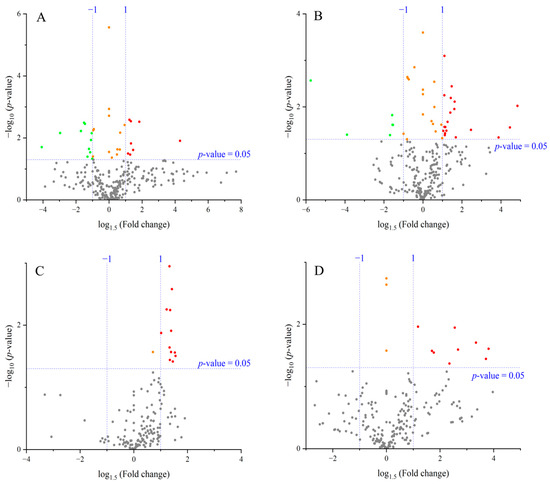
Figure 3.
Volcano plots comparing metabolite levels between control and high-temperature treatments for each cultivar and organ. (A) ‘Fusaotome’ panicles; (B) ‘Akitakomachi’ panicles; (C) ‘Fusaotome’ roots; (D) ‘Akitakomachi’ roots. ● Substances showing a significant change at the 5% level (p < 0.05) compared to the control under the high-temperature treatment, with an increase of ≥1.5-fold. ● Substances showing a significant change at the 5% level (p < 0.05) compared to the control under the high-temperature treatment, with a decrease to ≤1/1.5-fold. ● Substances showing a significant change at the 5% level (p < 0.05) compared to the control under the high-temperature treatment, with either an increase of ≤1.5-fold or a decrease of ≥1/1.5-fold. ● Substances showing no significant change at the 5% level compared to the control under the high-temperature treatment (p > 0.05).
Table 2.
Metabolites in panicles significantly altered by heat treatment.
Table 3.
Metabolites in roots significantly altered by heat treatment.
In the panicles of ‘Fusaotome’, 8 metabolites increased ≥1.5-fold (mainly amino acid metabolism-related), while 11 decreased to ≤1/1.5-fold, mostly associated with amino acid, carbohydrate, and energy metabolism (Table 2). In ‘Akitakomachi’ panicles, 19 metabolites increased ≥1.5-fold, primarily ornithine and aromatic amino acid-related compounds, whereas 6 decreased to ≤1/1.5-fold, many of which were implicated in antioxidant capacity and stress responses. Among metabolites significantly increased under heat, only spermidine was common to both cultivars in panicles.
In the roots, 12 metabolites increased ≥1.5-fold in ‘Fusaotome’, mainly related to nitrogen and amino acid metabolism (Table 3). In ‘Akitakomachi’, nine metabolites increased ≥1.5-fold, including amino acid derivatives, organic acids, and antioxidant-related compounds. No metabolites decreased significantly to ≤1/1.5-fold in the roots of either cultivar.
3.4. Amino Acid Correlation Network to High Temperature
In panicles, Fusaotome displayed a highly integrated amino-acid network under high temperature, characterized by a dense hub of branched-chain amino acids (valine, leucine, isoleucine) connected with alanine, methionine, and phenylalanine, indicating coordinated nitrogen and energy metabolism (Figure 4A). Proline and threonine bridged this core to a secondary cluster of arginine, histidine, and aspartate, suggesting balanced carbon–nitrogen regulation. In contrast, Akitakomachi showed a moderately connected network centered on similar branched-chain amino acids but with weaker linkages to the proline–glutamine–aspartate module and peripheral one-carbon amino acids (serine, glycine, cysteine), reflecting less integrated metabolic coordination (Figure 4B).
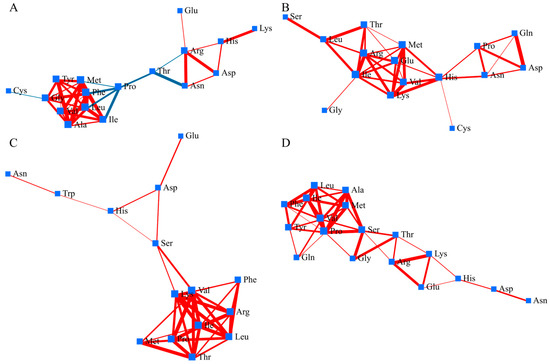
Figure 4.
Amino acid correlation network in the panicles under high temperature. Nodes represent individual metabolites, and edges indicate significant correlations (|r| ≥ 0.6, p < 0.05). Red edges indicate positive correlations; blue edges indicate negative correlations. (A) ‘Fusaotome’ panicles; (B) ‘Akitakomachi’ panicles; (C) ‘Fusaotome’ roots; (D) ‘Akitakomachi’ roots.
In root, amino-acid network of Fusaotome exhibited a compact and highly connected structure under high temperature (Figure 4C). A central hub was formed by valine, leucine, threonine, and arginine, showing positive correlations with phenylalanine, histidine, and serine. This cluster was linked to glutamic acid and aspartate through a chain-like extension, while asparagine and tryptophan remained peripheral but still positively associated with the core. In Akitakomachi, the amino-acid correlation network displayed a relatively linear topology compared with the panicle network (Figure 4D). A compact module composed of branched-chain and aromatic amino acids (valine, leucine, isoleucine, phenylalanine, tyrosine) showed strong positive correlations, indicating locally coordinated nitrogen and carbon metabolism. This cluster was connected through proline and serine to a chain-like structure including arginine, lysine, histidine, aspartate, and asparagine. Glutamic acid and glutamine were peripherally positioned.
3.5. Pathway-Level Responses to High Temperature
Based on differential metabolites, pathway analysis using the KEGG database was performed. For each cultivar and organ, relationships between pathway impact and −log10 (p-value) are shown (Figure 5). A pathway “score” was computed as the product of impact and −log10 (p-value), and inter-cultivar differences were evaluated. The p value indicates the extent of pathway enrichment; the smaller the p value, the greater the difference in enrichment. Pathway impact refers to the role of metabolites in the pathway, and the greater the pathway impact, the greater the role of metabolites in the pathway. Therefore, the pathway with the larger −log10 (p-value) and the larger pathway impact, in other words pathway with large products of these two values, would be selected as the significantly enriched pathway [17]. And Figure 6 shows a heatmap of pathway scores with hierarchical clustering to visualize inter-cultivar relationships.
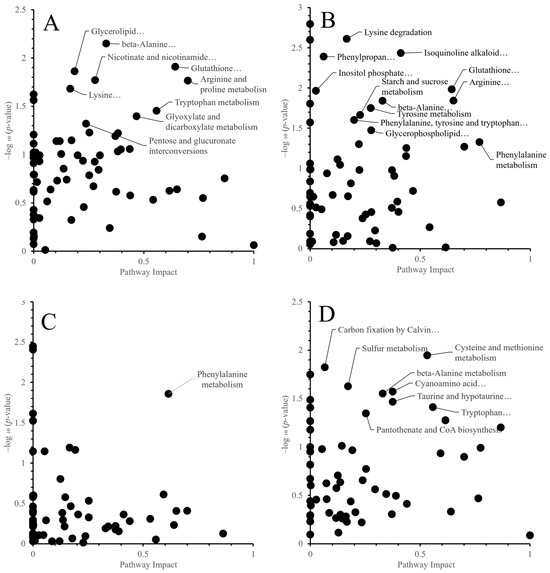
Figure 5.
Relationships between pathway impact and −log10 (p-value) when comparing control and high-temperature treatments for each cultivar and organ. Each point represents a KEGG pathway. (A) ‘Fusaotome’ panicles; (B) ‘Akitakomachi’ panicles; (C) ‘Fusaotome’ roots; (D) ‘Akitakomachi’ roots.
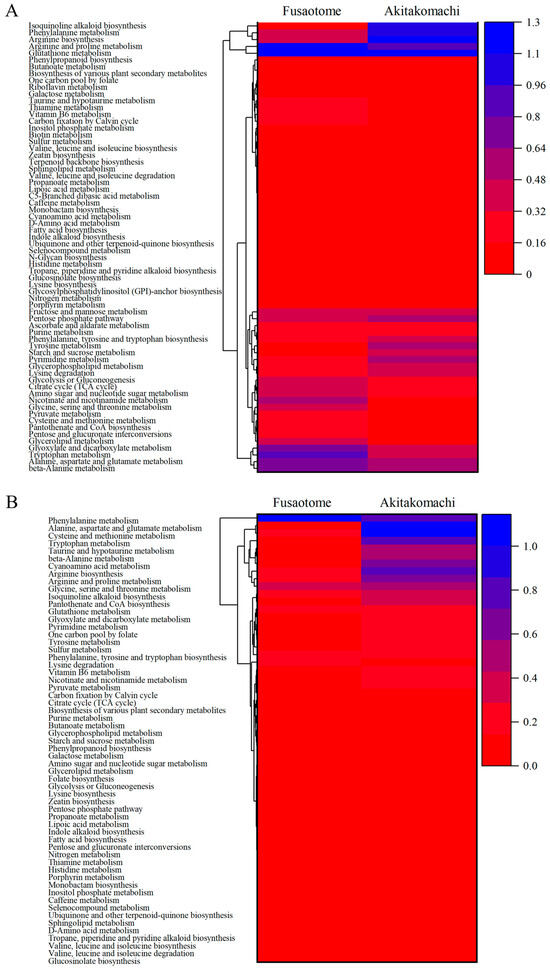
Figure 6.
Heatmap-clustering analyses of KEGG pathway scores with hierarchical clustering of panicles (A) and roots (B).
In ‘Fusaotome’ panicles, tryptophan metabolism, nicotinate and nicotinamide metabolism, arginine and proline metabolism, glycolysis and the TCA cycle, pyruvate metabolism, and vitamin B6 metabolism exhibited high scores (Table 4 and Figure 6A). These pathways are associated with antioxidant responses and energy supply, suggesting that ‘Fusaotome’ maintains metabolic homeostasis even under high temperature. In ‘Akitakomachi’ panicles, phenylpropanoid biosynthesis, isoquinoline alkaloid biosynthesis, caffeine metabolism, and ubiquinone/terpenoid–quinone biosynthesis showed high scores (Table 5 and Figure 6A), largely representing secondary metabolism with an emphasis on defensive responses.
Table 4.
Top 20 pathways with higher activity in ‘Fusaotome’ than in ‘Akitakomachi’ under heat treatment (panicles).
Table 5.
Top 20 pathways with higher activity in ‘Akitakomachi’ than in ‘Fusaotome’ under heat treatment (panicles).
In ‘Fusaotome’ roots, phenylalanine metabolism and phenylpropanoid biosynthesis, tyrosine/tryptophan-related routes, lysine degradation, branched-chain amino acid metabolism (valine, leucine, isoleucine), glycerophospholipid metabolism, and alkaloid biosynthesis showed high scores (Table 6 and Figure 6B). These pathways are related to antioxidant defense, cell wall reinforcement, carbon–nitrogen reutilization, and membrane stabilization. In ‘Akitakomachi’ roots, alanine, aspartate, and glutamate metabolism; cysteine and methionine metabolism; tryptophan metabolism; arginine and proline metabolism; taurine and hypotaurine metabolism; β-alanine metabolism; and cyanoamino acid metabolism were enriched (Table 7 and Figure 6B), indicating a bias toward nitrogen metabolism and antioxidant-related pathways.
Table 6.
Top 20 pathways with higher activity in ‘Fusaotome’ than in ‘Akitakomachi’ under heat treatment (roots).
Table 7.
Top 20 pathways with higher activity in ‘Akitakomachi’ than in ‘Fusaotome’ under heat treatment (roots).
4. Discussion
We compared metabolite and pathway dynamics in panicles and roots of the heat-tolerant ‘Fusaotome’ and the commonly cultivated ‘Akitakomachi’ under high-temperature conditions.
4.1. Metabolite-Level Responses to High Temperature
Both cultivars showed changes in amino acids and nitrogen-containing compounds, although the direction and magnitude differed markedly. In ‘Fusaotome’ panicles (Table 2), polyamines and amino-acid-related metabolites such as spermidine and N-acetylalanine were elevated, likely contributing to antioxidant defense and membrane stabilization. Polyamines are known to modulate membrane stability and ROS homeostasis, broadly promoting abiotic stress tolerance [18,19]. Exogenous spermidine has been shown to increase antioxidant enzyme activities (SOD, POD) in heat-stressed rice, mitigating oxidative damage—supporting the role of polyamines as ROS scavengers and as inducers of polyamine biosynthetic and antioxidant gene expression [20,21,22]. In contrast, although ornithine and anthranilic acid increased in ‘Akitakomachi’, declines in antioxidant-related precursors, including glutathione derivatives, suggested compromised antioxidant capacity. Given the central role of the glutathione system in plant redox homeostasis [23], ‘Akitakomachi’ may have insufficient antioxidant control under high-temperature stress.
Root responses also differed (Table 3). ‘Fusaotome’ accumulated lysine, arginine, proline, and leucine, with proline playing an important role in osmotic adjustment and ROS quenching under heat and drought conditions [24,25]. Modulations in proline metabolism can affect heat tolerance [26]. Oxidized glutathione (GSSG) accumulated in ‘Akitakomachi’; the increased GSSG levels under oxidative stress [27] indicates reduced antioxidant control during heat stress.
4.2. Amino Acid Correlation Network to High Temperature
In panicles of Fusaotome, the dense and highly connected amino-acid network indicates coordinated regulation of carbon–nitrogen metabolism and amino-acid interconversion under high temperature (Figure 4A). The central role of branched-chain and aromatic amino acids likely supports mitochondrial energy generation and redox buffering, processes known to contribute to thermotolerance through maintenance of ATP supply and ROS control [6,10]. Proline appears to function as a mediator linking primary metabolism to stress-responsive pathways, consistent with its well-documented role in osmoprotection and antioxidant defense under abiotic stress [28]. The coexistence of positive and negative correlations among metabolites suggests a dynamic balance between growth-associated and protective metabolism, enabling Fusaotome to sustain metabolic homeostasis during heat stress. In contrast, Akitakomachi panicles exhibited a moderately organized but less integrated amino-acid network (Figure 4B). Although the dense BCAA-centered core indicates co-regulation of proteinogenic and nitrogen-assimilation pathways, the relative separation of the proline–glutamine–aspartate sub-module implies partial decoupling of osmolyte- and redox-linked metabolism from central amino-acid turnover [26]. Such fragmentation may restrict systemic buffering of oxidative and osmotic stress at the spikelet level, reflecting a defense-biased yet less coordinated metabolic strategy compared with the tolerant background. These contrasting network organizations between the two cultivars underscore the importance of integrated amino-acid and redox metabolism in sustaining grain filling and heat resilience in rice.
In Fusaotome roots, the dense amino-acid correlation network indicates efficient integration of nitrogen and carbon metabolism that contributes to nitrogen recycling and redox homeostasis under heat stress. The central roles of branched-chain amino acids (valine, leucine, threonine) and arginine suggest involvement in both energy metabolism and polyamine biosynthesis, processes known to enhance membrane integrity and antioxidant capacity during abiotic stress [19,29]. Peripheral yet connected metabolites such as asparagine and tryptophan may participate in nitrogen remobilization and signaling [30]. This cohesive network organization indicates that Fusaotome maintains systemic connectivity between amino-acid, redox, and energy pathways to preserve root function and sustain resource supply under high temperature [13]. In contrast, Akitakomachi roots exhibited a more linear and fragmented network, with weak interconnections between stress-responsive and primary metabolic pathways. Although branched-chain and aromatic amino acids formed local clusters, the peripheral positioning of glutamic acid and glutamine suggests limited recycling of amino groups and reduced nitrogen redistribution under stress. Such localized rather than integrated coordination implies a restricted capacity to maintain redox balance and energy homeostasis, characteristics commonly associated with heat-sensitive genotypes [10]. The contrasting network structures between the two cultivars highlight that cohesive amino-acid interactions are critical for maintaining metabolic flexibility and root vitality during high-temperature exposure.
4.3. Pathway-Level Responses to High Temperature
Pathway analysis revealed distinct metabolic strategies between cultivars in both organs. In ‘Fusaotome’ panicles (Table 4 and Figure 6A), tryptophan metabolism (providing precursors for melatonin), nicotinate/nicotinamide metabolism (supporting NAD+/NADP+ supply), and arginine/proline metabolism were prominent, facilitating simultaneous antioxidant responses and energy stability [24,25,31,32]. Glycolysis and the TCA cycle were also emphasized, providing a basal metabolic foundation for sustain grain filling under heat stress [6]. In ‘Akitakomachi’ panicles (Table 5 and Figure 6A), enrichment of secondary pathways (phenylpropanoid and isoquinoline alkaloid biosynthesis) reflected defense-oriented shifts that may be less directly supportive of basal metabolism and sustained grain filling [33].
In the roots, ‘Fusaotome’ exhibited prominent aromatic amino acid metabolism and phenylpropanoid biosynthesis (Table 6 and Figure 6B), promoting the synthesis of cell wall components (e.g., lignin) and antioxidant compounds [34]. Lysine and branched-chain amino acid degradation may remodel carbon and nitrogen to maintain metabolic homeostasis under stress [35,36]. Moreover, activation of glycerophospholipid metabolism and alkaloid biosynthesis may stabilize membranes and enhance chemical defense [37,38], thereby preserving root function. In ‘Akitakomachi’ (Table 7 and Figure 6B), nitrogen metabolism-related pathways were predominantly induced, whereas activation of aromatic amino acid metabolism and membrane lipid pathways was limited, indicating a more defensive but less integrative metabolic response at the whole-plant level.
In addition to organ-specific metabolic shifts, the tolerant cultivar ‘Fusaotome’ appeared to coordinate its root and panicle metabolism under heat stress. The activation of glycolysis and the TCA cycle in panicles likely sustained carbon skeletons and reducing equivalents that support amino acid and antioxidant biosynthesis in both organs. In parallel, the upregulation of aromatic amino acid and phenylpropanoid metabolism in roots could enhance lignin and phenolic compound production, strengthening water and nutrient transport capacity to the panicle. Such organ-to-organ complementation suggests that roots maintained resource acquisition and redox buffering, while panicles sustained sink metabolism and energy turnover, forming an integrated metabolic network across the whole plant. Similar coordination between source and sink organs has been recognized as a hallmark of stress resilience, enabling efficient allocation of carbon, nitrogen, and reducing power under environmental stress [6,31]. Thus, the metabolomic data support the concept that ‘Fusaotome’ employs a systemic adjustment of energy and redox metabolism between roots and panicles to maintain grain filling and antioxidant balance under high temperature.
The metabolic strategies observed in the tolerant cultivar ‘Fusaotome’—including sustained glycolysis/TCA cycle activity and enhanced antioxidant and amino acid metabolism—likely contribute to superior grain filling under heat stress. Maintenance of central carbon metabolism ensures a continuous energy supply and precursor availability for starch biosynthesis, thereby supporting sink strength in developing grains. Meanwhile, elevated polyamines (e.g., spermidine) and proline could stabilize membranes and mitigate oxidative damage in panicles, protecting starch-synthesizing tissues from heat-induced injury. Such metabolic stabilization is consistent with previous reports linking antioxidant capacity and carbon–nitrogen balance to reduced chalkiness and improved grain weight under high temperature [6,21,26]. Hence, the coordinated activation of energy and redox metabolism in ‘Fusaotome’ provides a physiological foundation for its ability to maintain grain quality and yield under warming conditions.
The generally weaker metabolic response observed in roots compared with panicles may reflect fundamental physiological and environmental differences. Soil provides thermal buffering, and temperature fluctuations are smaller than in aboveground tissues, resulting in milder and slower stress perception by roots [13]. Root tissues also exhibit greater metabolic stability and slower turnover, prioritizing long-term adjustments in carbon and nitrogen metabolism rather than rapid shifts in soluble metabolites. Moreover, roots perceive heat stress indirectly through hydraulic and hormonal signaling, including abscisic acid and ROS-mediated pathways, which may delay or attenuate their metabolic responses relative to directly exposed panicles [10,24].
The metabolomics experiment used n = 3 biological replicates per group, which constrains statistical power. Future work should focus on quantitatively validating the key metabolites identified in this study and integrating them with transcriptome analysis to construct a more comprehensive model of heat tolerance.
5. Conclusions
This study compared the metabolic responses of the heat-tolerant cultivar “Fusaotome” and the conventional cultivar “Akitakomachi” under high-temperature conditions, revealing distinct metabolic strategies in panicles and roots. In particular, spermidine and proline emerged as characteristic metabolites associated with heat tolerance in ‘Fusao-tome’, alongside maintenance of energy metabolism and redox balance. These results enhance our understanding of the molecular mechanisms underlying heat tolerance and highlight the potential for developing metabolic markers using specific metabolites or pathways as indicators. Our findings are expected to provide a foundation for breeding and cultivation strategies aimed at ensuring stable rice production under climate change.
Supplementary Materials
The following supporting information can be downloaded at: https://www.mdpi.com/article/10.3390/agriculture15212255/s1, Table S1: Complete lists of detected metabolites in panicles (n = 308). Table S2: Complete lists of detected metabolites in roots (n = 260).
Author Contributions
A.O., S.Y. and K.T. designed the study. A.O., S.Y. and K.T. performed the experiments. A.O. analyzed the data. A.O. wrote the manuscript with contributions from the other authors. All authors have read and agreed to the published version of the manuscript.
Funding
This study was supported by JSPS KAKENHI (Grant Number: JP23K23593).
Institutional Review Board Statement
Not applicable.
Data Availability Statement
The data presented in this study are available upon request from the Corresponding author.
Conflicts of Interest
The authors declare no conflicts of interest.
Abbreviations
The following abbreviations are used in this manuscript:
| ROS | Reactive oxygen species |
| SOD | Superoxide dismutase |
| POD | Peroxidase |
| GSSG | Oxidized glutathione |
References
- Jagadish, S.; Murty, M.; Quick, W. Rice responses to rising temperatures–challenges, perspectives and future directions. Plant Cell Environ. 2015, 38, 1686–1698. [Google Scholar] [CrossRef]
- Prasad, P.; Boote, K.; Allen, L., Jr.; Sheehy, J.; Thomas, J. Species, ecotype and cultivar differences in spikelet fertility and harvest index of rice in response to high temperature stress. Field Crops Res. 2006, 95, 398–411. [Google Scholar] [CrossRef]
- Ishigooka, Y.; Kuwagata, T.; Nishimori, M.; Hasegawa, T.; Ohno, H. Spatial characterization of recent hot summers in Japan with agro-climatic indices related to rice production. J. Agric. Meteorol. 2011, 67, 209–224. [Google Scholar] [CrossRef]
- Morita, S.; Wada, H.; Matsue, Y. Countermeasures for heat damage in rice grain quality under climate change. Plant Prod. Sci. 2016, 19, 1–11. [Google Scholar] [CrossRef]
- Tashiro, T.; Wardlaw, I.F. The effect of high temperature at different stages of ripening on grain set, grain weight and grain dimensions in the semi-dwarf wheat ‘Banks’. Ann. Bot. 1990, 65, 51–61. [Google Scholar] [CrossRef]
- Yamakawa, H.; Hakata, M. Atlas of rice grain filling-related metabolism under high temperature: Joint analysis of metabolome and transcriptome demonstrated inhibition of starch accumulation and induction of amino acid accumulation. Plant Cell Physiol. 2010, 51, 795–809. [Google Scholar] [CrossRef]
- Shi, W.; Muthurajan, R.; Rahman, H.; Selvam, J.; Peng, S.; Zou, Y.; Jagadish, K.S. Source–sink dynamics and proteomic reprogramming under elevated night temperature and their impact on rice yield and grain quality. New Phytol. 2013, 197, 825–837. [Google Scholar] [CrossRef] [PubMed]
- Liao, J.-L.; Zhou, H.-W.; Zhang, H.-Y.; Zhong, P.-A.; Huang, Y.-J. Comparative proteomic analysis of differentially expressed proteins in the early milky stage of rice grains during high temperature stress. J. Exp. Bot. 2014, 65, 655–671. [Google Scholar] [CrossRef]
- Mitsui, T.; Yamakawa, H.; Kobata, T. Molecular physiological aspects of chalking mechanism in rice grains under high-temperature stress. Plant Prod. Sci. 2016, 19, 22–29. [Google Scholar] [CrossRef]
- Foyer, C.H.; Noctor, G. Redox homeostasis and antioxidant signaling: A metabolic interface between stress perception and physiological responses. Plant Cell 2005, 17, 1866–1875. [Google Scholar] [CrossRef]
- Mei, W.; Chen, W.; Wang, Y.; Liu, Z.; Dong, Y.; Zhang, G.; Deng, H.; Liu, X.; Lu, X.; Wang, F. Exogenous kinetin modulates ROS homeostasis to affect heat tolerance in rice seedlings. Int. J. Mol. Sci. 2023, 24, 6252. [Google Scholar] [CrossRef]
- Mthiyane, P.; Aycan, M.; Mitsui, T. Strategic advancements in rice cultivation: Combating heat stress through genetic innovation and sustainable practices—A review. Stresses 2024, 4, 452–480. [Google Scholar] [CrossRef]
- Arai-Sanoh, Y.; Ishimaru, T.; Ohsumi, A.; Kondo, M. Effects of soil temperature on growth and root function in rice. Plant Prod. Sci. 2010, 13, 235–242. [Google Scholar] [CrossRef]
- Zhen, B.; Li, H.; Niu, Q.; Qiu, H.; Tian, G.; Lu, H.; Zhou, X. Effects of combined high temperature and waterlogging stress at booting stage on root anatomy of rice (Oryza sativa L.). Water 2020, 12, 2524. [Google Scholar] [CrossRef]
- Soga, T.; Ohashi, Y.; Ueno, Y.; Naraoka, H.; Tomita, M.; Nishioka, T. Quantitative metabolome analysis using capillary electrophoresis mass spectrometry. J. Proteome Res. 2003, 2, 488–494. [Google Scholar] [CrossRef] [PubMed]
- Pang, Z.; Lu, Y.; Zhou, G.; Hui, F.; Xu, L.; Viau, C.; Spigelman, A.F.; MacDonald, P.E.; Wishart, D.S.; Li, S. MetaboAnalyst 6.0: Towards a unified platform for metabolomics data processing, analysis and interpretation. Nucleic Acids Res. 2024, 52, W398–W406. [Google Scholar] [CrossRef]
- Zhang, S.; Wang, S.; Wang, S.; Su, H.; De, J. Genetic Diversity and Metabolic Profile of Tibetan Medicinal Plant Saussurea obvallata. Genes 2025, 16, 593. [Google Scholar] [CrossRef]
- Chen, D.; Shao, Q.; Yin, L.; Younis, A.; Zheng, B. Polyamine function in plants: Metabolism, regulation on development, and roles in abiotic stress responses. Front. Plant Sci. 2019, 9, 1945. [Google Scholar] [CrossRef]
- Kusano, T.; Berberich, T.; Tateda, C.; Takahashi, Y. Polyamines: Essential factors for growth and survival. Planta 2008, 228, 367–381. [Google Scholar] [CrossRef] [PubMed]
- Fu, Y.; Gu, Q.; Dong, Q.; Zhang, Z.; Lin, C.; Hu, W.; Pan, R.; Guan, Y.; Hu, J. Spermidine enhances heat tolerance of rice seeds by modulating endogenous starch and polyamine metabolism. Molecules 2019, 24, 1395. [Google Scholar] [CrossRef] [PubMed]
- Tang, S.; Zhang, H.; Li, L.; Liu, X.; Chen, L.; Chen, W.; Ding, Y. Exogenous spermidine enhances the photosynthetic and antioxidant capacity of rice under heat stress during early grain-filling period. Funct. Plant Biol. 2018, 45, 911–921. [Google Scholar] [CrossRef]
- Zhou, R.; Hu, Q.; Pu, Q.; Chen, M.; Zhu, X.; Gao, C.; Zhou, G.; Liu, L.; Wang, Z.; Yang, J. Spermidine enhanced free polyamine levels and expression of polyamine biosynthesis enzyme gene in rice spikelets under heat tolerance before heading. Sci. Rep. 2020, 10, 8976. [Google Scholar] [CrossRef]
- Noctor, G.; Mhamdi, A.; Chaouch, S.; Han, Y.; Neukermans, J.; Marquez-Garcia, B.; Queval, G.; Foyer, C.H. Glutathione in plants: An integrated overview. Plant Cell Environ. 2012, 35, 454–484. [Google Scholar] [CrossRef]
- Kavi Kishor, P.B.; Suravajhala, P.; Rathnagiri, P.; Sreenivasulu, N. Intriguing role of proline in redox potential conferring high temperature stress tolerance. Front. Plant Sci. 2022, 13, 867531. [Google Scholar] [CrossRef]
- Renzetti, M.; Funck, D.; Trovato, M. Proline and ROS: A unified mechanism in plant development and stress response? Plants 2024, 14, 2. [Google Scholar] [CrossRef] [PubMed]
- Guo, M.; Zhang, X.; Liu, J.; Hou, L.; Liu, H.; Zhao, X. OsProDH negatively regulates thermotolerance in rice by modulating proline metabolism and reactive oxygen species scavenging. Rice 2020, 13, 61. [Google Scholar] [CrossRef]
- Francioso, A.; Baseggio Conrado, A.; Mosca, L.; Fontana, M. Chemistry and biochemistry of sulfur natural compounds: Key intermediates of metabolism and redox biology. Oxidative Med. Cell. Longev. 2020, 2020, 8294158. [Google Scholar] [CrossRef] [PubMed]
- Ashraf, M.; Foolad, M. Roles of glycine betaine and proline in improving plant abiotic stress resistance. Environ. Exp. Bot. 2007, 59, 206–216. [Google Scholar] [CrossRef]
- Gill, S.S.; Tuteja, N. Polyamines and abiotic stress tolerance in plants. Plant Signal. Behav. 2010, 5, 26–33. [Google Scholar] [CrossRef]
- Masclaux-Daubresse, C.; Daniel-Vedele, F.; Dechorgnat, J.; Chardon, F.; Gaufichon, L.; Suzuki, A. Nitrogen uptake, assimilation and remobilization in plants: Challenges for sustainable and productive agriculture. Ann. Bot. 2010, 105, 1141–1157. [Google Scholar] [CrossRef]
- Arnao, M.B.; Hernández-Ruiz, J. Melatonin: A new plant hormone and/or a plant master regulator? Trends Plant Sci. 2019, 24, 38–48. [Google Scholar] [CrossRef] [PubMed]
- Zhao, D.; Yu, Y.; Shen, Y.; Liu, Q.; Zhao, Z.; Sharma, R.; Reiter, R.J. Melatonin synthesis and function: Evolutionary history in animals and plants. Front. Endocrinol. 2019, 10, 441357. [Google Scholar] [CrossRef] [PubMed]
- Sipari, N.; Lihavainen, J.; Keinänen, M. Metabolite Profiling of Paraquat Tolerant Arabidopsis thaliana Radical-induced Cell Death1 (rcd1)—A Mediator of Antioxidant Defence Mechanisms. Antioxidants 2022, 11, 2034. [Google Scholar] [CrossRef]
- El-Azaz, J.; Moore, B.; Takeda-Kimura, Y.; Yokoyama, R.; Wijesingha Ahchige, M.; Chen, X.; Schneider, M.; Maeda, H.A. Coordinated regulation of the entry and exit steps of aromatic amino acid biosynthesis supports the dual lignin pathway in grasses. Nat. Commun. 2023, 14, 7242. [Google Scholar] [CrossRef]
- Ingrisano, R.; Tosato, E.; Trost, P.; Gurrieri, L.; Sparla, F. Proline, cysteine and branched-chain amino acids in abiotic stress response of land plants and microalgae. Plants 2023, 12, 3410. [Google Scholar] [CrossRef]
- Kishor, P.K.; Suravajhala, R.; Rajasheker, G.; Marka, N.; Shridhar, K.K.; Dhulala, D.; Scinthia, K.P.; Divya, K.; Doma, M.; Edupuganti, S. Lysine, lysine-rich, serine, and serine-rich proteins: Link between metabolism, development, and abiotic stress tolerance and the role of ncRNAs in their regulation. Front. Plant Sci. 2020, 11, 546213. [Google Scholar] [CrossRef]
- Tang, S.; Xian, Y.; Wang, F.; Luo, C.; Song, W.; Xie, S.; Chen, X.; Cao, A.; Li, H.; Liu, H. Comparative transcriptome analysis of leaves during early stages of chilling stress in two different chilling-tolerant brown-fiber cotton cultivars. PLoS ONE 2021, 16, e0246801. [Google Scholar] [CrossRef]
- Yang, X.; Kwon, H.; Kim, M.Y.; Lee, S.-H. RNA-seq profiling in leaf tissues of two soybean (Glycine max [L.] Merr.) cultivars that show contrasting responses to drought stress during early developmental stages. Mol. Breed. 2023, 43, 42. [Google Scholar] [CrossRef] [PubMed]


Disclaimer/Publisher’s Note: The statements, opinions and data contained in all publications are solely those of the individual author(s) and contributor(s) and not of MDPI and/or the editor(s). MDPI and/or the editor(s) disclaim responsibility for any injury to people or property resulting from any ideas, methods, instructions or products referred to in the content. |
© 2025 by the authors. Licensee MDPI, Basel, Switzerland. This article is an open access article distributed under the terms and conditions of the Creative Commons Attribution (CC BY) license (https://creativecommons.org/licenses/by/4.0/).