Abstract
This study investigated the effects of different water management practices on the growth, yield, and grain quality of rice grown under environmentally friendly farming methods in Apgok-Ri, Gungnyu-Myeon, Uiryeong-Gun, from 2022 to 2024. Treatments included mid-season drainage for 2, 3, or 4 weeks (2MD, 3MD, 4MD), followed by either low-level water management (MD-1) or alternate wetting and drying (MD-2), with continuous flooding (CF) as the control. The rice variety was machine-transplanted on 9–10 June, and organic fertilizer (90 kg N/ha) was applied as a basal dressing. Water treatments were initiated in mid-July each year. The highest yield was consistently recorded in the 2MD-2 treatment, with 5.85, 5.74, and 5.38 tons/ha from 2022 to 2024, representing 15.0%, 14.5%, and 7.8% increases over CF, respectively. On average, alternate irrigation (MD-2) resulted in higher yields than low-level water management (MD-1) by 1.19–5.90%. Grain quality was also highest in 2MD-2, showing the greatest percentage of ripened grains each year, whereas CF had the highest proportion of immature and unripe grains. Crude protein content in brown rice was lowest in 3MD-2 (6.12%), followed by 2MD-2 (7.51%). Incidences of major diseases such as sheath blight, rice blast, panicle blight, and bacterial grain blight were highest in the CF treatment. Rice leaf blight was not significantly different in 2022, but was most prevalent in CF in 2023 and 2024. There were no major differences in brown planthopper and false smut incidence, although false smut peaked in CF in 2024. These findings suggest that 2-week mid-season drainage followed by alternate irrigation (2MD-2) is an effective strategy to improve yield, grain quality, and disease resistance in sustainable rice farming systems.
1. Introduction
Climate change has significantly impacted human life, ecosystems, and infrastructure worldwide, resulting in considerable losses and damage. As global warming progresses, the associated risks and negative impacts are expected to escalate [1,2]. It has contributed to increased disease rates, fatalities from heatwaves, and waterborne diseases, adversely affecting both physical and mental health. Rural areas, which depend heavily on agriculture, are particularly vulnerable. Climate change is likely to worsen food insecurity and destabilize supply chains [2].
Rice (Oryza sativa L.) is a water-intensive crop, consuming over half of Asia’s irrigation water [3]. Despite substantial water use, rice’s water efficiency is low [4]. Climate change exacerbates the global water crisis, contributing to droughts and increased water pollution that limit the availability of irrigation water [5]. In South Korea, rice cultivation occupies 50.2% of agricultural land [6], intensifying the demand for water. Recent droughts and constrained water supplies forewarn of potential agricultural water shortages [7], necessitating proactive countermeasures.
Rice cultivation demands substantial water for continuous flooding, leading to significant losses through evaporation and soil permeability [8]. Freshwater scarcity endangers irrigation systems, affecting productivity and sustainability [4]. To address these challenges, it is essential to reduce agricultural water use and develop smart water management technologies [9]. Techniques like mid-season drainage and discontinuous flooding enhance water efficiency and mitigate crop damage from weather disasters [10,11]. Water stress during the early growth and meiosis stages of rice can result in yield losses [12]. Effective water management is critical to minimize water shortages and yield reductions [13]. For instance, the alternate wetting and drying method decreased water use by 13.0%, increased yield by 22.9%, and enhanced water use efficiency by 41.6% [14]. Recent studies also investigate eco-friendly practices for sustainable agriculture [15].
Organic farming, as an eco-friendly approach, enhances the market value of agricultural products and increases income through lower input costs [16]. Although organic yields may be lower than those in conventional farming, consumers are prepared to pay a premium for environmentally grown products, thereby improving profitability [17]. As organic farming expands, water management in rice paddies offers several advantages, although moisture stress can cause various types of damage depending on the rice growth stage [18]. Water stress during the early growth and meiosis stages of rice significantly affects yield [12,13,19], making water management tailored to the growth stages crucial.
Alternating between irrigation and drying increased carbohydrate accumulation in stems and panicles compared to continuous flooding [20]. However, under dry conditions, rice exposed to moisture stress exhibited more starch accumulation in the stem at maturity, with a reduced proportion of starch translocated to the panicle [21,22]. These results highlight the profound effect of water management on rice quality. Factors that influence rice quality include variety, climate, soil, and cultivation techniques, with evaluations based on appearance, protein content, starch type, and minerals [23]. This study aims to assess rice quality through analysis of appearance and crude protein content.
Climate change impacts agricultural ecosystems in various ways, including pest outbreaks, population dynamics, and biodiversity [24]. Research on pests such as rice planthoppers and rice stem borers has shown that rising temperatures affect the dynamics of pest populations [25]. However, most previous studies have focused on either water-saving techniques or their effects on yield, with limited integration of quality and pest response under varying water regimes. Furthermore, few studies have investigated these factors under long-term organic cultivation using automated irrigation control systems.
Thus, this study offers a novel, comprehensive approach by evaluating the effects of three different water management practices—continuous flooding, low-level water management, and alternate wetting and drying—combined with mid-season drainage durations of 2, 3, and 4 weeks over a three-year period. It uniquely integrates measurements of rice growth, yield, grain quality, and pest occurrence under organic farming conditions using precision irrigation tools. Although technological advancements have diminished pest occurrences, it is suggested that climate change might escalate the frequency of pest outbreaks and could lead to the spread of pests from other regions, adversely impacting crop production [24]. Consequently, diverse studies are underway to investigate the effects of climate change [25,26,27,28,29].
However, specific studies on how environmentally friendly water management practices in rice cultivation affect not only growth but also quality, yield, and pest outbreaks are still lacking. Moreover, these effects may vary by climatic and regional factors, underscoring the need for further research.
Therefore, this study was conducted to analyze the yield, quality of brown rice, and pest outbreaks under various water management practices, including continuous flooding, low-level water management, and alternate water irrigation, after mid-season drainage for periods of 2, 3, and 4 weeks over 3 years. The objective is to provide foundational data for sustainable agriculture, propose effective cultivation methods for stable production, and determine the best water management practices for producing high-quality rice.
2. Materials and Methods
2.1. Experimental Materials and Cultivation Methods
The experiment was conducted over three years, from 2022 to 2024, between May and October, at an environmentally friendly paddy field located in Apgok-Ri, Gungryu-Myeon, Uiryeong-Gun, Gyeongsangnam-Do (35.4336866° N, 128.2652065° E), using the Saecheongmu rice variety. Over the past 10 years, prior to the experiment, the experimental field had been treated with Multi Power Gold organic fertilizer (MPG, Farmfriend, Cheongju, Republic of Korea) at a rate of 90 kg N ha−1, and winter crops such as barley were cultivated. Prior to sowing the barley, 600 kg ha−1 of MPG was applied. The experimental soil, loamy with slightly good drainage, was characterized chemically in Table 1. Before selecting the field for experimentation, soil chemical parameters, including organic matter content (OM) and drainage conditions, were assessed to ensure that the selected fields exhibited less than 5% variance in these parameters. The experiment employed a single-factor design, with each plot covering over 400 m2 and three replicates. All management practices across the plots were standardized to minimize errors.

Table 1.
Soil chemical properties after the experiment on diurnal variation in methane emissions influenced by water management treatments in rice cultivation (2022).
The organic fertilizer was applied at a rate of 1200 kg ha−1 on 29 May 2022, 27 May 2023, and 29 May 2024, using a tractor-mounted fertilizer spreader (CH-600J, Cheong Song, Republic of Korea) and subsequently incorporated into the soil with a rotary tiller. Before transplanting, the paddy fields were flooded to a depth of 5 cm on 30 May 2022, 5 June 2023, and 4 June 2024, with the water level maintained between 5 and 7 cm until the application of mid-season drainage.
The water management treatments for 2022 included: ① Mid-season drainage for 2 weeks + low-level water management (2MD-1), ② Mid-season drainage for 2 weeks + alternate water irrigation (2MD-2), ③ Mid-season drainage for 3 weeks + low-level water management (3MD-1), ④ Mid-season drainage for 4 weeks + low-level water management (4MD-1), ⑤ Mid-season drainage for 4 weeks + alternate water irrigation (4MD-2), and ⑥ continuous flooding (CF). Following a review of the previous year’s yields, the 4MD-2 treatment, deemed impractical for farm usage in 2023, was discontinued and replaced with a new 3-week mid-season drainage + alternate water irrigation treatment (3MD-2). The CF treatment continued with two iterations. The following adjustments were made for 2024 based on 2023 yield assessments: the ineffective 4MD-1 treatment was dropped, and the remaining treatments were ① 2MD-1, ② 2MD-2, ③ 3MD-1, ④ 3MD-2, and ⑤ CF as documented in Table 2.
Table 2.
Mid-season drainage schedule and water management treatments (2022–2024).
2.2. Water Management Methods and Treatment
The mid-season drainage treatment commenced on 13 July in 2022 and 2023, and on 8 July in 2024, prior to the average tiller number per plant exceeding 15 and the appearance of non-productive tillers. Following mid-season drainage, irrigation for treatments 2MD-1 and 2MD-2 was initiated on 27 July in 2022 and 2023, and on 22 July in 2024. Similarly, irrigation for treatments 3MD-1 and 3MD-2 began on 3 August in 2022 and 2023, and on 29 July in 2024. The initiation of irrigation for treatments 4MD-1 and 4MD-2 occurred on 10 August 2022 and 2023, as detailed in Table 1. The irrigation procedures were implemented via the JINONG Inc. app (JINONG Inc., Gwangju, Republic of Korea; version 1.0.19), integrated with the Rural Development Administration’s systems, enabling automated control of water gates via a video-controlled system (TSWV-125ACF, Seoul, Republic of Korea) and a water level sensor (TSHD-UDWG, Seoul, Republic of Korea). Automatic irrigation was executed according to predetermined water levels specific to each water management treatment (Figure 1).
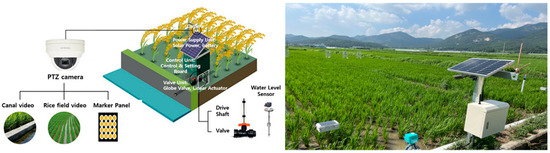
Figure 1.
Automated Irrigation Control System.
The low-level water management treatment involved activating the automated water gate and adjusting the sensor to a 4 cm level, maintaining a constant water depth of 4 cm in the experimental field until complete drainage. Following mid-season drainage, the alternate water irrigation treatment was commenced. From the onset of irrigation to complete drainage, the automated water gate was opened at weekly intervals, the sensor set at 4 cm, ensuring the water depth remained at 4 cm in the experimental field. Subsequently, the water gate was closed, allowing the field to naturally dry until the water depth was reduced to below 0 cm. In contrast, the CF treatment maintained a water depth of 5–8 cm continuously throughout the growing season. Complete drainage was executed following the ripening stage on 29 September 2022, on 5 October 2023, and on 25 September 2024. Rice was harvested using a combine (HJ6115, TYM, Gimhae, Republic of Korea) on 10 October 2022, 15 October 2023, and 5 October 2024.
2.3. Survey Method
2.3.1. Rice Quality
The rice quality survey was conducted from 2022 to 2024. Rice was harvested from each treatment plot in three replicates of 2 m × 2 m areas. The harvested rice was milled into brown rice using a rice milling machine (BH-06, SSANGYONG, Seoul, Republic of Korea), and 1000 grains per replicate were used for quality analysis. Using a grain classifier (RGQI 90A-KR, Satake, Hiroshima, Japan), rice was categorized into several types: sound rice (grains that retain 3/4 or more of their volume in a well-formed shape), immature grains (grains that exhibit 3/4 or more of their volume as immature, excluding sound rice), discolored grains (grains that show surface discoloration), and damaged grains (which include sprouted, rotten, deformed, or cracked grains). Each treatment involved sampling 1000 grains and repeating the process three times, in accordance with the Agricultural Science and Technology Research and Analysis Standards [30].
2.3.2. Brown Rice Crude Protein Analysis
The crude protein content was determined using the Kjeldahl method [31]. Initially, the total nitrogen content of the plant sample was measured. Subsequently, the protein content was calculated by multiplying the total nitrogen by a conversion factor of 5.95. The brown rice was ground and subjected to wet digestion. Subsequently, a 2% NaOH solution was added to the sample for distillation. The distillate was then titrated using 0.05 N H2SO4, and the total nitrogen content was determined based on the volume (mL) of titrant used. The formula is as follows (1)
Crude protein = (T − B) × f × N × 14 × (V ÷ w) × (100 ÷ s) × 5.95.
T = Volume (mL) of sulfuric acid used for the sample titration
B = Volume (mL) of sulfuric acid used for the blank titration.
f = Factor of the sulfuric acid standard solution.
N = Normality of the sulfuric acid solution.
V = Final volume (mL) of the sample solution after digestion.
w = Weight (mg) of the plant sample before digestion.
s = Volume (mL) of the sample solution in the Kjeldahl flask.
2.3.3. Pest and Disease Occurrence Patterns
The occurrence of pests and diseases was observed visually. The assessments of leaf blight (Cochliobolus miyabeanus, Alternaria spp.) and rice brown planthopper (Nilaparvata lugens) were conducted before the heading stage over three years. For other diseases, including leaf sheath blight (Cochliobolus miyabeanus), panicle blight (Fusarium fujikuroi), bacterial grain blight (Burkholderia glumae), rice blast (Pyricularia oryzae), and false smut (Ustilaginoidea virens), assessments were conducted after heading and involved 20 weeks of observation for each treatment, repeated three times annually. According to the RDA 2012 Agricultural Science and Technology Research and Analysis Standards, leaf blight occurrence was quantified as the percentage of the infected area compared to the total leaf area. The density of rice brown planthoppers was calculated by converting the number of planthoppers per plant into a percentage. The infection percentages for leaf sheath blight and panicle blight were calculated relative to the total stems and grains surveyed, respectively. Bacterial grain blight and rice blast were reported as the percentage of infected panicles comprising infected panicle necks, branches, and nodes relative to the total panicles surveyed, while the incidence of false smut was estimated as the percentage of infected panicles relative to all surveyed panicles.
2.3.4. Rice Yield
For yield assessment, rice was harvested from a 2 × 2 m plot using a sickle and processed with a thresher (BHD-1500, Buheng, Buyeo, Republic of Korea). The threshed rice was then divided into clean rice and empty grains. From each plot, 3 samples of 1 kg of clean rice were milled using a portable milling machine (BH-06, SSANGYONG, Seoul, Republic of Korea) to separate and remove husks and broken grains. Finally, the brown rice yield was determined based on the yield per unit area, with the moisture content adjusted to 14.5%. Yield components and overall yield assessments were conducted in accordance with the Agricultural Science and Technology Research and Analysis Standards [30].
2.3.5. Soil Chemistry and Moisture Content
Soil samples were collected using an auger (Ø 50.8 mm, Eijkelkamp, Giesbeek, The Netherlands), with three replications per treatment. Samples from six points within each replication were pooled for analytical purposes. Analysis was conducted according to the Soil and Plant Analysis Methods endorsed by the Rural Development Administration [32].
Soil moisture content was measured at a depth of 10 cm near the chamber using a Teros12 sensor (METER, Pullman, WA, USA). Data were captured via the ZSC data receiver module (METER, Pullman, WA, USA) and were processed using the ZENTRA Utility app (METER Group, Inc., Pullman, WA, USA), with three repetitions per treatment.
2.4. Statistical Analysis
Data were analyzed using the PROC ANOVA procedure in SAS software (V.9.4, Cary, NC, USA), and means were compared at the 5% significance level using Duncan’s Multiple Range Test (DMRT). A two-way analysis of variance (2-way ANOVA) for yield-related factors and yield, encompassing various years and treatments, was executed using the aov( ) function in R software (version 4.0.5), maintaining a significance level of 5% [33].
3. Results and Discussion
3.1. Climate Conditions During the Experimental Period
The results of the experiment conducted to assess pest occurrence, quality, and yield of rice under different water management practices in an environmentally friendly paddy field are as follows. With regards to changes in climate characteristics, the daily average temperature in June, during the early growth stage of rice, was 2.06 °C higher in 2023 and 5.07 °C higher in 2024 compared to 2022. From the heading stage to the ripening stage, average temperatures were 2.74 °C higher in 2023 and 4.81 °C higher in 2024 relative to 2022 (Figure 2). During the ripening stage, the average temperature in 2024 was 2.09 °C above that in 2023 and 4.65 °C above that in 2022. The accumulated temperature from transplanting to harvest amounted to 3086 °C in 2022, 3155 °C in 2023 (69.0 °C higher than in 2022), and 3191 °C in 2024 (105 °C above 2022 and 36 °C above 2023). In 2022 and 2023, the peak monthly total rainfall was during the mid-drainage period from July to August, whereas in 2024, the most significant rainfall occurred in September (Figure 3). Over three years, total rainfall during the mid-drainage period surpassed the average annual rainfall, characterizing the rainy season. Despite this, experimental plots maintained effective drainage through consistent management of drainage channels, preserving the mid-drainage effect.
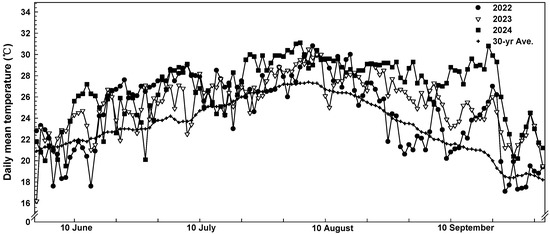
Figure 2.
The daily mean air temperature in rice cultivation fields (2022–2024). 30-yr Ave.: normal temperature (1991–2020).

Figure 3.
Monthly total rainfall (2022–2024). 30-yr Ave: normal rainfall (1991–2020).
3.2. Soil Chemical Properties and Soil Moisture Content
In terms of soil chemical characteristics before the experiment (2022), the content of organic matter (OM) varied from 20.9% to 28.9% (Table 2). Post-experiment, the pH in 2022 had increased, ranging from 5.23 to 5.90, while the OM content declined to 22.3–29.3 g kg−1 in the CF and 2MD treatments. In 2023, the OM content ranged from 21.7 to 28.7 g kg−1 (Table 3). By 2024, T-C decreased after the experiment, and in certain treatments, a reduction in OM was observed post-experiment compared to pre-experiment levels (Table 4). No significant trends were discernible across the various water management treatments over the three-year study.
Table 3.
Soil chemical properties after the experiment on diurnal variation in methane emissions influenced by water management treatments in rice cultivation (2023).
Table 4.
Soil chemical properties after the experiment on diurnal variation in methane emissions influenced by water management treatments in rice cultivation (2024).
The soil moisture content fluctuated between 42.0% and 53.9% over the three years before the mid-season drainage treatment (Figure 4). In the 2MD treatment, soil moisture content remained stable despite the rainy season. Conversely, in the 3MD and 4MD treatments, soil moisture fell to a minimum of 27.7% on rain-free days. In the water management treatment, the moisture content also declined. Overall, across all water management strategies, soil moisture content decreased with mid-season drainage compared to continuous flooding, with the low-level water management treatment showing a more pronounced reduction in moisture levels compared to alternate water irrigation. This indicates the efficacy of mid-season drainage and implemented water management practices.
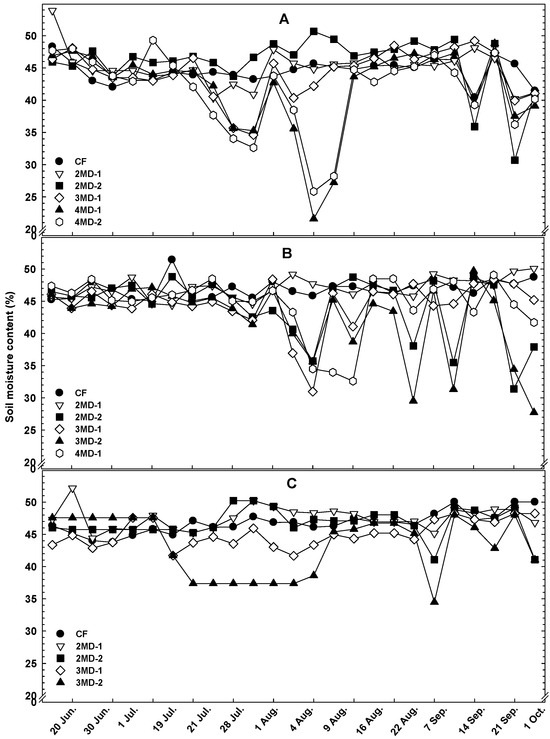
Figure 4.
Change in soil moisture contents by water management treatments (2022, (A); 2023, (B); 2024, (C)). CF, continuously flooded; MD, mid-season drainage (2, 3, 4 weeks); MD-1, low-level water management; MD-2, alternate water irrigation.
3.3. Yield Variation by Water Management
Annual variations in yield by water management method are illustrated in Figure 5. In 2022, 2MD-2 achieved the highest yield, registering 5.85 ton ha−1, which was 15.0% higher than that of CF. There were no significant differences among the CF, 4MD-1, and 4MD-2 treatments. In 2023, following the 2022 results, 4MD-2 was excluded from the experiment due to its low yield and ineffectiveness for farm use. To elucidate the distinctions between low-level water management and alternate water irrigation, the 3MD-2 treatment was introduced. By 2023, the yield hierarchy was as follows: 2MD-2 > 2MD-1 > 3MD-2 > 3MD-1 > CF > 4MD-1. 2MD-2 yielded 5.74 ton ha−1, which was 14.5% higher than CF. In 2024, due to its poor performance the previous year, 4MD-1 was excluded from the experiment. Consequently, 2MD-2 yielded the highest at 5.38 ton ha−1, outperforming continuous flooding (4.96 ton ha−1) by 8.47%. 2MD-1 recorded the second-highest yield, while no significant differences were noted among 3MD-1, 3MD-2, and CF. Over three years, 2MD-2 consistently yielded the highest, demonstrating that alternate water irrigation can enhance yields by 1.19–5.90% compared to low-level water management. Throughout this period, all water management treatments, except for the 4MD series, consistently outperformed or matched CF.
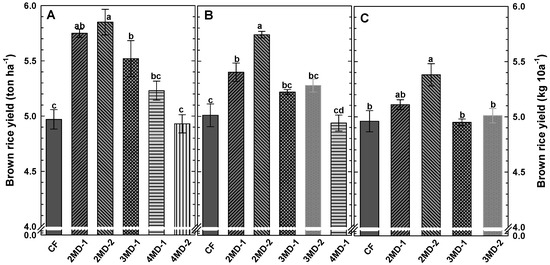
Figure 5.
Changes in brown rice yield as affected by water management treatments (2022–2024). (A): 2022; (B): 2023; (C): 2024. CF, continuously flooded; MD, mid-season drainage (2, 3, 4 weeks); MD-1, low-level water management; MD-2, alternate water irrigation. Means ± SE (n = 3; 10 plants/replicate). Different letters indicate significant differences (DMRT, p < 0.05).
3.4. Rice Quality Evaluation by Water Management
In 2022, rice quality assessments based on water management methods revealed that 2MD-2 had the highest percentage of well-formed grains at 93.2%, surpassing CF by 4.50% (Figure 6). CF, along with 4MD-1 and 4MD-2, recorded the lowest percentage of well-formed grains, at 88.7%, 89.8%, and 89.9%, respectively. There were no significant differences in the prevalence of colored or damaged grains across the treatments. However, the highest percentages of unfilled and immature grains were observed in CF, at 7.15% and 6.11%, respectively.

Figure 6.
Changes in rice quality as affected by water management treatment. (A): 2022; (B): 2023; (C): 2024. CF, continuously flooded; MD, mid-season drainage (2, 3, 4 weeks); MD-1, low-level water management; MD-2, alternate water irrigation. Means ± SE (n = 3; 10 plants/replicate). Different letters indicate significant differences (DMRT, p < 0.05).
In 2023, 2MD-2 once again exhibited the highest percentage of well-formed grains at 90.6%, following the trend observed in 2022. CF recorded the lowest percentage at 74.1%, with 2MD-2 demonstrating a 16.5% advantage in well-formed grains relative to CF. Though there were no significant differences in colored or damaged grains among the treatments, CF contained the highest percentages of unfilled and immature grains, at 9.15% and 13.3%, respectively.
In 2024, 2MD-2 exhibited the highest percentage of well-formed grains at 82.0%, whereas CF recorded the lowest at 61.7%. In the same year, CF had the highest occurrence of unfilled grains at 27.8%, following the trends observed in 2022 and 2023. However, no significant differences were observed in the incidence of immature grains, which contrasts with patterns from previous years. This suggests that the extended periods of high temperatures during 2024’s ripening stage (Figure 2) likely affected rice quality. The increase in unfilled grains resulted in a relative decline in immature grains, potentially explaining the observed uniformity in immature grains across various water management treatments.
Choi et al. [13] observed that water-saving irrigation initiated 20 to 35 days post-transplanting decreased the ratio of fully developed grains by 1~2% compared to conventional irrigation, presenting a departure from this study’s findings. This disparity may be due to differences in the timing and duration of mid-season drainage and moisture treatments, as well as distinctions in water management techniques, encompassing low-level water management and alternate water irrigation. Thus, it is recommended that implementing alternate water irrigation following 2 weeks of mid-season drainage could enhance the proportion of well-formed grains and improve rice quality.
3.5. Protein Content of Brown Rice by Water Management
The 2024 harvest data to evaluate the crude protein content in brown rice under various water management treatments are depicted in Figure 7. No significant differences in protein content were found among CF, 2MD-1, and 3MD-1, with respective values of 8.26%, 8.23%, and 8.42%. However, 2MD-2 registered a crude protein content of 7.51%, which was 8.0% lower than CF’s, and 3MD-2 reported a content of 6.12%, 23.1% lower than CF. This pattern aligns with the findings of Zhang et al. [34], who demonstrated that irrigation methods significantly influence protein content, and You et al. [35], who noted that water-saving irrigation enhances amylose content while reducing crude protein levels.

Figure 7.
Crude protein as affected by water management treatments (2024). CF, continuously flooded; MD, mid-season drainage (2, 3, 4 weeks); MD-1, low-level water management; MD-2, alternate water irrigation. Means ± SE (n = 3; three technical replicates per sample). Different letters indicate significant differences (DMRT, p < 0.05).
No significant differences were observed in crude protein content between the mid-season drainage and low-level water management treatments. However, a notable difference was observed in the alternate water irrigation treatment, which was attributable to the method of irrigation employed. Both CF and low-level water management maintained a continuous water flow into the paddy field via canals, whereas alternate water irrigation involved interrupting the water flow after brief periods of irrigation. Consequently, the water temperature during irrigation was comparatively higher, which accounted for the observed differences.
Although rice contains more starch than protein, a higher protein content results in firmer, less sticky rice, which diminishes its palatability [36,37]. The study reveals that 3MD-2, with the lowest protein content, is anticipated to possess superior eating quality. However, due to its relatively lower yield (Figure 4), it is determined that the most efficacious method of water management, which both boosts yield and enhances palatability, is the use of alternate water irrigation following 2 weeks of mid-season drainage. This approach yielded the highest production and the second-lowest protein level.
Considering that the protein content in rice is affected by multiple factors, including variety, cultivation timing, fertilizers, post-harvest drying, storage, and milling [38,39,40,41,42], future studies that apply diverse water management techniques to different rice cultivars could provide insightful data.
3.6. Pest and Disease Incidence Under Different Water Management Practices
The investigation into pest and disease occurrence under various water management strategies revealed that leaf sheath blight was most prevalent in the CF treatment over three years (Figure 8). For rice leaf blight, no significant variations were noted between water management treatments in 2022; however, in 2023 and 2024, CF displayed the highest incidence rates. Rice blast mirrored this pattern, with the highest incidence in CF across the three years (Figure 9). Panicle blight also followed the trends of rice blast, with the most occurrences in CF. Bacterial grain blight presented the highest incidence in CF, while rice brown planthopper showed no distinct patterns related to water management treatments (Figure 10). False smut exhibited no significant differences between treatments in 2022 and 2023, but in 2024, CF experienced the highest incidence, possibly due to increased evapotranspiration triggered by higher temperatures before and after heading, which favored pests and diseases (Figure 11).

Figure 8.
Incidence of Sheath Blight (Cochliobolus miyabeanus, (A)) and Leaf Blight Diseases (Cercospora oryzae, (B)) under different water management treatments. CF, continuously flooded; MD, mid-season drainage (2, 3, 4 weeks); MD-1, low-level water management; MD-2, alternate water irrigation. Means ± SE (n = 3; 10 plants/replicate). Different letters indicate significant differences (DMRT, p < 0.05).

Figure 9.
Incidence of Rice Blast (Pyricularia oryzae, (A)) and Panicle Blight (Fusarium fujikuroi, (B)) under different water management treatments. CF, continuously flooded; MD, mid-season drainage (2, 3, 4 weeks); MD-1, low-level water management; MD-2, alternate water irrigation. Means ± SE (n = 3; 10 plants/replicate). Different letters indicate significant differences (DMRT, p < 0.05).
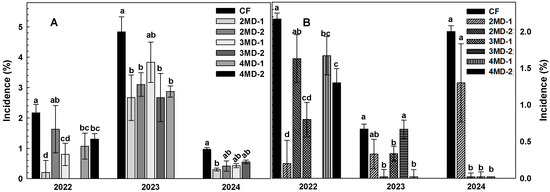
Figure 10.
Incidence of Bacterial Leaf Blight (Burkholderia glumae, (A)) and Rice Brown Planthopper (Nilaparvata lugens, (B)) under different water management treatments. CF, continuously flooded; MD, mid-season drainage (2, 3, 4 weeks); MD-1, low-level water management; MD-2, alternate water irrigation. Means ± SE (n = 3; 10 plants/replicate). Different letters indicate significant differences (DMRT, p < 0.05).
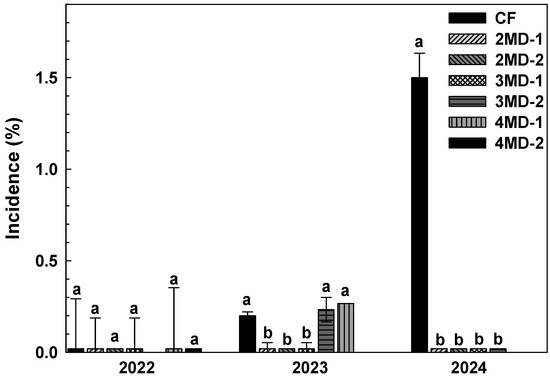
Figure 11.
Incidence of False Smut (Magnaporthe oryzae) under different water management treatments. CF, continuously flooded; MD, mid-season drainage (2, 3, 4 weeks); MD-1, low-level water management; MD-2, alternate water irrigation. Means ± SE (n = 3; 10 plants/replicate). Different letters indicate significant differences (DMRT, p < 0.05).
Leaf blast, leaf sheath blight, and striped leaf blight demonstrated a significant positive correlation with increased rainfall. A study found that a 10% increase in rainy days corresponded to a 2.7% rise in the affected area of leaf blast [24]. While various environmental conditions associated with rainfall might influence this, the rise in disease incidence due to rainfall suggests a potential correlation between moisture levels and disease occurrence. Moreover, leaf sheath blight thrives in warm and moist conditions [24]. Particularly during the summer months, in July and August, when high temperatures coincide with monsoons, mid-level drainage could be more effective in reducing disease incidence by curbing moisture.
4. Conclusions
This study aimed to evaluate the growth characteristics and yield of rice under different water management methods at an environmentally friendly rice paddy in Apgok-Ri, Gungnyu-Myeon, Uiryeong-Gun, from 2022 to 2024. The water management methods included: mid-season drainage for 2 weeks followed by low-level water management (2MD-1), mid-season drainage for 2 weeks followed by alternate water irrigation (2MD-2), mid-season drainage for 3 weeks followed by low-level water management (3MD-1), mid-season drainage for 3 weeks followed by alternate water irrigation (3MD-2), mid-season drainage for 4 weeks followed by low-level water management (4MD-1), mid-season drainage for 4 weeks followed by alternate water irrigation (4MD-2), and continuous flooding (CF). The variety was used, with 90 kg N per ha of organic fertilizer applied as the basal dressing. The rice was machine-transplanted on 9–10 June at a spacing of 30 × 20 cm. Water management treatments commenced on 13 July in 2022 and 2023, and on 8 July in 2024. Mid-season drainage was implemented for durations of 2, 3, and 4 weeks, followed by subsequent irrigation. Low-level water management maintained a water depth of 4 cm, while alternate water irrigation entailed irrigating up to a depth of 4 cm for one week, followed by natural drying.
The highest yield was observed in the following order: 2MD-2 > 2MD-1 > 3MD-2 > 3MD-1 > CF ≥ 4MD-2, 4MD-1. Over three years, 2MD-2 consistently achieved the highest yield, recording 5.85, 5.74, and 5.38 tons per ha, respectively, representing increases of 15.0%, 14.5%, and 7.8% over CF. Alternate water irrigation produced an average yield increase of 1.19% to 5.90% compared to low-level water management across the studied period.
In terms of rice quality, 2MD-2 exhibited the highest percentage of ripened grains throughout the three years, with values of 93.2%, 90.6%, and 82.0%, respectively. CF consistently had the highest percentage of immature and unripe grains across each year.
The crude protein content of brown rice was lowest in 3MD-2 at 6.12%, and 2MD-2 had the second lowest content at 7.51%. Alternate water irrigation generally resulted in lower protein contents compared to low-level water management.
In terms of pest and disease occurrence, leaf sheath blight, rice blast, panicle blight, and bacterial grain blight were the most prevalent throughout the three years in CF. In 2022, rice leaf blight showed no significant differences in incidence across water management treatments, whereas in 2023 and 2024, CF recorded the highest incidence. No significant differences were observed for rice brown planthopper between the treatments, and false smut incidence revealed no significant variations in 2022 and 2023. However, in 2024, CF experienced the highest incidence of false smut.
Therefore, the application of alternate water irrigation following a 2-week mid-season drainage is considered an effective and environmentally friendly rice cultivation method that enhances both yield and quality. This approach improves the percentage of well-formed grains and reduces crude protein content, demonstrating an efficient water management strategy that simultaneously boosts yield and quality. However, since this study was conducted using a single cultivar, Saechungmu, further research involving diverse cultivars and various soil physical environments is necessary to broaden the applicability and validate the findings.
Author Contributions
Conceptualization, Y.-S.C. and S.O.; methodology, Y.-S.C.; validation, Y.-S.C. and S.O.; formal analysis, S.O.; investigation, S.O.; resources, Y.-S.C.; data curation, S.O.; writing—original draft preparation, S.O.; writing—review and editing, Y.-S.C. and S.O.; visualization, S.O.; supervision, Y.-S.C.; project administration, Y.-S.C.; funding acquisition, Y.-S.C. All authors have read and agreed to the published version of the manuscript.
Funding
This research was funded by the Ministry of Agriculture, Food and Rural Affairs (MAFRA) in South Korea (grant number B0080514001781). The APC was partially supported by the Glocal Project Group and Industry–University Cooperation Foundation, Gyeongsang National University, South Korea, with the remaining costs paid by the authors.
Data Availability Statement
The datasets generated and analyzed during this study are not publicly available due to restrictions imposed by the funding agency, but are available from the corresponding author upon reasonable request and with approval from the funding agency.
Conflicts of Interest
The authors declare no conflicts of interest.
References
- Anwar, M.R.; O’leary, G.; McNeil, D.; Hossain, H.; Nelson, R. Climate change impact on rainfed wheat in south-eastern Australia. Field Crop. Res. 2007, 104, 139–147. [Google Scholar] [CrossRef]
- Intergovernmental Panel on Climate Change (IPCC). Summary for policymakers. In Climate change 2023: Synthesis report. Contribution of Working Groups I, II, and III to the Sixth Assessment Report of the Intergov-ernmental Panel on Climate Change; Lee, H., Romero, J., Eds.; IPCC: Geneva, Switzerland, 2023; pp. 1–34. [Google Scholar]
- Akinbile, C.; El-Lat, K.A.; Abdullah, R.; Yusoff, M. Rice Production and Water use Efficiency for Self-Sufficiency in Malaysia: A Review. Trends Appl. Sci. Res. 2011, 6, 1127–1140. [Google Scholar] [CrossRef]
- Peng, S.; Tang, Q.; Zou, Y. Current Status and Challenges of Rice Production in China. Plant Prod. Sci. 2009, 12, 3–8. [Google Scholar] [CrossRef]
- Sariam, O.; Anuar, A.R. Effects of irrigation regime on irrigated rice. J. Trop. Agric. Food Sci. 2010, 38, 1–9. [Google Scholar]
- Korea Statistical Information Service (KOSIS). 2024. Agricultural Land Area Survey. Available online: http://kosis.kr/index/index.do (accessed on 27 August 2024).
- Choi, J.S.; Choi, J.S.; Won, J.G.; Won, J.G.; Ahn, D.J.; Park, S.G.; Lee, S.P. Growth and Yield of Rice by Field Water Management for Water-Saving Irrigation. Korean J. Crop Sci. 2004, 49, 441–446. [Google Scholar]
- Dong, N.M.; Brandt, K.K.; Sørensen, J.; Hung, N.N.; Van Hach, C.; Tan, P.S.; Dalsgaard, T. Effects of alternating wetting and drying versus continuous flooding on fertilizer nitrogen fate in rice fields in the Mekong Delta, Vietnam. Soil Biol. Biochem. 2012, 47, 166–174. [Google Scholar] [CrossRef]
- Hong, E.; Choi, J.; Nam, W.; Kim, J. Decision Support System for the Real-Time Operation and Management of an Agricultural Water Supply. Irrig. Drain. 2015, 65, 197–209. [Google Scholar] [CrossRef]
- Kim, G.Y.; Lee, S.B.; Lee, J.S.; Choi, E.J.; Ryu, J.H.; Park, W.J.; Choi, J.D. Mitigation of Greenhouse Gases by Water Management of SRI (System of Rice Intensification) in Rice Paddy Fields. Korean J. Soil Sci. Fertil. 2012, 45, 1173–1178. [Google Scholar] [CrossRef]
- Ahn, J.-H.; Choi, M.-Y.; Kim, B.-Y.; Lee, J.-S.; Song, J.; Kim, G.-Y.; Weon, H.-Y. Effects of Water-Saving Irrigation on Emissions of Greenhouse Gases and Prokaryotic Communities in Rice Paddy Soil. Microb. Ecol. 2014, 68, 271–283. [Google Scholar] [CrossRef]
- Wopereis, M.; Kropff, M.; Maligaya, A.; Tuong, T. Drought-stress responses of two lowland rice cultivars to soil water status. Field Crop. Res. 1996, 46, 21–39. [Google Scholar] [CrossRef]
- Choi, W.Y.; Park, H.G.; Moon, S.H.; Choi, M.G.; Kim, S.S.; Kim, C.K. Grain Yield and Seed Quality of Rice Plants as Affected by Water-saving Irrigation. Korean J. Agric. For. Meteorol. 2006, 8, 141–144. [Google Scholar]
- Sujono, J.; Matsuo, N.; Hiramatsu, K.; Mochizuki, T. Improving the water productivity of paddy rice (Oryza sativa L.) cultivation through water saving irrigation treatments. Agric. Sci. 2011, 2, 511–517. [Google Scholar] [CrossRef]
- Hwang, K.-C.; Ahn, S.-H.; Chung, N.-J. Midsummer Drainage Effects on Rice Growth and Golden Apple Snails in Environment-friendly Rice Cultivation. Korean J. Org. Agric. 2013, 21, 403–411. [Google Scholar] [CrossRef]
- Jouzi, Z.; Azadi, H.; Taheri, F.; Zarafshani, K.; Gebrehiwot, K.; Van Passel, S.; Lebailly, P. Organic Farming and Small-Scale Farmers: Main Opportunities and Challenges. Ecol. Econ. 2017, 132, 144–154. [Google Scholar] [CrossRef]
- Morshedi, L.; Lashgarara, F.; Hosseini, S.J.F.; Najafabadi, M.O. The Role of Organic Farming for Improving Food Security from the Perspective of Fars Farmers. Sustainability 2017, 9, 2086. [Google Scholar] [CrossRef]
- Ryu, I.S.; Lee, J.H.; Kwon, Y.W. Improvement in rice cultural techniques against unfavorable weather condition. Korean J. Crop Sci. 1982, 27, 385–397. [Google Scholar]
- Choi, W.Y.; Park, H.K.; Kang, S.Y.; Kim, S.S.; Choi, S.Y. Effects of water stress on physiological traits at various growth stages of rice. Korean J. Crop Sci. 1999, 44, 282–287. [Google Scholar]
- Zang, Y.; Wu, G.; Li, Q.; Xu, Y.; Xue, M.; Chen, X.; Wei, H.; Zhang, W.; Zhang, H.; Liu, L.; et al. Irrigation regimes modulate non-structural carbohydrate remobilization and improve grain filling in rice (Oryza sativa L.) by regulating starch metabolism. J. Integr. Agric. 2023, 23, 1507–1522. [Google Scholar] [CrossRef]
- Rahman, M.S.; Yoshida, S. Effect of Water Stress on Grain Filling in Rice. Soil Sci. Plant Nutr. 1985, 31, 497–511. [Google Scholar] [CrossRef]
- Tsuchiya, M.; Munandar; Ogo, T. Growth Response of Rice (Oryza sativa L.) to Drought. II. Varietal difference in transpiration under water stress and its related plant characteristics. Jpn. J. Crop. Sci. 1992, 61, 676–682. [Google Scholar] [CrossRef][Green Version]
- Choi, K.J.; Park, T.S.; Lee, C.K.; Kim, J.T.; Kim, J.H.; Ha, K.Y.; Yang, W.H.; Lee, C.K.; Kwak, K.S.; Park, H.K.; et al. Effect of Temperature During Grain Filling Stage on Grain Quality and Taste of Cooked Rice in Mid-late Maturing Rice Varieties. Korean J. Crop Sci. 2011, 56, 404–412. [Google Scholar] [CrossRef]
- Jeong, H.-K.; Kim, C.-G.; Moon, D.-H. An Analysis of Impacts of Climate Change on Rice Damage Occurrence by Insect Pests and Disease. Korean J. Environ. Agric. 2014, 33, 52–56. [Google Scholar] [CrossRef]
- Karuppaiah, V.; Sujayanad, G.K. Impact of climate change on population dynamics of insect pests. World J. Agric. Sci. 2012, 8, 240–246. [Google Scholar]
- Porter, J.; Parry, M.; Carter, T. The potential effects of climatic change on agricultural insect pests. Agric. For. Meteorol. 1991, 57, 221–240. [Google Scholar] [CrossRef]
- Kiritani, K. Predicting impacts of global warming on population dynamics and distribution of arthropods in Japan. Popul. Ecol. 2005, 48, 5–12. [Google Scholar] [CrossRef]
- Aukema, B.H.; Carroll, A.L.; Zheng, Y.; Zhu, J.; Raffa, K.F.; Moore, R.D.; Stahl, K.; Taylor, S.W. Movement of outbreak populations of mountain pine beetle: Influences of spatiotemporal patterns and climate. Ecography 2008, 31, 348–358. [Google Scholar] [CrossRef]
- Tobin, P.C.; Nagarkatti, S.; Loeb, G.; Saunders, M.C. Historical and projected interactions between climate change and insect voltinism in a multivoltine species. Glob. Chang. Biol. 2008, 14, 951–957. [Google Scholar] [CrossRef]
- RDA. Development of Emission Factors and Assessment of Emission for Methane at Cropland in Korea; Rural Development of Administration: Jeonju, Republic of Korea, 2012; Available online: https://scienceon.kisti.re.kr/srch/selectPORSrchReport.do?cn=TRKO201300014001 (accessed on 18 September 2025).
- Amagliani, L.; O’Regan, J.; Kelly, A.L.; O’Mahony, J.A. Composition and protein profile analysis of rice protein ingredients. J. Food Compos. Anal. 2017, 59, 18–26. [Google Scholar] [CrossRef]
- National Academy of Agricultural Sciences (NAAS). Soil and Plant Analysis Methods; Rural Development of Administration: Jeonju, Republic of Korea, 2000. [Google Scholar]
- R Core Team. R: A Language and Environment for Statistical Computing; R Foundation for Statistical Computing: Vienna, Austria. Available online: https://cran.r-project.org/ (accessed on 18 September 2025).
- Zhang, Y.; Liu, G.; Huang, W.; Xu, J.; Cheng, Y.; Wang, C.; Zhu, T.; Yang, J. Effects of irrigation regimes on yield and quality of upland rice and paddy rice and their interaction with nitrogen rates. Agric. Water Manag. 2020, 241, 106344. [Google Scholar] [CrossRef]
- You, X.T.; Jing, Q.; Jiang, D.; Dai, T.B.; Zhou, D.Q.; Cao, W.X. Effects of nitrogen application on nitrogen utilization and grain yield and quality in rice under water-saving irrigation. Chin. J. Rice Sci. 2006, 20, 199–204. [Google Scholar]
- Choi, H.C.; Cho, S.Y.; Kim, K.H. Varietal difference and environmental variation in protein content and/or amino acid composition of rice seed. Korean J. Crop Sci. 1990, 35, 379–386. [Google Scholar]
- Matsunami, T.; Kodama, T.; Sano, H.; Kon, K. Agronomic Approaches to Maximize the Palatability of Rice. Jpn. J. Crop. Sci. 2016, 85, 231–240. [Google Scholar] [CrossRef][Green Version]
- Yun, S.H.; Lee, J.T. Climate change impacts on optimum ripening periods of rice plant and its countermeasure in rice cultivation. Korean Soc. Agric. Forest Meteorol. 2001, 3, 55–70. [Google Scholar][Green Version]
- Choi, W.Y.; Nam, J.K.; Kim, S.S.; Lee, J.H.; Kim, J.H.; Park, H.K.; Back, N.H.; Choi, M.G.; Kim, C.K.; Jung, K.Y. Optimum transplanting date for production of quality rice in Honam plain area. Korean J. Crop Sci. 2005, 50, 435–441. [Google Scholar][Green Version]
- Kim, J.I.; Choi, H.C.; Kim, K.H.; Ahn, J.K.; Park, N.B.; Park, D.S.; Kim, C.S.; Lee, J.Y.; Kim, J.K. Varietal response to quality and palatability of cooked rice influenced by different nitrogen applications. Korean J. Crop Sci. 2009, 54, 13–23. [Google Scholar][Green Version]
- An, K.N.; Lee, I.; Shin, S.H.; Min, H.K.; Kwon, O.D.; Park, H.G.; Shin, H.R.; Kim, H.Y. Characterization of Seasonal and Annual Variations in Quality of Rice Brands Distributed in Jeonnam Province. Korean J. Crop. Sci. 2017, 62, 79–86. [Google Scholar] [CrossRef]
- Seong, D.-G.; Kim, Y.-G.; Yun, S.-M.; Kim, H.-C.; Lee, J.J.; Kim, C.S.; Chung, J.-S. Studies on How Changing the Transplanting Time Affects Rice Quality and Yield. Korean J. Breed. Sci. 2022, 54, 177–183. [Google Scholar] [CrossRef]
Disclaimer/Publisher’s Note: The statements, opinions and data contained in all publications are solely those of the individual author(s) and contributor(s) and not of MDPI and/or the editor(s). MDPI and/or the editor(s) disclaim responsibility for any injury to people or property resulting from any ideas, methods, instructions or products referred to in the content. |
© 2025 by the authors. Licensee MDPI, Basel, Switzerland. This article is an open access article distributed under the terms and conditions of the Creative Commons Attribution (CC BY) license (https://creativecommons.org/licenses/by/4.0/).