Abstract
The slaughterhouse-treated effluent, enriched with nitrogen, phosphorus, and organic matter, presents a promising alternative for water and nutrient reuse in irrigated crop systems. This study assessed the chemical composition of the effluent, nutrient dynamics in the soil, and agronomic performance of soybean (Glycine max (L.) Merr) and sorghum (Sorghum bicolor (L.) Moench) under fertigation. A randomized block design was used, with five treatments (tap water—control—and four effluent levels: 25%, 50%, 75%, and 100%) applied to two crop species, with four replications. The effluent exhibited elevated concentrations of ammoniacal nitrogen (43.9 ± 18.7 mg L−1), and potassium (13.1 ± 3.8 mg L−1), confirming its potential as a nutrient source. No significant differences were observed in soybean plant height across treatments, whereas early-stage sorghum growth showed only slight variation. Irrigation with treated effluent successfully replaced 100% of tap water in both soybean and sorghum, with no significant differences in productivity across concentrations. These results demonstrate the agronomic feasibility of using treated effluent as a substitute for tap water and synthetic fertilizers. Moreover, they highlight its potential as a sustainable input for fertigation, contributing to resource efficiency and promoting more integrated and environmentally conscious agricultural practices.
1. Introduction
The Brazilian agricultural sector plays a central role in the national economy, particularly due to its global leadership in livestock production. Brazil is currently the world’s largest cattle producer, with approximately 217 million head, and in 2021, it became the leading beef exporter, with 1.8 million tons of fresh and processed carcasses shipped to more than 150 countries, including China, the United States, and Egypt [1]. In the first quarter of 2022 alone, 6.9 million head of cattle were slaughtered [2], with projections estimating up to 31 million by the end of the year. This sector, while economically relevant, requires substantial volumes of tap water in the slaughter process, consequently generating large amounts of effluent.
Slaughterhouse effluent is characterized by its high organic load, salts, and nutrient content [3,4]. Treated effluent may contain total nitrogen (N-NT) concentrations, predominantly in the form of ammoniacal nitrogen [5]. Therefore, its discharge into natural water bodies must comply with environmental regulations such as those established by CONAMA Resolution No. 430 of 13 May 2011 [6]. Considering the potential environmental risks, sustainable reuse alternatives for this effluent are of growing interest, among which the use of treated slaughterhouse effluent in agricultural irrigation stands out as a promising strategy. This practice provides multiple advantages, including the partial substitution of chemical fertilizers due to the nutrients present in the effluent [5,7], enhanced crop productivity through nutrient cycling [8,9,10], and water savings under scarcity conditions [11]. The rational management of water use in agriculture is essential to ensure sustainability and food security [12]. Environmentally responsible approaches recommend selecting salt-tolerant crops with phytoremediation capacity [13,14], especially those with high water and nitrogen demand, in order to optimize input efficiency and reduce production costs.
In this context, soybean (Glycine max (L.) Merr), one of the main Brazilian commodities, stands out for its economic impact and importance as a protein source in animal feed. Sorghum (Sorghum bicolor (L.) Moench) is another strategic crop, recognized for its high grain and biomass production, tolerance to salinity and drought, and potential to substitute corn in animal feed [15,16]. The integration of these species into effluent reuse systems may represent an efficient alternative for sustainable agriculture.
Based on these considerations, the following hypothesis is proposed:
Hypothesis H1.
Treated slaughterhouse effluent can serve as a water and nutrient source for soybean and sorghum cultivation, without compromising agronomic performance, and can potentially enhance soybean yield and sorghum biomass production.
To test this hypothesis, the following questions were posed:
Q1.
What is the most viable dose of treated slaughterhouse effluent for soybean and sorghum production?
Q2.
How efficient is the use of water and nitrogen under these conditions?
2. Materials and Methods
2.1. Study Place and Experimental Design
The experiment was carried out at the School of Animal Science and Food Engineering of the University of São Paulo (FZEA/USP), Pirassununga campus (altitude: 627 m, latitude: 21°59′ S and longitude: 47°25′ W), state of São Paulo, Brazil. The climate in the region is of the Cwa type in the Köppen classification, i.e., subtropical dry winter and hot summer [17].
The experimental design was in randomized blocks with five treatments, namely the following: irrigation with tap water–control (0% slaughterhouse treated effluent), and the following four levels of slaughterhouse-treated effluent: 25, 50, 75, and 100%; and two vegetable crops (soybean and grain sorghum), with four replications (Figure 1). In the control treatment, sorghum received 100% of the nitrogen fertilization recommended for culture. In soybean, as it is a nitrogen-fixing crop, nitrogen fertilization was not applied. The soil of the site is classified as a Eutrophic Red Latosol, with a clayey texture, according to [18].
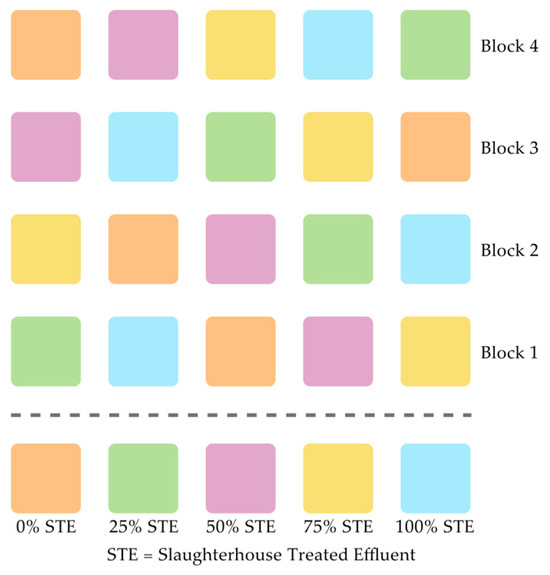
Figure 1.
Experimental randomized block, consisting of five treatments (25% STE; 50% STE; 75% STE; 100% STE and the control—0% STE) and four replications.
2.2. Slaughterhouse-Treated Effluent
The effluent used came from the FZEA/USP School Slaughterhouse (Pirassununga, Brazil), generated during the process of slaughtering the farm’s animals, in 2023. Aiming at greater data accuracy, the values reported by [19] obtained in the same experimental area, in previous periods, from 2020 to 2022, were considered together (Table 1).

Table 1.
Ratio of animals slaughtered at the FZEA/USP School Slaughterhouse from 2020 to 2023, with combined data from the values obtained by [19] and those collected during the experiment.
The raw effluent generated at the slaughterhouse initially underwent a pre-treatment stage in a solid separation tank (3.0 m × 3.20 m × 1.20 m deep), where coarse suspended solids and organic matter were removed by sedimentation. The clarified effluent was then directed to a biological treatment stage in an Upflow Anaerobic Sludge Blanket (UASB) reactor. This reactor, located adjacent to the experimental field (Figure 2), had a working volume of 12 m3 and operated with an organic loading rate ranging from 2 to 4 kg COD m3 day−1, and a hydraulic retention time of 24 to 48 h.
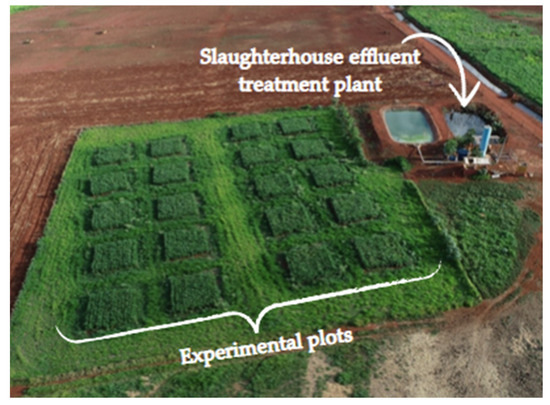
Figure 2.
Aerial image of the experimental area, highlighting the location of the slaughterhouse effluent treatment plant in relation to the adjacent experimental plots.
After treatment, the effluent was stored in a sealed and waterproof reservoir to prevent infiltration and contamination. Subsequently, the treated effluent was transferred to a 5 m3 secondary tank, where it was homogenized prior to application. The proportions used in the irrigation treatments (25%, 50%, 75%, and 100% of slaughterhouse-treated effluent) were prepared based on the time required for irrigation depth application, with solenoid valves regulating the flow. This system enabled precise and automated delivery of the respective volumes to soybean and sorghum plots.
2.3. Analyses Performed on Slaughterhouse-Treated Effluent
Effluent analyses were performed weekly, following [20], and included physicochemical characterization of the following parameters: pH, electrical conductivity (EC), chemical oxygen demand (COD–gross and filtered), total alkalinity, total Kjeldahl nitrogen (N-NTK), ammonia nitrogen (), potassium (K+), phosphorus (P), calcium (Ca2+), sodium (Na+), magnesium (Mg2+), sulphur (S), aluminum (Al), arsenic (As), boron (B), barium (Ba), cadmium (Cd), cobalt (Co), chromium (Cr), iron (Fe), manganese (Mn), mercury (Hg), molybdenum (Mo), nickel (Ni), lead (Pb), selenium (Se), silicon (Si), titanium (Ti), and zinc (Zn) [21]. The Sodium Adsorption Ratio (SAR) was calculated using the concentrations of Ca2+, Mg2+, and Na+, based on the equation proposed by [22]. The analyses were conducted at the Environmental Biotechnology Laboratory (FZEA/USP), in Pirassununga, SP, Brazil, and at the Environmental Analysis Laboratory of the Soil Science Department of ESALQ/USP, in Piracicaba, SP, Brazil.
To improve the reliability of the dataset, given the variation in slaughter volume and effluent generation, we also considered values from a prior study conducted in the same experimental area [19]. Averages from 2020 to 2023 were used to support nutrient supply calculations. Based on the chemical characterization of the slaughterhouse-treated effluent, it was possible to determine the amount of nutrients delivered to soybean and sorghum crops throughout the experimental period. This quantification was essential to assess the viability of treated effluent as an alternative nutrient source, enhancing nutrient cycling and optimizing agricultural resource management.
2.4. Irrigation Management
Irrigation was carried out using a sprinkler system with two sprinklers positioned at opposite ends of each experimental plot, operating at a 90° angle and 2 m above the ground. Adjustable sector impact sprinklers, Senninger® model 3123-PC360 (Hunter Agricultural Irrigation, Clermont, FL, USA) were used, equipped with a 3.18 mm nozzle, a flow rate of 0.595 m3 h−1, and an operating pressure of 2.41 bar (35 PSI). Irrigation was scheduled every 48 h, with soil moisture monitored using a portable Diviner 2000® (Sentek Pty Ltd., Stepney, Australia) probe, and the system was programmed to apply either tap water or treated slaughterhouse effluent to restore soil moisture to field capacity.
Treatments were applied through specific valves connected to two reservoirs: one containing tap water and the other treated effluent, with concentrations regulated by the activation time of each valve for the corresponding plots. Irrigation was suspended once sorghum plants reached approximately 35% dry matter. After sorghum harvest, soybean plants were grown without further irrigation until reaching the R6 stage.
2.5. Cultivation of Vegetable Crops
The experiment was conducted using the following two grain crops: soybean (Glycine max (L.) Merr.) and sorghum (Sorghum bicolor (L.) Moench), grown simultaneously in 49 m2 experimental plots (7 m × 7 m) (Figure 3). Each plot was divided into two subplots, with 7 planting rows allocated to each species. Sowing was performed manually at a depth of 3 cm, with 0.5 m row spacing. Sorghum was sown on 1 November 2022, and soybean on 2 November 2022. Harvesting followed the following crop-specific maturity criteria: sorghum was harvested when plants reached approximately 35% dry matter, and soybean was harvested at the R6 stage, when grain moisture content ranged from 13% to 15%.
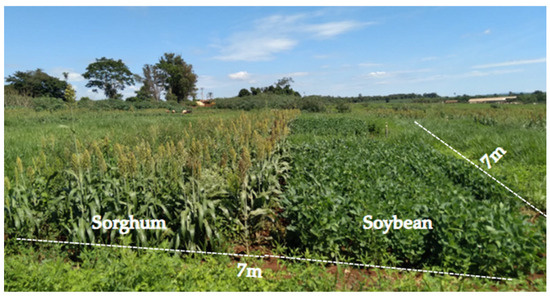
Figure 3.
Experimental plot (7 m × 7 m) subdivided into two subplots for the intercropping of sorghum (Sorghum bicolor (L.) Moench) and soybean (Glycine max (L.) Merr.).
2.6. Analysis on Vegetable Crops
The vegetative development of the crops was monitored weekly by evaluating two plants per row in each subplot, totaling 14 samples per crop. The average of all measured parameters was calculated separately for each subplot, according to the respective crop. Plant height was measured using a graduated measuring tape from the soil surface to the apex of the plant. The relative chlorophyll index was determined using a portable chlorophyll meter, Chlorophyll FALKER 1030 (Falker Automação Agrícola Ltda., Porto Alegre, Brazil). Crop productivity was assessed at harvest based on grain yield (t ha−1) for soybean and green phytomass yield (t ha−1) for sorghum. All evaluations were conducted under the same environmental and irrigation conditions to ensure consistency across treatments.
2.7. Soil Chemical Characterization, Liming, and Fertilization
The soil preparation for planting was carried out based on the data obtained through the chemical characterization of the experimental area. For this, 40 soil samples were collected in different experimental plots, at a depth of 0–40 cm. The samples were homogenized according to the respective treatment, and the mean values for each parameter analyzed were calculated. The results obtained are presented in Table 2, allowing an accurate evaluation of the chemical characteristics of the soil, which were used to guide the correction and fertilization according to the specific needs of each plot, ensuring adequate conditions for the development of soybean and sorghum crops.

Table 2.
Chemical characterization of the soil in the treatments, submitted to irrigation with slaughterhouse treated effluent at concentrations of 25%, 50%, 75%, and 100%, in addition to the control treatment without effluent.
Based on the results obtained in the chemical characterization of the soil (Table 2), it was possible to calculate the need for liming, using a Total Relative Neutralization Power (TRNP) of 95%. The application of lime was carried out manually, in doses ranging from 0,44 t ha−1 to 2,33 t ha−1, depending on the plots, one month before planting, without incorporation of the corrective to the soil. Soil fertilization was carried out in the following two stages: the first at the time of planting the crops and the second 45 days after planting, to ensure the continuous availability of nutrients during plant development. In the control treatment, sorghum received 100% of the nitrogen fertilization recommended for the crop. For soybeans, no nitrogen fertilization was applied, as it is a nitrogen-fixing legume. Phosphorus was supplied in the form of P2O5, meeting the nutritional requirements of both crops. Potassium was applied according to the K2O doses presented in Table 3. This fertilization strategy aimed to provide suitable conditions for crop development, allowing for a comparative evaluation of the treated effluent as an alternative nutrient source.

Table 3.
Amount of chemical fertilizers applied to the crops, representing the following two distinct application stages: planting fertilizer and top dressing.
2.8. Soil Physicochemical Characterization
At the end of the experiment, soil samples were collected from all experimental plots at two depths (0–20 cm and 20–40 cm) for physicochemical characterization. The following parameters were analyzed: hydrogen potential (pH), potassium (K+), phosphorus (P), calcium (Ca2+), sodium (Na+), magnesium (Mg2+), sulfur (S), and aluminum (Al).
2.9. Statistical Analysis
The data were subjected to analysis of variance (Anova), and the assumptions of normality and homogeneity of variances were verified and considered satisfied. For variables that showed significant differences between treatments, the Scheffé test was applied to compare the treated slaughterhouse effluent treatments with the control (0% STE). To compare the crops, the Tukey test was used, adopting a 5% significance level. In the evaluations conducted over time, the time factor was considered as a subplot in the experimental design. Statistical analyses were performed using R software v2019 [23], and graphs were generated using OriginPro software v10.15, 2024 [24].
3. Results and Discussion
3.1. Characterization of the Slaughterhouse-Treated Effluent
The values referring to the characterization of the treated effluent from the slaughterhouse are presented (Table 4), used as a water and nutritional source for soybean and grain sorghum crops during the experimental period, aiming at greater accuracy of the data. The values obtained by [19] were also considered; in this way, the averages of the values were generated.

Table 4.
Physicochemical characterization of slaughterhouse-treated effluent used as a water and nutritional source for soybean and grain sorghum crops. Considering the period from 2020 to 2023, values presented on average.
The treated effluent from the slaughterhouse presented a pH close to neutral, with values of 7.7 ± 0.6, being suitable for application in tropical soils, which are predominantly acidic. This pH favors the availability of nutrients for the plants, without causing damage to the vegetative development of the evaluated crops.
The nitrogen values, specifically in the form of ammonia (), showed high concentrations (43.9 ± 18.7 mg L−1), exceeding the maximum limit allowed for disposal in water bodies according to the current environmental legislation [6], which establishes a maximum value of 20 mg L−1. Therefore, it would be necessary to submit the effluent to an additional treatment for the removal of ammonia nitrogen, which would imply higher costs for production and the producer.
The concentrations of COD (Chemical Oxygen Demand) in the treated effluent were 267.5 ± 165.6 mg L−1 for the crude COD and 71.5 ± 65.8 mg L−1 for the filtered COD, indicating a high load of organic residues, especially in the crude COD, which was effectively applied to the crop. These values reflect the significant presence of blood, viscera, and fats from the slaughter of the animals, justifying the high content of organic matter.
The contents of Na+ (29.5 ± 12.1 mg L−1) in the effluent are related to salinity and, depending on their concentrations, may limit the use of effluents for irrigation of agricultural crops, due to the potential impact on arable soils. However, the values observed in the present study were below the limit established by CETESB (2006) [25], which is 69 mg L−1, indicating that the use of treated effluent as a source of water and nutrients for crops does not represent a risk of salinity.
In addition to the parameters mentioned, other elements were analyzed, but presented concentrations ≤ 0, namely the following: Arsenic (As), Boron (B), Barium (Ba), Cadmium (Cd), Cobalt (Co), Chromium (Cr), Mercury (Hg), Molybdenum (Mo), Nickel (Ni), Lead (Pb), Selenium (Se), Titanium (Ti) and Zinc (Zn).
3.1.1. Irrigation Using Slaughterhouse-Treated Effluent
Figure 4 shows the values of the irrigation depth (mm) and its water sources (tap water and slaughterhouse treated effluent), applied in each treatment. The irrigation depth of the control treatment (0% slaughterhouse-treated effluent and 100% tap water) was 435.8 mm, while the treatments whose irrigation source was by slaughterhouse-treated effluent required a smaller volume of irrigation. In descending order we have the following: 25% STE > 50% STE > 75% STE = 100% STE.
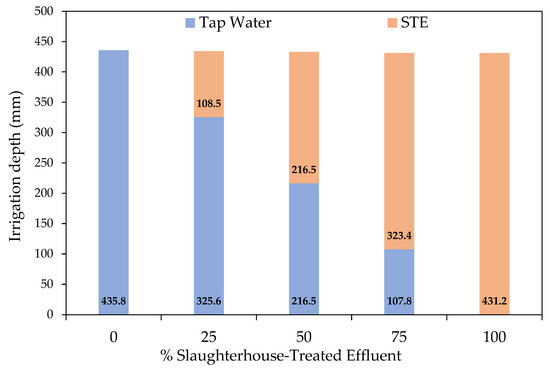
Figure 4.
Irrigation depth applied, using tap water and slaughterhouse-treated effluent as source, with values presented separately per treatment for comparison of effects on crops.
3.1.2. Nutrient Supply
Considering the chemical composition of the slaughterhouse-treated effluent (Table 4) and the irrigation volume applied to soybean and sorghum crops during the experimental period (Figure 4), the total nutrient input delivered via fertigation was estimated (Table 5), enabling a quantitative assessment of nutrient supply derived from the treated effluent.

Table 5.
Nutrient input applied via irrigation depth in different treatments using slaughterhouse-treated effluent, considering the average values from 2020 to 2023. Calculations were not performed for the control (0% STE), as this treatment received only tap water. Values expressed in kg ha−1.
3.2. Soil Analysis of the Experimental Plots
Soil Chemical Characterization
Soil samples from the experimental plots were collected at two depths (0–20 cm and 20–40 cm) to assess the physicochemical characteristics of the soil under different treatments. Because soybean and sorghum were grown simultaneously in a mixed cropping system within the same plot, soil analysis was performed at the plot level without separation by crop. Treatment means were compared using Tukey’s test at a 5% significance level (Table 6).

Table 6.
Chemical characterization of the soil (0–20 and 20–40 cm) of experimental plots cultivated with a soybean–sorghum intercropping system, irrigated with different concentrations of slaughterhouse-treated effluent (25%, 50%, 75%, and 100% STE) and the control treatment (0% STE).
The presence of statistically significant differences for Sodium (Na+) was observed at different depths, with coefficients of variation of 17.6% and 17.7% for the depths of 0–20 cm and 20–40 cm, respectively. At the depth of 0–20 cm, the treatments that received 50%, 75%, and 100% of slaughterhouse-treated effluent showed higher Na+ concentrations than the control treatment (without effluent—0% STE). A similar pattern was observed at the depth of 20–40 cm. The maximum value recorded was 0.10 mmolc.dm−3 of Na+ for the treatment of 100%-treated effluent (STE), regardless of depth, while the minimum value was 0.01 mmolc.dm−3 of Na+, observed at both depths in the control treatment (0% STE).
The maximum Na+ values found in the experimental soils, which reached 0.10 mmolc.dm−3, are considered relatively low and therefore should not cause significant damage to soybean and sorghum crops under the applied experimental conditions. It is important to note that the salinity resulting from the presence of Na+ can negatively impact the germination and initial development of plants, inhibiting the absorption of essential macronutrients, especially Potassium (K+) and Calcium (Ca2+). This inhibition can consequently limit the productive potential of crops, resulting in losses in both grain yield and green phytomass.
For the parameters of pH, Potassium (K+), Phosphorus (P), Calcium (Ca2+), Magnesium (Mg2+), Sulfur (S), and Aluminum (Al), no statistically significant differences were observed when analyzed by Tukey’s test. It is noteworthy that, for the Al element, the measured values were ≤0 in all treatments and depths analyzed.
3.3. Agronomic Performance of Crops
3.3.1. Vegetative Development of Soybean and Sorghum Crops
The data was collected from 1 November 2022 to 27 February 2023. The vegetative development of the crops was monitored by means of the height of the plant canopy, measured at different times throughout the crop cycle. For soybean, seven evaluations were carried out at 33, 47, 54, 60, 72, 76, and 82 days after sowing (DAS), while for sorghum, the evaluation covered a longer period, with eleven measurements at 29, 36, 43, 50, 57, 63, 84, 90, 102, 106, and 112 DAS.
The data was submitted to a regression analysis to evaluate the relationship between the doses of slaughterhouse-treated effluent and the evaluation time (DAS) for both crops. The coefficients of variation were 10.0% (treatments) and 13.1% (DAS) for soybean crop, and 3.5% (treatments) and 4.6% (DAS) for sorghum, indicating good experimental precision. The results obtained are presented in Figure 5, highlighting the differential response of the crops to the concentrations of effluent applied over time.
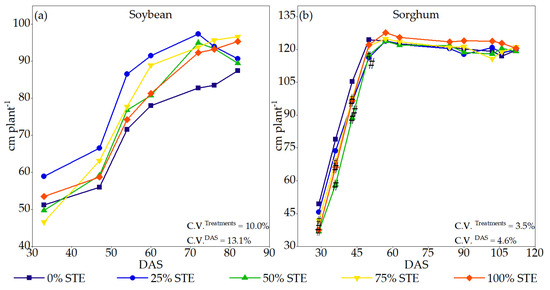
Figure 5.
Canopy height of soybean (a) and sorghum (b) plants irrigated with different concentrations of slaughterhouse-treated effluent (25%, 50%, 75%, and 100% STE) and control (0% STE—tap water). # Differences of the control (0% STE—tap water), at each evaluation time (DAS—days after sowing), by the Scheffé test at the level of 5% probability.
The canopy height data of soybean and sorghum plants (Figure 5a) were submitted to the Scheffé statistical test, considering a significant level of 5%. The results indicated that there were no statistically significant differences among the treatments over the period evaluated for soybeans. However, except in the initial phase of plant development at 33 DAS in all other evaluation moments, the plants that received different concentrations of treated effluent from the slaughterhouse had higher canopy height than the plants from the control treatment, which were irrigated only with water (0% STE).
The analysis of sorghum canopy height (Figure 5b) did not show the same behavior observed for soybean crops when comparing the different concentrations of slaughterhouse-treated effluent with the control treatment (0% STE). In the first four evaluations in time (DAS), significant statistical differences were observed, indicating that the plants in the control treatment had higher canopy height compared to the plants that received the effluent.
On 29 DAS, only sorghum plants irrigated with 25% STE showed canopy height similar to those of the control treatment, with averages of 45.4 cm plant−1 and 49.5 cm plant−1, respectively. This behavior was maintained at 36 DAS, with heights of 73.66 cm plant−1 for the 25% STE treatment and 78.98 cm plant−1 for the control. At 43 DAS, all plants irrigated with treated effluent had significantly lower heights compared to the control, with mean values of 96.15 cm plant−1 (25% STE), 88.77 cm plant−1 (50% STE), 97.86 cm plant−1 (75% STE), and 96.58 cm plant−1 (100% STE), compared to 105.39 cm plant−1 observed in the control treatment.
These results suggest that, in the early stages of development, treated slaughterhouse effluent (TSE) at different doses was not sufficient to provide nutrients (nitrogen—N) to sorghum. However, cumulative application over time reversed this situation. In the evaluation carried out at 50 DAS, the plants of the treatments 75% STE (121.56 cm plant−1) and 100% STE (122.07 cm plant−1) showed canopy height similar to the control treatment (124.40 cm plant−1). In subsequent evaluations, no statistically significant differences were observed, indicating a uniform growth between the different treatments from this moment on. Murad Lima et al. [5] found lower final plant height values than in this experiment.
3.3.2. Relative Chlorophyll Index
To indirectly evaluate the nitrogen contents in soybean and sorghum plants, the Relative Chlorophyll Index (RCI) was used, measured at the following three experimental moments: at 62, 89, and 101 days after sowing. The meaning of the data (n = 3) was calculated, and the results were submitted to statistical analysis using Anova test, with a significance level of 5%. The results are presented in Figure 6. No statistically significant differences were found in the total chlorophyll contents, as indicated by the RCI values, for both soybean and sorghum.
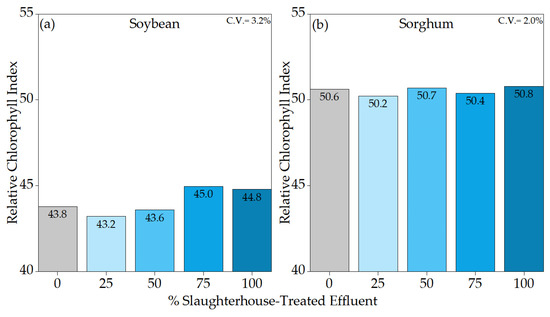
Figure 6.
Relative Chlorophyll Index (RCI) of soybean (a) and sorghum (b) plants, irrigated with slaughterhouse-treated effluent in concentrations (25%, 50%, 75%, and 100% STE) and the control (0% STE), by the Tukey test at the level of 5% probability.
The recorded RCI values are within the expected ranges for soybean and sorghum crops, suggesting that the conditions were suitable for plant development. RCI correlates with the nitrogen content in the leaves, being an essential parameter for the evaluation of healthy plant growth. This result reinforces the feasibility of using treated effluents from slaughterhouses as an efficient source of irrigation and nutrition for agricultural crops, evidencing its contribution to the sustainability of agricultural production.
The evaluation of chlorophyll content as an indirect indicator of the nutritional status of plants, especially in terms of nitrogen, is an important practice, which helps in the proper management of crops. In addition, the sustainable use of effluents from slaughterhouses presents itself as a viable and environmentally responsible agricultural alternative, contributing to the reduction of environmental impacts and the increase in the efficiency of the use of water resources and nutrients.
This type of integrated management not only promotes sustainability in agriculture, but also provides economic gains for producers, especially in regions where access to conventional fertilizers may be limited or costly.
3.3.3. Yield of Soybean and Sorghum Irrigated with Slaughterhouse-Treated Effluent
The yield values, expressed in tons per hectare (t ha−1), are presented in Figure 7. No statistically significant differences were identified among treatments, indicating that the application of slaughterhouse-treated effluent did not compromise soybean productivity. On the contrary, the results suggest that effluent-treated plots performed similarly to the conventionally fertilized control—highlighting the potential of agricultural reusing. It is important to note that soybean plots did not receive nitrogen fertilization, given the crop’s biological nitrogen fixation capacity. However, all plots received phosphorus (P2O5) and potassium (K2O) fertilization at planting and as topdressing (45 days after sowing), according to crop requirements.
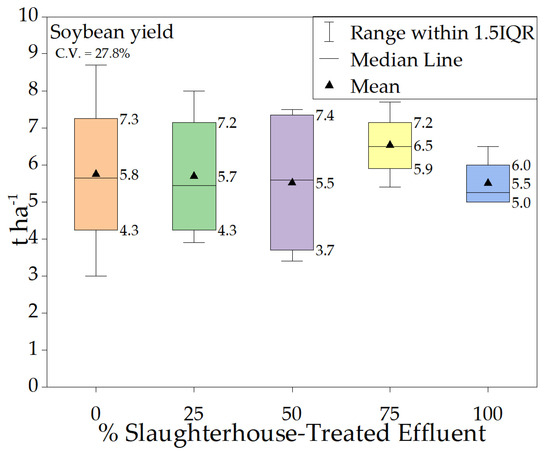
Figure 7.
Soybean yield (t ha−1) under irrigation with slaughterhouse-treated effluent (STE) at different concentrations (25%, 50%, 75%, and 100%), compared to the control treatment (0% STE). Boxes represent the interquartile range (IQR), with the median (line) and mean (▲) indicated.
The use of treated slaughterhouse effluent sustained soybean yields without adverse effects, consistent with findings from Lima et al. [5].
The highest soybean yield was obtained with the 75% STE treatment (6.5 t ha−1), with less variation among replicates (ranging from 5.9 to 7.2 t ha−1). Although this value was 0.7 t ha−1 higher than the control (0% STE = 5.8 t ha−1), the difference was not statistically significant. Overall, the yields observed in our study were higher than those reported by Murad Lima et al. [5], who recorded an average yield of 3.2 t ha−1, without inoculation, in the second cycle under STE irrigation.
The green phytomass productivity of sorghum, expressed in tons per hectare (t ha−1), was evaluated in a comparative manner between treatments using slaughterhouse-treated effluent and the control treatment, which did not receive effluent application (0% STE). The results indicated that there were no statistically significant differences among the treatments, demonstrating that the use of treated effluent did not significantly alter green phytomass production. The coefficient of variation recorded was 15.7%, reflecting the variability associated with the measurements (Figure 8).
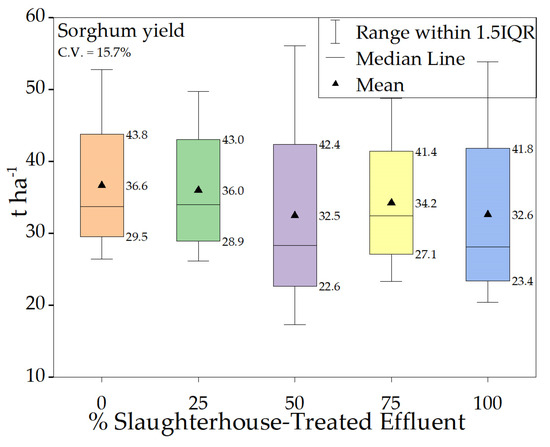
Figure 8.
Green phytomass yield (t ha−1) of sorghum under irrigation with slaughterhouse-treated effluent (STE) at different concentrations (25%, 50%, 75%, and 100%), compared to the control treatment (0% STE). Boxes represent the interquartile range (IQR), with the median (line) and mean (▲) indicated.
Sorghum green mass yield varied among treatments, with the control (0% STE, irrigated with tap water) presenting the highest productivity, reaching 36.6 t ha−1. This value was 4 t ha−1 greater than that obtained under 100% treated slaughterhouse effluent (STE) irrigation (32.6 t ha−1). The widest range in yield was observed in the 50% STE treatment, from 22.6 to 42.5 t ha−1. It is noteworthy that expected sorghum green mass production ranges between 35 and 50 t ha−1, according to Sawazaki et al. [26].
Our findings, in agreement with those of Kolozsvári et al. [27] and Murad Lima et al. [5], demonstrate that effluent irrigation can simultaneously supply water and essential nutrients to crops without compromising yield performance. This practice is consistent with circular economy principles, underscoring its potential to reduce reliance on synthetic fertilizers, mitigate environmental impacts, and enhance the sustainability of agricultural production systems.
3.4. Principal Component Analysis
In Figure 9A (soybean), it can be seen that the first principal component (PCA1) explained 65.02% of the total data variability, while PCA2 explained 16.23%, totaling 81.25% of the explained variance. The parameters associated with the treated slaughterhouse effluent (in orange) are grouped in the right quadrant of the graph, with a high load in PCA1, indicating a strong contribution of these elements to the data variance. A positive correlation can also be noted between the chemical attributes of the effluent and some experimental soil variables, such as sodium, potassium, and sulphur, as well as the relative chlorophyll index (RCI) and soybean plant height and yield.
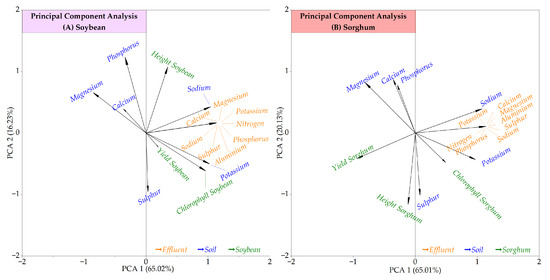
Figure 9.
Principal Component Analysis (PCA) illustrates the relationships among the chemical characteristics of slaughterhouse-treated effluent (STE), the chemical properties of the experimental soil, and the agronomic performance of soybean (A) and sorghum (B) crops.
In Figure 9B (sorghum), PCA1 explained 65.01% of the variability, while PCA2 represented 20.13%, totaling 85.14% of the explained variance—a value similar to that observed for soybeans. The variables associated with the treated slaughterhouse effluent, in the right quadrant, presented behavior similar to that of the experiment with soybeans, maintaining a strong contribution to PCA1. However, unlike soybeans, sorghum productivity showed greater proximity to the magnesium and calcium parameters of the experimental soil, shown in the upper left quadrant, as well as the plant height variable, indicating that other soil elements may have exerted greater influence on sorghum growth and yield. The RCI was more related to phosphorus and potassium of the experimental soil and to the treated slaughterhouse effluent itself, suggesting an important role of these nutrients in maintaining the photosynthetic activity of the sorghum crop.
4. Conclusions
The use of treated slaughterhouse effluent proved to be a viable alternative for partially or fully supplying the water and nutritional requirements of soybean (Glycine max (L.) Merr) and sorghum (Sorghum bicolor (L.) Moench) crops, without compromising plant agronomic performance. The chemical composition of the effluent revealed a high nitrogen concentration, among other nutrients, reinforcing its potential for agricultural application. Although increases in soil sodium (Na+) levels were observed, the concentrations remained below thresholds that could affect crop development. Additionally, this practice favors the conservation of natural resources and promotes the reuse of agro-industrial by-products with low environmental impact, aligning with circular management strategies in agriculture.
Author Contributions
Conceptualization: A.M.d.G., T.M.G. and F.R.; Data curation: A.M.d.G. and M.R.d.O.J.; Formal analysis: A.M.d.G., Â.S.M.C. and F.R.; Investigation: A.M.d.G. and M.R.d.O.J.; Methodology: A.M.d.G. and T.M.G., F.R.; Project administration: A.M.d.G. and F.R.; Resources: T.M.G. and F.R.; Software: Â.S.M.C.; Supervision: A.M.d.G. and F.R.; Validation: A.M.d.G. and F.R.; Visualization: A.M.d.G. and F.R.; Writing—original draft: A.M.d.G., T.M.G. and F.R.; Writing—review & editing: A.M.d.G., Â.S.M.C., J.d.F.V., M.R.d.O.J., T.M.G. and F.R. All authors have read and agreed to the published version of the manuscript.
Funding
This research was funded by the National Council for Scientific and Technological Development—CNPq, Brazil, (Process nº 161957/2021-8), and by the Luiz de Queiroz Agricultural Studies Foundation—FEALQ.
Institutional Review Board Statement
Not applicable for studies not involving humans or animals.
Data Availability Statement
The data used to support the findings of this study are available from the corresponding authors upon request.
Conflicts of Interest
The authors declare no conflicts of interest.
References
- ABIEC—Associação Brasileira das Indústrias Exportadoras de Carne. Exportações 2022. 2022. Available online: http://abiec.com.br/exportacoes/ (accessed on 10 June 2022).
- IBGE—Instituto Brasileiro de Geografia e Estatística. Pesquisa Trimestral do Abate de Animais. 2022. Available online: https://www.ibge.gov.br/estatisticas/economicas/agricultura-e-pecuaria/21119-primeiros-resultados-2abate.html?=&t=series-historicas (accessed on 10 June 2022).
- Santos, J.J.N.; Sousa, I.C.S.; Bezerra, D.C.; Coimbra, V.C.S.; Chaves, N.P. Desafios de adequação à questão ambiental em frigoríficos na cidade de São Luís, Maranhão: Diagnóstico de situação. Arq. Inst. Biol. 2014, 81, 315–321. [Google Scholar] [CrossRef]
- Menegassi, L.C. Aspectos Agronômicos do Cultivo do Capim-Coastcross Irrigado com Efluente Tratado de Abatedouro. Master’s Thesis, ESALQ-USP, Piracicaba, Brazil, 2018. [Google Scholar]
- Lima, A.C.M.; Brichi, L.; Trevisan, L.R.; Leão de Souza Dominguez, A.; Nocera Santiago, G.; Gomes, T.M.; Rossi, F. Effects of Irrigation with Treated Slaughterhouse Effluent and Bradyrhizobium spp. Inoculation on Soybean Development and Productivity: Strategies for Sustainable Management. Agronomy 2025, 15, 167. [Google Scholar] [CrossRef]
- CONAMA—Conselho Nacional do Meio Ambiente. Resolução nº 430: Dispõe Sobre a Classificação de Corpos D’água e Estabelece as Condições e Padrões Para Lançamento de Efluentes, e dá Outras Providências; Diário Oficial da União: Brasília, Brazil, 2011.
- Menegassi, L.C.; Rossi, F.; Dominical, L.D.; Tommaso, G.; Montes, C.R.; Gomide, C.A.; Gomes, T.M. Reuse in the agro-industrial: Irrigation with treated slaughterhouse effluent in grass. J. Clean. Prod. 2020, 251, 119698. [Google Scholar] [CrossRef]
- Hernández-Chover, V.; Bellver-Domingo, Á.; Hernández-Sancho, F. Efficiency of wastewater treatment facilities: The influence of scale economies. J. Environ. Manag. 2018, 228, 77–84. [Google Scholar] [CrossRef]
- Wang, Y.; Hu, T.; Li, Y.; Wang, X.; Wang, X.; Wang, Y. Physical clogging characteristics of labyrinth emitters in drip irrigation with low-quality water. Agronomy 2022, 12, 1615. [Google Scholar] [CrossRef]
- Hespanhol, I. Potencial de reuso de água no Brasil: Agricultura, indústria, municípios, recarga de aquíferos. Rev. Bras. Recur. Hídricos 2002, 7, 75–95. [Google Scholar] [CrossRef]
- Matsura, E.E.; Gomes, T.M. Água de reúso na agricultura irrigada. In Diferentes Abordagens Sobre a Agricultura no Brasil: História, Política Pública, Economia e Recurso Hídrico; Paolinelli, A., Dourado Neto, D., Mantovani, E., Eds.; ESALQ-USP: Piracicaba, Brazil, 2021; Volume 1, pp. 399–415. [Google Scholar] [CrossRef]
- Campos, F.; Araújo, K.B. Fertirrigação e o reúso de água na agricultura. InterfacEHS—Rev. Saúde Meio Ambiente Sustentabilidade 2020, 15, 29–41. [Google Scholar]
- Donatti, R.N.; Gomes, T.M.; Menegassi, L.C.; Tommaso, G.; Rossi, F. Sodium Phytoremediation by Green Manure Growing in Soil Irrigated with Wastewater of Dairy Industry. J. Braz. Assoc. Agric. Eng. 2017, 37, 665–675. [Google Scholar] [CrossRef]
- Nouri, H.; Chavoshi Borujeni, S.; Nirola, R.; Hassanli, A.; Beecham, S.; Alaghmand, S.; Saint, C.; Mulcahy, D. Application of green remediation on soil salinity treatment: A review on halophytoremediation. Process Saf. Environ. Prot. 2017, 107, 94–107. [Google Scholar] [CrossRef]
- Sá, F.V.S.; Brito, M.E.B.; Silva, L.A.; Moreira, R.C.L.; Paiva, E.P.; Souto, L.S. Correção de solo salino-sódico com condicionadores e doses de fósforo para cultivo do sorgo sacarino. Rev. Bras. Agric. Irrig. 2018, 12, 2854–2865. [Google Scholar] [CrossRef]
- EMBRAPA Milho e Sorgo–Empresa Brasileira de Pesquisa Agropecuária. Sorgo Forrageiro BRS 658. Soluções Tecnológicas; Embrapa Milho e Sorgo: Sete Lagoas, Brazil, 2015; Available online: https://www.embrapa.br/milho-e-sorgo/solucoes-tecnologicas (accessed on 10 April 2025).
- Alvares, C.A.; Stape, J.L.; Sentelhas, P.C.; Gonçalves, J.L.M.; Sparovek, G. Köppen’s climate classification map for Brazil. Meteorol. Z. 2013, 22, 711–728. [Google Scholar] [CrossRef] [PubMed]
- Santos, H.G.; Jacomine, P.L.T.; dos Anjos, L.H.C.; de Oliveira, V.Á.; Lumbreras, J.F.; Coelho, M.R.C.; de Almeida, J.A.; Araújo Filho, J.A.; Lima, H.N.; Marques, F.A.; et al. Sistema Brasileiro de Classificação de Solos, 6th ed.; Embrapa: Brasília, Brazil, 2025; 393p, Available online: https://www.infoteca.cnptia.embrapa.br/infoteca/bitstream/doc/1176834/1/Sistema-Brasileiro-de-Classificacao-de-Solos-2025.pdf (accessed on 16 September 2025).
- Brichi, L. Soil Quality in the Black Oat and Soybean Succession System Irrigated with Treated Slaughterhouse Effluent. Ph.D. Thesis, “Luiz de Queiroz” College of Agriculture (ESALQ/USP), University of São Paulo, Piracicaba, Brazil, 2024; 156p. Available online: https://www.teses.usp.br/teses/disponiveis/11/11152/tde-05022024-170735/en.php (accessed on 9 April 2025).
- CETESB—Companhia Ambiental do Estado de São Paulo; ANA—Agência Nacional de Águas. Guia Nacional de Coleta e Preservação de Amostras de Água, Sedimento, Comunidades Aquáticas e Efluentes Líquidos; Brandão, C.J., Ed.; CETESB: São Paulo, Brazil; ANA: Brasília, Brazil, 2011; 326p.
- APHA—American Public Health Association; AWWA—American Water Works Association; WEF—Water Environment Federation. Standard Methods for the Examination of Water and Wastewater, 22nd ed.; APHA/AWWA/WEF: Washington, DC, USA, 2012. [Google Scholar]
- Ayers, R.S.; Westcot, D.W. Water Quality for Agriculture; Irrigation and Drainage Paper No. 29, Rev. 1; FAO—Food and Agriculture Organization of the United Nations: Rome, Italy, 1985; 218p, Available online: https://www.fao.org/3/t0234e/t0234e00.htm (accessed on 8 April 2025).
- R Core Team. R: A Language and Environment for Statistical Computing; R Foundation for Statistical Computing: Vienna, Austria, 2019; Available online: https://www.r-project.org/ (accessed on 8 April 2025).
- OriginLab Corporation. OriginPro, version 10.15; OriginLab Corporation: Northampton, MA, USA, 2024; Available online: https://www.originlab.com (accessed on 16 September 2025).
- CETESB—Companhia Ambiental do Estado de São Paulo. Orientação Para Apresentação de Projeto Visando à Aplicação de Água de Reuso Proveniente de Estação de Tratamento de Esgoto Doméstico na Agricultura; CETESB: São Paulo, Brazil, 2006; 11p.
- Sawazaki, E.; Paziani, S.F.; Freitas, R.S.; Duarte, A.P. Sorgo Forrageiro (Sorghum spp.). In Boletim 200: Instruções Agrícolas para as Principais Culturas Econômicas, 7th ed.; Aguiar, A.T.E., Ed.; Instituto Agronômico: Recife, Brazil, 2014; pp. 370–373. 460p. [Google Scholar]
- Kolozsvári, I.; Kun, Á.; Jancsó, M.; Palágyi, A.; Bozán, C.; Gyuricza, C. Agronomic Performance of Grain Sorghum (Sorghum bicolor (L.) Moench) Cultivars under Intensive Fish Farm Effluent Irrigation. Agronomy 2022, 12, 1185. [Google Scholar] [CrossRef]
Disclaimer/Publisher’s Note: The statements, opinions and data contained in all publications are solely those of the individual author(s) and contributor(s) and not of MDPI and/or the editor(s). MDPI and/or the editor(s) disclaim responsibility for any injury to people or property resulting from any ideas, methods, instructions or products referred to in the content. |
© 2025 by the authors. Licensee MDPI, Basel, Switzerland. This article is an open access article distributed under the terms and conditions of the Creative Commons Attribution (CC BY) license (https://creativecommons.org/licenses/by/4.0/).