1. Introduction
Broiler chicken production requires highly concentrated nutritive rations. These are mostly industrial mixtures balanced to meet the requirements of a particular poultry production group. The primary feed material in complete feed rations for broiler chickens is cereal grains, which account for approximately half of the total protein supply. The remainder should be supplemented with high-protein raw material. This requirement is most often covered by imported soybean meal, which is nearly completely derived from genetically modified soy. The availability of soybean meal, its nutritive value, and competitive prices, as well as the liberalisation and globalisation of trade, have considerably reduced reliance on other protein sources. Meanwhile, research [
1,
2,
3,
4] has shown that proteins supplied with broiler chicken diets could partially derive from other high-protein raw materials, such as legume seeds and food industry by-products (rapeseed meal, sunflower meal, and dry distilled grains with soluble). Furthermore, when the prices of soybean meal in the global feed market are high, also in the UE alternatives are sought to substitute at least a part of the protein, which is essential in broiler chicken diets [
5,
6].
Guar meal, produced as a by-product of the extraction of galactomannan (guar gum) from guar seeds (
Cyamopsis tetragonoloba L.), is a remarkably high-protein raw material [
7,
8]. Kamran et al. [
9], Shahbazi [
10], Dinani et al. [
5], and Tammam et al. [
6] claimed that, in view of its nutritive value, using guar meal in poultry feed may be an effective strategy to reduce feeding costs. Guar meal offered in the feed market can be unprocessed; it is either raw or treated to enhance its nutritive value [
11,
12,
13]. In addition, depending on the guar cultivar and fraction type (endosperm, shell) predominant in the blend, the crude protein (CP) content of the guar meal ranges from 35% to 60%. On average, the ‘endosperm’ fraction contains about 60% CP, while the shell 35% [
14,
15,
16,
17]. Lee et al. [
18], Saeed et al. [
19], Dinani et al. [
5], and Kotnala et al. [
13] reported that guar meal is an excellent source of essential amino acids, including mainly arginine, lysine, tryptophan, isoleucine, valine, and phenylalanine.
The percentage content of specific fractions in guar meal is also linked to crude fibre content, which is undesirable for birds. It is believed that the proportion of raw or unprocessed guar meal in the diets of monogastric animals is low, given its adverse effect on productivity ratios caused by the content of antinutrients such as residue of galactomannans, trypsin inhibitors, saponins, polyphenols, hemagglutinins, and residual concentrations of guar gum [
5,
8,
13,
20,
21,
22,
23,
24,
25,
26]. A high percentage of plant-derived protein—guar meal in poultry diets can trigger intestinal viscosity and lipid absorption, diarrhoea, lower growth rates, impaired feed conversion ratio, and increased mortality rates [
18,
21].
Many poultry nutritional studies have tried to identify the optimal level of guar meal in feed rations that will not adversely affect the rearing results and carcass composition of broiler chickens [
24,
27,
28,
29,
30]. The results of previous studies [
24,
28,
31,
32] imply that a share of up to 4–5%, and even 6% [
8] of guar meal in rations fed to chickens has no adverse effect on their growth rate and carcass composition. Many previous studies have highlighted the effect of diet on carcass composition measured in terms of muscularity and fatness, but the available scientific literature lacks a detailed account of results concerning meat quality and liver histology in broiler chickens fed various types of guar meal. Meanwhile, the physicochemical characteristics and sensory attributes of poultry meat, which has been enjoying unabated popularity among consumers, require continuous control and assessment due to the increasing frequency of broiler chicken meat defects [
33].
Therefore, we evaluated the efficiency of three types of guar meal used in broiler chicken feed rations. The hypothesis of this study was that different types of guar meal (raw, Microlam, roasted) may be used in amount 6% in broiler chickens rations without deterioration growth performance, carcass composition and liver histology.
3. Results
The inclusion of 6% Microlam significantly reduced the body weight (BW) of 3-week-old broiler chickens compared to that of birds from other groups (
Table 5).
After subsequent two weeks of rearing, the chickens fed rations containing different types of guar meal (groups GM1, GM2, and GM3) weighed significantly less (from 45 g for GM1 to 75 g for GM2) than the control birds (p ≤ 0.05). On day 42, GM1 chickens appeared to be the heaviest (2646 g), but their weight did not differ significantly (p > 0.05) from that of control and GM3 birds. In contrast, birds fed rations containing Microlam guar meal were the lightest (2583 g), and the 63 g difference between the weight of chickens from this group and from GM1 was statistically significant (p ≤ 0.05).
Analysis of feed ration intake during particular rearing periods showed that the consumption of both starter and grower rations was similar (p > 0.05). Only at stage three of rearing (finisher) did the feed intake of GM1 and GM2 birds significantly (p ≤ 0.05) increase in relation to the control and GM3 chickens. However, it had no effect on mean feed intake throughout the rearing period. The diet had no effect on feed conversion per kg of bird body weight, either in the individual rearing periods (starter, grower and finisher) or over the entire rearing period (p > 0.05).
For the slaughter analysis, birds with a body weight close to the average of all birds in a given group were selected, so their pre-slaughter body weight and, consequently, the cold carcass weight differed between the groups (
Table 6).
The pre-slaughter body weight and cold carcass weight of chickens from groups C, GM1, and GM2 did not differ (p > 0.05), whereas the weights of birds from groups GM1 and GM3 were significantly different (p ≤ 0.05). With regard to the pre-slaughter weight, the difference was 100 g, which is a disadvantage of GM3. Chickens fed rations containing roasted guar meal (GM3) also showed the lowest dressing percentage, which differed significantly (p ≤ 0.05) from that of GM1 and GM2 birds. When assessing the muscularity and fatness of broiler chickens, it should be noted that irrespective of the diet, all birds demonstrated a high degree of muscularity, as the proportion of total muscle in the carcass ranged from 52% in chickens receiving feed rations with Microlam to as much as 53.4% in those fed rations containing roasted guar meal (p > 0.05). Chicken fatness, measured as the percentage of skin with subcutaneous fat, was also very similar (p > 0.05) in all groups, although birds receiving diets with raw guar meal had the highest percentage (10.55%). The carcasses of chickens in this group also had the highest percentage (1.33%) of abdominal fat, and the difference compared to the GM3 group (1.13%) was statistically significant (p ≤ 0.05). The type of guar meal in the diet of birds did not affect the percentage of giblets (p > 0.05).
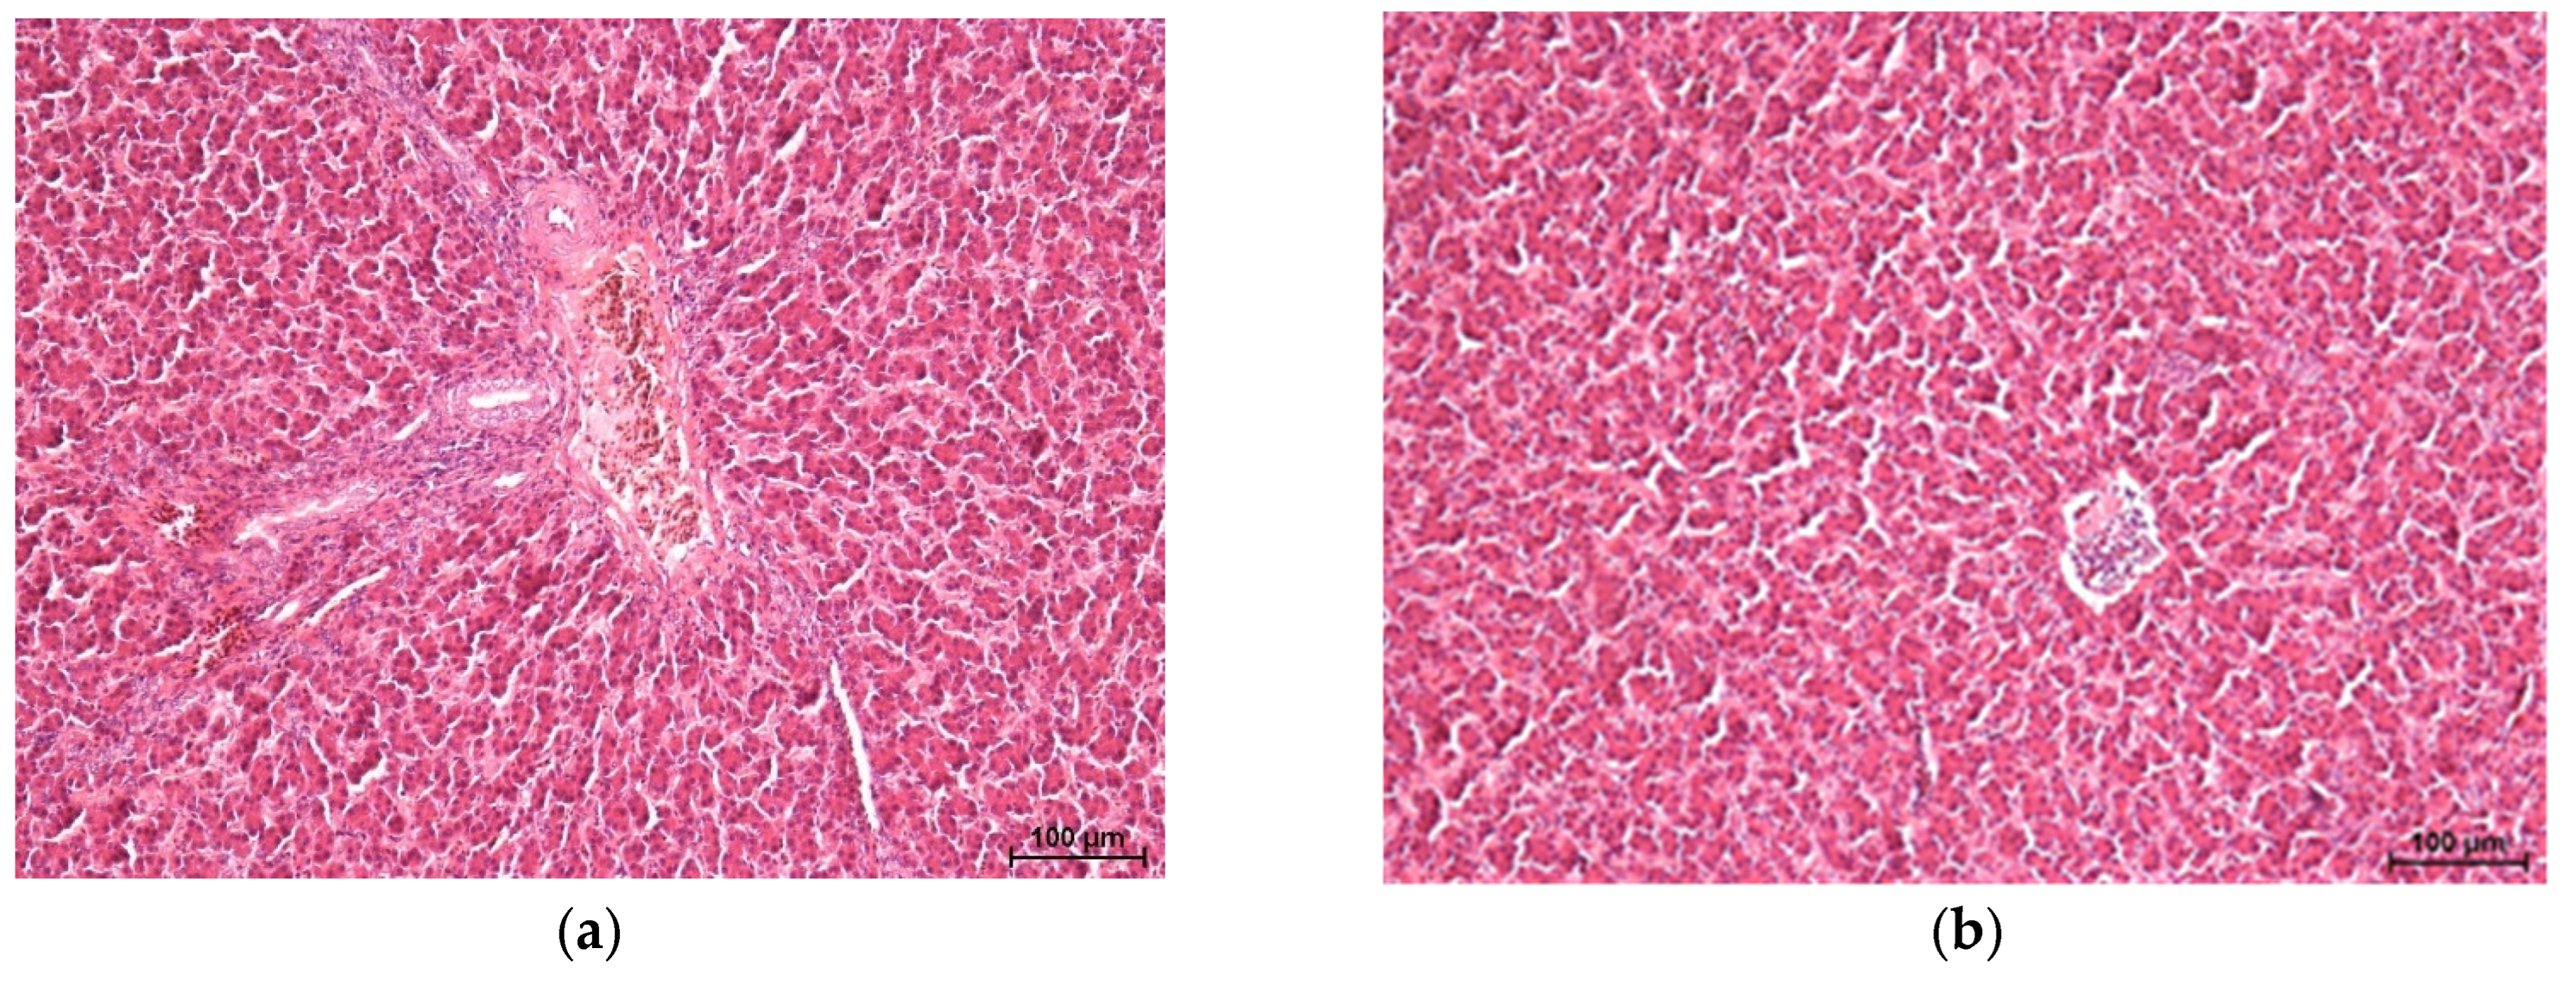
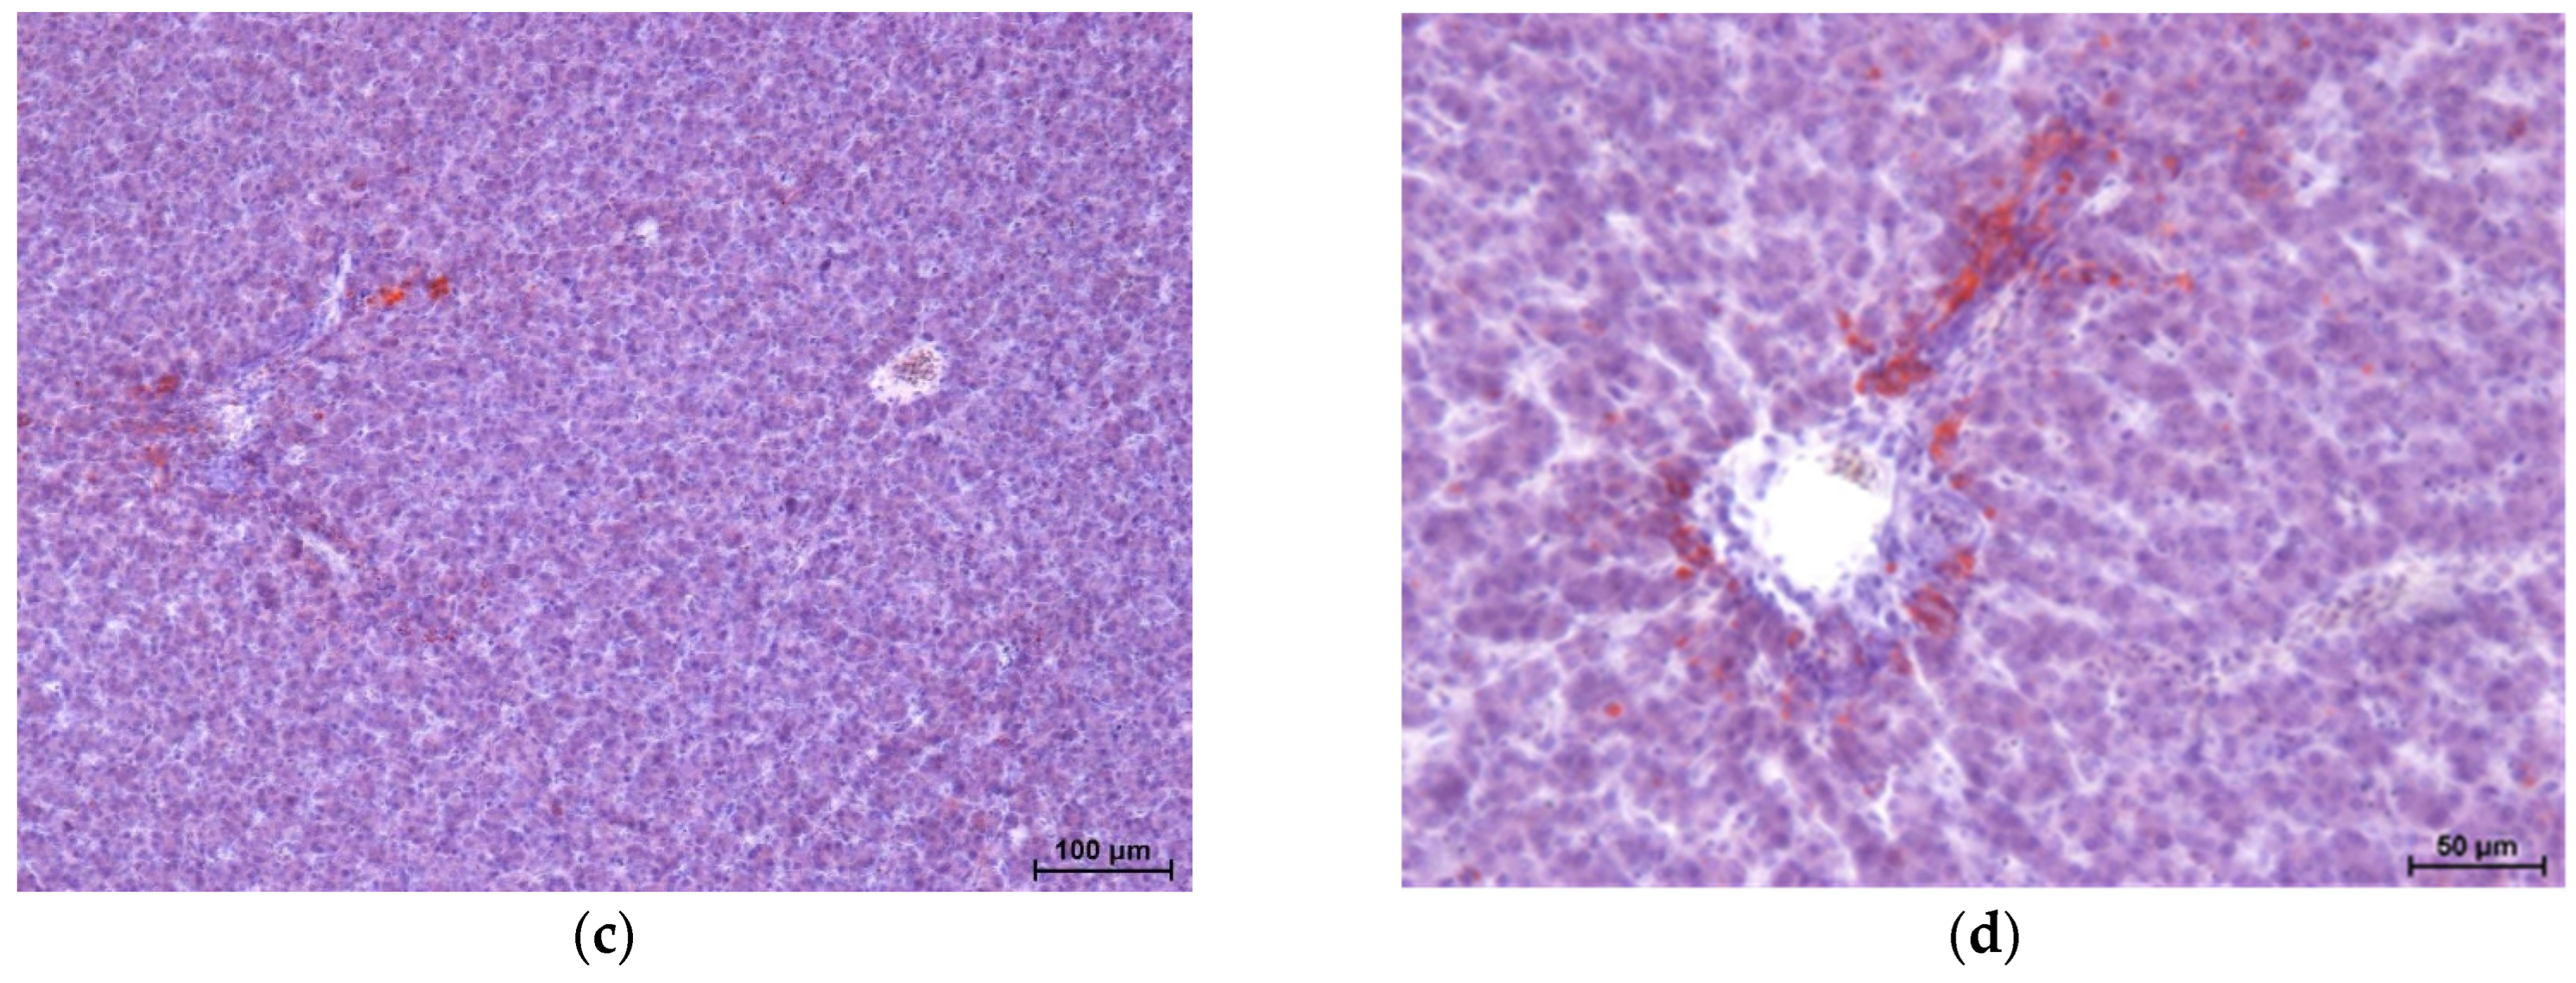
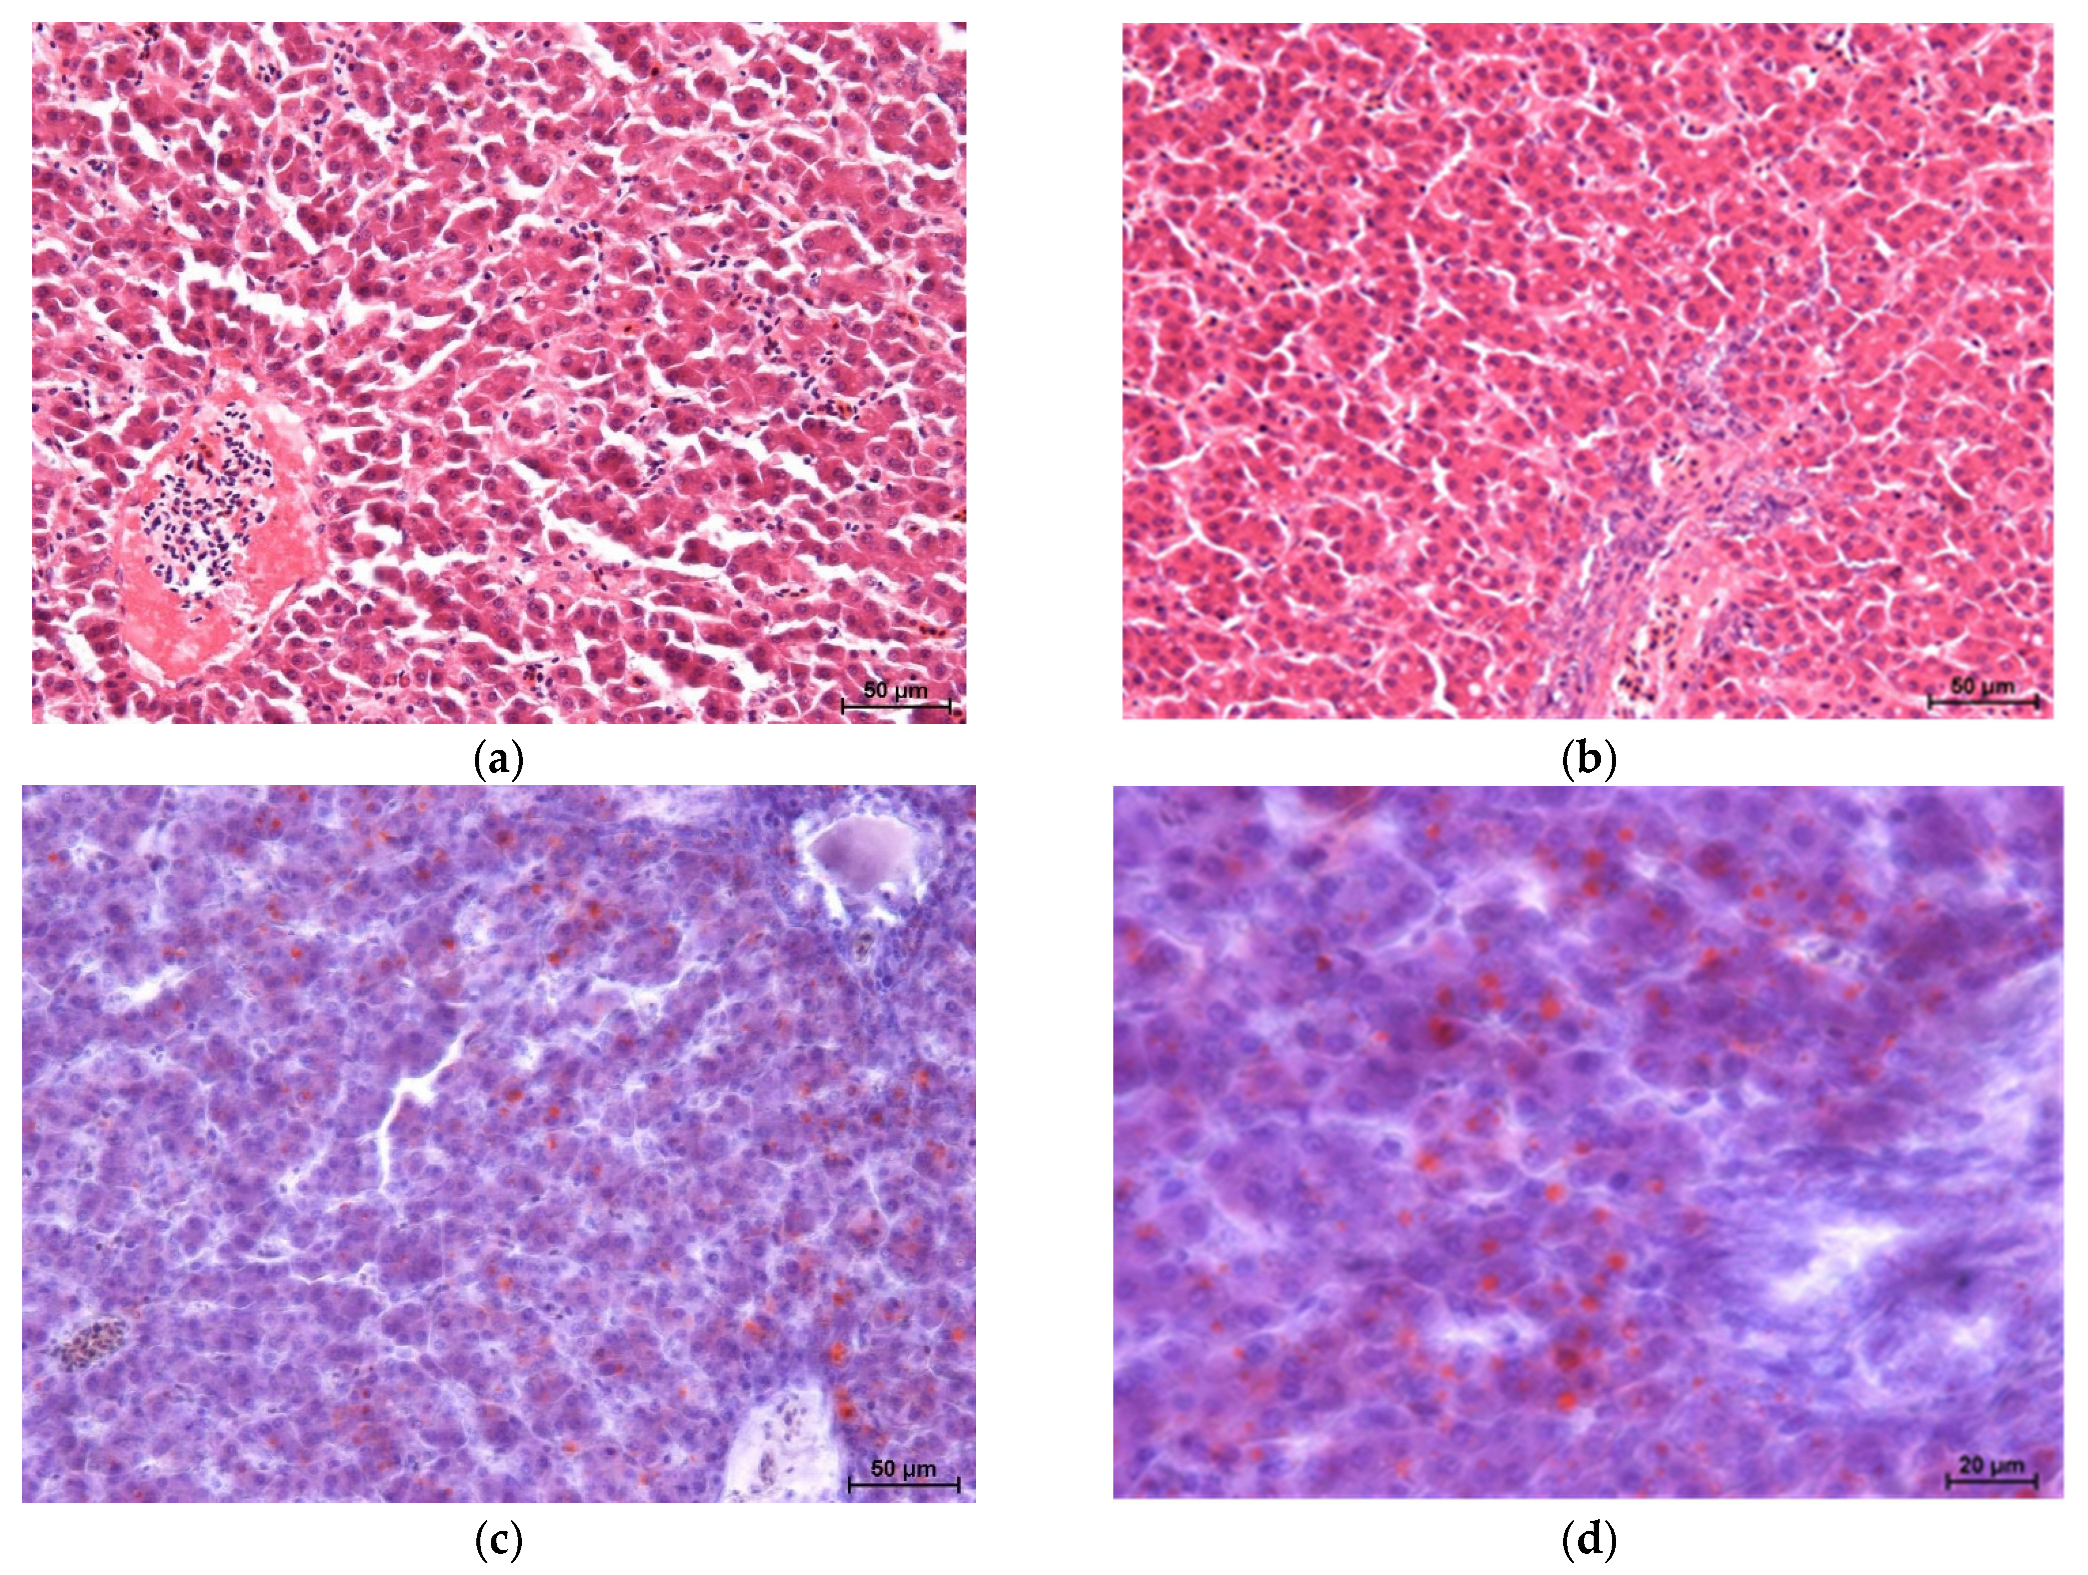
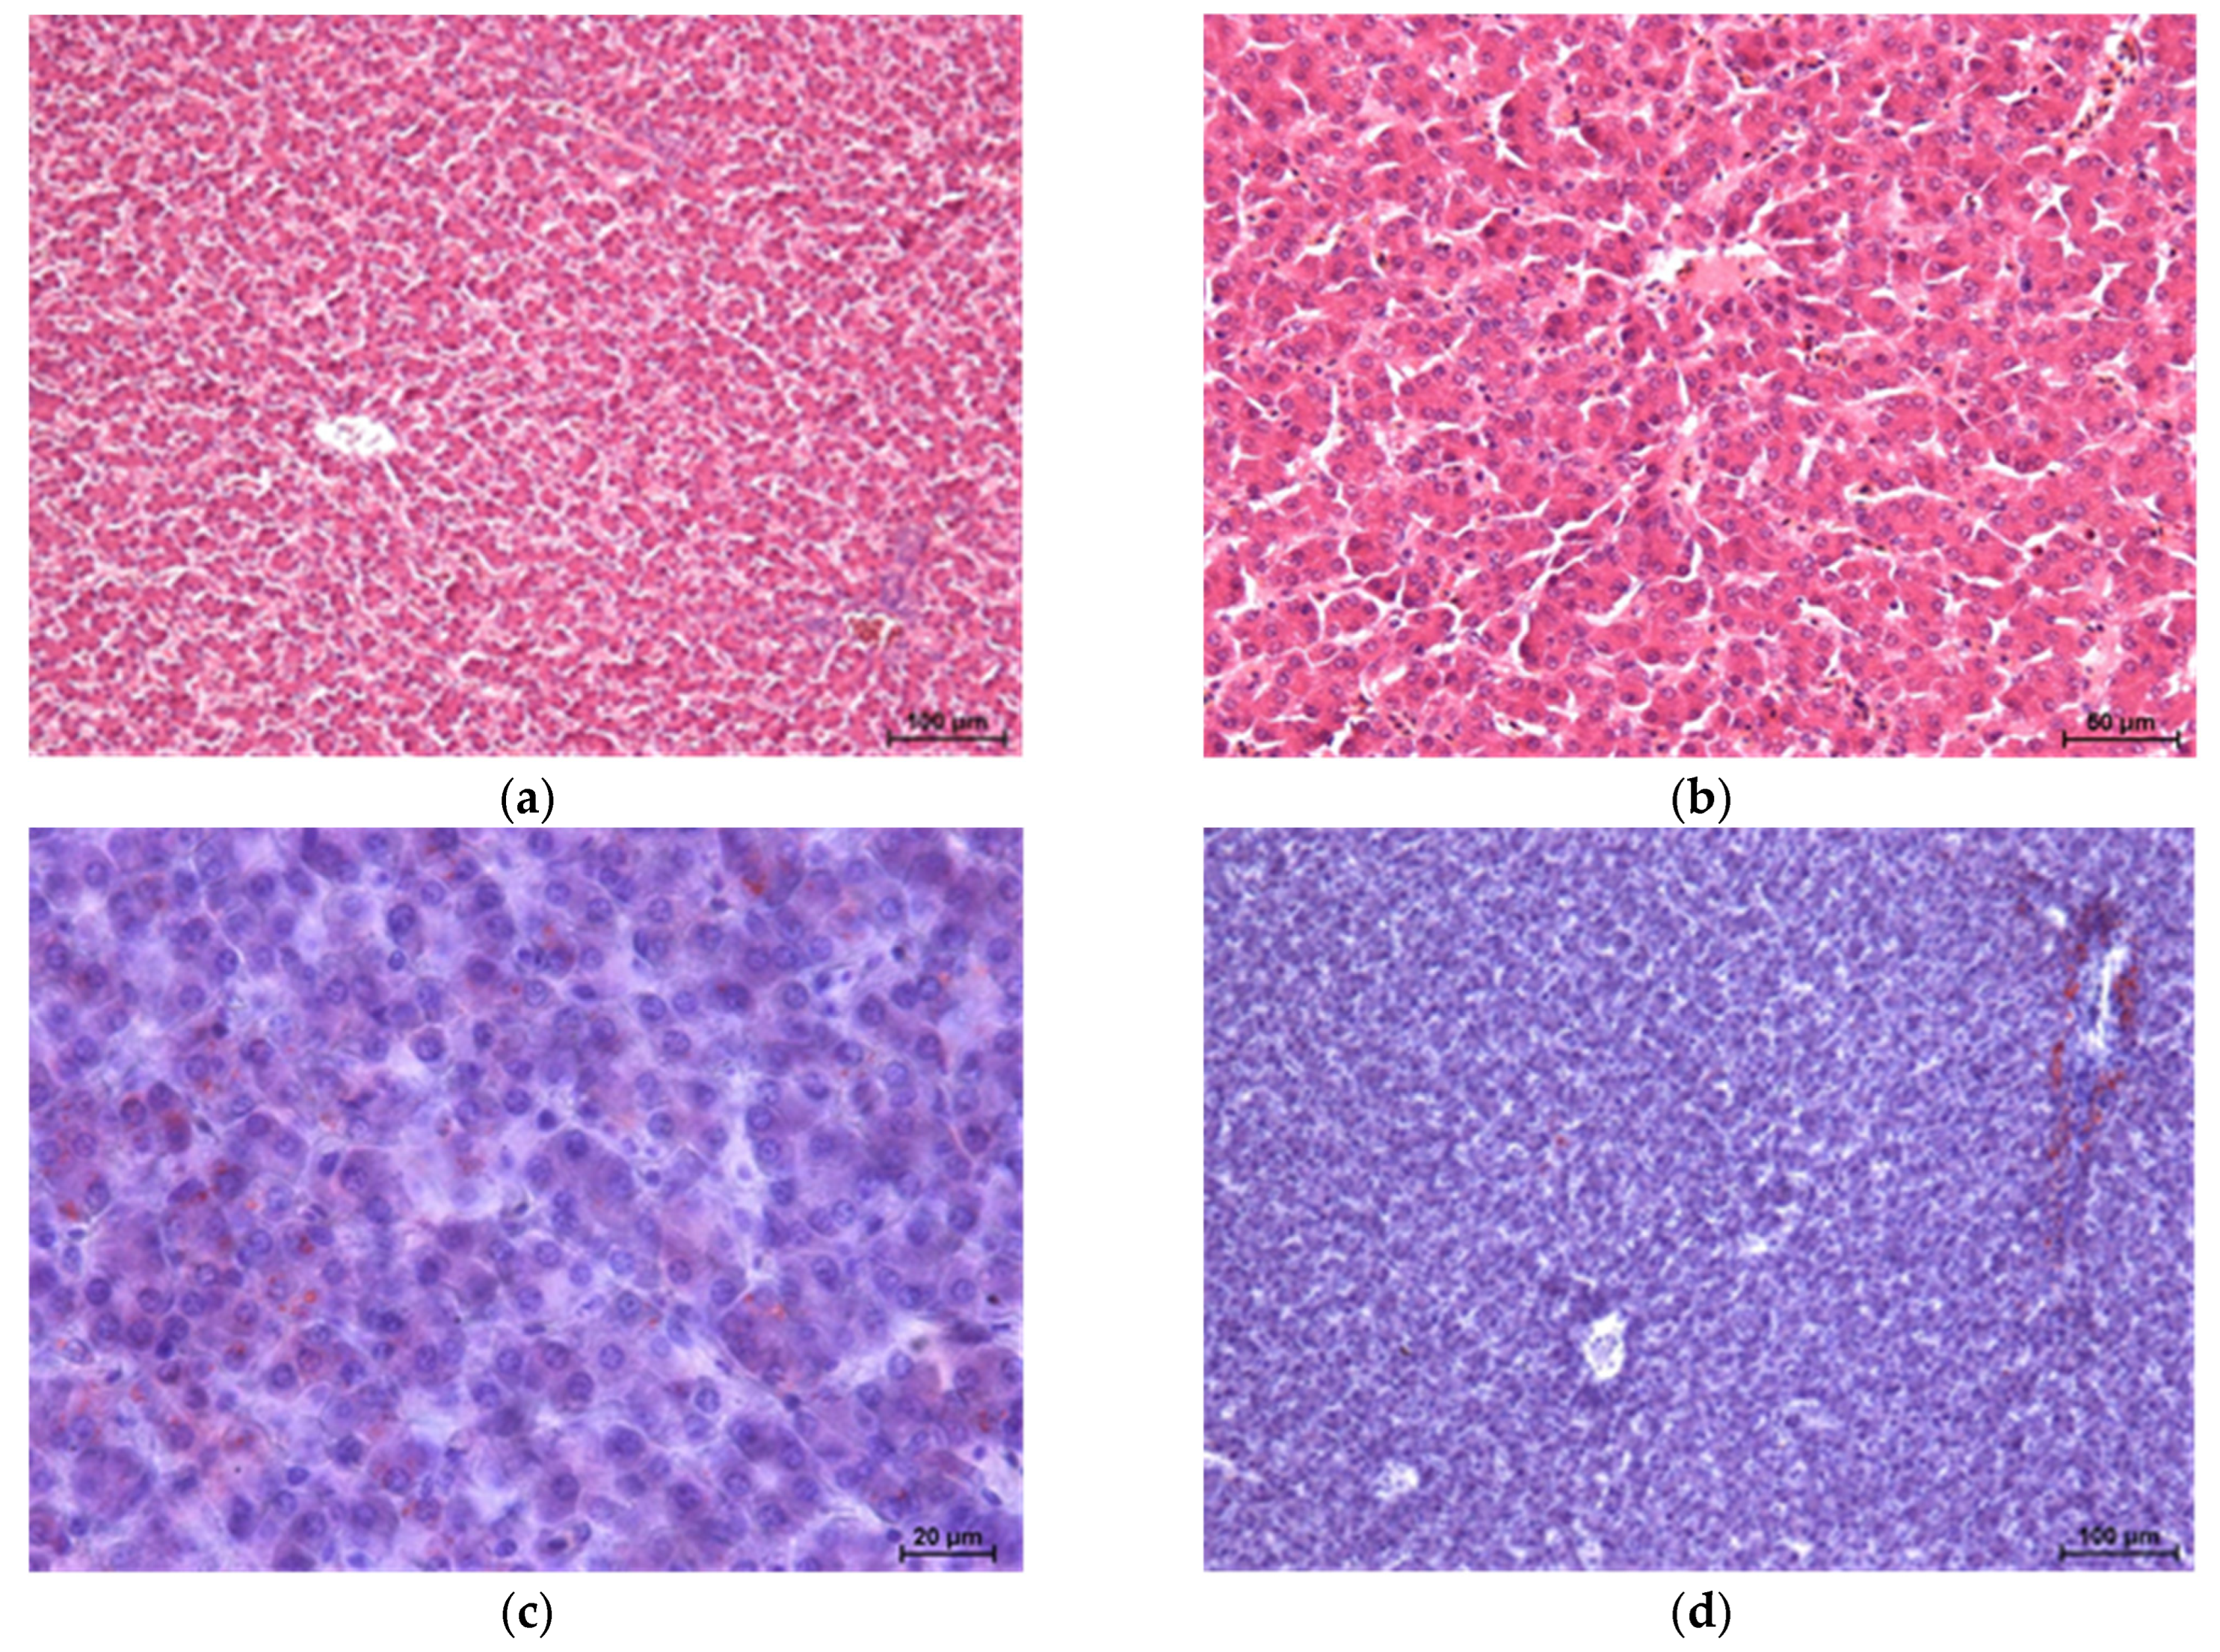
Histopathological results of broiler chicken livers are shown in
Figure 1,
Figure 2,
Figure 3 and
Figure 4 [haematoxylin and eosin staining (two images each) and Sudan IV staining (two images each)].
The study showed no significant microscopic changes, implying liver damage in chickens fed experimental diets. Only the GM2 group showed slight disruption (dissociation) of hepatocyte cords. However, this is not associated with congestion or retrograde changes. The livers of birds in all four groups showed no inflammatory pathological changes. Staining for neutral fats showed no differences in lipid distribution and content between the groups, except for a higher level of lipids in the livers of chickens from the GM2 group.
The numerical values in
Table 7 demonstrate that the type of rations fed to the chickens had no significant effect on most of the physical traits assessed. Only breast muscle reaction measured 45 min after slaughter showed that the chickens in the control group had lower muscle acidity (6.27 vs. 6.05) than those fed rations containing 6% roasted guar meal (
p ≤ 0.05).
The evaluated chicken breast muscles from all groups contained similar (
p > 0.05) amounts of crude protein, crude fat, and minerals (
Table 8).
4. Discussion
Comparing the proximate composition determined in our research to the values declared by the manufacturers on the certificates, it was found that the determined amount of protein was 2–4 p.p. lower and that of crude ash was more than 1 p.p. lower, respectively (except for Microlam). The crude fibre level was also inconsistent with the declared mean amounts, as in raw guar meal it was 1.88 p.p. higher, and in Microlam and roasted −0.52 and 1.31 p.p. lower, respectively. It should be mentioned that manufacturers reserve the right to deviate from the reported average, and these deviations are quite significant, as they amount to ±2% and, for protein, even ±3%. The protein and fibre content determined in our study fell within the ranges indicated by Bielecka et al. [
17]. In the evaluated guar meals, the authors noted 415 to 620 g/kg of total protein, from 41.8 to 78.1 g/kg of crude fat and 26.2 to 138 g/kg of crude fibre. They identified a link between the variability in the content of the evaluated components and the percentage of the specific fraction in the meal. Biel and Jaroszewska [
11] found a higher protein content (ranging from 61.13% to 73.89%) in variously processed guar meals, at a level similar to the content of crude fat and crude ash measured in our study. In addition, these authors noted that extracted guar (korma), which contained the highest amounts of protein and fat showed the lowest levels of crude fibre and crude ash. Similarly Kotnala et al. [
13] showed that guar korma had higher protein content (53.4%) than guar churi—40.8%.
The amount of amino acids in the three evaluated guar meals was dependent on the protein content, in which less lysine, threonine, isoleucine, leucine, and valine were found, but significantly more arginine (more than twice as much in processed guar meals), cystine, and tryptophan compared to SBM. More arginine, but less lysine, methionine, threonine, isoleucine, and leucine were found in guar meal compared to soybean meal by Lee et al. [
15] and Song et al. [
47]. Similarly, Biel and Jaroszewska [
11] compared the amino acid composition of processed guar meals with that of soybean meal and found more arginine and tryptophan and less lysine, threonine, isoleucine, leucine, and valine in the meals.
Analysing the content of antinutrients in 15 guar meals, Bielecka et al. [
17] identified very high (0.92–7.42 mg/g) variability of the tannin content. In contrast, the level of trypsin inhibitors was stable and ranged from 1.2 and 1.5 mg/g. The level of trypsin inhibitors assayed in raw guar meal was identical (1.20 g/kg) to that assayed in soybean meal. The other two guar meals showed fewer compounds of this type, which is consistent with the findings of Conner [
14], Lee et al. [
15], and Nasrala et al. [
48], who found fewer trypsin inhibitors in guar meal than in soybean meal. Fewer trypsin inhibitors (3.96 mg/kg) but more (1.71%) tannins in guar meal were reported by Karpiesiuk et al. [
26]. Çalişlar [
49] reported four times higher levels of condensed tannins in guar meal (0.24%) than in SBM (0.96%).
The growth performance (BWG, FI, and FCR) of broiler chickens fed rations (starter, grower, finisher) containing 6% of the three guar meal types was satisfactory. However the broiler chicken fed diets containing Microlam (GM2 group) were the lightest (2583 g), and the difference (63 g) between the weight of chickens from this group and from GM1 was statistically significant. Probably it could be connected with the digestibility of Microlam and the degree processing (laminating and micronizing), it is white powder. This is difficult to argue with the results of other researchers, as such assessments have not been conducted. The vast majority of experiments involved the assessment of various percentages (between 2% and 15%, up to 20%) of a single type of guar meal in diets for chickens [
6,
9,
24,
29,
32,
50,
51,
52]. Generally the studies showed that with the growing of the guar meal level in broiler chickens rations caused decrease BWG and FI and increase FCR. Guar meal caused reducing palatability and feed intake. In contrast our study noted increase FI (
p < 0.05) in broiler chickens fed rations containing 6% guar meal (GM1, GM2, GM3). Milczarek et al. [
24] introduced 4, 8%, and 12% of guar meal in chicken diets, and observed that the lowest percentage of guar meal had no effect on body weight and feed intake, while higher percentages deteriorated growth performance. Larhang and Torki [
50] noted a significant reduction in weight gain in birds fed diets containing 4% or 8% raw guar meal compared with control chickens. Concurrently, they recorded significantly higher feed conversion ratio in chickens receiving 8% guar meal than in the control birds and chickens fed rations containing half (4%) the amount of the evaluated raw material. Kamran et al. [
9], feeding broiler chickens with rations contained 5, 10 and 15% of raw guar meal (with or without enzyme) found deterioration growth performance (BWG, FI and FCR) in compare to control group. Similarly, Rajasekhar et al. [
52], who made lower levels (4% and 6%) of guar meal into the rations of birds, observed a linear decrease in BW and an increase in FCR at the respective phases of broiler chicken rearing. In turn, Gharaei et al. [
20] and Gheisarai et al. [
53] demonstrated that, regardless of whether the feed rations contained 3% or 6% guar meal, the chickens had a similar body weight on day 42 of rearing, which was consistent with the BW of the control chickens. However, a higher percentage (9–18%) of guar meal in the feed rations significantly reduced bird body weight and increased feed conversion ratio. Rao et al. [
8] observed that the inclusion of up to 10% raw or toasted guar meal in broiler diets significantly reduced BWG, FI, and FCR. A lack of significant impact of diets containing 10% guar meal on body weight and feed conversion ratio after 6 weeks of broiler chicken rearing was demonstrated by Haribhau et al. [
30]. Similarly, Wankhede et al. [
29] observed no significant influence of rations containing 10%, 12.5%, 15%, 17.5%, or 20% toasted guar meal on the final body weight and FCR of broiler chickens.
The obtained results of worse dressing percentage (DP) of GM3 group chickens could be connected with body weight before slaughter and growth results [
3,
20,
48]. Many researchers, including Gheisarai et al. [
53] Afrouzi et al. [
54], Nasrala et al. [
48], and Milczarek et al. [
55] showed a decline in DP, but at a higher level of guar meal in the diet. Afrouzi et al. [
54] observed a larger decrease in the DP of chickens (70.32% vs. 71.50%) after introducing guar meal (5% and 10%) to the diet. Nasrala et al. [
48] noted that increasing levels of guar meal (up to 10%) in rations for chickens resulted in a directly proportional decrease (from 79.08% to 71.68%) in dressing percentage. Wankhede et al. [
29] and Tammam et al. [
6] found no differences in the DP or in meatiness and abdominal fat between feeding groups. Afrouzi et al. [
54] demonstrated that 5% guar meal added to broiler chicken feed had no impact on breast muscle yield, however doubled amount of guar meal caused decrease (33.6% vs. 32.93%) breast yield. On the other hand El-Masry et al. [
56] noticed that the weight of breast muscle decreased (579.06 g vs. 521.87 g) when 5% guar meal was included as a partial replacement for SBM. Mohayayee and Karimi [
51] showed that birds fed rations with a high level (9% and 12%) of guar meal had higher abdominal fat levels than in the control chicken group and chickens fed diets with a low level (4%) of guar meal, by 22% and 16%, respectively. In contrast, Reddy et al. [
57] found no effect of toasted guar meal (6%, 9%, 12%, 15%, and 18%) in feed rations on the fatness of broiler chickens. Similarly, Rao et al. [
8] reported no significant influence of 6%, 12%, and 18% commercial guar meal introduced to rations for broiler chickens on their abdominal fat.
Nasrala et al. [
48], Siva et al. [
58] and Wankhede et al. [
29] reported no effect of guar meal (irrespective of its percentage) in the feed rations on the percentage of giblets on chicken carcasses. Milczarek et al. [
24] and Tammam et al. [
6] noted an increased percentage of giblets (including the stomach) in chicken-fed diets with the highest share guar meal compared to diets containing less of this feed.
Microscopic examination of the livers of chickens fed experimental diets did not reveal pathology. However, chickens from the GM2 group showed slight disruption of hepatocyte cords, which could be associated with slightly increased levels of lipids in the liver cell cytoplasm. Increased levels of neutral lipids in the livers of bird-fed mixtures containing processed guar meal fell within physiological norms, as no relocation or damage to the cell nucleus was observed. During fatty degeneration, the nucleus moves to the periphery of the cell and then becomes damaged. It should be emphasised that chickens in this group (GM2) had the highest degree of fatness, as measured by the percentage of abdominal fat and skin with subcutaneous fat. The lack of significant changes in liver histology can be associated with the short (six weeks) intake period of feed containing antinutrients (e.g., tannins and trypsin inhibitors) and their volumes, which can have a negative impact on the macro- and microscopic images of the internal organs of broiler chickens, as suggested by Milczarek et al. [
3]. Karpiesiuk et al. [
59], having introduced 4.9%, 9.9%, and 14.6% of guar meal in the rations of pigs (finishers) found that increased levels of this raw material alter liver histology, which can have an adverse effect on the animals’ health and productivity.
The colour, water-holding capacity, and acidity of meat are the main characteristics noticed by consumers, and greatly impact meat acceptance, especially for fresh poultry products. The physical properties of meat can positively affect juiciness, shelf life, and texture. Although the breast muscles showed differences in acidity (pH
1), they can be classified as normal meat, free of defects, as the pH measured 45 min after slaughter fell within the range of 5.8–6.3, as recommended by Trojan and Niewiarowicz [
60] and Gardzielewska et al. [
61]. A sharp drop in the pH recorded after 24 h of cooling was not desirable. Mehaffey et al. [
62], Garcia et al. [
63], and Dal Bosco et al. [
64] report that it may be a cause of the meat turning pale and deterioration in its water-holding capacity (WHC). The lack of a significant effect of the diet fed to chickens on the WHC and colour of the meat confirms the high quality of the meat. According to Liang et al. [
65] and Petracci and Cavani [
66], if the pH at 24 h
post-mortem (pH
24) was less than 5.7, and the lightness (L*) was greater than 53, poultry meat was categorized as PSE-like. L* parameter values are typical of normal muscles, since, according to Qiao et al. [
67], the colour lightness (L*) of normal breast muscle falls within the range of 48–53. The present study corroborated our own previous results [
24,
55], indicating that the inclusion of guar meal does not affect the water-holding capacity, redness, and yellowness of breast muscles.
The proximate composition (DM, CA, CP, and CF) of broiler chicken breast muscles was typical [
1,
3,
24,
55,
64]. Proved more content of fat in breast muscles of chickens GM1 and GM2 groups allows to say that their muscles will be more palatability than control and GM3 groups (which contain less fat). No impact different level of guar meal included in broiler chicken rations on the proximate composition of the muscles found Milczarek et al. [
24].


