Abstract
Productive and healthy soils are essential in agriculture and other economic uses of land which depend on plant growth, and are under increasing pressure globally. The physical properties of soil, its porosity and pore structure, also have a significant impact on a wide range of environmental factors, such as surface water runoff and greenhouse gas exchange. Methods exist for evaluating soil porosity that are applied in a laboratory environment or by inserting sensors into soil in the field. However, such methods do not readily sample adequately in space or time and are labour-intensive. The purpose of the current study is to investigate the potential for estimation of soil porosity and pore size using the strength of reflection of audio pulses from natural soil surfaces. Estimation of porous material properties using acoustic reflections is well established. But because of the complex, viscous interactions between sound waves and pore structures, these methods are generally restricted to transmissions at low audio frequencies or at ultrasonic frequencies. In contrast, this study presents a novel design for an integrated broad band sensing system, which is compact, inexpensive, and which is capable of rapid, non-contact, and in situ sampling of a soil structure from a small, moving, farm vehicle. The new system is shown to have the capability of obtaining soil parameter estimates at sampling distances of less than 1 m and with accuracies of around 1%. In describing this novel design, special care is taken to consider the challenges presented by real agriculture soils. These challenges include the pasture, through which the sound must penetrate without significant losses, and soil roughness, which can potentially scatter sound away from the specular reflection path. The key to this new integrated acoustic design is an extension of an existing theory for acoustic interactions with porous materials and rigorous testing of assumptions via simulations. A configuration is suggested and tested, comprising seven audio frequencies and three angles of incidence. It is concluded that a practical, new operational tool of similar design should be readily manufactured. This tool would be inexpensive, compact, low-power, and non-intrusive to either the soil or the surrounding environment. Audio processing can be conducted within the scope of, say, mobile phones. The practical application is to be able to easily map regions of an agricultural space in some detail and to use that to guide land treatment and mitigation.
1. Introduction
This work is aimed at providing a new, readily accessible technology for rapid non-contact assessment of soil physical health for primary industries.
1.1. Why Knowledge of Soil Physical Properties Is Important
Soil is the connection between the atmosphere and ground water, root systems, and sub-soil biological and chemical processes. Central to this connection is the degree to which air and water can penetrate soil. This is primarily measured by soil porosity, ϕ, or the ratio of void volume to the total volume of a soil sample, which is an important factor in maintaining good soil health [1,2,3]. Soil porosity governs water and air exchange and water access through crops and pasture [4,5,6]. This also affects movement of nutrients and contaminants via overland flow to rivers and streams and the emission of greenhouse gasses [7]. Farm machinery and animals induce compaction, which limits porosity and the size and density of pores [8,9]. Such compacted soils show decreased plant and crop productivity because of poor drainage and limited root growth [10]. Compaction and erosion cause degradation in around 52% of the world’s agricultural land [11].
Increased volumes of freshwater contaminants, such as sediment, nutrients, and microbes, result from soil compaction [11,12,13,14,15]. This damages the soil structure by reducing the soil pore volume (small air-filled gaps or channels within the soil) and pore connectivity (the degree to which the pores within a soil matrix are connected). Negative impacts on total pore volume and pore connectivity due to compaction also reduce soil aeration, which increases anaerobicity, exacerbating greenhouse gas (GHG) emission [12,15]. In moving towards more sustainable land use systems, the identification of physically degraded soils is a critical first step to enable targeted management. There are significant economic [16] and environmental impacts [17] of such assessments.
The spaces, or pores, between soil particles are not simple cylinders. Some additional soil physical parameters include tortuosity, α∞ (the length of a pore following its path, divided by the shortest distance between the two ends of the pore) and the pore radius rpore. Larger pores (macropores) are important for promoting good aeration and rapid infiltration of rainfall, while smaller pores (micropores) are crucial for absorbing and holding water, which is accessible to plants. Connectivity between pores determines how easily water and nutrients move through the soil, affecting the overall soil structure and functions.
In practice, there are a wide range of pore geometries, but usually a single porosity value, tortuosity, and a characteristic pore radius are assigned to a soil sample. However, there are wide spatial and temporal variations, depending on land management [8,18]. It is therefore important to measure soil physical properties at many sub-paddock-scale sites to assess if current land use and practices are sustaining soil health and have limiting impacts on the environment and food production.
1.2. Traditional Measurement Methods for Soil Physical Properties
The traditional methods for measuring soil porosity include measuring the extra mass of water that is required to saturate a soil sample; use of a pycnometer to measure the air volume in the pore space for a soil sample in a gas-tight chamber; and compression of a soil sample to estimate the solid volume of soil [19,20]. Such methods necessitate significant investments in time and labour [21]. These existing methods also provide fragmentary information in time and space and offer a limited capacity to assess variations in soil health. Non-contact, or proximal, sensing on the other hand potentially provides much more data at a lower cost and can be designed to be usable by land managers and farmers.
Currently, soil pore size and pore connectivity measurement are invasive methods [22]. For example, details of pore connectivity can be measured via X-ray imagery [23], but this requires specialised equipment in a laboratory environment. Nevertheless, pore size is a significant parameter in estimation of hydraulic flow [24].
1.3. Acoustic Measurements of Porous Material Physical Properties
When a sound in air meets the surface of a porous material, the oscillating air moves within the pore spaces. This movement can be dominated by viscous flow if the Reynolds number is low, or equivalently the sound frequency is sufficiently low.
Soil physical properties affect the speed of sound and consequently absorption, dispersion, and reflection [25]. Some examples include estimating the porosity of soil samples in the laboratory via the reflection and sound speed of ultrasonic pulses [26], capacitive sensing [27], and sensing dispersion [28]. The non-invasive methods include research on sound propagation over large distances affected by ground reflections [29,30,31], although researchers are usually interested in the effect on sound intensity rather than on estimating the soil properties.
The fundamental theory for the interaction of sound with a porous material interface is very well established [32,33], and corrections to the original Biot model have been developed from the first principles [34]. Some extensions of this work include determination of the characteristic thermal and viscous lengths [35], and comprehensive overviews [36] in particular [37], and a detailed description of the acoustic flow within pores [38]. It is evident that viscous and thermal effects are complex, and in general depend on pore shape and orientation, as well as pore size [34]. This has led to a number of simplifications, such as the introduction of effective density and effective bulk density [39], tortuosity [40], and flow resistivity [41]. The result is the identification of a critical frequency fc, which separates low-frequency and high-frequency asymptotic regions [39,42,43,44,45]. This critical frequency is proportional to σ, flow resistivity. A review of in situ and laboratory evaluations of pore structure [22] includes methods based on volume [27,46,47,48]; both transmission and reflection [45,49,50,51]; and reflection alone [52,53,54]. Of these, only the reflection methods lend themselves to proximal sensing.
Reflectivity is a measure of the difficulty of sound penetration through a porous interface. At high frequencies, reflectivity depends on porosity (the fractional volume of air in the soil pores), tortuosity (the extent of twists in the pores), and the angle of incidence of the sound, but not on acoustic frequency or pore size [39,55]. At low frequencies, reflectivity depends on porosity, tortuosity, and the angle of incidence, as well as on acoustic frequency and pore diameter [56].
These interactions of sound waves with a porous surface can be determined with a range of in situ and laboratory methods to measure the surface’s morphological characteristics [22]. Of these, only the reflection methods, which are applicable at high frequencies, lend themselves to proximal sensing. At higher acoustic frequencies, measurements at two or more angles of incidence allow for the estimation of both porosity and tortuosity [52,53,57], whereas at low acoustic frequencies, flow resistivity can be estimated via reflection of sound [58]. Flow resistivity is related to the characteristic or average pore radius [22]. This suggests that a combination of ultrasound and low acoustic frequencies could yield estimates of porosity, tortuosity, and pore radius.
Figure 1 shows the random error or difference in direct, selected measurements made of acoustic reflections from a variety of porous materials. This selection is intended to be indicative, rather than exhaustive; for example, there are many outdoor sound investigations of acoustic reflections, but these have not been included because they generally discuss their results in terms of received signal spectra rather than soil parameters. Also, the data shown in Figure 1 have been recorded in a number of ways, and the uncertainties most likely depend somewhat on the techniques used. The measurements fall largely into two spectral regions: frequencies below 1 kHz providing estimates of flow resistivity σ, and frequencies above 20 kHz providing estimates of porosity ϕ and tortuosity α∞. The exceptions are the estimates of porosity by Umnova [45] using frequencies from 1 kHz to 10 kHz. However, these measurements were on a lead shot of 1 mm and 2 mm radius, foil having pores of 1 mm radius, and gravel of 9 mm typical dimension. For these cases, the pore radius is much larger than is typical of foams and soil, and so fc is much lower than for the other measurements shown. It is also possible that the very high uncertainties for the gravel and the 2 mm lead shot are due to the theory not being accurate for such open structures. Another unusual case is the measurements by Sadouki [51] (shown as magenta circles) at frequencies of 50–70 Hz from which porosity values were deduced. However, in this case, a value of σ from direct measurements was assumed. Nevertheless, this selection of measurements show that measurement uncertainties about the physical parameters of porous materials can generally be below 10% and that such measurements are widespread and accurate.
1.4. Acoustic Measurements of the Reflectivity of Soil
Acoustic reflectivity has been used to assess the acoustic properties of a wide range of materials, including synthetic foams [35,59], snow [60], concrete [61], meteorites [62], and bread crumbs [63]. However, in all these applications, the interface differs vastly from that of natural soils by being naturally or artificially smooth. Also, natural soils will generally have vegetative cover and be moist. Generally, the pores are not expected to be filled with water since the water table is likely to be below the penetration depth of sound [64].
A pasture potentially will affect acoustic reflections. Ultrasound has been used for estimating pasture biomass, although ultrasound has generally been used to sense the top of pastures, rather than penetrating through [21]. Legg and Bradley [65] used ultrasound in the frequency range 20–35 kHz to penetrate pastures over natural agricultural soils. Penetration to the soil surface was clear at 20 kHz, but reduced with increasing frequency, suggesting that proximal sensing of soil porosity may be possible through vegetative cover only at low ultrasound or high audio frequencies. One interesting experiment used a parametric speaker with a carrier frequency of 44 kHz and audio in the range 500–5000 Hz to penetrate a densely vegetated “green wall” [66], but because of the non-linear parametric process, it was difficult to estimate the degree of penetration of either ultrasound or audio.
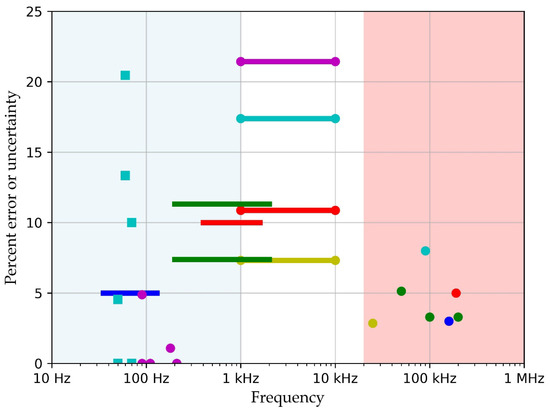
Figure 1.
Acoustic estimations of soil flow resistivity σ (squares and horizontal lines) and porosity ϕ and tortuosity α∞ (circles). Measurements in red shaded region generally have Ω >> 1, and those in blue shaded region generally have Ω << 1. Circles are red [54], blue [55], green [63], cyan [60], yellow [67], and magenta [68]. Horizontal lines are red [61], blue [58], and green [69,70]. Cyan squares are [51]. Lines terminated in circles are estimates of ϕ: yellow (2 mm diameter lead shot), red (foil with 1 mm pore radius), cyan line (4 mm diameter lead shot), and magenta (gravel of typical diameter 9 mm) [45].
A rough surface can masquerade as high-porosity because of its low specular reflectivity caused by the diffuse scattering of sound. Kaźmierowski et al. [71] review the methods used to measure fluctuations in soil height, as well as describe use of UAV photogrammetry at field scales. In their field study, the standard deviation of soil surface height was 14–33 mm. Numerical modelling is described by Isakson and Chotiros [72]. Thomsen et al. [73] compare five different methods to measure roughness in the field in 1 m2 agricultural plots with different management (ploughing, harrowing, foresting, and direct seeding on stubble). Two contact methods, roller chain and pinboard, were used, as well as three optical methods, stereo-photogrammetry, laser scanning, and a structural light method. Their results show a standard deviation of soil height around 10–30 mm. This range of soil roughness and that from Kaźmierowski et al. [71] relate to ploughed and other very rough surfaces, and are greater than expected from pasture land, although large-scale, non-random depressions are important in affecting surface depression storage, water infiltration, and overland flow [74]. An acoustic method, scanning with a microphone over a dynamically rough water surface to obtain a roughness profile at the mm scale, is described by Krynkin et al. [75], but it is unclear whether this method could be applied to soils. Oh and Stiles [76] estimated soil roughness using two separate measurement tools, a laser profilometer system, which provides digital profile data directly, and a painted paper profiler, which converts digitized data in the lab. These field studies give the background parameters required to estimate the extent of scattering of sound by a natural soil surface.
Elfouhaily and Guérin [77] review a comprehensive range of approximate scattering models and modelling approaches, whereas Darmon et al. [78] give a more recent review concentrating more on outdoor sound propagation. Scattering is in the high-frequency regime if kσh >> 1, where k is the acoustic wavenumber and σh is the standard deviation of surface height [79,80]. A common approximation in this regime is that the surface slope is small [81,82,83,84], or we assume that acoustic scattering is similar to geometric optics scattering [85,86]. These approximations are potentially valid for proximal sensing by ultrasound of scattering from soil that is randomly rough.
Figure 2 shows a comparison between the porosity values estimated from 25 kHz reflections and direct measurements by the gravimetric method (adapted from [67]). These results are from five measurements of bare soils in pans in a laboratory, having level surfaces, and three measurements of natural soil surfaces on farmland. The measurements at the field sites are from one site with grass removed and one site before and after grass was removed. For this latter site, the removed pasture had a biomass of 0.22 kg m−2 (or 2200 kg ha−1 of dry matter), which is typical of dairy farm pasture loads. There are a number of pertinent features to this figure: there is no systematic bias (the linear regression line matches the 1:1 line); the estimates of natural field soils are only marginally poorer than over bare soil; the effect on the estimates of pasture is negligible; and the overall rms uncertainty for all the samples is 0.042.
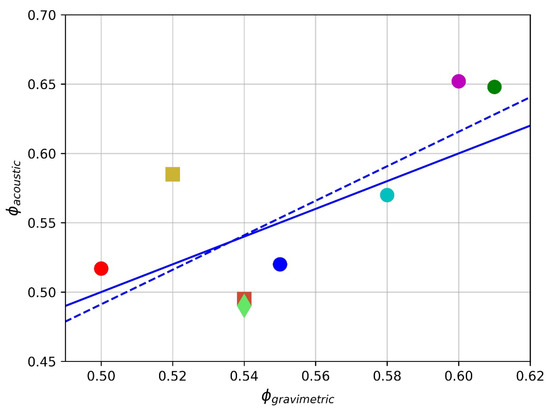
Figure 2.
Porosity estimated from reflected ultrasound compared with direct (gravimetric) measurements [67]. Circles: lab measurements of 5 bare soil samples in pans. Squares: measurements of bare soil at 2 field sites. Green diamond: measurements of soil covered with grass weighing 0.22 kg m−2 (2200 kg ha−1 DM). Dashed blue line: linear least squares regression. Solid blue line: 1:1.
The same measurements were examined for the effect of soil surface roughness on porosity estimation errors (Figure 3). The standard deviation of surface height, σh, was estimated optically and from acoustic scattering, and the abscissa is a scattering parameter kσh, where k is the acoustic wavenumber. Again, the field measurements, including the sample covered with pasture, do not stand out as outliers.
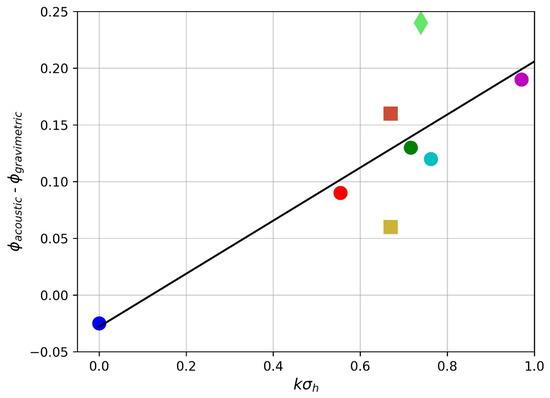
Figure 3.
Effect of surface roughness of rms height variation σh (k is acoustic wavenumber). Measurements are displayed as in Figure 2. Linear least squares regression line is shown in black.
The use of lower audio frequencies would ensure good penetration of sound through vegetation and reduced scattering by rough soils [67]. However, the acoustic frequencies typically used for flow resistivity estimation are in the range 50–200 Hz, having wavelengths of 2–7 m. This is problematic operationally for a proximal device operating at only 1 m from the target soil surface.
1.5. Purpose and Structure of This Paper
The purpose of the current work is to explore the potential of proximal sensing of soil pore radius in addition to porosity and tortuosity. This requires an extension of the previous work by Bradley et al. [56,67] to include frequency dependence, and based on the above discussion, work with frequencies which are operationally practical. The goal is to develop a technology which can be applied at the paddock or farm scale that is a sensor mounted on a small farm vehicle.
2. Theory and Simulations
The aim is to estimate soil physical properties by using sound reflected from the soil surface, without disturbing the soil. This potentially will allow for rapid assessment of soil physical health using a farm vehicle or drone. The proposed operational setup is shown schematically in Figure 4. A sound pulse of frequency f is incident on the soil surface at an angle of incidence θ from a directional speaker, and the reflected sound is measured in the specular direction by a directional microphone. The ratio of the reflected pulse to the transmitted pulse is the plane wave reflection coefficient R. Some sound is transmitted into the soil, so the amplitude |R| ≤ 1. In general, there is also a phase change upon reflection, including absorption.
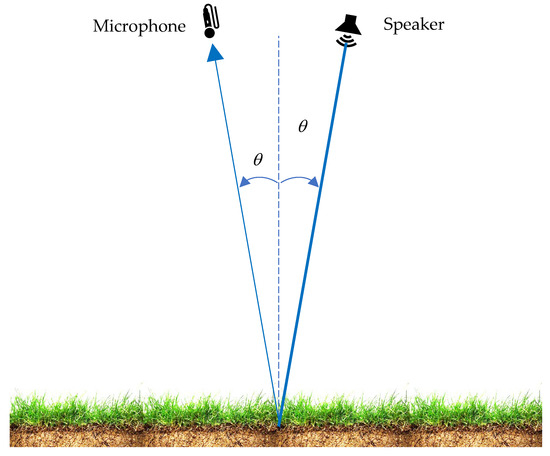
Figure 4.
The measurement configuration.
2.1. Approximations for the Plane Wave Reflection Coefficient R
Bradley et al. [56,67] express R in the form
where
ϕ is the soil porosity, ρe is an equivalent soil density and Ke is effective bulk density (allowing for soil porosity), Ka is the bulk modulus of air, and ρ0 is air density.
Brennan and To [39] show that
and
where the normalized frequency is
The critical frequency fc is given by
where η is the dynamic viscosity of air and rpore is the characteristic (or mean) pore radius [20,22]. Note that when the focus of research is on acoustics, flow resistivity is generally used instead of rpore. The result of these approximations is
where
and
Figure 5, Figure 6 and Figure 7 show how |R| based on rearranging (7) varies with frequency f, angle of incidence θ, porosity ϕ, and the pore radius rpore. Figure 5 shows that at higher frequencies, |R| becomes independent of frequency, while Figure 6 shows a stronger dependence on porosity at higher frequencies and independence of porosity at lower frequencies. Dependence of |R| on pore radius is effectively linear at lower frequencies, but |R| changes very rapidly with the pore radius at higher frequencies and lower pore radii. It is these variations which have largely driven the design of measurement systems, as also indicated in Figure 1. The measurement results become simpler at the two asymptotic limits f << Ω and f >> Ω.
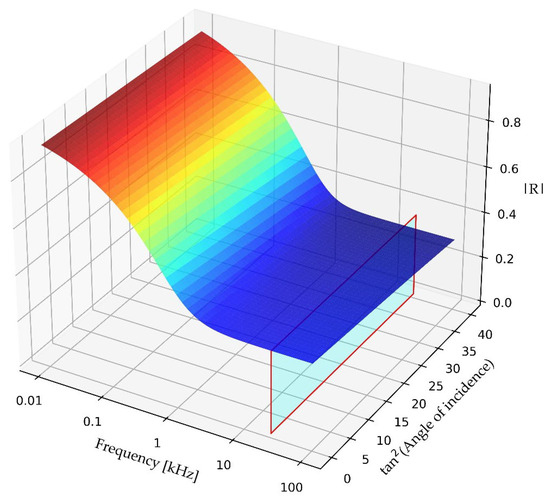
Figure 5.
Variation in |R| with frequency f and X according to (7), with ϕ =0.6, α∞ = 1.6, and rpore = 0.14 mm. Twenty-five kHz ultrasound slice is shown in light blue.
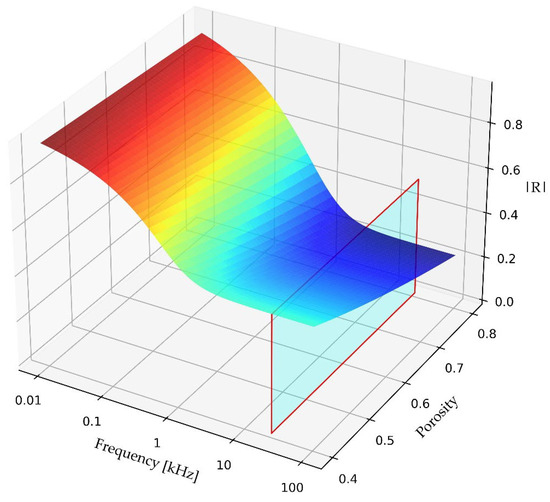
Figure 6.
Variation in |R| with frequency f and porosity ϕ according to (7), with X = 0.0, α∞ = 1.6, and rpore = 0.14 mm. Twenty-five kHz ultrasound slice is shown in light blue.
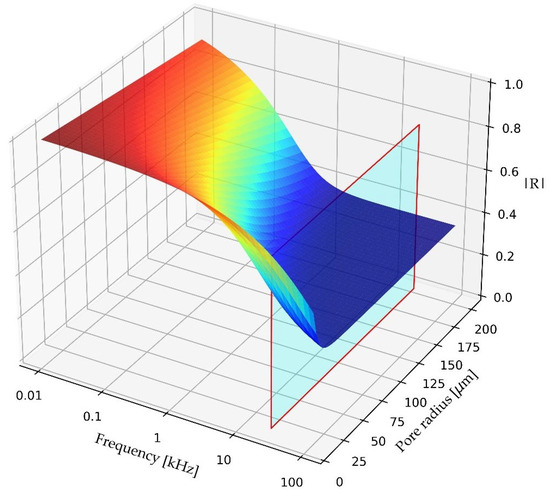
Figure 7.
Variation in |R| with frequency f and pore radius rpore according to (7), with X = 0.0, ϕ = 0.6, and α∞ = 1.6. Twenty-five kHz ultrasound slice is shown in light blue.
For Ω >> 1
where
This approximation was successfully used by Bradley and Ghimire [56] and Bradley et al. [67] to estimate soil porosity ϕ and soil tortuosity α∞ using the slope and intercept of a linear regression from measurements |R| at several angles of incidence θ and at an ultrasonic frequency of 25 kHz (see also [52,53,57]).
For Ω << 1
This was the asymptotic solution used by Sebaa et al. [58], Sadouki [68], and Good [70]. Equation (14) suggests that once ϕ and α∞ have been estimated from transmissions such that Ω >> 1 using Equation (12), a linear regression involving measurements at several transmissions such that Ω << 1 will allow for an estimation of Ω, and hence σ and rpore.
2.2. Typical Values of Model Parameters
In order to estimate all three of ϕ, α∞, and rpore, the strategy outlined above requires use of well-separated lower acoustic frequencies, flow, and higher acoustic frequencies, fhigh, satisfying
Table 1 gives the typical values of parameters appearing in the above theory. Being simply a fraction of total volume, ϕ can range between 0 and 1, typically falling between 0.35 and 0.7 for soils [20]. The typical values for grasslands quoted by Salomons [31] are α∞ = 1.35, ϕ = 0.3, and 5 ≤ Ω ≤ 20 when the sound has a frequency of 25 kHz, equating to rpore = 63–125 μm.

Table 1.
Model parameters.
A limitation on the angle of incidence arises from keeping the instrumentation reasonably compact. The limitations on transmitted frequency arise from aiming for directionality, whilst not being too sensitive to scattering of sound by vegetation and surface roughness at higher frequencies. For a propagation path from speaker to ground to a microphone of length L = 2 m (which would be a typical range from a small agricultural vehicle) and for an angle of incidence θ = 30°, the time for sound to travel horizontally between the speaker and the microphone is L/(2c0) = 3 ms if the sound speed c0 = 340 m s−1 (see Figure 4). The time of first arrival of reflected sound is L/c0 = 6 ms. This means the duration of the acoustic pulse should be less than L/(2c0) = 3 ms. There are 12 cycles of 4 kHz sound in a 3 ms pulse, which would give a reasonable pulse shape for detection and peak analysis, and so this would be a practical lower frequency for signal analysis. For these parameters, one measurement would take at least L/c0 + L/(2c0) = 9 ms, so that around 100 measurements per second would be feasible if the transmissions were at all frequencies and angles of incidence simultaneously. However, an acoustic frequency of 4 kHz is considerably higher than the lowest likely critical frequency of 0.5 kHz. Similarly, a high acoustic frequency of 25 kHz is not much higher than the highest likely critical frequency of 22 kHz.
For example, assuming the estimates of tortuosity and porosity have been made at higher frequencies, Figure 8 shows significant errors in estimated pore radius if Equation (14) is used with transmitted acoustic frequencies in the range of 1–5 kHz.
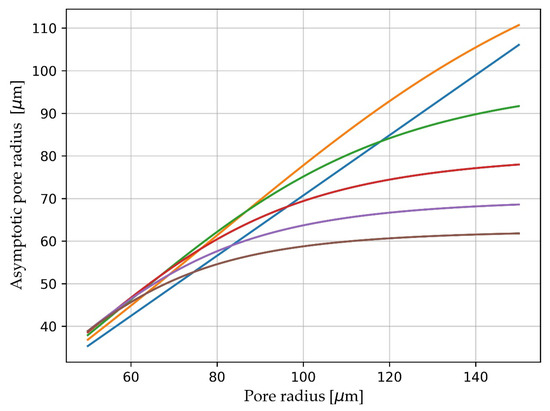
Figure 8.
Estimation of pore radius rpore according to low-frequency asymptote (14), with frequency f = 0.001 Hz (blue line),1 kHz (yellow), 2 kHz (green), 3 kHz (red), 4 kHz (violet), and 5 kHz (brown).
2.3. Approximation at Higher Frequencies
An alternative is to use higher acoustic frequencies and allow for the frequency dependence of Y, where
The curvature can be found from a Taylor series expansion of the right-hand side of (7) in terms of Ω−1, Ω−2, …, and then by expanding R from (7) as a series in terms of Ω−1, Ω−2, …, expanding |R|, and finally Y from (16). This expansion is non-trivial, and it is found to comprise only even powers of Ω. The result is given as follows:
where
Figure 9 shows the variation in Y with f−2 for frequencies in the range from 4 to 16 kHz. Also shown with circle and square markers are the Y values at 1/3-octave frequencies in this band. The asymptotic high-frequency limit of these curves should give A and B, which represent porosity ϕ and tortuosity α∞, and the curvature should give an estimate of Ω, which represents fc and rpore. The blue curves with rpore = 100 μm are nearly linear because Ω is relatively large, so that only the first two terms, those shown in (17), are required to obtain a good estimate of curvature κ and pore radius. As rpore becomes smaller, the series expansion needs to include further terms, so that the term in κ is estimated accurately.
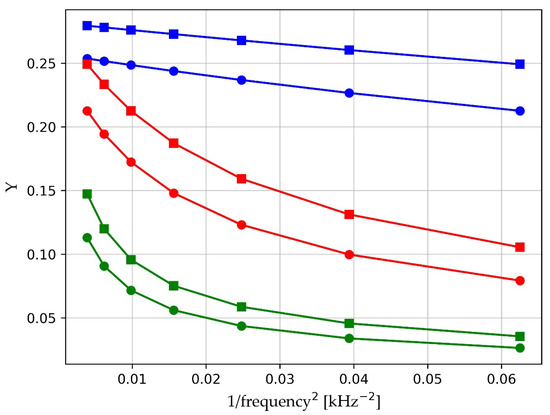
Figure 9.
Behaviour of Y at frequencies above 4 kHz when rpore = 30 μm (green), 50 μm (red), and 100 μm (blue). Lines with circles are at θ = 0°, and those with squares are at θ = 30°.
2.4. Procedure for Estimation of Soil Physical Parameters
Measurements are made at an angle of incidence θm and at a transmitted frequency fn, where m = 1, 2, …, M and n = 1, 2,…, N.
For each θm, a regression of Y vs. f−2 is performed as in (17) and (5) to find estimates and of the coefficients, m = 1, 2, …, M, where
In order to ensure that κ or bm are representative of the first expansion term, further expansion terms should be included, as shown in Figure 10. Given there are N = 7 frequencies, there is still sufficient redundancy in this regression and reasonable accuracy if a polynomial fit of degree 4 is chosen. Using the M estimated values of and the M known values of Xm, the single linear regression of a vs. X
can be performed for the two coefficients and , so that estimates of porosity and tortuosity can be found
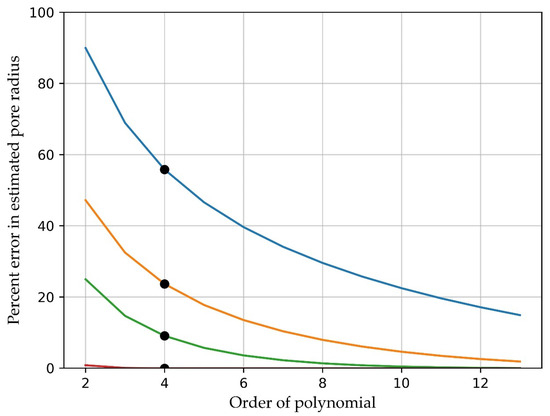
Figure 10.
The estimation error for the pore radius based on the series expansion (17) as a function of the degree of the polynomial expansion. The curves are given for rpore = 30 μm (blue), 40 μm (yellow), 50 μm (green), and 100 μm (red). Black circles show errors when a polynomial of degree of 4 is used.
It is then possible to estimate from (18) and
Hence, the characteristic pore radius can be estimated from
Note that M estimates are made of the pore radius, which are simply averaged.
3. Results
As an example, θm = 0°, 7.5°, and 12.5° for m = 1, 2, 3 (M = 3), and fn = 4.5, 5.7, 7.1, 9, 11.3, 14.3, and 18 kHz for n = 1, 2, 3, 4, 5, 6, 7 (N = 7), giving MN = 21 measurements for each set of regressions. The acoustic frequencies are in 1/3 octave steps. Values of with this set of θ and f values are given in Table 2 for porosity = 0.6, tortuosity = 1.6, and pore radius = 80 μm.

Table 2.
Measured values of |R|.
Simulations are performed for five soil porosity values of 0.4, 0.5, 0.6, 0.7, and 0.8, five tortuosity values of 1.4, 1.5, 1.6, 1.7, and 1.8, and twenty-eight pore radius values from 40 μm to 175 μm in 5 μm steps. Values of are calculated for these 700 simulated soil profiles, and for M angles of incidence and N frequencies. Random Gaussian noise εg with g = 1, 2, ….G and zero mean and standard deviation σR is added to each simulated
Here, ε is a random Gaussian number of zero mean and standard deviation σR. With G = 625, there are 9.2 × 10⁶ simulated reflectivity measurements.
Figure 11 shows the acoustic pulses recorded, as described by Bradley and Ghimire [67], over natural soils in farm paddocks having a biomass of 0.26 kg m−2 (2600 kg ha−1 DM) for the left-hand plot and 0.22 kg m−2 (2200 kg ha−1 DM) for the right-hand plot. The pasture was cut, dried, and weighed to estimate the biomass. These biomass levels are typical of pastureland. The two rural pastureland sites were close to a very busy road, although little acoustic noise in the 20–30 kHz region would be expected from that source. For each of the 32 pulses, an envelope is estimated using a Hilbert envelope estimator. A Gaussian curve is fitted to this envelope in order to estimate the pulse amplitude, width, and time of arrival (or path distance). The transmitted pulses are Hanning-shaped, but a Gaussian is a very good match to this. Means are taken of the fitted pulse amplitudes, widths, and locations, and the Gaussian with these parameters is also shown (in red) in this figure. For comparison purposes, the two pulses have been normalized to the peak value of these averaged Gaussians, and the same path window is shown for both sets of pulses (the pulse duration is different for the two sets). Random noise of standard deviation 0.119 can be seen on the first set of pulses and 0.080 on the second set. The standard deviation of the peaks of the fitted Gaussians is 0.055 for the first set and 0.049 for the second set. If a measurement comprises 16 pulses, then the standard deviations of the mean estimates of |R| are 0.055/161/2 = 0.014 (or 1.4%) and 0.049/161/2 = 0.012 (or 1.2%), respectively. In all the following simulations, a value σR = 0.02 (2% variability in measured |R|) was used, consistent with these real-world field measurements.
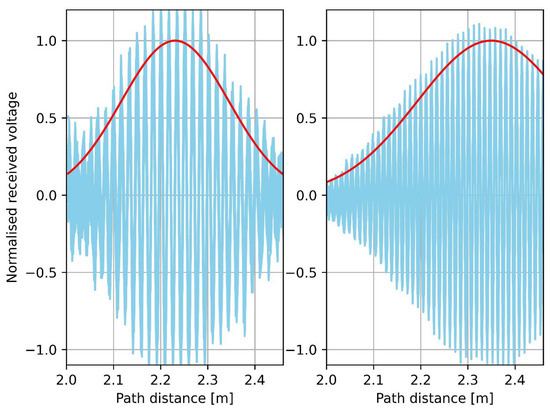
Figure 11.
Plot of 16 successive reflected pulses shown in blue received at 2 field sites [67]. Left-hand plot is from farm paddock having a biomass of 0.26 kg m−2 (2600 kg ha−1 DM) and with θ = 40° and f = 20 kHz. Right-hand plot is from farm paddock with a biomass of 0.22 kg m−2 (2200 kg ha−1 DM) and with θ = 17° and f = 30 kHz. Transmitter array and receiving array are each 1 m radially from insonified location on ground. Also shown as red curves are fitted Gaussian pulse envelopes.
For each soil “profile” s, or group of simulation ϕ, α∞, and rpore values, estimates , , and are made from the G noisy “measurements” involving the three angles of incidence and seven frequencies. The mean values and standard deviations of estimates are found for each of the 700 (ϕ, α∞, and rpore) simulated soil profiles.
There are two main sources of error: model error and random measurement noise error (systematic measurement errors can be made negligible with good hardware design and calibration). Model error arises from truncation of the series expansion (17), as indicated in Figure 10. Model error manifests as bias in the estimates, whereas random noise error manifests as both bias and random fluctuations in the estimates. For example, for porosity estimates, bias β is estimated from
and random uncertainty u from
and similarly for tortuosity and the pore radius. These parameter estimation errors, when averaged over all the measurement sets, give no indication of whether more accurate estimates might be obtained from certain combinations of soil parameters. In order to answer this, β and u are averaged over two of the three soil parameters giving, for example, βϕ, ∞(rpore) for β averaged over all ϕ and α∞ as a function of rpore. The results are plotted in Figure 12 and Figure 13. It is clear that the bias and random errors are low (a few %) and largely independent of the soil properties, except for a strong dependence on the lower rpore values. These three (solid lines) bias curves exceed 5% for rpore < 50 μm (Figure 12), and the estimates of α∞ exceed 5% random noise errors for rpore < 40 μm. Bias errors are also simulated with zero random noise, giving a very similar plot to Figure 12. This indicates that the bias errors are almost entirely due to model errors and not to random noise contributing through non-linearities. Since these errors are systematic, they could be corrected by fitting curves to the error curves, although we have not attempted that here since the errors are very small.
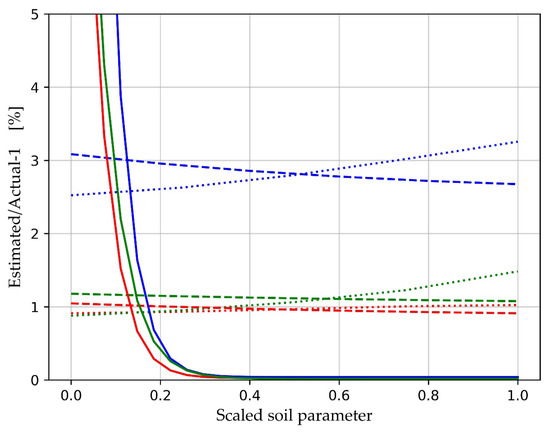
Figure 12.
The fractional bias β in the estimated soil parameters, porosity (red), tortuosity (blue), and soil pore radius (green). The fractional noise in |R| is σR = 0.01. The fractional bias errors are averaged over 2 of the 3 soil parameters and plotted against the 3rd parameter (ϕ dotted lines, α∞ dashed lines, and rpore solid lines). The abscissa represent values of the parameters scaled to their minimum value at an abscissa value 0.0 and their maximum value at an abscissa value of 1.0.
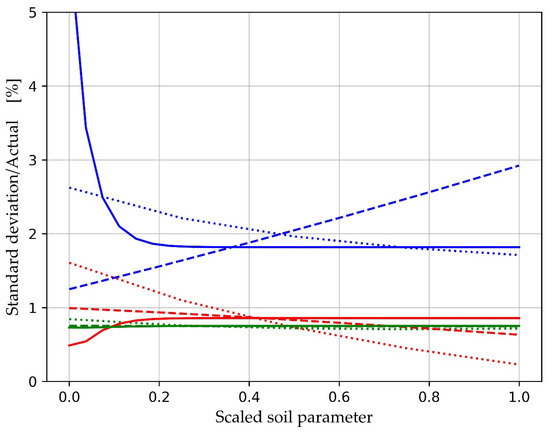
Figure 13.
The relative standard deviation in soil parameter estimation for porosity (red), tortuosity (blue), and soil pore radius (green). The fractional noise in |R| is σR = 0.01. The fractional errors are averaged over 2 of the 3 soil parameters and plotted against the 3rd parameter (ϕ dotted lines, α∞ dashed lines, and rpore solid lines). The abscissa represent values of the parameters scaled to their minimum value at an abscissa value 0.0 and their maximum value at an abscissa value of 1.0.
4. Discussion
The approach taken here to estimate soil physical properties is very different from the traditional laboratory-based methods. Our method allows for fast, non-contact, in situ, simultaneous estimates of soil porosity, tortuosity and soil pore radius. This method also differs dramatically from the asymptotic acoustic methods used by others in either a very high-frequency domain or a very low-frequency domain because it opens up the possibility of using the same speaker elements for all transmissions and the same microphone arrays for all signal receptions. The key new element is the expansion of the full expression for the plane wave reflection coefficient R in a Taylor series with terms in 1/Ω2, 1/Ω4,… Only the coefficient of the first expansion term (in 1/Ω2) has been developed, yielding an expression for the pore radius. A further linear regression is required to obtain estimates of porosity and tortuosity from the same set of measurements.
A Monte Carlo simulation shows that the primary source of uncertainty in soil parameter estimation is model error. These errors are very small, being typically less than 2%, and arise from truncation of the Taylor series expansion to four terms (proportional to 1, 1/Ω2, 1/Ω4, and 1/Ω6). The expansion is truncated, so that the polynomial regression is over-determined with seven acoustic frequencies and four expansion coefficients.
4.1. Validity of the Simulations
In practice, this analysis compares one model (the Taylor series approach) with a model which assumes (1)–(6) are valid. The robustness of this approach therefore depends on the following:
- Accuracy of the equations from (1) to (5). This has been validated by numerous investigations (see, for example, [37,39,44,45,50,60]).
- Accuracy of (6). Horoshenkov [22] used this relationship to estimate the radius of glass beads based on known packing, obtaining an agreement of around 9%. This is equivalent to a 9% standard deviation of estimated pore radius.
- The assumed value σR = 0.02 for the Monte Carlo simulations. This is validated at f = 25 kHz through the measurements by Bradley et al. [67], as discussed in relation to Figure 11. At the lower frequencies proposed here, the pulse durations will not change, but the number of cycles per pulse will be around 13, 17, 21, 27, 34, 43, and 54 for the frequencies 4.5, 5.7, 7.1, 9, 11.3, 14.3, and 18 kHz, respectively. The resulting pulses will have well-defined shapes with at least 13 regression points if a Gaussian shape is fitted to the envelope. The possibility of more environmental acoustic noise at these lower frequencies should not present a problem because the -3 dB spectral width around each centre frequency is less than 500 Hz. This means that spectral filtering can effectively remove environmental noise.
- The assumption that the errors due to signal loss in sound passing through grass and roughness are small. The results from the experiments of Bradley and Ghimire [67] shown in Figure 2 and Figure 3 indicate that at f =25 kHz, pasture and surface roughness are not major obstacles. At higher biomass levels, some loss of reflected energy will occur [65] at a frequency of 25 kHz. However, the extent of scattering by either pasture swards or surface roughness is dependent on a scattering parameter such as kσh discussed in relation to Figure 3. At 25 kHz, it was found that kσh < 1 for the farmland sites described. From 4.5 to 18 kHz, the same sites would have a maximum kσh of 0.2–0.7, and the errors arising from these sources would be correspondingly smaller.
For pugging due to animal hoof prints, major scattering can be expected. In all these cases, the best operational strategy may be to detect scattering at each angle of incidence using the multiple microphones, and if scattered energy is more than a few percent of the incident energy, discard that data point [67]. With the three angles of incidence discussed here, there are six scattering angles at which measurements can be made (0°, 7.5°, 12.5°, 14°, 20°, and 25°), with three of these repeated starting at different speakers (7.5°, 12.5°, and 20°), giving a total of nine scattering measurements which can be made for each transmitted frequency. These allow for considerable scope for detecting roughness levels and soil surface anomalies, as described in [67].
These caveats do not appear to limit the scope and credibility of the new approach taken here. Of course, design of hardware and software generally also involves compromises, but data from previous work [56,65] indicates that the design should be practical. This is particularly true given the availability of a much wider range of transmitting and receiving devices in the audio spectrum compared with the ultrasonic region. The new methodology also lends itself much more to being controlled entirely from a mobile phone because the audio interfaces on modern phones have the requisite bandwidth and sampling rates. The ultimate goal is therefore a compact rigid array of speakers and microphones which can be mounted on a small farm vehicle such as a quad-bike, with data recorded on a mobile phone and able to be readily uploaded to a farm management system.
4.2. Operational Considerations
Bradley and Ghimire [56] give substantial details about the design of their ultrasonic system, and generally similar considerations apply for the multi-angle, multi-frequency system proposed here. Given an axial distance to the ground of 1 m and an angle of incidence of 12.5°, the half-width of the speaker/microphone assembly will be around 200 mm. Sound bursts from each speaker can be transmitted in sequence, but these bursts can be a composite of the seven pulses at 1/3-octave frequencies. The time sequence of these composite pulses will look rather “messy”, but the seven components can readily be separated in spectral space. The bursts will sound like short clicks and will not intrude on humans or livestock.
As discussed in Section 2.2, the sampling duration for one burst will be around 9 ms. Since there are three angles of incidence, the total time for sampling a single measurement would be around 27 ms. However, some averaging may also be necessary. As described in Section 3, the results from 16 bursts were averaged by Bradley et al. [67]. If this averaging was applied, a single measurement set would take around 432 ms. At a platform speed over the ground of 5 km h−1, the horizontal spacing between soil samples would be 600 mm. Since the acoustic beam angles would likely be only around 5°, this means that successive samples of soil structure will not overlap. Nevertheless, this sampling distance is likely to capture variations due to, for example, a section of lower lying ground or an area where stock have congregated.
5. Conclusions
Given the increasing pressures on productivity and challenges due to climate change, soil health is a major concern for agriculture. Reviewing the previous methods for estimating the physical properties of porous media shows that estimates of good accuracy can be obtained. In the context of assessing the physical health of agricultural soils in a rapid, non-contact, and in situ way, researchers need to measure the strength of sound reflected from the soil surface. There are many previous investigations which do this successfully at low audio frequencies, but these are generally limited to estimation of flow resistivity for outdoor sound propagation modelling. Bradley et al. [67] show that porosity and tortuosity can be estimated using reflected ultrasound from naturally rough and grassed pastureland, but these measurements do not provide estimates of pore size, which are desirable as a guide to the soil’s ability to provide good aeration and water flow.
The present work is targeted at providing the design elements for a configuration of speakers and microphones which can be practically used at low cost from, for example, a moving farm vehicle. The essence of this configuration is to not use separate ultrasonic and low-audio-frequency speakers and microphones, but to integrate the entire measurement system into transmissions of a burst from single speakers and reception via wide-band microphones. Such components and the requisite electronics are inexpensive and readily available.
The configuration described in the current work is shown to be potentially capable of obtaining estimates of the three central physical properties of soil: porosity, tortuosity, and pore size. But to do so has required an innovative approach in which the full viscous interaction between sound and soil is evaluated within a frequency band not generally accessible to such measurements. This has been achieved by expanding the expression for the reflection coefficient as a series of spectral terms using the infinite-frequency term to estimate porosity and tortuosity and the curvature term to estimate pore radius. The estimations are obtained via a very straight-forward pair of linear regressions.
Since this proposed measurement configuration is novel, it is essential that its potential first be evaluated by simulating performance under typical noisy conditions. In addition to developing the new approach, this numerical evaluation is the core of the present work.
Clearly the next steps are to construct a frame containing appropriate sensors and design accompanying electronics to then conduct tests in the laboratory, and eventually on soil at field sites. It is possible that first laboratory tests will be on artificial porous media for which the pore size is known (see, for example [87]).
Funding
This research received no external funding.
Data Availability Statement
The original contributions presented in this study are included in the article. Further inquiries can be directed to the corresponding author.
Acknowledgments
The author wishes to acknowledge the many fruitful and congenial conversations with and advice from Chandra Ghimire of SCION, New Zealand.
Conflicts of Interest
Author was employed by the company Inverse Acoustics Ltd. The author declares that the research was conducted in the absence of any commercial or financial relationships that could be construed as a potential conflict of interest.
Abbreviations
| Symbol | Description |
| a | A + BX |
| A | ϕ2/α∞ |
| b | Coefficient of f−2 in expansion |
| B | A(α∞ − 1)/α∞ |
| c | A(1 + X) |
| c0 | Speed of sound |
| d | −AX/α∞ |
| f | Acoustic frequency |
| fc | Critical frequency |
| flow | A frequency much lower than fc |
| fhigh | A frequency much higher than fc |
| G | Number of random realizations |
| k | Acoustic wavenumber |
| Ka | Bulk modulus of air |
| Ke | Effective bulk density of soil |
| L | Acoustic path length for reflection |
| m | Index of θ |
| M | Maximum value of m |
| n | Index of f |
| N | Maximum value of n |
| rpore | Characteristic pore radius |
| R | Plane wave reflection coefficient |
| |R| | Amplitude of R |
| s | “Soil” defined by a set of (ϕ, α∞, rpore) |
| u | Relative standard deviation of estimates |
| X | tan2θ |
| Y | (1 − |R|)2/(1 + |R|)2 |
| α∞ | Soil tortuosity |
| β | Bias in estimates |
| γ | iΩ/(1 + iΩ) |
| /ε | Fractional random noise in measurement |R| |
| η | Dynamic viscosity of air |
| θ | Angle of incidence |
| κ | Curvature of Y vs. Ω−2 |
| ρ0 | Air density |
| ρe | Equivalent soil density |
| σ | Flow resistivity |
| σh | Standard deviation of soil surface height |
| σR | Standard deviation of noise in measurement |R| |
| ϕ | Soil porosity |
| Ω | Normalized frequency |
References
- Doran, J.W.; Zeiss, M.R. Soil Health and Sustainability: Managing the Biotic Component of Soil Quality. Appl. Soil Ecol. 2000, 15, 3–11. [Google Scholar] [CrossRef]
- Lehmann, J.; Bossio, D.A.; Kögel-Knabner, I.; Rillig, M.C. The Concept and Future Prospects of Soil Health. Nat. Rev. Earth Environ. 2020, 1, 544–553. [Google Scholar] [CrossRef] [PubMed]
- Shahane, A.A.; Shivay, Y.S. Soil Health and Its Improvement Through Novel Agronomic and Innovative Approaches. Front. Agron. 2021, 3, 680456. [Google Scholar] [CrossRef]
- Ngo-Cong, D.; Antille, D.L.; Th. van Genuchten, M.; Nguyen, H.Q.; Tekeste, M.Z.; Baillie, C.P.; Godwin, R.J. A Modeling Framework to Quantify the Effects of Compaction on Soil Water Retention and Infiltration. Soil Sci. Soc. Am. J. 2021, 85, 1931–1945. [Google Scholar] [CrossRef]
- Reynolds, W.D.; Drury, C.F.; Tan, C.S.; Fox, C.A.; Yang, X.M. Use of Indicators and Pore Volume-Function Characteristics to Quantify Soil Physical Quality. Geoderma 2009, 152, 252–263. [Google Scholar] [CrossRef]
- Kuncoro, P.H.; Koga, K.; Satta, N.; Muto, Y. A Study on the Effect of Compaction on Transport Properties of Soil Gas and Water. II: Soil Pore Structure Indices. Soil Tillage Res. 2014, 143, 180–187. [Google Scholar] [CrossRef]
- Hu, W.; Drewry, J.; Beare, M.; Eger, A.; Müller, K. Compaction Induced Soil Structural Degradation Affects Productivity and Environmental Outcomes: A Review and New Zealand Case Study. Geoderma 2021, 395, 115035. [Google Scholar] [CrossRef]
- Drewry, J.J.; Cameron, K.C.; Buchan, G.D. Pasture Yield and Soil Physical Property Responses to Soil Compaction from Treading and Grazing—A Review. Soil Res. 2008, 46, 237–256. [Google Scholar] [CrossRef]
- Matthews, G.P.; Laudone, G.M.; Gregory, A.S.; Bird, N.R.A.; de G. Matthews, A.G.; Whalley, W.R. Measurement and Simulation of the Effect of Compaction on the Pore Structure and Saturated Hydraulic Conductivity of Grassland and Arable Soil. Water Resour. Res. 2010, 46, 1–13. [Google Scholar] [CrossRef]
- Alaoui, A.; Rogger, M.; Peth, S.; Blöschl, G. Does Soil Compaction Increase Floods? A Review. J. Hydrol. 2018, 557, 631–642. [Google Scholar] [CrossRef]
- Kopittke, P.M.; Menzies, N.W.; Wang, P.; McKenna, B.A.; Lombi, E. Soil and the Intensification of Agriculture for Global Food Security. Environ. Int. 2019, 132, 105078. [Google Scholar] [CrossRef]
- Teepe, R.; Brumme, R.; Beese, F.; Ludwig, B. Nitrous Oxide Emission and Methane Consumption Following Compaction of Forest Soils. Soil Sci. Soc. Am. J. 2004, 68, 605–611. [Google Scholar] [CrossRef]
- Cambi, M.; Certini, G.; Neri, F.; Marchi, E. The Impact of Heavy Traffic on Forest Soils: A Review. For. Ecol. Manag. 2015, 338, 124–138. [Google Scholar] [CrossRef]
- Bottinelli, N.; Hallaire, V.; Goutal, N.; Bonnaud, P.; Ranger, J. Impact of Heavy Traffic on Soil Macroporosity of Two Silty Forest Soils: Initial Effect and Short-Term Recovery. Geoderma 2014, 217, 10–17. [Google Scholar] [CrossRef]
- McKenzie, N.; Coughlan, K.; Cresswell, H. Soil Physical Measurement and Interpretation for Land Evaluation; CSIRO Publishing: Clayton, VIC, Australia, 2002; ISBN 978-0-643-06767-7. [Google Scholar]
- Zeng, Y. Coupled Dynamics in Soil: Understanding the Transport Mechanism of Liquid Water, Water Vapor, Dry Air and Heat by Field Experiments and Numerical Simulation. Ph.D. Thesis, University of Twente, Enschede, The Netherlands, 2012. [Google Scholar] [CrossRef]
- Zeng, Y.; Verhoef, A.; Vereecken, H.; Ben-Dor, E.; Veldkamp, T.; Shaw, L.; Wang, Y.; Su, Z.B. Tracking Soil Health: Monitoring and Modeling the Soil-Plant System. Authorea, 2024; preprints. [Google Scholar]
- Mateo-Marín, N.; Bosch-Serra, À.D.; Molina, M.G.; Poch, R.M. Impacts of Tillage and Nutrient Management on Soil Porosity Trends in Dryland Agriculture. Eur. J. Soil Sci. 2022, 73, e13139. [Google Scholar] [CrossRef]
- Leclaire, P. Characterization of Porous Absorbent Materials. In Proceedings of the Acoustics 2012, Nantes, France, 23–27 April 2012; Volume hal-00810634. [Google Scholar]
- Nimmo, J.R. Porosity and Pore Size Distribution. In Reference Module in Earth Systems and Environmental Sciences; Elsevier: Amsterdam, The Netherlands, 2013; p. B9780124095489052659. ISBN 978-0-12-409548-9. [Google Scholar]
- Ghajar, S.; Tracy, B. Proximal Sensing in Grasslands and Pastures. Agriculture 2021, 11, 740. [Google Scholar] [CrossRef]
- Horoshenkov, K.V. A Review of Acoustical Methods for Porous Material Characterisation. Int. J. Acoust. Vib. 2017, 22, 92–103. [Google Scholar] [CrossRef]
- Lucas, M.; Vetterlein, D.; Vogel, H.-J.; Schlüter, S. Revealing Pore Connectivity across Scales and Resolutions with X-Ray CT. Eur. J. Soil Sci. 2021, 72, 546–560. [Google Scholar] [CrossRef]
- Manns, H.R.; Jiang, Y.; Parkin, G. Soil Pores in Preferential Flow Terminology and Permeability Equations. Vadose Zone J. 2024, 23, e20365. [Google Scholar] [CrossRef]
- Oelze, M.L.; O’Brien, W.D.; Darmody, R.G. Measurement of Attenuation and Speed of Sound in Soils. Soil Sci. Soc. Am. J. 2002, 66, 9. [Google Scholar] [CrossRef]
- Luong, J.; Mercatoris, B.; Destain, M.-F. Measurement of the Open Porosity of Agricultural Soils with Acoustic Waves. In Proceedings of the EGU General Assembly 2015, Vienna, Austria, 12–17 April 2015; p. 5292. [Google Scholar]
- Matko, V. Porosity Determination by Using Two Stochastic Signals. Sens. Actuators A Phys. 2004, 112, 320–327. [Google Scholar] [CrossRef]
- Brown, N.; Melon, M.; Montembault, V.; Castagnede, B.; Lauriks, W.; Leclaire, P. Evaluation of the Viscous Characteristic Length of Air-Saturated Porous Materials from the Ultrasonic Dispersion Curve. Comptes Rendus De L’académie Des Sci. 1996, 322, 122–127. [Google Scholar]
- Attenborough, K.; Bashir, I.; Taherzadeh, S. Outdoor Ground Impedance Models. J. Acoust. Soc. Am. 2011, 129, 2806–2819. [Google Scholar] [CrossRef]
- Hansen, C.H.; Doolan, C.J.; Hansen, K.L. Wind Farm Noise: Measurement, Assessment. Available online: https://onlinelibrary.wiley.com/doi/book/10.1002/9781118826140 (accessed on 13 May 2023).
- Salomons, E.M. Computational Atmospheric Acoustics; Springer Science & Business Media: Berlin/Heidelberg, Germany, 2001; ISBN 978-1-4020-0390-5. [Google Scholar]
- Biot, M. Theory of Propagation of Elastic Waves in a Fluid-Saturated Porous Solid. I. Low-Frequency Range. J. Acoust. Soc. Am. 1956, 28, 168–178. [Google Scholar] [CrossRef]
- Biot, M.A. Theory of Propagation of Elastic Waves in a Fluid-saturated Porous Solid. II. Higher Frequency Range. J. Acoust. Soc. Am. 1956, 28, 179–191. [Google Scholar] [CrossRef]
- Pride, S.R.; Morgan, F.D.; Gangi, A.F. Drag Forces of Porous-Medium Acoustics. Phys. Rev. B 1993, 47, 4964–4978. [Google Scholar] [CrossRef]
- Leclaire, P.; Kelders, L.; Lauriks, W.; Melon, M.; Brown, N.; Castagnède, B. Determination of the Viscous and Thermal Characteristic Lengths of Plastic Foams by Ultrasonic Measurements in Helium and Air. J. Appl. Phys. 1996, 80, 2009–2012. [Google Scholar] [CrossRef]
- Corapcioglu, M.Y.; Tuncay, K. Chapter 5 Propagation of Waves in Porous Media. In Advances in Porous Media; Elsevier: Amsterdam, The Netherlands, 1996; Volume 3, pp. 361–440. ISBN 978-0-444-82500-1. [Google Scholar]
- Allard, J.-F.; Atalla, N. Propagation of Sound in Porous Media: Modelling Sound Absorbing Materials, 2nd ed.; Wiley: Hoboken, NJ, USA, 2009; ISBN 978-0-470-74661-5. [Google Scholar]
- Manor, O. Acoustic Flow in Porous Media. J. Fluid Mech. 2021, 920, A11. [Google Scholar] [CrossRef]
- Brennan, M.J.; To, W.M. Acoustic Properties of Rigid-Frame Porous Materials—An Engineering Perspective. Appl. Acoust. 2001, 62, 793–811. [Google Scholar] [CrossRef]
- Ghanbarian, B.; Hunt, A.G.; Ewing, R.P.; Sahimi, M. Tortuosity in Porous Media: A Critical Review. Soil Sci. Soc. Am. J. 2013, 77, 1461–1477. [Google Scholar] [CrossRef]
- Leclaire, P.; Horoshenkov, K.V.; Swift, M.J.; Hothersall, D.C. The Vibrational Response of a Clamped Retangular Porous Plate. J. Sound Vib. 2001, 247, 19–31. [Google Scholar] [CrossRef]
- Doutres, O.; Dauchez, N.; Génevaux, J.-M.; Dazel, O. Validity of the Limp Model for Porous Materials: A Criterion Based on the Biot Theory. J. Acoust. Soc. Am. 2007, 122, 2038–2048. [Google Scholar] [CrossRef]
- Fellah, Z.E.A.; Depollier, C. Transient Acoustic Wave Propagation in Rigid Porous Media: A Time-Domain Approach. J. Acoust. Soc. Am. 2000, 107, 683–688. [Google Scholar] [CrossRef]
- Panneton, R. Comments on the Limp Frame Equivalent Fluid Model for Porous Media. J. Acoust. Soc. Am. 2007, 122, EL217–EL222. [Google Scholar] [CrossRef]
- Umnova, O.; Attenborough, K.; Shin, H.-C.; Cummings, A. Deduction of Tortuosity and Porosity from Acoustic Reflection and Transmission Measurements on Thick Samples of Rigid-Porous Materials. Appl. Acoust. 2005, 66, 607–624. [Google Scholar] [CrossRef]
- Boeckx, L.; Leclaire, P.; Khurana, P.; Glorieux, C.; Lauriks, W.; Allard, J.F. Investigation of the Phase Velocities of Guided Acoustic Waves in Soft Porous Layers. J. Acoust. Soc. Am. 2005, 117, 545–554. [Google Scholar] [CrossRef] [PubMed]
- Červenka, M.; Bednařík, M.; Zieliński, T.G. Direct Numerical Simulation of Sound Absorption in Porous Media. In Proceedings of the Euronoise 2018, Heraklion, Greece, 27–31 May 2018; pp. 59–64. [Google Scholar]
- Prisutova, J.; Horoshenkov, K.; Groby, J.-P.; Brouard, B. A Method to Determine the Acoustic Reflection and Absorption Coefficients of Porous Media by Using Modal Dispersion in a Waveguide. J. Acoust. Soc. Am. 2014, 136, 2947–2958. [Google Scholar] [CrossRef]
- Fellah, Z.E.A.; Fellah, M.; Mitri, F.G.; Sebaa, N.; Depollier, C.; Lauriks, W. Measuring Permeability of Porous Materials at Low Frequency Range via Acoustic Transmitted Waves. Rev. Sci. Instrum. 2007, 78, 114902. [Google Scholar] [CrossRef] [PubMed]
- Fellah, Z.E.A.; Fellah, M.; Depollier, C.; Ogam, E.; Mitri, F.G. Ultrasound Measuring of Porosity in Porous Materials. In Porosity—Process, Technologies and Applications; Ghrib, T.H., Ed.; InTech: Rijeka, Croatia, 2018; ISBN 978-1-78923-042-0. [Google Scholar]
- Sadouki, M.; Fellah, M.; Fellah, Z.E.A.; Ogam, E.; Depollier, C. Determination of the Flow Resistivity and Thickness of Porous Materials with Rigid Frames via Transmitted Waves at Darcy’s Regime. In Proceedings of the 22ème Congrès Français de Mécanique, Lyon, France, 24–28 August 2015; p. 10. [Google Scholar]
- Fellah, Z.E.A.; Berger, S.; Lauriks, W.; Depollier, C.; Fellah, M. Measuring the Porosity of Porous Materials Having a Rigid Frame via Reflected Waves: A Time Domain Analysis with Fractional Derivatives. J. Appl. Phys. 2003, 93, 296–303. [Google Scholar] [CrossRef]
- Fellah, Z.E.A.; Mitri, F.G.; Depollier, C.; Berger, S.; Lauriks, W.; Chapelon, J.Y. Characterization of Porous Materials with a Rigid Frame via Reflected Waves. J. Appl. Phys. 2003, 94, 7914. [Google Scholar] [CrossRef]
- Fellah, Z.E.A.; Depollier, C.; Berger, S.; Lauriks, W.; Trompette, P.; Chapelon, J.-Y. Determination of Transport Parameters in Air-Saturated Porous Materials via Reflected Ultrasonic Waves. J. Acoust. Soc. Am. 2003, 114, 2561. [Google Scholar] [CrossRef]
- Horoshenkov, K.V.; Groby, J.-P.; Dazel, O. Asymptotic Limits of Some Models for Sound Propagation in Porous Media and the Assignment of the Pore Characteristic Lengths. J. Acoust. Soc. Am. 2016, 139, 2463–2474. [Google Scholar] [CrossRef] [PubMed]
- Bradley, S.; Ghimire, C. Design of an Ultrasound Sensing System for Estimation of the Porosity of Agricultural Soils. Sensors 2024, 24, 2266. [Google Scholar] [CrossRef] [PubMed]
- Fellah, Z.E.A.; Berger, S.; Lauriks, W.; Depollier, C.; Aristégui, C.; Chapelon, J.-Y. Measuring the Porosity and the Tortuosity of Porous Materials via Reflected Waves at Oblique Incidence. J. Acoust. Soc. Am. 2003, 113, 2424–2433. [Google Scholar] [CrossRef]
- Sebaa, N.; Fellah, Z.E.A.; Fellah, M.; Lauriks, W.; Depollier, C. Measuring Flow Resistivity of Porous Material via Acoustic Reflected Waves. J. Appl. Phys. 2005, 98, 084901. [Google Scholar] [CrossRef]
- Jaouen, L.; Renault, A.; Deverge, M. Elastic and Damping Characterizations of Acoustical Porous Materials: Available Experimental Methods and Applications to a Melamine Foam. Appl. Acoust. 2008, 69, 1129–1140. [Google Scholar] [CrossRef]
- Lieblappen, R.; Fegyveresi, J.M.; Courville, Z.; Albert, D.G. Using Ultrasonic Waves to Determine the Microstructure of Snow. Front. Earth Sci. 2020, 8, 34. [Google Scholar] [CrossRef]
- Pereira, M.; Carbajo, J.; Godinho, L.; Amado-Mendes, P.; Mateus, D.; Ramis, J. Acoustic Behavior of Porous Concrete. Characterization by Experimental and Inversion Methods. Mater. De Construcción 2019, 69, 202. [Google Scholar] [CrossRef]
- El Abassi, D.; Ibhi, A.; Faiz, B.; Aboudaoud, I. A Simple Method for the Determination of the Porosity and Tortuosity of Meteorites with Ultrasound. J. Geophys. Eng. 2013, 10, 055003. [Google Scholar] [CrossRef]
- Lagrain, B.; Boeckx, L.; Wilderjans, E.; Delcour, J.A.; Lauriks, W. Non-Contact Ultrasound Characterization of Bread Crumb: Application of the Biot–Allard Model. Food Res. Int. 2006, 39, 1067–1075. [Google Scholar] [CrossRef]
- Hawke, R.; McConchie, J. In Situ Measurement of Soil Moisture and Pore-Water Pressures in an ‘Incipient’ Landslide: Lake Tutira, New Zealand. J. Environ. Manag. 2011, 92, 266–274. [Google Scholar] [CrossRef]
- Legg, M.; Bradley, S. Ultrasonic Proximal Sensing of Pasture Biomass. Remote Sens. 2019, 11, 2459. [Google Scholar] [CrossRef]
- Romanova, A.; Horoshenkov, K.V.; Hurrell, A. An Application of a Parametric Transducer to Measure Acoustic Absorption of a Living Green Wall. Appl. Acoust. 2019, 145, 89–97. [Google Scholar] [CrossRef]
- Bradley, S.G.; Ghimire, C.; Taylor, A. Estimation of the Porosity of Agricultural Soils Using Non-Contact Ultrasound Sensing. Soil Adv. 2024, 1, 100003. [Google Scholar] [CrossRef]
- Sadouki, M. Experimental Measurement of the Porosity and the Viscous Tortuosity of Rigid Porous Material in Low Frequency. J. Low Freq. Noise Vib. Act. Control 2018, 37, 385–393. [Google Scholar] [CrossRef]
- Good, C.E. Acoustic Characterization of Grass-Cover Ground. Master’s Thesis, Department of Mechanical Engineering, School of Engineering, The Catholic University of America, Washington, DC, USA, 2014; 30p. [Google Scholar]
- Good, C.E.; Vignola, J.F.; Glean, A.A.; Judge, J.A.; Ryan, T.J.; Sunny, J.; Turo, D. Acoustical Characterization of Grass-Covered Ground. J. Acoust. Soc. Am. 2014, 135, 2289. [Google Scholar] [CrossRef]
- Kaźmierowski, C.; Ceglarek, J.; Królewicz, S.; Cierniewski, J.; Universityc, A.M.; Jasiewicz, J.; Wyczałek, M. Soil Surface Roughness Quantification Using DEM Obtained from UAV Photogrammetry. In Geomorphometry for Geosciences; Adam Mickiewicz University: Poznań, Poland, 2015. [Google Scholar] [CrossRef]
- Isakson, M.; Chotiros, N. Modeling Scattering from Rough Poroelastic Surfaces Using COMSOL Multiphysics; University of Texas at Austin: Austin, TX, USA, 2013. [Google Scholar]
- Thomsen, L.M.; Baartman, J.E.M.; Barneveld, R.J.; Starkloff, T.; Stolte, J. Soil Surface Roughness: Comparing Old and New Measuring Methods and Application in a Soil Erosion Model. Soil 2015, 1, 399–410. [Google Scholar] [CrossRef]
- Govers, G.; Takken, I.; Helming, K. Soil Roughness and Overland Flow. Agronomie 2000, 20, 131–146. [Google Scholar] [CrossRef]
- Krynkin, A.; Horoshenkov, K.V.; Van Renterghem, T. An Airborne Acoustic Method to Reconstruct a Dynamically Rough Flow Surface. J. Acoust. Soc. Am. 2016, 140, 2064–2073. [Google Scholar] [CrossRef]
- Oh, Y.; Stiles, J. Chapter IX. Surface Roughness Measurements. Hydrol. Data Rep. WASHITA ’92 1993, NAWQL 93-1, 27. [Google Scholar]
- Elfouhaily, T.M.; Guérin, C.-A. A Critical Survey of Approximate Scattering Wave Theories from Random Rough Surfaces. Waves Random Media 2004, 14, R1–R40. [Google Scholar] [CrossRef]
- Darmon, M.; Dorval, V.; Baqué, F. Acoustic Scattering Models from Rough Surfaces: A Brief Review and Recent Advances. Appl. Sci. 2020, 10, 8305. [Google Scholar] [CrossRef]
- Jaud, V.; Gervaise, C.; Stephan, Y.; Khenchaf, A. Modelling of High-Frequency Roughness Scattering from Various Rough Surfaces through the Small Slope Approximation of First Order. Open J. Acoust. 2012, 2, 1–11. [Google Scholar] [CrossRef]
- Jaud, V.; Sessarego, J.-P.; Gervaise, C.; Stephan, Y. High Frequency Roughness Scattering from Various Rough Surfaces: Theory and Laboratory Experiments. Open J. Acoust. 2012, 2, 50–59. [Google Scholar] [CrossRef]
- Broschat, S.L.; Thorsos, E.I. An Investigation of the Small Slope Approximation for Scattering from Rough Surfaces. Part II. Numerical Studies. J. Acoust. Soc. Am. 1997, 101, 2615–2625. [Google Scholar] [CrossRef]
- Jackson, D.; Olson, D.R. The Small-Slope Approximation for Layered, Fluid Seafloors. J. Acoust. Soc. Am. 2020, 147, 56–73. [Google Scholar] [CrossRef] [PubMed]
- Thorsos, E.I.; Broschat, S.L. An Investigation of the Small Slope Approximation for Scattering from Rough Surfaces. Part I. Theory. J. Acoust. Soc. Am. 1995, 97, 2082–2093. [Google Scholar] [CrossRef]
- Thorsos, E.I.; Broschat, S.L. The Lowest-order Small Slope Approximation for Rough Surface Scattering. J. Acoust. Soc. Am. 1998, 103, 3094. [Google Scholar] [CrossRef]
- Pinel, N.; Bourlier, C. Scattering from Very Rough Layers under the Geometric Optics Approximation: Further Investigation. J. Opt. Soc. Am. A 2008, 25, 1293. [Google Scholar] [CrossRef]
- Tang, K.; Buckius, R.O. The Geometric Optics Approximation for Reflection from Two-Dimensional Random Rough Surfaces. Int. J. Heat Mass Transf. 1998, 41, 2037–2047. [Google Scholar] [CrossRef]
- Arrieta-Escobar, J.A.; Derrien, D.; Ouvrard, S.; Asadollahi-Yazdi, E.; Hassan, A.; Boly, V.; Tinet, A.-J.; Dignac, M.-F. 3D Printing: An Emerging Opportunity for Soil Science. Geoderma 2020, 378, 114588. [Google Scholar] [CrossRef]
Disclaimer/Publisher’s Note: The statements, opinions and data contained in all publications are solely those of the individual author(s) and contributor(s) and not of MDPI and/or the editor(s). MDPI and/or the editor(s) disclaim responsibility for any injury to people or property resulting from any ideas, methods, instructions or products referred to in the content. |
© 2025 by the author. Licensee MDPI, Basel, Switzerland. This article is an open access article distributed under the terms and conditions of the Creative Commons Attribution (CC BY) license (https://creativecommons.org/licenses/by/4.0/).