Abstract
Paddy fields are a key agricultural ecosystem for achieving carbon neutrality in southern China, with significant potential to sequester carbon and mitigate emissions of CO2, CH4, and N2O. Film-covering is an emerging agricultural technique in rice production systems in China. This study evaluated the effects of degradable film coverings on greenhouse gas (GHG) emissions and rice yield. It provides an assessment of different mulching practices in paddy fields by employing controlled greenhouse experiments as well as field experiments. A key innovative aspect lies in the evaluation of not only different film types but also their varying thicknesses, a factor largely unexamined in previous studies. Greenhouse and field experiments were conducted using three thicknesses of biodegradable films (BMs; 0.01 mm, 0.015 mm, and 0.02 mm), one paper film (PM), and a non-film treatment (CK). Results showed that BM treatments reduced CO2 and CH4 emissions by more than 14.01% and 32.17%, respectively, compared with CK in the greenhouse experiment. Additionally, the film-covered treatment increased soil organic carbon content by 32.24–46.66% at rice maturity in the field experiment. These findings suggest that covering rice fields with 0.02 mm BM not only promotes ecological sustainability but also maintains grain yield. These findings provide a viable strategy for environmentally friendly rice production.
1. Introduction
Greenhouse gases (GHGs) absorb infrared radiation and trap heat, contributing to global warming [1]. The main GHGs—CO2, CH4, and N2O—account for approximately 80% of the greenhouse effect [2]. Reducing emissions, enhancing carbon sequestration, and achieving carbon neutrality are urgent challenges globally, including in China [3]. Rice, as a staple food for nearly half of the world’s population [4], is central to these efforts. Consequently, mitigating GHG emissions from paddy fields has become a priority in sustainable agriculture research.
Film-covering cultivation is a widely applied agronomic practice that offers multiple benefits: water conservation [5], improved soil temperature regulation, enhanced yield, and increased water use efficiency. It also suppresses weeds [6,7], reduces pest pressure, and lowers disease incidence [8], with applications extending to a wide range of crops [9,10,11]. Zeng et al. [12] found that the use of biodegradable film and polyethylene film can reduce weeds by over 67% compared to non-film control in taro fields.
Agricultural films are generally classified as polyethylene or degradable. Polyethylene films are effective but degrade into persistent microplastics that harm soil quality and crop production [13]. Their disposal by burning also releases harmful organic pollutants [14]. In contrast, degradable films, including biodegradable, paper-based, photodegradable, photo-biodegradable, and liquid films, are designed to break down more safely [15]. Biodegradable films, usually composed of starch and other natural polymers, are decomposed by microbes into CO2, water, and biomass in the field [16]. Paper films, made from plant fibers and starch, decomposed by microbes into CO2, water. By eliminating the need for retrieval and disposal, these films reduce labor costs and landfill waste, thus improving sustainability. However, their degradation rates are unpredictable and depend on environmental and material factors such as solar radiation, moisture, temperature, soil composition, film formulation, and microbial activity [17]. The addition of starch improves both the biodegradability and mechanical properties of paper films [18]. As paper films block light more effectively than polyethylene films, thereby inhibiting weed photosynthesis [19,20]. Studies have consistently shown that paper film is highly effective in suppressing weed growth [21,22]. For example, Cirujeda et al. [21] found that efficacy ranged between 80 and 100% for total weed control in paper mulched tomato fields.
Recent studies highlight the agronomic and environmental potential of degradable films. Hu et al. [23] found that 0.01 mm biodegradable film increased soil temperature, improved soil organic carbon content, and enhanced rice yield compared with non-film fields. Film-covering has also been shown to reduce GHG emissions significantly: Yao et al. [24] reported a 54% reduction in combined CH4 and N2O emissions using 0.005 mm polyethylene film compared with non-film field. A meta-analysis further indicated that plastic film mulching decreased CH4 emissions by 64.2% but raised N2O emissions by 23.9% in paddy fields [25]. However, research specifically evaluating the effects of degradable films on GHG emissions in paddy systems remains limited. To address these gaps, we conducted greenhouse and field experiments to quantify the effects of different biodegradable and paper films on GHG emissions and rice yield. This work aims to provide evidence for sustainable rice cultivation practices that balance ecological benefits with stable production.
2. Materials and Methods
2.1. Experimental Materials
The rice cultivar used was TN1. Three biodegradable films (width: 1.1 m; thickness: 0.01 mm, 0.015 mm, and 0.02 mm) were obtained from Hangzhou Hangshi Technology Development Co., Ltd. (Hangzhou, China), consisted of starch, polybutylene adipate co-terephthalate (PBAT), polylactic acid (PLA), glycerol, along with various processing aids. A paper-based mulch film (PM; width: 1.7 m; thickness: 0.95 mm) was provided by Heilongjiang Jiele Agricultural Technology Development Co., Ltd. (Harbin, China), consisted of plant fibers. Compound fertilizer (17-17-17 NPK; Hankerson Technology Co., Ltd. (Tianjin, China)) was applied in all experiments.
2.2. Greenhouse Experiment Design and Management
Greenhouse experiments were conducted in 2024 in Jinhua (119.63° E, 29.02° N) in a glass-enclosed solar greenhouse designed for rain- and pest-exclusion. Heat-resistant plastic pots (1 m × 1 m × 0.2 m) were filled with 10 cm of clay loam soil collected from a single field. Soil properties were: pH 5.35, organic matter 12.27 g·kg−1, total nitrogen 1.40 g·kg−1, total phosphorus 0.97 g·kg−1, available phosphorus 99.25 mg·kg−1, and available potassium 252.35 mg·kg−1. A basal application of 240 kg·ha−1 of 17-17-17 NPK was incorporated before planting.
Three biodegradable films were tested: 0.01 mm BM (A), 0.015 mm BM (B), and 0.02 mm BM (C), within the conventional agricultural range of 0.007–0.025 mm [26]. A non-film treatment served as the control (CK). Each treatment was replicated three times. Films were applied tightly on leveled soil surfaces. TN1 seedlings were transplanted 20 days after sowing at 20 cm × 20 cm spacing, with two plants per hill. Soil moisture was maintained at saturation with shallow water levels, and no pesticides were applied during the growing season.
2.3. Field Experiment Design and Management
Field trials were also conducted in Jinhua in 2024 (119.63° E, 29.02° N), located in the southern Yangtze River Delta. The clay loam soil had the following properties: pH 5.49, organic matter 6.57 g·kg−1, total nitrogen 0.80 g·kg−1, total phosphorus 0.49 g·kg−1, available phosphorus 61.17 mg·kg−1, and available potassium 277.79 mg·kg−1.
Following the method of Hu et al. [23], a non-mulched treatment was established as the control, while the mulched paddy fields were differentiated based on the type of film used. In field trial, five treatments were arranged in a randomized single-row design with four replicates: 0.01 mm BM (A), 0.015 mm BM (B), 0.02 mm BM (C), 0.95 mm PM (D), and CK. Each replicate plot measured 31.8 m2 (1.2 m × 26.5 m), separated by 0.3 m wide and 0.15 m deep furrows, with 1 m protective borders. Seedlings were transplanted 23 days after sowing at 20 cm × 20 cm spacing, with two plants per hill. Basal fertilizer (691.82 kg·ha−1 of 17-17-17 NPK) was applied, followed by topdressing with 314.47 kg·ha−1 at 18 days after transplanting. Water levels were maintained at soil saturation by consistent channel irrigation. No pesticides were used.
2.4. Sample Collection
2.4.1. Greenhouse Gas Sampling and Analysis
CO2, CH4, and N2O emissions were measured by the static chamber–gas chromatography method following to Li et al. [27]. This method, which measures surface GHG fluxes by analyzing chamber gas concentration changes, is widely used due to its affordability, ease of operation, and high sensitivity. In brief, the sampling system consisted of a stainless-steel base, a modular PVC chamber (50 × 50 × 50 cm) with extension sections for plant growth, a gas pump, and sampling bags. Before the first sampling, chamber bases were inserted ~15 cm into the soil at sites with uniform growth, ≥2 m from ridges. Debris was removed before sealing.
Gas analysis (0.1 L) was collected every 14 days between 08:00 and 12:00, with chamber temperature recorded. Analysis was performed using an Agilent 7890A GC. The gas samples were introduced via direct injection using a 1 mL loop, with the R2 threshold for the regression fit set at ≥0.99. CH4 quantified by FID with HP-molesieve capillary column (60 °C, detector 300 °C), and CO2 and N2O quantified by TCD with HP-Plot/Q column (60 °C, detector 250 °C). Hydrogen served as the detector gas (35 mL/min) and helium as the carrier gas (5 mL/min). Retention times were 2.673 min (CH4), 3.397 min (CO2), and 8.696 min (N2O).
2.4.2. Soil Sampling and Analysis
Soil samples (0–20 cm) were collected before transplanting and at harvest by the five-point composite method (200 g per plot). Samples were air-dried, cleared of residues, and analyzed for SOC using the potassium dichromate external heating method [28].
2.5. Rice Yield Determination
Representative 1 m2 quadrats were harvested manually from each treatment. Leaves and panicles were counted. Grains were threshed, cleaned, oven-dried at 60 °C for 8 h to constant weight, and weighed (t·ha−1). Aboveground biomass was also dried and weighed.
2.6. Data Processing and Analysis
GHG fluxes (F) were calculated as [29]:
where F (mg·m−2·h−1) is flux; is gas density (CH4: 0.714 kg·m−3; CO2: 1.97 kg·m−3; N2O: 1.25 kg·m−3); H is the chamber height (m); dc/dt is concentration change rate; T is chamber temperature (°C).
Cumulative emissions were estimated by the additive weighted method [29]:
where is emission (mg·m−2·d−1) at the k-th sampling and is days between sampling.
Global warming potential (GWP) was calculated as [30]:
GWP = CO2 + CH4 × 27 + N2O × 273
GWP (kg·ha−1) represents the cumulative climate forcing impact of all three gases. The conversion factors for CH4 and N2O, as reported in the IPCC Sixth Assessment Report [31], are 27 and 273, respectively, on a 100-year time horizon.
Greenhouse gas intensity (GHGI) was calculated as [30]:
where Yield is grain yield (kg·ha−1). The magnitude of GHGI reflects both ecological benefits for environmental sustainability and economic benefits for farmers.
A sensitivity analysis was conducted to assess the robustness of the GHGI results to the choice of GWP factors. The baseline analysis used 100-year GWP values from the IPCC Fourth Assessment Report (AR4: CH4 = 25, N2O = 298). For the sensitivity analysis, these were replaced with the updated 100-year values from the IPCC Sixth Assessment Report (AR6: CH4 = 27, N2O = 273) [31]. The GHGI (expressed in t·CO2-eq·t−1 yield) was recalculated accordingly, and the statistical analysis was repeated on the new dataset.
Statistical analysis was performed in SPSS 27.0 (IBM, Chicago, IL, USA). Data normality was tested by the Shapiro–Wilk test, and homogeneity by Levene’s test. Differences among treatments were assessed by one-way analysis of variance (ANOVA) followed by Duncan’s test (p < 0.05). ANOVA is applied given the satisfaction of the assumptions of normality and homogeneity of variances. Non-parametric tests were used for data that were not normally distributed, or for data exhibiting unequal variances with a non-significant Welch’s test result (p > 0.05). Figures were prepared in GraphPad Prism 10.
3. Results
3.1. Effects of Covering Practices on Greenhouse Gas Emissions and Rice Yield Under Greenhouse Conditions
3.1.1. CO2 Emissions
Across all treatments, CO2 fluxes showed a similar temporal trend, with an initial increase, a peak at the tillering stage, and a subsequent decline toward stabilization. Peak CO2 fluxes did not significantly differ between the control (5983.33 [5673.15, 6293.51]) and the 0.02 mm biodegradable mulch (BM) treatment (5006.67 [4342.23, 5671.11]) (df = 3, F = 0.875, p = 0.493). No significant differences were observed among treatments during the whole reproductive period (df = 3, F = 3.464, p = 0.071) (Figure 1a).

Figure 1.
Effects of different covering treatments on CO2 fluxes (a) and seasonal cumulative CO2 emissions (b) in greenhouse-grown rice. Values are mean ± standard error. Treatments A, B, C, and CK correspond to 0.01 mm, 0.015 mm, and 0.02 mm biodegradable films, and the non-film treatment, respectively. Different lowercase letters indicate significant differences (p < 0.05) among treatments as determined by Duncan’s test (n = 3). The same applies below.
Seasonal cumulative CO2 emissions varied across treatments. The 0.02 mm BM treatment (31,092.46 [29,613.30, 32,571.62]) reduced emissions by 14.01% compared with the control (36,158.27 [35,338.44, 36,978.10]), though differences between 0.015 mm (33,280.06 [32,070.79, 34,489.33]) and 0.02 mm (31,092.46 [29,613.30, 32,571.62]) BM were not significant. Likewise, 0.01 mm (34,574.68 [33,739.83, 35,409.53]) and 0.015 mm (33,280.06 [32,070.79, 34,489.33]) BM did not significantly reduce emissions relative to the control (df = 3, F = 3.655, p = 0.063) (Figure 1b).
3.1.2. CH4 Emissions
CH4 fluxes exhibited clear temporal dynamics, with bimodal peaks at the tillering and jointing stages in both the control and the 0.02 mm BM treatment. At the tillering stage, CH4 emissions did not differ significantly among treatments (df = 3, F = 2.597, p = 0.125). At the jointing stage, all BM treatments (0.01 mm BM treatment: 4.01 [3.73, 4.29]; 0.015 mm BM treatment: 2.65 [2.38, 2.92]; 0.02 mm BM treatment: 8.28 [6.94, 9.62]) significantly reduced fluxes compared with the control (15.03 [10.85, 19.21]) (df = 3, H = 9.974, p = 0.019). Over the whole reproductive period, the control (37.29 [35.49, 39.09]) showed significantly higher CH4 fluxes than all BM treatments (0.01 mm BM treatment: 20.37 [18.94, 21.8]; 0.015 mm BM treatment: 21.71 [20.37, 23.05]; 0.02 mm BM treatment: 26.32 [23.92, 28.72]) (df = 3, F = 18.411, p < 0.001) (Figure 2a).

Figure 2.
Effects of different covering treatments on CH4 fluxes (a) and seasonal cumulative CH4 emissions (b) in greenhouse-grown rice.
Cumulative seasonal CH4 emissions were reduced by 49.45%, 47.36%, and 32.17% under 0.01 mm (55.69 [51.07, 60.31]), 0.015 mm (59.03 [54.27, 63.79]), and 0.02 mm (76.06 [68.60, 83.52]) BM treatments, respectively, relative to the control (112.14 [106.54, 117.74]) (df = 3, F = 20.411, p < 0.001) (Figure 2b).
3.1.3. N2O Emissions
N2O fluxes showed comparable temporal patterns across treatments (Figure 3a). Seasonal cumulative N2O emissions were also not significantly different (df = 3, F = 0.744, p = 0.555) (Figure 3b).
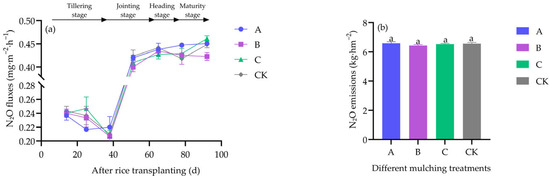
Figure 3.
Effects of different covering treatments on N2O fluxes (a) and seasonal cumulative N2O emissions (b) in greenhouse-grown rice.
3.1.4. Rice Yield and GHGI
The highest yield occurred in the 0.02 mm BM treatment (2.00 [1.93, 2.07]), but differences among treatments were not significant (df = 3, F = 0.478, p = 0.706), as well as leaf number, spike number, and aboveground biomass (leaves: df = 3, F = 2.163, p = 0.170; spikes: df = 3, F = 2.180, p = 0.168; biomass: df = 3, F = 0.753, p = 0.551) (Table 1).

Table 1.
Yield characteristics of greenhouse-grown rice under different covering treatments.
GWP and GHGI values did not significantly differ among treatments (GWP: df = 3, H = 7.513, p = 0.057; GHGI: df = 3, H = 3.154, p = 0.369) (Table 2).
Table 2.
GWP and GHGI of greenhouse-grown rice under different covering treatments.
3.1.5. SOC Content
Pre-experiment SOC was 12.3 ± 1.64 g·kg−1. At maturity, SOC levels did not differ significantly among treatments or compared with the baseline (13.27 [12.62, 13.92]) (df = 4, F = 0.969, p = 0.466). Similarly, no significant differences were observed between BM treatments and the control (df = 3, F = 1.258, p = 0.352) (Figure 4).
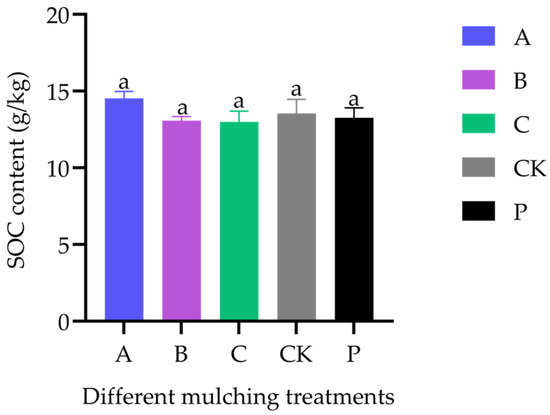
Figure 4.
SOC content at maturity in greenhouse-grown rice under different covering treatments (n = 3). Treatment P indicates the initial SOC content.
3.2. Effects of Covering Practices on Greenhouse Gas Emissions and Rice Yield Under Field Conditions
3.2.1. CO2 Emissions
CO2 fluxes under all treatments followed a unimodal trend with peaks at the tillering stage (Figure 5a). Seasonal cumulative CO2 emissions did not significantly differ among treatments (df = 4, F = 0.057, p = 0.993) (Figure 5b)
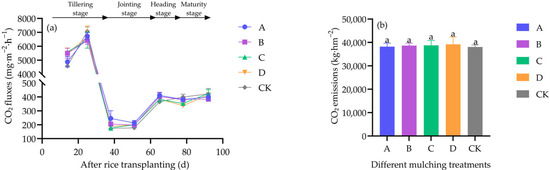
Figure 5.
Impact of different covering treatments on CO2 fluxes (a) and seasonal cumulative CO2 emissions (b) in field-grown rice. Values are mean ± standard error. Treatments A, B, and C represent biodegradable films of 0.01 mm, 0.015 mm, and 0.02 mm thickness, respectively; D is the 0.95 mm paper film; CK is the non-film treatment. Different lowercase letters indicate significant differences (p < 0.05) among treatments as determined by Duncan’s test (n = 4). The same applies below.
3.2.2. CH4 Emissions
CH4 fluxes also followed a unimodal pattern, peaking tillering stage. At this stage, CH4 emissions were not significantly reduced by film coverings compared with the control (df = 4, H = 2.529, p = 0.640) (Figure 6a). Seasonal cumulative emissions did not differ among treatments (df = 4, F = 0.032, p = 0.998) (Figure 6b).
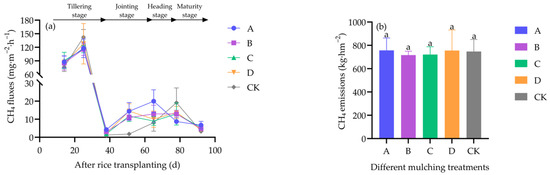
Figure 6.
Effects of different covering treatments on CH4 fluxes (a) and seasonal cumulative CH4 emissions (b) in field-grown rice.
3.2.3. N2O Emissions
N2O fluxes gradually increased across treatments but showed no significant differences (df = 4, F = 0.868, p = 0.505) (Figure 7a). Seasonal cumulative emissions were also not significantly different (df = 4, F = 0.609, p = 0.663) (Figure 7b).
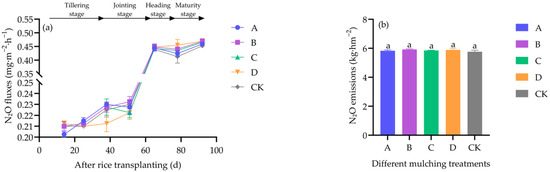
Figure 7.
Effects of different covering treatments on N2O fluxes (a) and seasonal cumulative N2O emissions (b) in field-grown rice.
3.2.4. Rice Yield and GHGI
Leaf number was significantly higher in the 0.015 mm (1033 [991.41, 1074.59]) and 0.02 mm (979 [932.48, 1025.52]) BM treatments compared with the control (803 [766.08, 839.92]) (df = 4, F = 3.802, p = 0.025). Spike number was also significantly higher in these treatments (0.015 mm BM treatment: 324 [312.12, 335.88]; 0.02 mm BM treatment: 312 [298.88, 325.12]) than in both the paper film (262 [247.64, 276.36]) and control (264 [250.17, 277.83]) treatments (df = 4, F = 3.797, p = 0.025). However, yield and aboveground biomass did not significantly differ (yield: df = 4, F = 1.114, p = 0.387; biomass: df = 4, F = 0.571, p = 0.688) (Table 3).
Table 3.
Yield characteristics of field-grown rice under different covering treatments.
Total GWP or GHGI did not significantly differ among treatments (GWP: df = 4, H = 0.286, p = 0.991; GHGI: df = 4, H = 4.471, p = 0.346) (Table 4).
Table 4.
GWP and GHGI values of field-grown rice under different covering treatments.
3.2.5. SOC Content
Initial SOC content in the field was 6.6 ± 0.41 g·kg−1. At maturity, SOC significantly increased under all mulched treatments relative to baseline (6.56 [6.15, 6.97]) (df = 5, F = 9.638, p < 0.001). SOC in all mulched treatments (0.01 mm BM treatment: 10.94 [0.99, 11.89]; 0.015 mm BM treatment: 10.09 [9.48, 10.70]; 0.02 mm BM treatment: 10.42 [9.93, 10.91]; paper film treatment: 10.68 [10.36, 11.00]) was also significantly higher than in the control (7.63 [7.53, 7.73]) (df = 4, F = 5.454, p = 0.006), with increases of 32.24–46.66%. However, no significant differences were found among the mulched treatments (df = 3, F = 0.323, p= 0.809) (Figure 8).
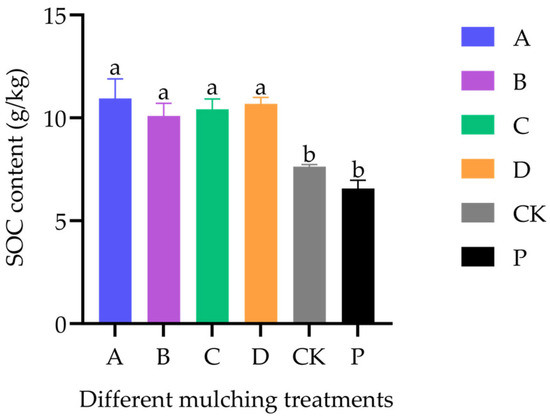
Figure 8.
SOC content at maturity in field-grown rice under different covering treatments (n = 4). Treatment P indicates the initial SOC content.
4. Discussion
Our results revealed consistent CO2 flux patterns in rice paddies under both greenhouse and field conditions (Figure 1a; Figure 5a). Across treatments, CO2 emissions followed a unimodal trend, peaking during the tillering stage when vigorous vegetative growth, elevated temperatures, and saturated soils create favorable conditions for root respiration, microbial activity, and anaerobic decomposition of organic matter. Under greenhouse conditions, the 0.02 mm BM treatment significantly reduced cumulative seasonal CO2 emissions compared to the control (Figure 1b). Similarly to Zhang et al. [6], we observed that mulching enhances photosynthesis while suppressing CO2 release. Film coverings preserve soil moisture and promote anaerobic conditions, thereby limiting aerobic respiration and lowering soil CO2 concentrations [32].
CH4 emissions are primarily regulated by anaerobic microbial decomposition of organic matter and the balance between methanogenic and methanotrophic microbes [33,34]. Prolonged flooding decreases soil oxygen and redox potential, stimulating methanogenesis, while improved aeration promotes methanotrophy and reduces CH4 output. Under field conditions, CH4 fluxes displayed a unimodal peak at the tillering stage (Figure 6a). In contrast, greenhouse conditions exhibited a bimodal pattern, with peaks at both the tillering and jointing stages (Figure 2a). This difference may reflect the higher SOC content in greenhouse soils (Figure 4), which supplied more substrate for methanogenesis. Between 25 and 38 days after transplanting, CH4 fluxes sharply declined under both greenhouse and field conditions, likely due to persistent high temperatures exceeding 30 °C and reduced rainfall [35]. While moderate warming increases CH4 emissions when ambient temperatures are below 30 °C, further warming above 30–34 °C suppresses fluxes [36,37]. We therefore infer that high ambient temperatures during our study reduced CH4 emissions. Because elevated CO2 can stimulate methanogenesis [38], the observed reduction in CO2 fluxes may also have contributed to lower CH4 output.
Cumulative CH4 emissions during the reproductive stage were consistently lower under BM treatments than under the control, with BM treatments showing the most significant reductions (Figure 2b). Previous work suggests that mulching improves soil aeration, raises early-season soil temperature, and promotes methanotroph proliferation, collectively reducing CH4 fluxes [39,40]. In addition, film coverings may slow CH4 diffusion, extending its residence time in the rhizosphere and increasing the oxidation potential. However, no significant difference in CH4 emissions was observed between the mulched treatments and the control in field experiment, a result consistent with the findings of Zhang et al. [41], who found similar emissions between rainfed and film-covered paddies. Moreover, the use of static chambers is subject to challenges such as pressure changes, temperature fluctuations, and potential gas leakage, which may influence the results.
N2O emissions in paddy soils result from nitrification, denitrification, and dissimilatory nitrate reduction, processes strongly influenced by soil oxygen availability [42,43]. Flooded paddies generally favor complete denitrification and minimize N2O release, but microaerobic zones can still generate notable emissions [44]. Film-covering improves soil aeration and moisture retention, creating conditions that factor incomplete denitrification and elevated N2O fluxes [43]. Across both greenhouse and field conditions, N2O fluxes increased between 38 and 65 days after transplanting and then stabilized (Figure 3a and Figure 7a). These dynamics likely reflect microbial responses to optimal moisture (>60%) and temperature ranges, which favor denitrification and enhance fluxes [35,45]. Additionally, iron plaques on rice roots may promote N2O emissions by shaping rhizosphere microbial communities [46], particularly by promoting bacteria involved in iron cycling and N2O production [47,48].
Film-covering also altered soil thermal regimes. By retaining solar heat and reducing energy loss, mulching increased nighttime soil temperatures [49], promoting root development, nutrient uptake, tillering, and biomass accumulation [6]. However, biodegradable film degradation may produce microplastic-like residues that impair nitrogen metabolism, reduce chlorophyll and Rubisco activity [50], and hinder photosynthesis and carbon fixation [13]. These opposing effects may explain why yields under mulching did not differ significantly from controls (Table 1 and Table 3), despite observed increases in leaf and spike numbers in 0.015 mm and 0.02 mm BM treatments (Table 3). While film-covering has been shown to promote dry matter accumulation and rice growth [51], in high-temperature environments excessive soil warming may suppress root vigor and reduce yield potential [51]. The final yield therefore represents the net result of these positive and negative influences.
In both experiments, the sensitivity analysis using AR6 GWP factors confirmed the robustness of our findings. While the absolute magnitude of the GHGI increased by approximately 0–8.1% across all treatments due primarily to the higher GWP for methane in AR6, the relative differences among the film-covering treatments remained statistically unchanged. The outcomes of the ANOVA and post hoc tests were identical to those of the baseline scenario, with the same treatments showing significant differences (p < 0.05). Therefore, the primary conclusion of this study—that certain mulching practices significantly alter the GHGI of paddy fields—is not sensitive to the choice of IPCC assessment report for GWP factors.
Our study focuses on GHG emissions from field activities, a single source in the lifecycle. The system boundary excludes upstream emissions from inputs such as films and fertilizers, a critical area for future work. Although our study and Li et al. [52] are based on biodegradable film mulching, they differ in research focus and experimental design. Li et al. [52] investigated the mechanisms of two kinds of biodegradable film (black and white) mulching combined with two water-saving irrigation (ridge irrigation and controlled irrigation) on soil hydrothermal conditions in cold-region paddy fields. We conducted greenhouse and field experiments to quantify the effects of different biodegradable and paper films on GHG emissions and rice yield. We acknowledge this limitation and confirm that data on water depth, soil temperature and redox potential were not collected. A key finding of this study was the positive impact of film-covering on soil health, demonstrated by a significant increase in SOC under field conditions (Figure 8). At maturity, SOC in all mulched treatments was significantly higher than both the control and the pre-experimental baseline. That means that biodegradable mulch is broken down by soil microbes, serving as a source of fertilizer or a soil amendment [25], and plant fibers of paper mulch possess the distinct advantage of promoting the proliferation of soil microorganisms [53]. However, no significant difference in SOC was observed among the treatments in greenhouse experiment. The apparent homogeneity in SOC dynamics across treatments may be due to the restricted root penetration imposed by the confined (<20 cm) pot soil profile. SOC is the foundation of soil fertility, improving soil structure and microbial activity, and contributing to long-term carbon sequestration. Soil NPK cycling mainly occurs in this surface layer containing residual film [54]. This result indicates that the use of both biodegradable and paper films can be an effective practice for enhancing carbon storage in paddy soils, contributing to climate change mitigation and long-term agricultural sustainability. Appropriate modification enables starch-based films to achieve greater strength and durability at reduced cost. By optimizing starch structures, advancing modification techniques, and utilizing agricultural waste, the physical properties and environmental adaptability of mulch films can be substantially enhanced, paving the way for green agriculture and plastic-free farming [18].
5. Conclusions
The application of 0.02 mm biodegradable film mulch represents a promising and sustainable strategy for rice cultivation. Film-covered paddy fields mitigate greenhouse gas emissions in greenhouse experiments, particularly CH4, and enhance soil organic carbon sequestration compared with the control while maintaining stable grain yields in the field experiment. By balancing key environmental benefits with consistent agronomic productivity, the 0.02 mm biodegradable mulch stands out as a viable option for environmentally friendly rice production. Future studies should be conducted under diverse climatic and soil conditions to confirm these benefits and facilitate broader adoption.
Author Contributions
Conceptualization, M.R. and P.Z.; methodology, M.R.; software, M.R., D.S. and J.S.; validation, M.R., X.H., D.S., J.S. and P.Z.; investigation, X.X.; resources, J.C. and Z.L.; data curation, M.R., X.H., D.S., J.S. X.X. and J.C.; writing—original draft preparation, M.R. and X.H.; writing—review and editing, Y.R. and P.Z.; visualization, M.R., X.H., D.S. and P.Z.; supervision, Z.L., Y.R. and P.Z.; funding acquisition, P.Z. All authors have read and agreed to the published version of the manuscript.
Funding
This research was funded by the National Key Research and Development Program, China (No. 2024YFD1400700 and 2023YFD1400800), the Zhejiang Collaborative Promotion Plan for Major Agricultural Technologies (No. 2023ZDXT01-5), the Key Research and Development Program of Jinhua, China (No. 2024-2-001).
Data Availability Statement
Data will be made available on request.
Conflicts of Interest
The authors declare that they have no known competing financial interests or personal relationships that could have appeared to influence the work reported in this paper.
Abbreviations
The following abbreviations are used in this manuscript:
| PM | Paper film |
| BM | Biodegradable film |
| CK | Non-film treatment |
| SOC | Soil organic carbon |
| GHG | Greenhouse gas |
| PBAT | polybutylene adipate co-terephthalate |
| PLA | polylactic acid |
| GHGI | Greenhouse gas intensity |
| GWP | Global warming potential |
| FID | Flame ionization detector |
| TCD | Thermal conductivity detector |
References
- Zhang, G.; Yang, Y.; Huang, Q.; Ma, J.; Yu, H.; Song, K.; Dong, Y.; Lv, S.; Xu, H. Reducing yield-scaled global warming potential and water use by rice plastic film mulching in a winter flooded paddy field. Eur. J. Agron. 2020, 114, 126007. [Google Scholar] [CrossRef]
- Zhang, Y.; Hu, C.; Zhang, J.; Dong, W.; Wang, Y.; Song, L. Research advances on sourch/sink intensities and greenhouse effects of CO2, CH4 and N2O in agricultural soils. Chin. J. Eco-Agric. 2011, 19, 966–975. (In Chinese) [Google Scholar] [CrossRef]
- Huang, W.; Wu, F.; Han, W.; Li, Q.; Han, Y.; Wang, G.; Feng, L.; Li, X.; Yang, B.; Lei, Y.; et al. Carbon footprint of cotton production in China: Composition, spatiotemporal changes and driving factors. Sci. Total Environ. 2022, 821, 153407. [Google Scholar] [CrossRef]
- Li, L.; Wang, Y.; Nie, L.; Ashraf, U.; Wang, Z.; Zhang, Z.; Wu, T.; Tian, H.; Hamoud, Y.A.; Tang, X.; et al. Deep placement of nitrogen fertilizer increases rice yield and energy production efficiency under different mechanical rice production systems. Field Crops Res. 2022, 276, 108359. [Google Scholar] [CrossRef]
- Fawibe, O.O.; Honda, K.; Taguchi, Y.; Park, S.; Isoda, A. Greenhouse gas emissions from rice field cultivation with drip irrigation and plastic film mulch. Nutr. Cycl. Agroecosyst. 2019, 113, 51–62. [Google Scholar] [CrossRef]
- Zhang, Y.; Zhu, K.; Tang, Y.; Feng, S. Rice cultivation under film mulching can improve soil environment and be beneficial for rice production in China. Rice Sci. 2024, 31, 545–555. [Google Scholar] [CrossRef]
- Gao, H.; Liu, Q.; Yan, C.; Wu, Q.; Gong, D.; He, W.; Liu, H.; Wang, J.; Mei, X. Mitigation of greenhouse gas emissions and improved yield by plastic mulching in rice production. Sci. Total Environ. 2023, 880, 162984. [Google Scholar] [CrossRef]
- Hu, G.; Zhu, D.; Xu, Y.; Chen, H.; Xiang, J.; Zhang, Y.; Zhang, Y. Research progress on rice cultivated by film mulching. J. Agric. Sci. Technol. 2019, 21, 163–170. (In Chinese) [Google Scholar] [CrossRef]
- Lee, J.G.; Cho, S.R.; Jeong, S.T.; Hwang, H.Y.; Kim, P.J. Different response of plastic film mulching on greenhouse gas intensity (GHGI) between chemical and organic fertilization in maize upland soil. Sci. Total Environ. 2019, 696, 133827. [Google Scholar] [CrossRef] [PubMed]
- Jia, Y.; Xu, Z.; Zhang, D.; Yang, W.; Ding, Y.; Li, C.; Gao, L.; Siddique, K.H.M.; Qu, Z. Effects of a single biochar application on soil carbon storage and water and fertilizer productivity of drip-irrigated, film-mulched maize production. Agronomy 2024, 14, 2028. [Google Scholar] [CrossRef]
- Zhang, X.; Bi, J.; Wang, W.; Sun, D.; Sun, H.; Bi, Q.; Wang, C.; Zhang, J.; Zhou, S.; Luo, L. Ecological and economic benefits of greenhouse gas emission reduction strategies in rice production: A case study of the southern rice propagation base in Hainan Province. Agronomy 2024, 14, 222. [Google Scholar] [CrossRef]
- Zeng, X.; Wang, L.; Ma, J.; Yin, J.; Guo, W.; Han, X.; Li, C.; Jiang, L.; Zhang, P. Effects of different types full biodegradation film on taro yield and soil environment. China Veg. 2022, 2, 88–94. (In Chinese) [Google Scholar] [CrossRef]
- Albarracín, M.; Dyner, L.; Giacomino, M.S.; Weisstaub, A.; Zuleta, A.; Drago, S.R. Modification of nutritional properties of whole rice flours (Oryza sativa L.) by soaking, germination, and extrusion. J. Food Biochem. 2019, 43, e12854. [Google Scholar] [CrossRef]
- Jayasekara, R.; Harding, I.; Bowater, I.; Lonergan, G. Biodegradability of a selected range of polymers and polymer bl-ends and standard methods for assessment of biodegradation. J. Polym. Environ. 2005, 13, 231–251. [Google Scholar] [CrossRef]
- Li, A.; Zhang, J.; Ren, S.; Zhang, Y.; Zhang, F. Research progress on preparation and field application of paper mulch. Environ. Technol. Innov. 2021, 24, 101949. [Google Scholar] [CrossRef]
- Bandopadhyay, S.; Martin-Closas, L.; Pelacho, A.M.; DeBruyn, J.M. Biodegradable plastic mulch films: Impacts on soil microbial communities and ecosystem functions. Front. Microbiol. 2018, 9, 819. [Google Scholar] [CrossRef]
- Ryu, Y.; Bouharras, F.E.; Cha, M.; Mudondo, J.; Kim, Y.; Ramakrishnan, S.R.; Shin, S.; Yu, Y.; Lee, W.; Park, J.; et al. Recent advancements in the evolution, production, and degradation of biodegradable mulch films: A review. Environ. Res. 2025, 277, 121629. [Google Scholar] [CrossRef]
- Wang, M.; Li, W.; Zhao, F.; Deng, S.; Li, T.; Wu, X.; Mu, Y.; Yang, K.; Zhang, A.; Yang, X. A review on the application of starch in biodegradable mulch films. Int. J. Biol. Macromol. 2025, 320, 145915. [Google Scholar] [CrossRef] [PubMed]
- Claramunt, J.; Mas, M.T.; Pardo, G.; Cirujeda, A.; Verdu, A.M.C. Mechanical characterization of blends containing recycled paper pulp and other lignocellulosic materials to develop hydromulches for weed control. Biosyst. Eng. 2020, 191, 35–47. [Google Scholar] [CrossRef]
- Wang, T.; Liu, Y.; Su, Z.; Hao, Y.; Li, X.; Ji, M.; Peng, S.; Wang, S.; Li, F.; Zhang, C. Porous biodegradable biomass c-omposites based on cationic starch and plant fibers. Int. J. Biol. Macromol. 2025, 318, 144714. [Google Scholar] [CrossRef]
- Cirujeda, A.; Anzalone, A.; Aibar, J.; Moreno, M.M.; Zaragoza, C. Purple nutsedge (Cyperus rotundus L.) control with paper mulch in processing tomato. Crop Prot. 2012, 39, 66–71. [Google Scholar] [CrossRef]
- Sánchez, E.; Lamont, W.J., Jr.; Orzolek, M.D. Newspaper mulches for suppressing weeds for organic high-tunnel cucumber production. HortTechnology 2008, 18, 154–157. [Google Scholar] [CrossRef]
- Hu, G.; Wang, J.; Wang, Y.; Zhu, D.; Chen, H.; Xiang, J.; Zhang, Y.; Zhang, Y. Effect of biodegradable film mulching on greenhouse gas emission and yield of rice (Oryza sativa L.). Ecol. Environ. Sci. 2020, 29, 977–986. [Google Scholar] [CrossRef]
- Yao, Z.; Zheng, X.; Liu, C.; Lin, S.; Zuo, Q.; Butterbach-Bahl, K. Improving rice production sustainability by reducing water demand and greenhouse gas emissions with biodegradable films. Sci. Rep. 2017, 7, 39855. [Google Scholar] [CrossRef] [PubMed]
- Yu, Y.; Zhang, Y.; Xiao, M.; Zhao, C.; Yao, H. A meta-analysis of film mulching cultivation effects on soil organic carbon and soil greenhouse gas fluxes. Catena 2021, 206, 105483. [Google Scholar] [CrossRef]
- Guo, H.; Yu, X.; Jin, W.; He, N.; Guo, W. Establishment of prediction model for tensile mechanics of plastic film and prediction of film thickness. J. Chin. Agric. Mech. 2020, 41, 173–178. (In Chinese) [Google Scholar] [CrossRef]
- Li, M.; Peng, J.; Lu, Z.; Zhu, P. Research progress on carbon sources and sinks of farmland ecosystems. Resour. Environ. Sust. 2023, 11, 100099. [Google Scholar] [CrossRef]
- Sun, Y.; Mi, W.; Su, L.; Shan, Y.; Wu, L. Controlled-release fertilizer enhances rice grain yield and N recovery efficiency in continuous non-flooding plastic film mulching cultivation system. Field Crops Res. 2019, 231, 122–129. [Google Scholar] [CrossRef]
- Chen, X.; Yang, W.; Jiang, B.; Yin, H.; Yang, X.; Yang, S.; Ma, Y. Characteristic variations of N2O flux in winter wheat field under different tillage methods. Agric. Res. Arid Areas 2016, 34, 221–227. (In Chinese) [Google Scholar] [CrossRef]
- Li, J.; Qin, B.; Lan, C.; Xu, H.; Zou, J.; Zhang, B.; Fang, C.; Zhang, Z.; Chen, H.; Lin, W. Rhizosphere microecological mechanism of carbon sequestration and its emission mitigation in rice ratooning. Agr. Ecosyst. Environ. 2025, 381, 109406. [Google Scholar] [CrossRef]
- Forster, P.; Storelvmo, T.; Armour, K.; Collins, W.; Dufresne, J.-L.; Frame, D.; Lunt, D.J.; Mauritsen, T.; Palmer, M.D.; Watanabe, M.; et al. The Earth’s Energy Budget, Climate Feedbacks, and Climate Sensitivity. In Climate Change 2021: The Physical Science Basis. Contribution of Working Group I to the Sixth Assessment Report of the Intergovernmental Panel on Climate Change; Masson-Delmotte, V., Zhai, P., Pirani, A., Connors, S.L., Péan, C., Berger, S., Caud, N., Chen, Y., Goldfarb, L., Gomis, M.I., et al., Eds.; Cambridge University Press: Cambridge, UK; New York, NY, USA, 2021; pp. 923–1054. [Google Scholar] [CrossRef]
- Islam, S.F.; van Groenigen, J.W.; Sander, B.O.; de Neergaard, A. The effective mitigation of greenhouse gas emissions from rice paddies without compromising yield by early-season drainage. Sci. Total Environ. 2018, 612, 1329–1339. [Google Scholar] [CrossRef]
- Zhou, X.; Smaill, S.J.; Gu, X.; Clinton, P.W. Manipulation of soil methane oxidation under drought stress. Sci. Total Environ. 2021, 757, 144089. [Google Scholar] [CrossRef] [PubMed]
- Conrad, R. Microbial ecology of methanogens and methanotrophs. Adv. Agron. 2007, 96, 1–63. [Google Scholar] [CrossRef]
- Rabha, J.; Devi, S.P.; Das, S.; Kumar, A.; Jha, D.K. Chapter 18—Diversity and functional role of ammonia-oxidizing bacteria in soil microcosms. In Development in Wastewater Treatment Research and Processes; Shah, M.P., Rodriguez-Couto, S., Eds.; Elsevier: Amsterdam, The Netherlands, 2022; pp. 371–392. [Google Scholar] [CrossRef]
- Gaihre, Y.K.; Wassmann, R.; Villegas-Pangga, G.; Sanabria, J.; Aquino, E.; Sta Cruz, P.C.; Paningbatan, E.P., Jr. Effects of increased temperatures and rice straw incorporation on methane and nitrous oxide emissions in a greenhouse experiment with rice. Eur. J. Soil. Sci. 2016, 67, 868–880. [Google Scholar] [CrossRef]
- Raseduzzaman, M.; Gaudel, G.; Ali, M.R.; Timilsina, A.; Bizimana, F.; Aluoch, S.O.; Li, X.; Zhang, Y.; Hu, C. Cereal-legume mixed residue addition increases yield and reduces soil greenhouse gas emissions from fertilized winter wheat in the North China Plain. Agronomy 2024, 14, 1167–1191. [Google Scholar] [CrossRef]
- Wang, Y.; Hu, Z.; Gu, B.; Xing, J.; Liu, C.; Liu, T.; Zhao, S.; Zhang, X.; Zhu, L.; Xu, Z. Role of methanogenesis and methanotrophy in CH4 fluxes from rice paddies under elevated CO2 concentration and elevated temperature. Sci. Total Environ. 2024, 951, 175466. [Google Scholar] [CrossRef]
- Song, K.; Zhang, G.; Yu, H.; Huang, Q.; Zhu, X.; Wang, T.; Xu, H.; Lv, S.; Ma, J. Evaluation of methane and nitrous oxide emissions in a three-year case study on single rice and ratoon rice paddy fields. J. Clean. Prod. 2021, 297, 126650. [Google Scholar] [CrossRef]
- Zhao, L.; Xu, Y.; Zhang, X.; Peng, S.; Li, C.; Wang, J.; Zhang, Y. Effects of different plastic mulchin-g on soil temperature and rice growth. J. Water Resour. Archit. Eng. 2020, 18, 15–19. (In Chinese) [Google Scholar] [CrossRef]
- Zhang, G.; Ma, J.; Yang, Y.; Yu, H.; Song, K.; Dong, Y.; Lv, S.; Xu, H. Achieving low methane and nitrous oxide emissions with high economic incomes in a rice-based cropping system. Agric. For. Meteorol. 2018, 259, 95–106. [Google Scholar] [CrossRef]
- Yao, Z.; Zheng, X.; Wang, R.; Liu, C.; Lin, S.; Butterbach-Bahl, K. Benefits of integrated nutrient management on N2O and NO mitigations in water-saving ground cover rice roduction systems. Sci. Total Environ. 2019, 646, 1155–1163. [Google Scholar] [CrossRef]
- Xiong, J.; Ye, T.; Sun, K.; Gao, Y.; Chen, H.; Xiang, J.; Wang, Y.; Wang, Z.; Zhang, Y.; Zhang, Y. Greenhouse gas emissions and bacterial community structure as influenced by biodegradable film mulching in Eastern China. Agronomy 2023, 13, 1535. [Google Scholar] [CrossRef]
- Zou, J.; Huang, Y.; Zheng, X.; Wang, Y. Quantifying direct N2O emissions in paddy fields during rice growing seaso-n in mainland China: Dependence on water regime. Atmos. Environ. 2007, 41, 8030–8042. [Google Scholar] [CrossRef]
- Wang, H.; Yan, Z.; Ju, X.; Song, X.; Zhang, J.; Li, S.; Zhu-Barker, X. Quantifying nitrous oxide production rates from nitrification and denitrification under various moisture conditions in agricultural soils: Laboratory study and literature synthesis. Front. Microbiol. 2023, 13, 1110151. [Google Scholar] [CrossRef]
- Liu, T.; Qin, S.; Pang, Y.; Yao, J.; Zhao, X.; Clough, T.; Wrage-Moennig, N.; Zhou, S. Rice root Fe plaque enhances paddy soil N2O emissions via Fe (II) oxidation-coupled denitrification. Soil Biol. Biochem. 2019, 139, 107610. [Google Scholar] [CrossRef]
- Carlson, H.K.; Clark, I.C.; Melnyk, R.A.; Coates, J.D. Toward a mechanistic understanding of anaerobic nitrate-dependent iron oxidation: Balancing electron uptake and detoxification. Front. Microbiol. 2012, 3, 57. [Google Scholar] [CrossRef] [PubMed]
- Ding, L.; An, X.; Li, S.; Zhang, G.; Zhu, Y. Nitrogen loss through anaerobic ammonium oxidation coupled to iron reduction from paddy soils in a chronosequence. Environ. Sci. Technol. 2014, 48, 10641–10647. [Google Scholar] [CrossRef]
- Liu, M.; Lin, S.; Dannenmann, M.; Tao, Y.; Saiz, G.; Zuo, Q.; Sippel, S.; Wei, J.; Cao, J.; Cai, X.; et al. Do water-saving ground cover rice production systems increase grain yields at regional scales? Field Crops Res. 2013, 150, 19–28. [Google Scholar] [CrossRef]
- Fu, F.; Long, B.; Huang, Q.; Li, J.; Zhou, W.; Yang, C. Integrated effects of residual plastic films on soil-rhizosphere microbe-plant ecosystem. J. Hazard. Mater. 2023, 445, 130420. [Google Scholar] [CrossRef]
- Zhang, Z.; Zhang, S.; Yang, J.; Zhang, J. Yield, grain quality and water use efficiency of rice under non-flooded mulching cultivation. Field Crops Res. 2008, 108, 71–81. [Google Scholar] [CrossRef]
- Li, J.; He, Y.; Liu, J.; Wang, Y.; Guo, Y.; Lu, Y. Effects of biodegradable film mulching and water-saving irrigation on soil moisture and temperature in paddy fields of the black soil region. Agriculture 2025, 15, 1956. [Google Scholar] [CrossRef]
- Han, Y.; Chen, H. A review on the studies and applications of mulching paper. J. Agric. Mech. Res. 2008, 12, 244–246. (In Chinese) [Google Scholar]
- Yang, Z.; Ma, H.; Sun, C.; Jia, H.; Wu, X.; Ma, X.; Shan, N. Effects of residual plastic film on cotton yield and soil health in arid areas of Xinjiang Province, China. Appl. Ecol. Environ. Res. 2025, 23, 4921–4936. (In Chinese) [Google Scholar] [CrossRef]
Disclaimer/Publisher’s Note: The statements, opinions and data contained in all publications are solely those of the individual author(s) and contributor(s) and not of MDPI and/or the editor(s). MDPI and/or the editor(s) disclaim responsibility for any injury to people or property resulting from any ideas, methods, instructions or products referred to in the content. |
© 2025 by the authors. Licensee MDPI, Basel, Switzerland. This article is an open access article distributed under the terms and conditions of the Creative Commons Attribution (CC BY) license (https://creativecommons.org/licenses/by/4.0/).