Article

Green Manuring Reduces Agronomic Indicators of Fodder Winter Barley Regardless of Fertilization Type

1
Department of Microbiology and Environmental Biotechnologies, Agricultural University—Plovdiv, 12 Mendeleev Str., 4000 Plovdiv, Bulgaria
2
Department of General Agriculture and Herbology, Agricultural University—Plovdiv, 12 Mendeleev Str., 4000 Plovdiv, Bulgaria
3
Department of Agrochemistry and Soil Science, Agricultural University—Plovdiv, 12 Mendeleev Str., 4000 Plovdiv, Bulgaria
4
Institute of Agriculture, Warsaw University of Life Sciences, 166 Nowoursynowska Str., 02-787 Warsaw, Poland
5
Department of Crop Science, Agricultural University—Plovdiv, 12 Mendeleev Str., 4000 Plovdiv, Bulgaria
*
Author to whom correspondence should be addressed.
Agriculture 2025, 15(20), 2145; https://doi.org/10.3390/agriculture15202145
Submission received: 13 September 2025 / Revised: 8 October 2025 / Accepted: 11 October 2025 / Published: 15 October 2025

Abstract

Due to the intensive cultivation of various crops, the surface soil layer is depleted. This leads to a decrease in fertility, losses of organic matter and nutrients, and an overall decrease in soil health. We aimed to investigate the role of green manure application and organic fertilization on winter fodder barley (Hordeum vulgare L., Zemela cult.) in terms of agronomic and soil parameters. The cultivation was carried out in two fields, the predecessors of which were oats–vetch green manure (field 1) or fallow (field 2). In each field, five treatments were prepared: a control without fertilization, mineral fertilization, vermicompost, mineral fertilizer + vermicompost, and biochar. The green manure incorporation led to a decrease in grain yield of barley by 10.8–20.0% depending on the treatment. A similar tendency was observed for the rest of the studied agronomic parameters (thousand-grain mass, hectolitre weight, ear number, plants per hectare). Additionally, the vermicompost application had the most substantial effect, accounting for a 20.1% increase compared to the control, while the smallest was expressed by biochar—1.6%. Nevertheless, the photosynthesis intensity was higher in treatments after green manure. The microbiome’s activity was boosted in the vermicompost treatments, while amino acids, carboxylic acids, and polymers were the most fully metabolised compounds by the soil communities. In conclusion, the type of predecessor influenced mainly grain protein, carotenoids, and chlorophyll contents, as well as microbial activities, respiration, and dehydrogenase, while the fertilization impacted primarily on soil water and organic content, total soil N, and photosynthetic pigments of barley plants.

1. Introduction

Scientists are constantly faced with the question of feeding the growing population. Their focus is mainly on cereal crops, which have enormous potential for feeding humans and animals. Barley is one of the cereal crops that form the so-called integral food commodity and contributes significantly to the population’s nutrition [1]. Barley is important for food and feed security worldwide as its consumption provides important compounds for human health, such as proteins, minerals, carbohydrates, lipids, vitamins, etc. [2]. The world production of barley was about 155 million tons in 2022 and has remained stable over the past few decades [3]. Besides applying genetic and breeding approaches to increase barley production, agronomic management strategies are important and may even be environmentally friendly and sustainable. Agronomic practices are essential for maintaining and increasing the production of cereal crops, especially barley. Fertilization affects growth, development, and yield, but also influences the soil microbiome as fertilizers are mainly applied to the soil. Essential elements like nitrogen, phosphorus, potassium, and other micronutrients are of primary importance. They could be supplied as mineral or organic, but their benefits for the plant and soil differ. The application of mineral fertilizers reaches plant roots very rapidly. They take it up, but there is a danger of leaching into groundwater and aquifers, contamination, soil acidification, or ammonia volatilization [4].
Applying green manure to the soil has been an agricultural practice for many years. Lately, it has gained renewed attention because of environmental concerns related to agriculture. Green manuring is the incorporation of crops into the upper soil layer for soil enrichment with organic matter and nutrients. Such crops are most often legumes grown in corresponding soil, but other species are also studied as green manures, among others (oats, rye, barley, oilseed rape) [5]. This management practice is known to enhance soil fertility, improve soil structure, and increase soil organic C content [6], which is important for sustainable plant production. The legumes are known to accumulate nitrogen with the support of soil microbial symbiotic diazotrophs. Their application as green manure could largely replace the mineral inputs influencing soil productivity [5,7]. Green manure decomposition is done by soil microorganisms (ammonifiers and nitrifiers), which increase inorganic N concentrations and immobilization in the short term [8,9]. Subsequently, the mid-term effects result in stabilized microbial transformation activity, maintaining the net positive nutrient balance. The decomposition rate depends mostly on the C:N ratio, where lower values strongly boost the mineralization, while higher ones decrease it [10,11]. Soil enzymes have many more positive effects, such as enhancing the soil microbial community’s richness and diversity, suppressing soil-borne pathogens, and improving plant health [6].
On the other hand, many soils suffer from low organic content and a lack of nutrients, which could be due to nutrient leaching [12,13]. Incorporating organic matter into the soil would have several positive effects, such as increasing total organic C, improving the retention of water and nutrients, and enhancing structure, although with a slow nutrient release [14]. Adding organic matter to the topsoil is also considered a circular bioeconomy approach, which is fundamental in the EU’s strategy to protect the climate and environment [15]. The effect is even greater when the organic amendment is produced from organic residues, such as agricultural and farm wastes. Composts and vermicomposts are organic products obtained after recycling agriwastes at a low cost. In contrast, the resulting product is rich in nutrients, presenting many properties to improve soil health and sustain plant productivity [16,17]. Thus, some authors reported an increased grain yield of barley ranging from over sixty to four hundred percent after adding vermicompost, which has additional benefits such as nutrient supply and organic matter [18]. Another organic-rich amendment produced from argillaceous wastes is biochar, which results from the pyrolysis. It is carbon-rich, retains water, improves soil structure, and enriches the soil [19,20]. Its application can increase plant fitness through diverse tools, including soil nutrient release or retention within its structure. In addition, biochar has been reported to ameliorate GHG emissions [21]. Compost (including vermicompost) and biochar are widely used today as soil improvers, fertilizers, and amendments with different names. They can have a mid-term effect on soil quality and health through the effects already mentioned and some others. Their application in the upper soil layer activates the soil microbiome as they are a source of nutrients and energy. The organic amendments are essential because they release different compounds and minerals that are used by microorganisms and plants [5,10,14,15,22].
Among the physiological reasons that have a major impact on the yield of grain crops, the content of photosynthetic pigments in leaves is of great importance [23,24]. In situ monitoring of the variation in chlorophyll gives information about the stress, yield, and grain quality prediction in the context of precision agriculture [25]. The newest fully expanded leaf is more likely to represent plant nutrient status, since N can be remobilized from old leaves to new leaves [26]. Plant and soil microbiomes are crucial for plant and soil health [15]. The structure and state of microbial communities in the microbiomes contribute to optimal plant nutrition and protection against disease, supporting ecosystem functioning [22]. Thus, the microbiome is shaped by the amendments’ composition and structure, agricultural management practices, type of plant, etc. [27]. On the other hand, mineral fertilizers differ in their impact on soil microbiome in the mid-term and long-term, changing community composition and supporting the development of chemolithotrophic communities in a chemoheterotrophic state. However, other authors have reported a reduction in microbial diversity and abundance [28,29]. Biochar could strongly stimulate microbial production of enzymes related to the breakdown of glucoside bonds in organic matter and the degradation of cellulose, lignin, and other organic compounds [30]. Our hypothesis was that the organic incorporation into the upper soil would improve barley development and yield and shape soil microbial communities. Therefore, the objective of the investigation was to determine the effect of green manure as a predecessor and the type of fertilization on barley agronomic parameters, soil, and microbial properties. We expect to gain further insights into the role of these important factors in the soil–microbiota–barley system.

2. Materials and Methods

2.1. Field Description

The field experiment took place at the training and experimental field of the Agricultural University of Plovdiv, where the soils are alluvial-meadow (42°08′15.4″ N 24°48′16.4″ E), located in the Thracian–Strandja region. They originate from sandy-loam and sandy-gravel deposits. According to the FAO International Classification, they are classified as Mollic Fluvisols. Their formation is based on alluvial deposits with a well-developed humus-accumulative horizon, passing into the C horizon, while the gleization process is observed below 100 cm (A-C-G profile). The humus content is usually not high—no more than 1–2%. The field has been used for decades for research and educational agronomic activities.

2.2. Experimental Design and Soil Amendments

The experiment was conducted in two fields that differed only by the predecessor crop. The winter fodder barley (Hordeum vulgare L., Zemela cultivar) was sown at the beginning of November 2023 at a seed density of 160 kg/ha in both fields, while the harvest took place in the beginning of July. Field 1 was sown after a predecessor oats–vetch mixture that was ploughed into the soil as green manure in the ripening phase (end of June), while field 2 was sown after leaving the land without crops (fallow land). Each field consisted of five treatments, as shown in Table 1. The fields were organized in four rows (four replicates) with five plots (treatments) per row. Each plot covered an area of 4 m × 8.75 m = 35 m2 and was randomly positioned within the corresponding field as a completely randomized block (Figure S1). There was an separation distance of 1 m between rows and 0.5 m between plots within a row. In addition to these distances, an external guard of 2 m was provided.
The amendments were mixed into the upper soil layer (0–30 cm) before sowing through a cultivator. Ammonium nitrate (NH4NO3, 34.4% N, Agropolyhim AD, Devnya, Bulgaria) in a concentration of 50 kg/ha of nitrogen was applied at the tillering stage in all treatments.
The amendments were produced as follows: wheat straw and cow manure were applied in proportions 70%:30% (w:w) to produce vermicompost. The same recycling possessed two phases—three months of composting, followed by vermicomposting. After the active composting phase, the resulting fresh compost was subjected to earthworm populations of Eisenia fetida and Lumbricus rubellus. The final product was sieved through a 5 mm sieve. The process was carried out at the Bulver EOOD site in Kalekovets village, Plovdiv District, under the guidance of the Agricultural University of Plovdiv.
The biochar from oats was kindly produced and provided by the ConnectFarms project partner SGGW (Institute of Agriculture, Warsaw University of Life Sciences, Poland). It was produced by oats biomass that was pyrolyzed at 600 °C. The biochar was then composted and pelletized.
The methodology of physicochemical analysis of the vermicompost is explained in detail previously [31]. The determination of biochar characteristics was conducted using commonly used methods [32]. The Kjeldahl method was used to determine the nitrogen content. The total organic C was analyzed with a CHNS Vario Macro Cube analyzer (Elmentar Americas Inc., Ronkonkoma, NY, USA). In general, two grams of biochar were burnt in a muffle furnace for 5 h, followed by the addition of five milliliters of ten percent HCl and evaporation. The vanadomolybdate method is used to determine phosphorus content (ISO 6878:2004). The ICP was applied to analyze the rest of the elements. The physicochemical properties of biochar and vermicompost are presented in Table 2.
The seeding was not irrigated and depended solely on precipitation during the vegetation period (Figure 1).

2.3. Soil and Plant Analyses

2.3.1. Soil Analysis

One hundred grams of soil were taken from the soil layer 0–20 cm after removing the top 5 cm. The procedure was conducted twice—before fertilization and sowing, and during the grain formation of barley (rhizosphere soil during BBCH 75: medium to late milk). The samples were taken randomly from each plot, dried, and sieved (2 mm).
Soil acidity (pH) and electrical conductivity (EC) were determined in distilled water (1:5, w/v) and mixed. The result was annotated using an EC–pH meter InoLab Multi 9620 IDS (WTW, Weilheim, Germany) following sedimentation [33,34].
The bioavailable N (N-NH4 and N-NO3) was analyzed using 1% KCl. A 20 g portion of fresh soil (equivalent to dry weight) was placed in a 250 mL flask, and 100 mL of 1% KCl was added, followed by 1 h of shaking at 120 rpm and subsequent filtration. The 50 mL filtrate was blended with 10 mL of 40% NaOH in a distillation flask of the Distillation unit K-355 (Buchi Corp., Flawil, Switzerland), together with 5 mL of (OH)3. A total of 50 mL of the distillate was mixed with 25 mL of 10% FeSO4 and 5 mL of 0.5% Ag2SO4 as a catalyst. The distillation was carried out in another receiver flask containing 10 mL of 4% H3BO3 and 1–2 drops of mixed indicator. The first distillate containing N-NH4 and the second containing N-NO3 were titrated with 0.02 N H2SO4 until the blue-colored solution turned faint pink. A blank sample containing only KCl was processed in parallel [35,36].
To extract available forms of P, 0.04 N Ca–lactate buffered with HCl was used. A 2 g portion of soil was treated with 100 mL of 0.04 N Ca–lactate solutions, shaken for 90 min at 120 rpm, and filtered. A total of 10 mL of filtrate was placed in a 100 mL flask, followed by the addition of 10 mL of 0.1 N N2SO4 (p.a., 96–97%, Fluka, Buchs, Switzerland), 10 mL of (NH4)2MoO4 solution (p.a., 99%, Fluka), and distilled water to a final volume of 100 mL, and finally five drops of SnCl2 (p.a. 98%, Sigma Aldrich, Buchs, Switzerland) as a reductant. After the appearance of a blue coloration, the optical density was determined at 700 nm. A standard curve was used to quantify the P2O5 content (colorimetric method) [31].
Bioavailable potassium was extracted with 25 mL 1 N HCl from 1 g of dried soil. After 24 h of agitation at twenty degrees the solution was filtered and rinsed till a hundred milliliters using d.H2O followed by determination at PFP-7 flame photometer (Jenway Industries Co., Ltd., Pinner, UK) [32].
The total organic C content in soil was determined using K2Cr2O7. A total of 400 mL of sample was mixed with 5 mL of solution and 7 mL of H2SO4. The mixture was heated at 130 °C for 25 min. A total of 50 mL of distilled water was added, and the mixture was cooled and brought to 100 mL. The determination was performed using a spectrophotometer at 585 nm [37].

2.3.2. Grain Analysis

Twenty grams of seeds were dried at 60 °C for 96 h and milled. Half a gram of the milled grains was digested with concentrated H2SO4 (p.a., 96–97%, Fluka, Buchs, Switzerland) and H2O2 oxidants in a digester at 400 °C until complete mineralization, and then diluted with distilled water to 250 mL. The total N concentration was analyzed using the Kjeldahl method in the Parnassuss–Wagner apparatus [38]. The total phosphorus (TP) content was assessed calorimetrically using a spectrophotometer M105 (Camspec Ltd., Leeds, WY, UK) at a wavelength of 700 nm. To prepare the solution, 2 mL of digested plant material was transferred into a 100 mL volumetric flask, followed by 10 mL of 0.1 N H2SO4 (p.a., 96–97%, Fluka), 10 mL of 2% ammonium molybdate solution (p.a., 99%, Fluka), and SnCl2 (p.a. 98%, Sigma Aldrich, Buchs, Switzerland) as a reductant. The total potassium (TK) concentration was determined using a PFP-7 photometer. The grain protein concentration was calculated from total nitrogen content using a conversion factor of 5.83, according to the FAO [39].

2.4. Photosynthesis and Transpiration

Photosynthetic pigment concentration was measured immediately after sampling (BBCH 75: medium to late milk) [40,41]. About 20 leaves from five plants per experimental variant were collected and immediately transported to the laboratory. A 0.1 g portion of plant material (fresh weight) from each representative sample was ground in a porcelain mortar. Pigment extraction was carried out by adding 10 mL of 90% acetone [42,43]. After filtration, the absorbance was measured using a spectrophotometer (CamSpec M108, CamSpec M108, Leeds, West Yorkshire, UK) at a wavelength of 440.5 nm for carotenoids, 662 nm for chlorophyll a, and 644 nm for chlorophyll b [44]. All analyses were performed in triplicate. Chlorophyll a, chlorophyll b, total chlorophyll, and carotenoid contents were calculated for each sample and expressed as mg g−1 fresh weight [45].
The intensity of photosynthesis and transpiration rate of the experimental plants were measured using a portable photosynthetic system Q-box CO650 (Quibit Systems Inc., Kingston, ON, Canada). Physiological measurements of each plant were performed on three fully developed, undamaged leaves of the same physiological age, with at least 50 readings taken per leaf. During the measurements, the temperature and relative humidity inside the leaf chamber were monitored. To track leaf photosynthetic rate, the leaves were induced with a saturation light intensity of 1000 μmol quanta/m2/s; the reference CO2 concentration was also monitored [46]. The data acquisition time for each measurement was 3 min. The intensity of photosynthesis (A, μmol m−2 s−1), stomatal conductance (Gs, μmol m−2 s−1), and intensity of transpiration (E, μmol m−2 s−1) were monitored, and the results are presented as arithmetic mean ± SD.

2.5. Soil Microorganisms

Soil rhizosphere samples for microbiological activity analysis were collected at BBCH 75: medium to late milk.

2.5.1. Microbial Respiration and Dehydrogenase Activity

Basal soil respiration (BR) was studied using 50 g of dry soil equivalent in a closed jar with a small cup containing 20 mL of 50 mM sodium hydroxide. After 24 h, 1 mL of barium dichloride was added to precipitate the carbonates. A few drops of phenolphthalein were added as a pH indicator. The remaining sodium hydroxide was titrated with 50 mM hydrochloric acid. All samples were prepared in quadruplicate [47].
The dehydrogenase enzymatic activity was estimated using the method of Thalmann [48], modified by Alef [49]. The principle of the method is to reduce triphenyl tetrazolium chloride (TTC) to triphenyl formazan (TPF) by microbes. A total of 5 g of moist soil was mixed with 5 mL of 0.35% TTC solution. The soil was incubated for 24 h at 30 °C, then acetone was added, and the sample was incubated for an additional hour in the dark. The optical density was measured at 546 nm.

2.5.2. Community-Level Physiological Profiling (CLPP)

The metabolic diversity of soil microbial communities was studied using Ecoplate® (Biolog Inc., Hayward, CA, USA). A total of 5 g of fresh rhizosphere soil was dispersed in 45 mL of distilled water, stirred for 20 min, and allowed to settle for 10 min. The inoculation of ecoplates was realized with 150 μL using a multichannel pipette, followed by incubation at 25 °C. The absorbance of each well was measured on BiologTM MicroStation® reader (Biolog Inc., Hayward, CA, USA) at wavelengths of 590 nm and 750 nm on a 24 h basis for 144 h. The obtained data were normalized, and the carbon sources were grouped by their nature as amino acids (AA), amines and amides (A), carboxylic acids (CA), polymers (P), carbohydrates (CH), and phenolic compounds (PC) [50].
The average well color development (AWCD) was assessed every 24 h using the following formula:
A W C D = C B / n
where C is the optical density (OD) in the well, B is the blank well reading, and n is the total number of C sources. The parameter represents the overall community performance through the diverse carbon-source utilization capacity.

2.6. Statistical Analysis

Four replicates were used for the statistical analyses. The analysis of variance (ANOVA) was conducted using Statistix 10.0 for all parameters at a probability level of p ≤ 0.05. The least significant difference (LSD) test was applied to find out the significance of differences between mean values of the studied parameters. In order to assess the impact of each factor on the studied parameters, the PCA analysis was conducted (Statistika 7.0). First, we identified the principal components of the dataset that contained most of the information on the assessed parameters. During the PCA process, we aimed to maximize the variance of a linear combination of the variables in the dataset. The values of principal components were calculated based on the values of each individual parameter, and the impact of each factor was assessed by the weighted sum of different principal component values.

3. Results

3.1. Agronomic Parameters

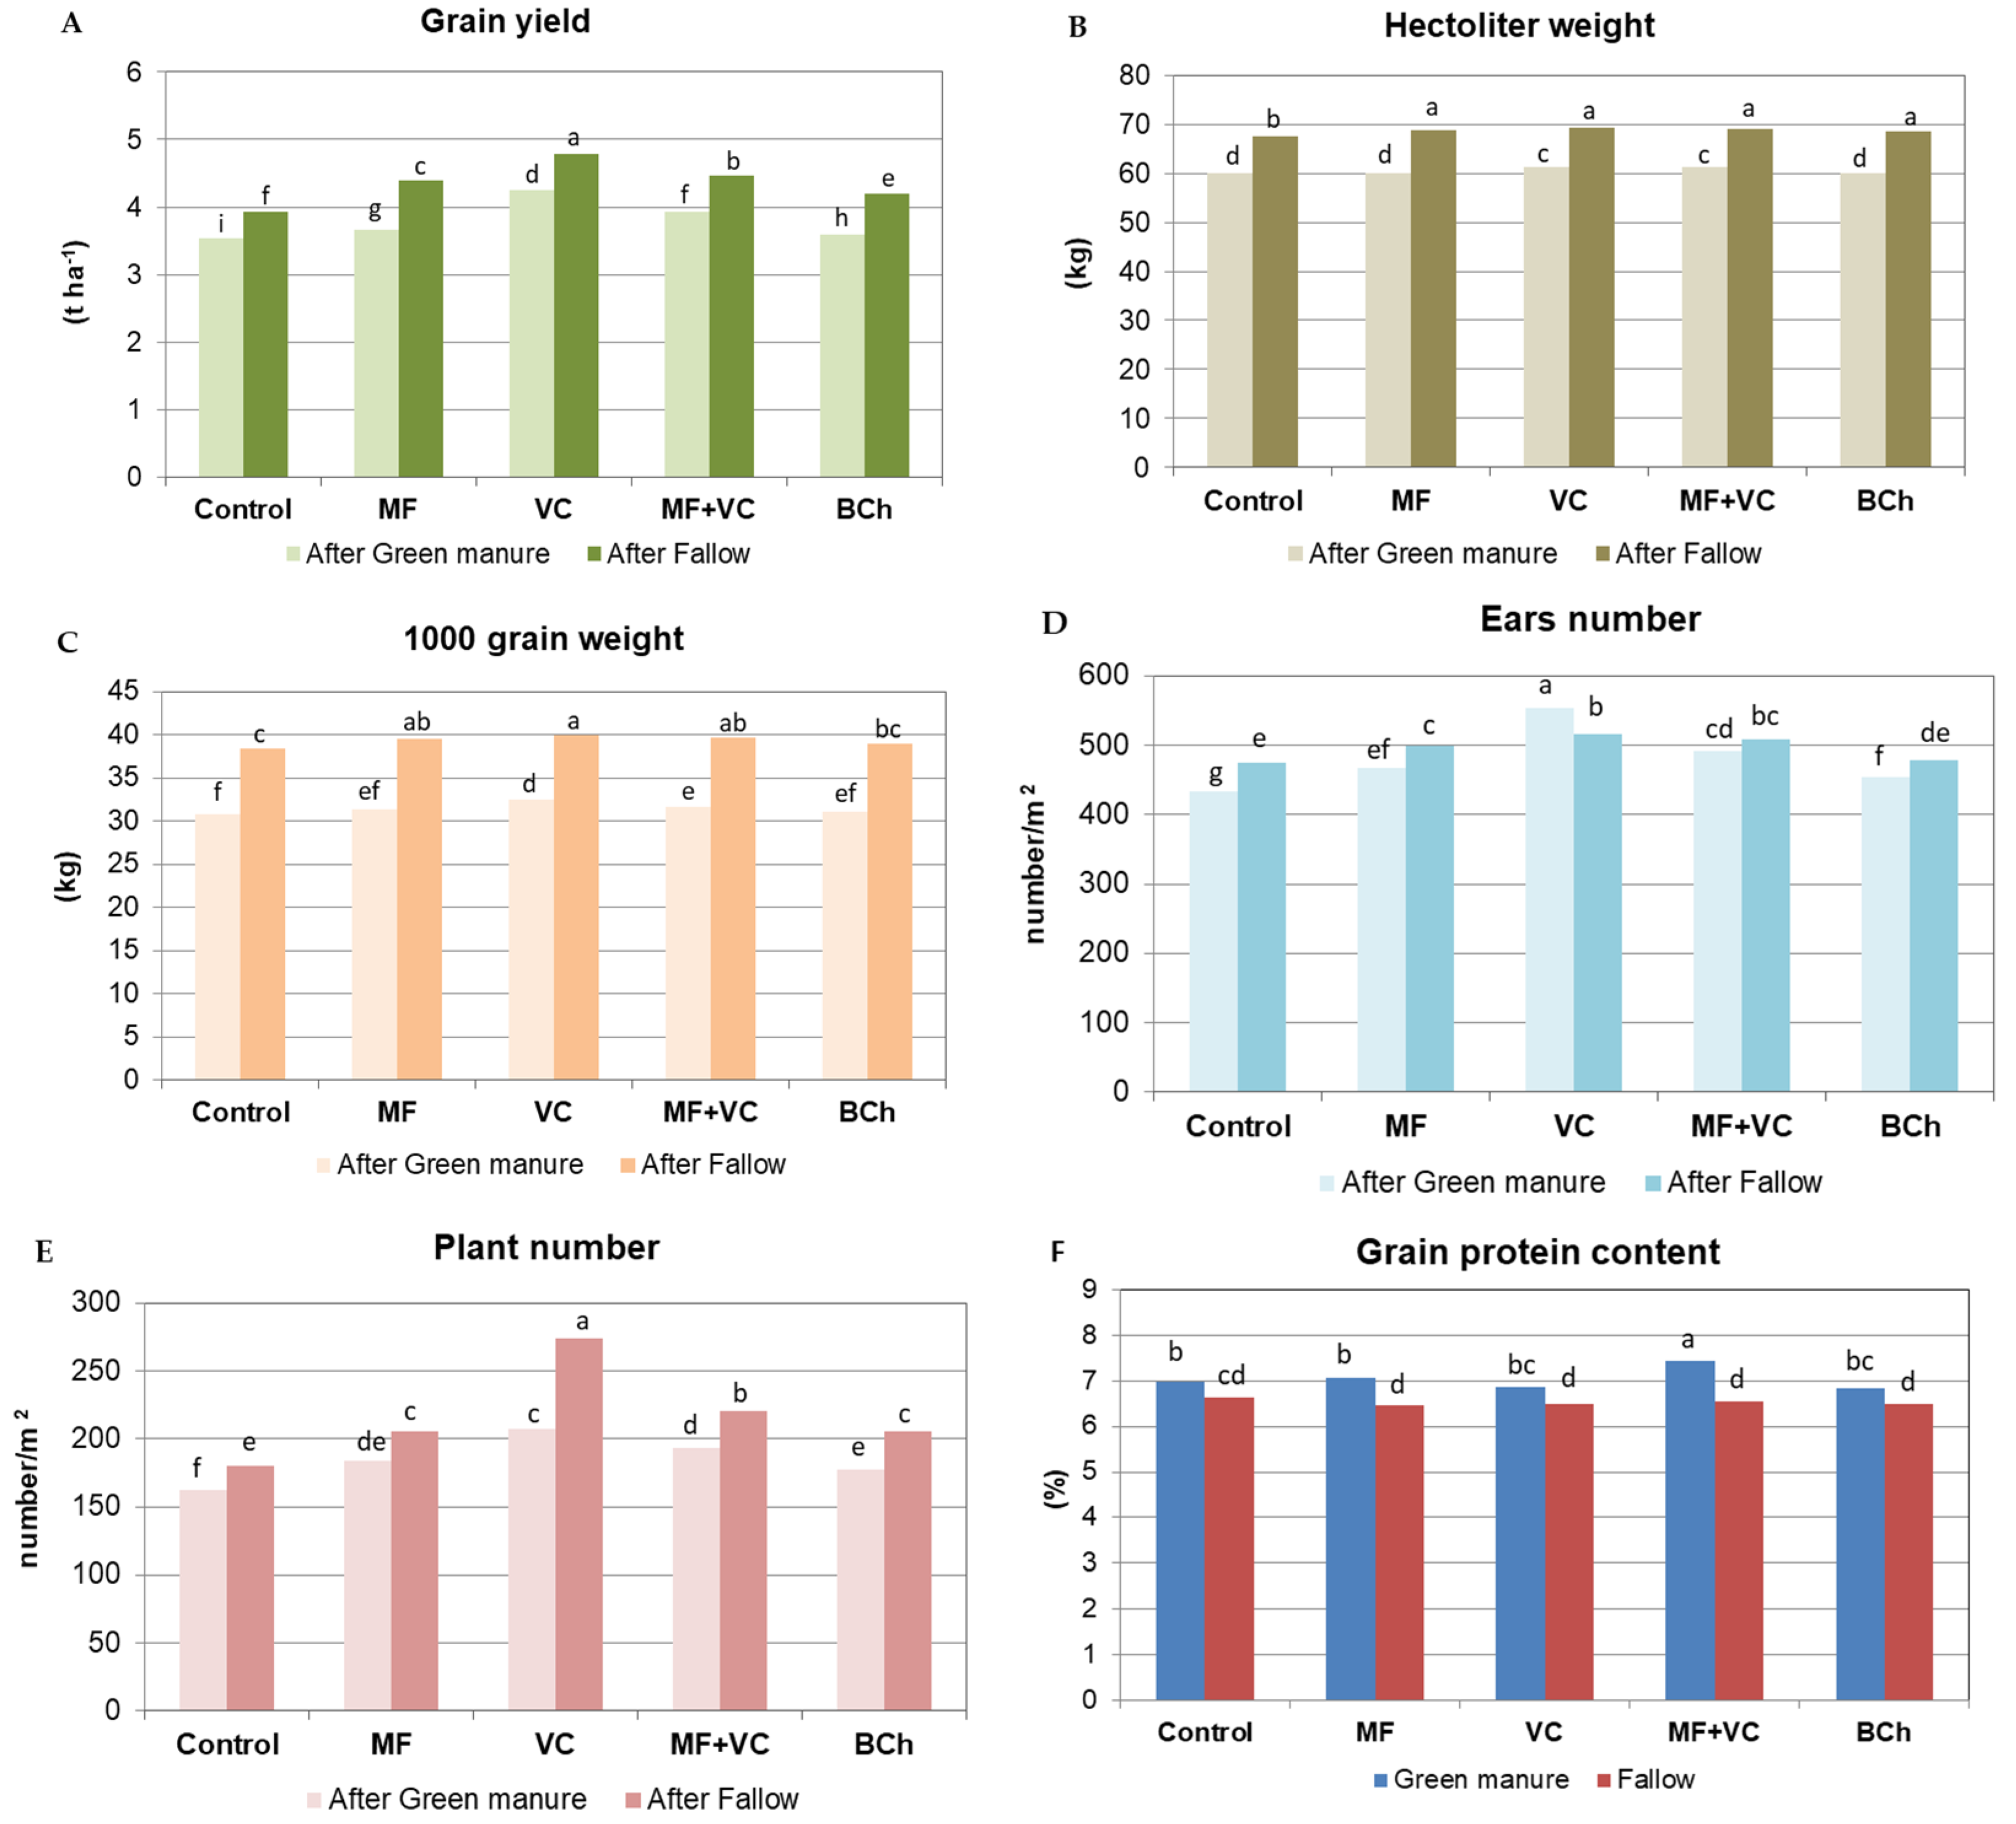
Grain yield was affected by both variables, the predecessor type and the amendment type (Figure 2A). The oats–vetch intercropping followed by green manure resulted in a statistically proven decrease in the grain yield of fodder barley compared to the yield of barley grown after fallow land. The yield reduction was found between 10.8% (control) and 20.0% (MF). In case of VC, MF+VC, and BCh, the reduction was 12.7%, 13.6%, and 16.7%, respectively. The difference in yield production between the two fields was consistent, and the type of amendment did not influence it significantly.
On the other hand, the amendment type affected grain production considerably in both fields, and the differences were statistically significant. In the field with green manure incorporation, the highest yield was produced under the VC treatment. It was 20.1% more than the control, where the lowest yield was recorded. MF contributed to a 3.6% increase in yield, while in the combined treatment (MF+VC), the yield increased by 10.8%. BCh increased the barley yield by only 1.6% compared with the control. In the fallow field, the highest yield was also found in the VC treatment, followed by combined, MF, BCh, and control, but the difference from the control and the rest of the treatments was higher (7–22.2%).
The hectoliter weight (HLW) was increased in all treatments in the fallow field compared to the green manure field (Figure 2B). The increase among treatments was in the range between 12.6% and 14.6%. The factor amendment had a negligible influence on HLW. In the first field (green manure), a small increment was observed in VC and MF+VC treatments compared to the rest. In the second field (fallow land), the amendment incorporation led to a general increase in HLW of 1.6–2.7% relative to the control.
The predecessor type had a strong effect on thousand-grain weight (TGW), resulting in a considerable decrease when green manure was applied (Figure 2C). The numerical difference ranged from 22.7% to 25.9% between the treatments in the two fields. Concerning the influence of the factor amendment on this indicator, the difference between treatments was very low and insignificant in most cases. In the green manure field, VC incorporation showed a 5.8% increment of TGW indicator compared to the control, 3.8% compared to MF, 2.9% compared to MF+VC, and 4.6% compared to BCh. In the fallow field, higher results were observed when VC was applied, without significant differences between MF and the combined treatment. All treatments with amendment, except BCh, showed significant differences from the control.
In the control, MF, BCh, and MF+VC, higher values of ear number (3.2–9.7%) were found in the fallow field (Figure 2D). VC incorporation led to a significant increase in the number of ears in the green manure field, by 7.2%. Thus, in that field, the VC resulted in a 27.8% increase relative to the control, 18.3% relative to MF, 12.4% relative to MF+VC, and 21.7% relative to BCh. In the fallow field, the indicators’ values were arranged in the next descending order: VC, MF+VC, MF, BCh, and control.
The number of plants indicator showed a higher positive influence of the predecessor on the land than the green manure (Figure 2E). It was strongly pronounced in treatment with VC, where 32.3% more plants were found. In the rest of the treatment, the difference was between 10.9% (control) and 15.8% (BCh). In the fallow field, the VC incorporation resulted in a 51.9% increase in the number of plants compared to the control, 33.4% compared to MF, 24.2% compared to MF+VC, and 33.2% compared to BCh. These data confirmed the strong positive influence of VC on both studied factors—predecessor type and amendment type. In the green manure field, the difference in plant numbers among treatments was not so large, but the order was similar: VC, MF+VC, BCh, and control. VC contributed a 27.3% increase in the indicator value compared to the control, 12.5% compared to MF, 7.3% compared to MF+VC, and 16.5% compared to BCh.

3.2. Changes in Soil Physicochemical Properties

Based on the generally accepted limit values for the content of macroelements in soil, it was found that the soil is poorly supplied with nitrogen and very well supplied with phosphorus and potassium (Table 3). Soil pH showed some changes between the treatments. Higher values were observed in the field with the fallow predecessor, especially in the control, VC, and MF+VC. They differ significantly from MF. The pH decreased in the field with the green manure predecessor, and in the control and MF treatments, the values were significantly different from those mentioned above. Thus, the green manure application supported the pH decrease by 0.24 in the control, 0.16 in VC, and in the MF+VC treatments. The EC values generally followed the same pattern as pH. Higher conductivity was observed in both VC treatments, and the difference from the other treatments in both fields was proven. In the control treatment, EC was higher in GM than in the fallow. The opposite was observed in the MF+VC and BCh treatments. The above results are supported by the TOC content data, where the highest results were found for treatments with VC. Total N concentration in soil was higher in the control and MF treatment and lower in the rest, especially in VC after fallow. Higher total P and total K concentrations were observed in MF after fallow. Lower P was found in MF+VC, while lower K was found in the control after GM.

3.3. Export of Nutrients

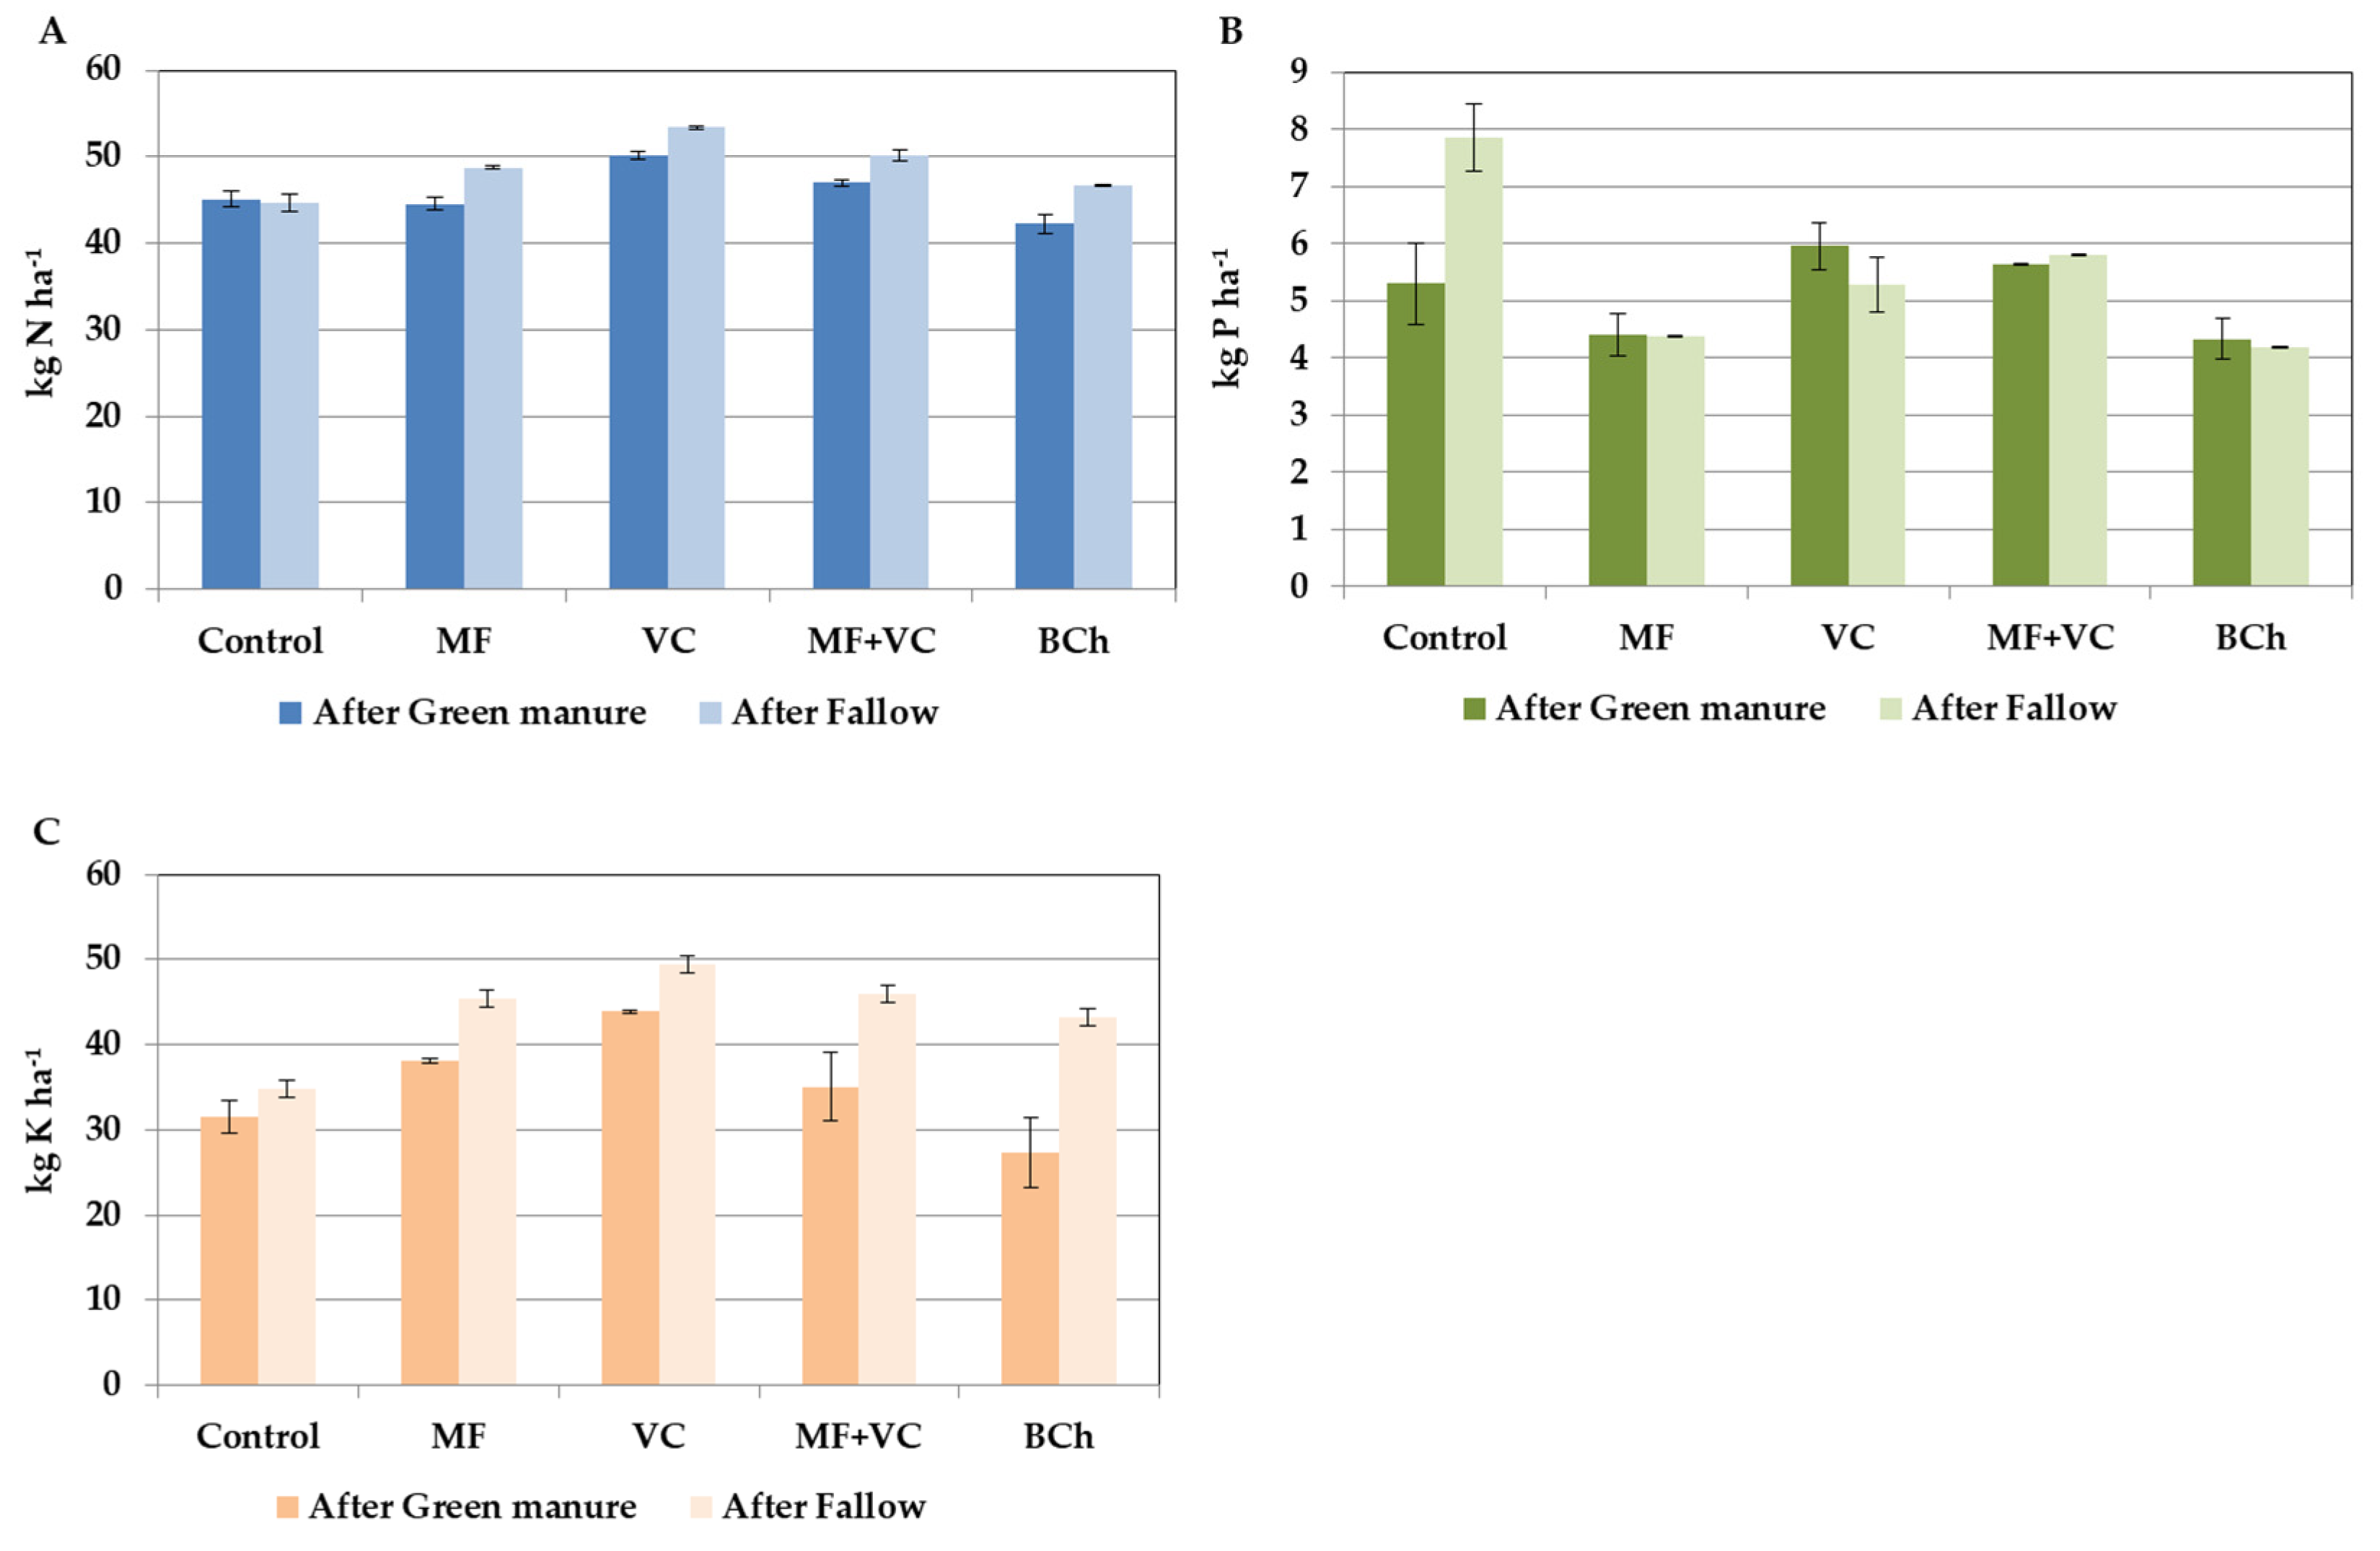
The information regarding N export with the grain yield indicated important differences between treatments in relation to the amendment factor (Figure 3A). In the green manure (GM) field, no significant difference was found between the control and MF. The other treatments demonstrated distinctions due to the amendment. VC supported the highest export of nutrients per hectare. The difference was 11.2% compared with the control, 12.5% compared with MF, 6.7% compared with MF+VC, and 18.6% compared with the BCh treatment. The results had a similar trend in the fallow field: VC > MF+VC > MF > BCh > control, but they were higher than those in the GM field. Thus, the fallow as a predecessor management strategy supported a 9.4% increase in exported N compared to the GM in treatment with MF. The difference was 6.5% when vermicompost was added, while the combined application resulted in a 6.7% difference. In the case of biochar, 10.4% more N was exported from the fallow field. Finally, no significant variation was observed in the untreated control.
In the case of P, the situation was not as clear as for N (Figure 3B). The data fluctuated in both fields. In the field where barley was grown after GM, no significant differences were found between the control and the amended treatments. Variation was observed when comparing the amended treatments, excluding the control. In this case, lower exported P was in treatments amended with MF and BCh (4.4 kg/ha and 4.3 kg/ha, respectively), while the highest were the treatments amended with VC (5.96 and 5.6). In the field where barley was grown after fallow, the highest results were found for the control, reaching 7.85 kg/ha, but the amended treatments showed a similar trend as in the field after GM, depending on the predecessor factor. The exported P increased by 48.2% in the control and by 3% in the combined treatment. The diverse predecessors led to a decrease in extracted P after the application of VC, which was not significant in this case. Finally, the kind of predecessor did not affect the extracted P when MF and BCh were applied.
Potassium showed a trend similar to N’s but with significant differences (Figure 3C). The pyramid-like graphical expression of K export with grain yield was clearly visible. In the field with GM as a predecessor, lower export was observed in control and BCh treatments, followed by MF+VC, MF, and VC. In the field with the predecessor, a lower value was found in control (34.84 kg/ha), followed by BCh (43.17 kg/ha), MF (45.39 kg/ha), MF+VC (45.99 kg/ha), and VC (49.40 kg/ha). The above data indicate that the amendments’ incorporation after fallow resulted in the following increases in K accumulation: 23.93%, 30.29%, 32.03%, and 41.81%, respectively. From another point of view, the accumulated quantities of K were higher in all treatments with predecessor fallow compared to those in the GM field. In this sense, the most significant increase between both fields was found for BCh, where the K increased by 58.31%, followed by MF+VC with 31.14%, MF with 19.17%, and VC with 12.58%. However, the difference in control is the lowest (10.48%). This demonstrates that the predecessor is important even without fertilization.

3.4. Photosynthesis and Transpiration

The results obtained for the photosynthetic pigments content in barley plants are presented in Table 4. Overall, higher values have been measured in plants from field 1 (with predecessor crop, GM) compared to field 2 (no predecessor crop, fallow), and this tendency was observed for all five experimental treatments. In field 1, maximum chlorophyll and carotenoid content was found in plants with MF and BCh, while plants treated with VC had pigment values closer to those of the control plants. Regarding the data from field 2, the maximum pigment content was found in plants from the MF+VC treatment, followed by those of BCh. VC and MF showed no significant differences from the control in their pigments.
In this aspect, the lowest ratio between chlorophyll a and chlorophyll b has been found in the control and VC of field 1, while the maximum has been found in the control and VC of field 2. It shows that the processor crop influenced the barley plant by enhancing chl a synthesis and/or decreasing chl b synthesis, as all other factors remained equal. This ratio strongly depends on the species’ characteristics, the age of the tissues, and the environmental conditions. Chlorophyll a is more labile than chlorophyll b and is destroyed more quickly under adverse conditions and during the ageing process of assimilation tissues. For the ratio of chlorophyll and carotenoids, both minimal and maximal values were obtained in field 2, with MF (2.03) and BCh (4.64), respectively, while in field 1, all values stayed in the range between 2.17 and 2.85 [42].
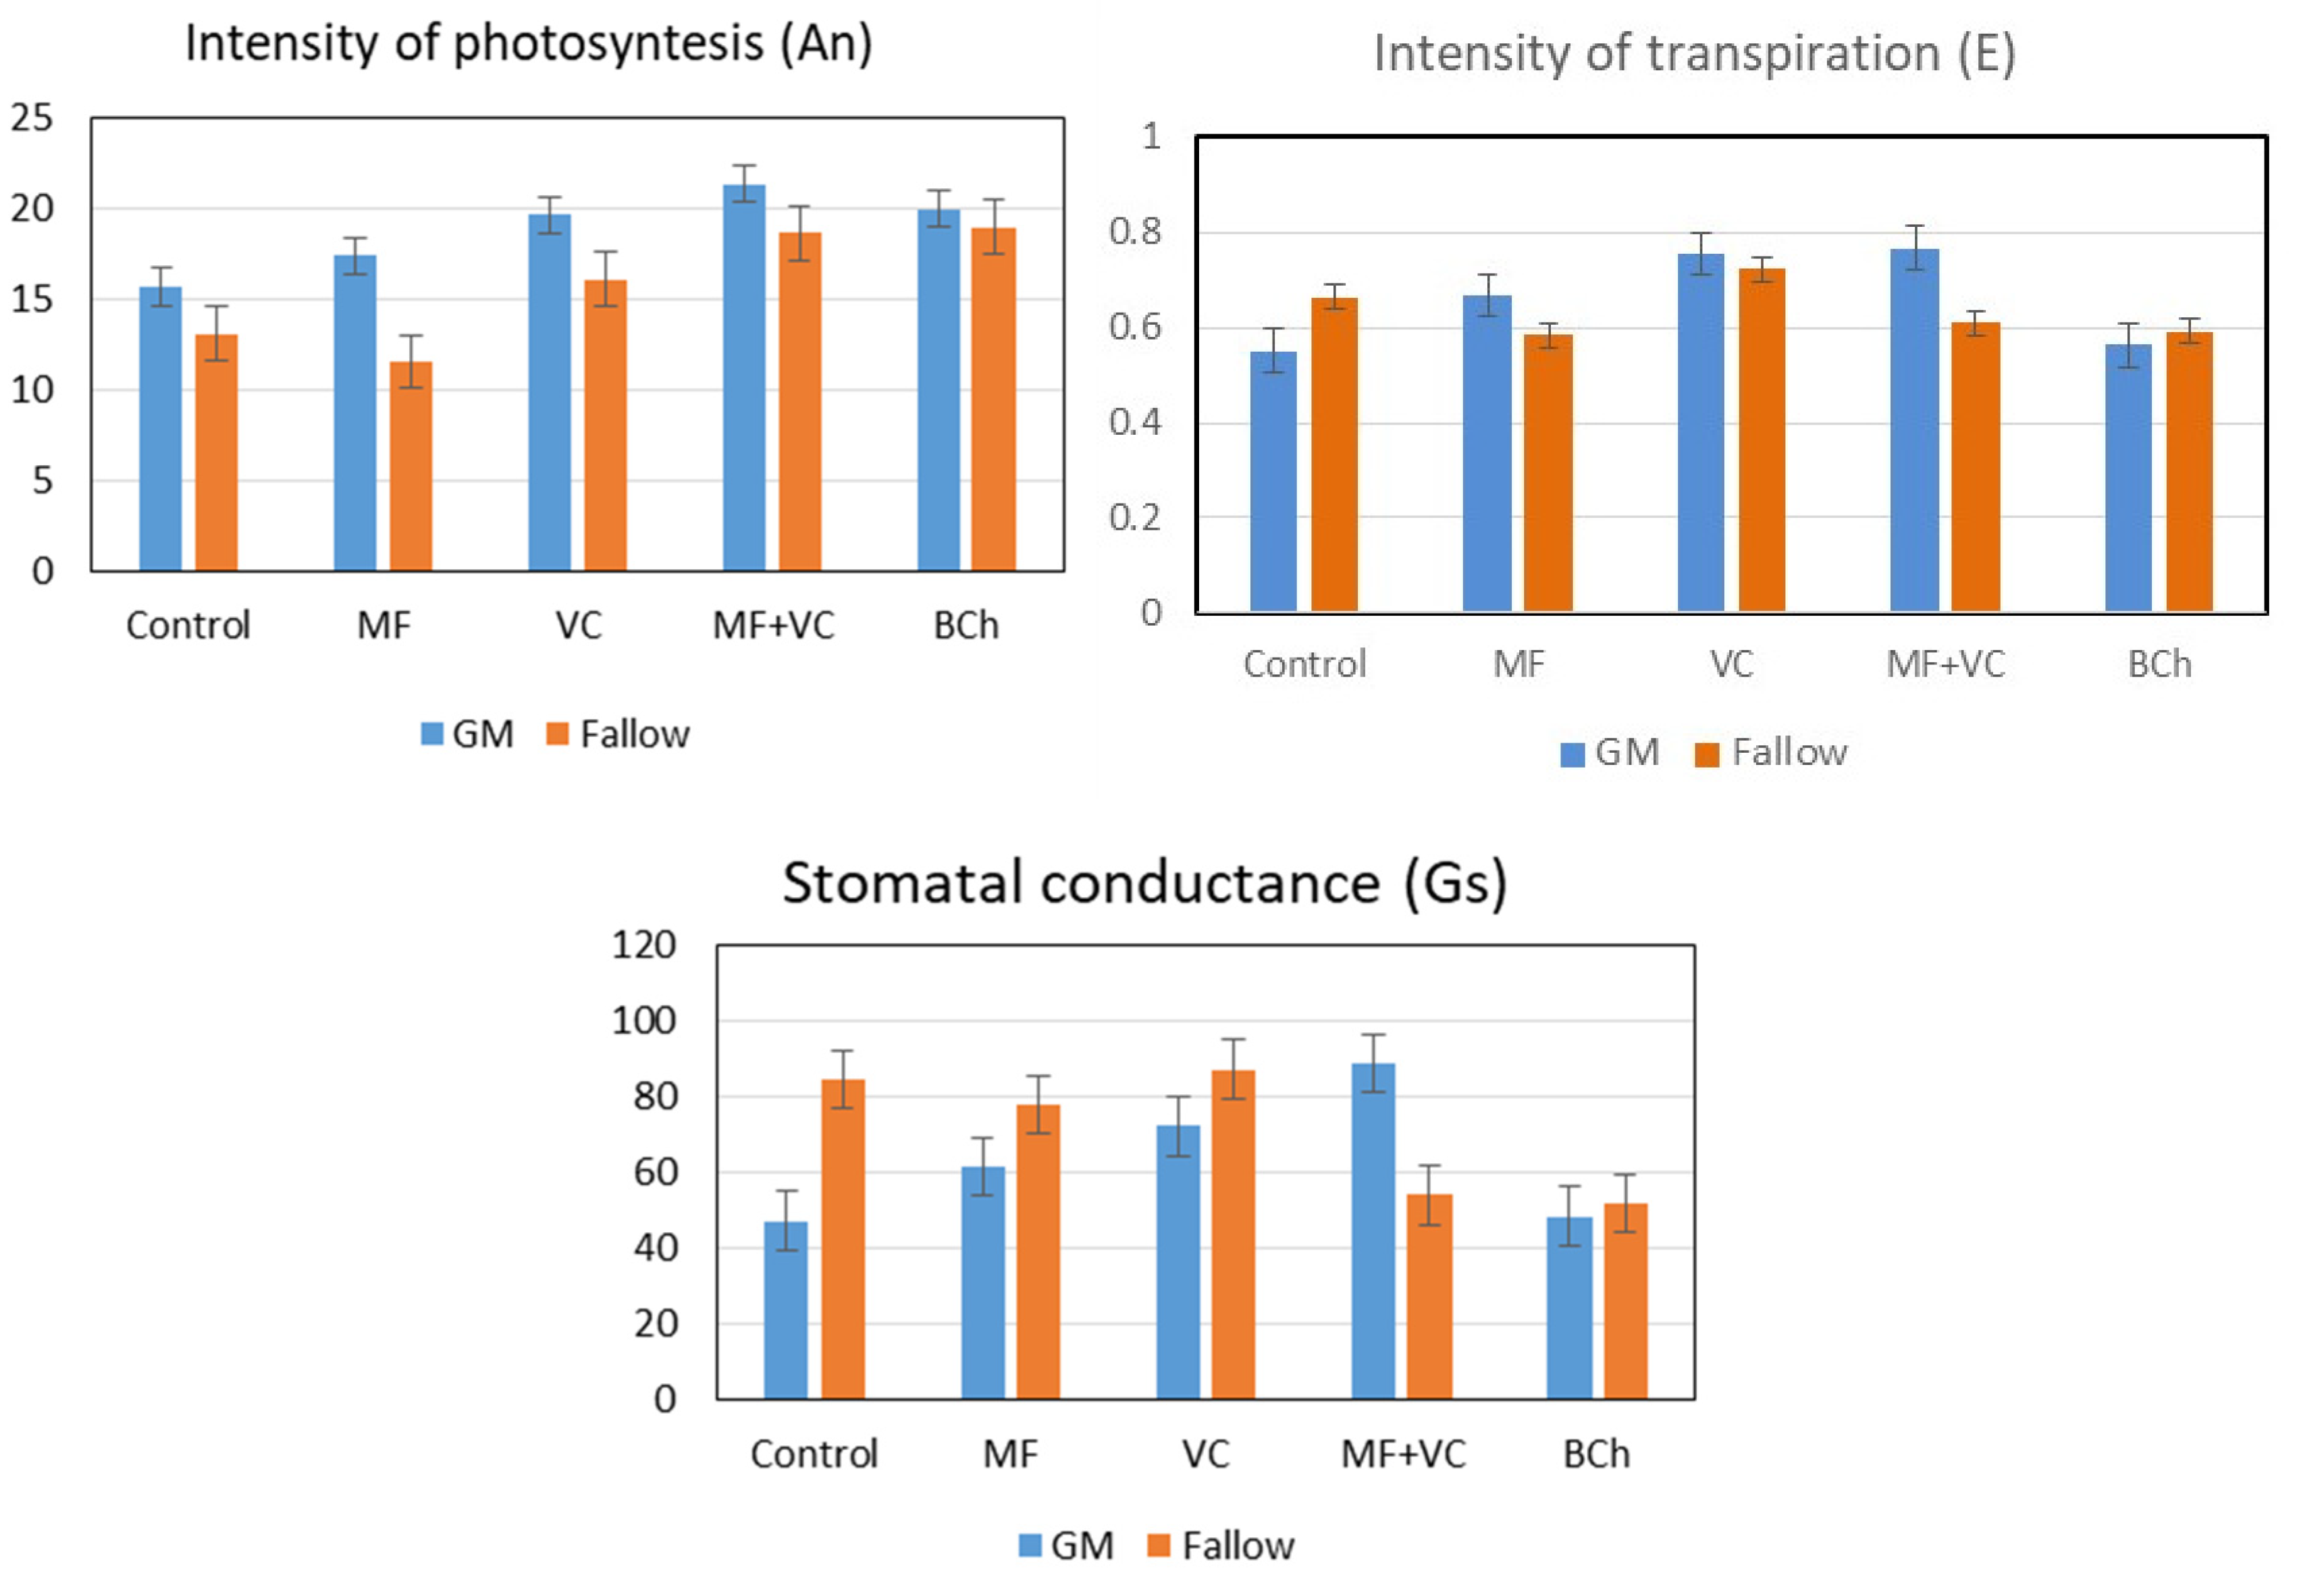
Higher values of photosynthesis, stomatal conductance, and intensity of transpiration of barley plants were measured in plants from field 1 (with predecessor crop, GM) in comparison with field 2 (no predecessor crop, fallow), and this tendency was consistent across all five experimental treatments (in pairs) (Figure 4). The plants of treatments with combined amendments possessed maximum photosynthetic and transpiration intensity (MF+VC, field 1), while the lowest photosynthetic rates were observed for plants from the control and MF of both fields. Transpiration rates were minimal in the plants from the control and BCh of field 1 and from MF and BCh of field 2. The stomatal conductance values were the lowest in the control and BCh plants in field 1, but in field 2, the lowest values were measured in the plants with BCh and MF+VC.

3.5. Soil Microorganisms

3.5.1. Microbial Respiration and Dehydrogenase Activity

Generally, higher soil respiration was observed in the field after GM (Table 5). The VC incorporation in that field resulted in the highest values of this activity marker. Second highest was the activity in combined treatment (MF+VC), followed by BCh, control, and MF. The field after fallow (field 2) presented similar results, with the lowest data for Control (2.25). Significant differences between the two fields with the same amendment were found for the control and VC.
Soil dehydrogenase activity was highest in both VC treatments, followed by combined fertilization. A significant difference unique to the two fields with the same amendment was observed in the case of combined treatment, where higher activity was found in field 2.

3.5.2. Community-Level Physiological Profiling

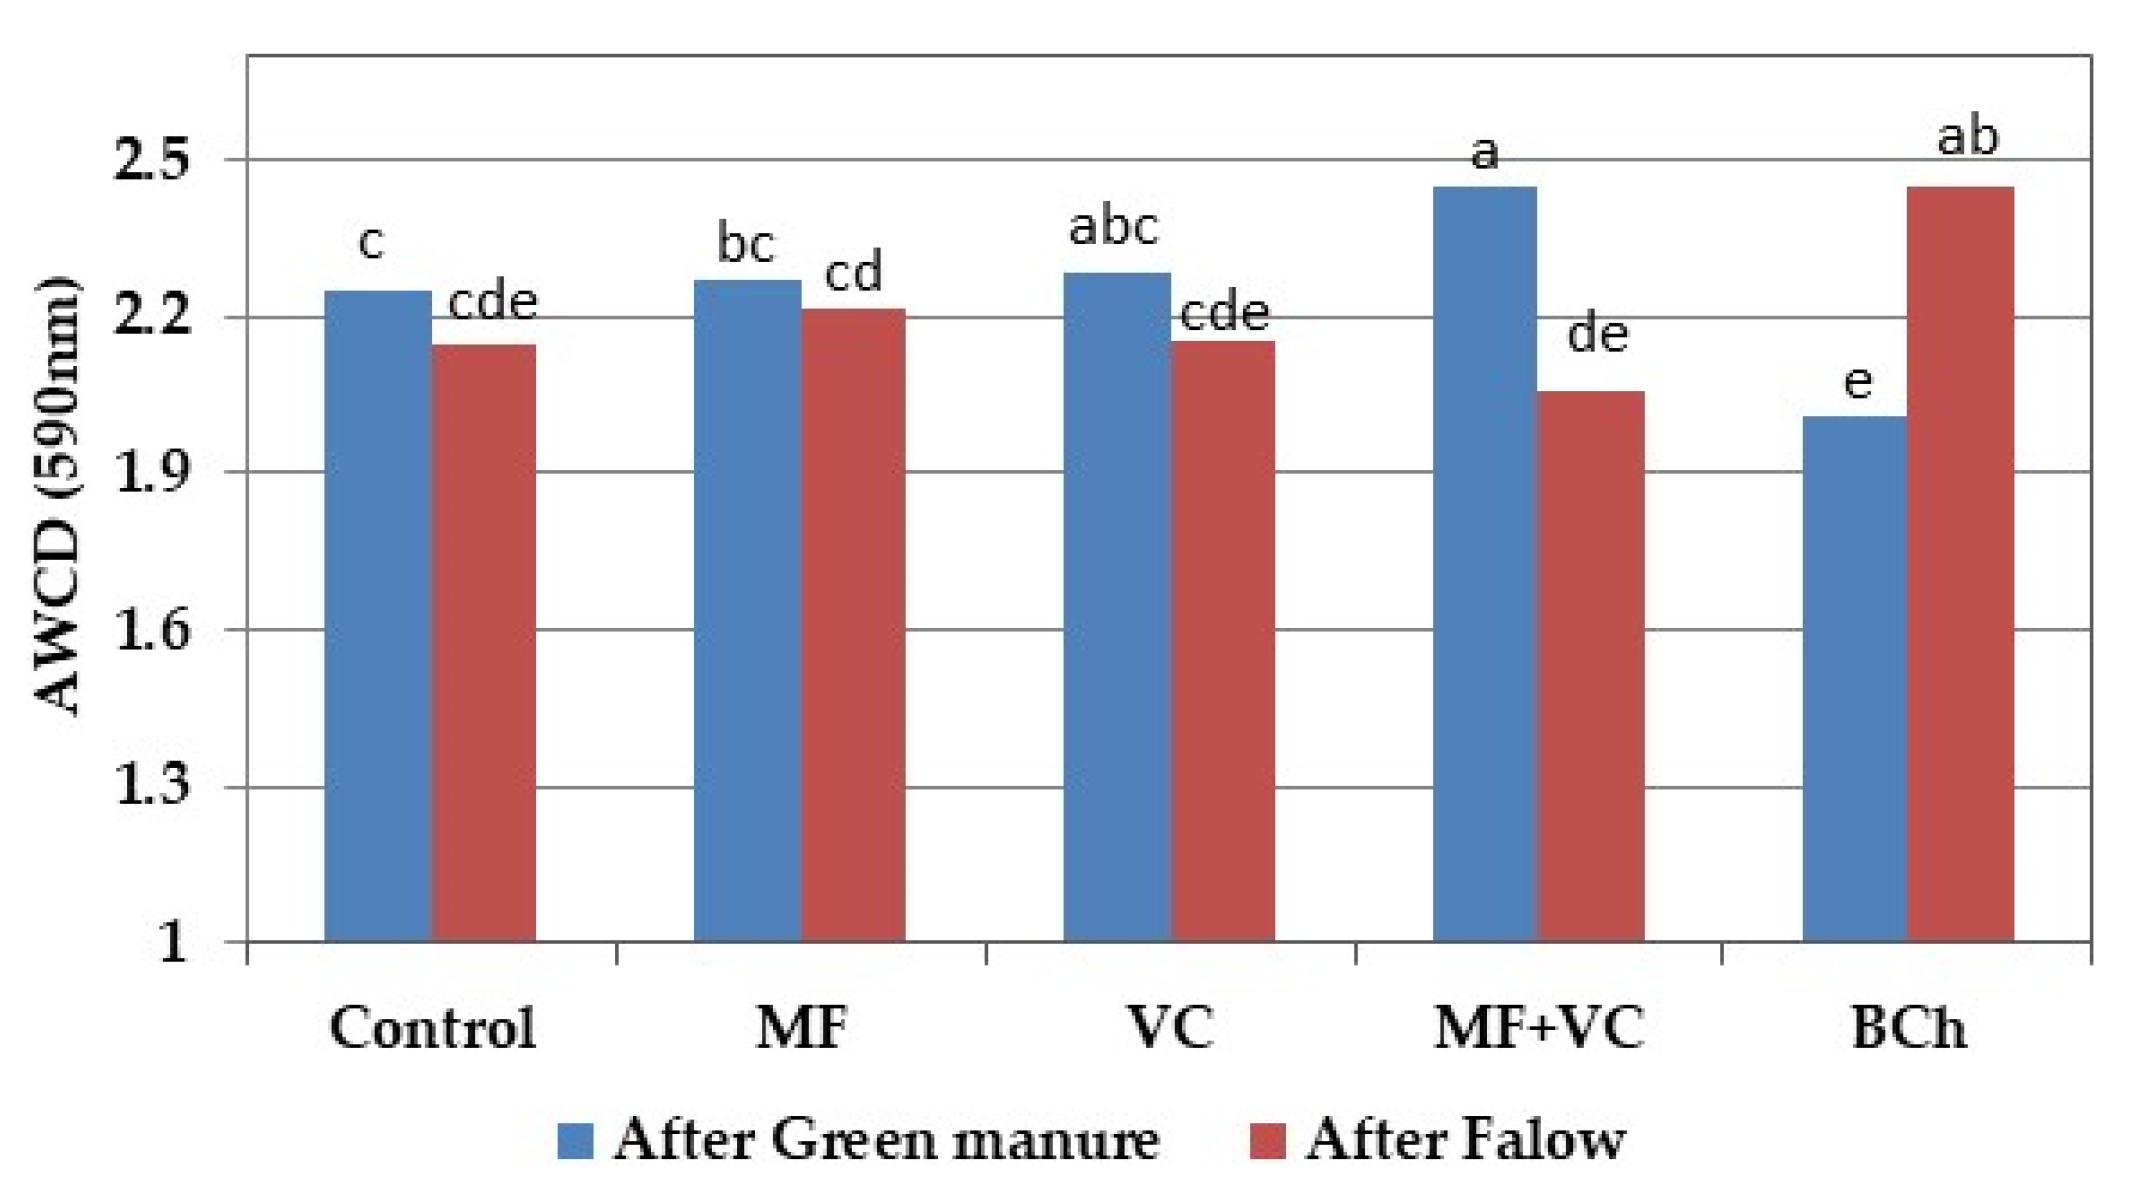
CLPP reflected the changes in soil microorganisms produced by both factors applied in the present study—predecessor and fertilization (Figure 5). The results showed that the utilization of substrates was similar in control, MF, and VC treatments (after GM application). When a combination was used (MF+VC), the rate of microbial metabolism increased, showing a statistically significant difference with control (8.83%), MF (7.83%), and BCh (21.85%). The biochar after the application of GM showed a lower rate of influence on microbial communities compared with the other treatments, even the control (10.68% decrease). In contrast, the biochar applied after fallow significantly influenced the rhizosphere communities’ behavior, demonstrating the highest metabolic rate compared to all other treatments: control (14.02%), MF (10.35%), VC (13.37%), and MF+VC (18.96%). Comparing the influence of biochar in both treatments, the application of GM reduced the microbial fitness by 17.80%. In the rest of the treatments, the GM led to an increase in substrate-utilization patterns, although only in the combined treatment was the difference statistically significant (19.15%).
The above-mentioned differences can be explained when going deeper into the group compounds utilization (Table 6). Generally, red is mainly present in the treatments after fallow. To confirm the statements regarding general metabolism, the highest consumption is found in the BCh case for carboxylic acids, amino acids, and carbohydrates, followed by MF (polymers, carboxylic acids, and carbohydrates) and the control (amino acids, amines and amides, and phenolic compounds). The highest consumption of amines, amides, and phenolic compounds is particularly interesting because they are usually poorly utilized. In the field with GM as a predecessor, their metabolism was generally low. The highest utilization was observed in field 2, especially in the control (2.96). Concerning the carbohydrates, the utilization of microbial communities in control of the GM field and those of MF and BCh of the fallow field was much higher than the rest (2.42–2.45). Carboxylic acids were absorbed most intensively in biochar treatment, followed by MF in the field after fallow, followed by MF and the combined treatments in the field with GM. Generally, the microbiome in most treatments uses this compound group. On the contrary, the phenolic compounds demonstrated much lower utilization from the soil microorganisms, with the highest rate in the control of the fallow field and the MF of the GM field. The polymers were very well presented among the treatments concerning their metabolism. The communities of MF in the fallow field and the control in the GM field showed higher affinity for them.
The highest utilization in biochar treatment of the fallow field was found for amino acids, carbohydrates, and carboxylic acids. The consumption of those compounds was much reduced in the same treatment in the field with GM incorporation, while the polymers were well utilized in both cases. In the control treatment of fallow, good utilization was found for most compounds, except for the carbohydrates and partially carboxylic acids. In comparison, in the GM field, the utilization of amines, amides, and phenolic compounds was reduced by half, and the consumption of amino acids, carboxylic acids, and polymers was very similar. At the same time, the use of carbohydrates was significantly increased by 33.7%. Concerning the treatments with MF, no important fluctuations exceeding 15% were found except in polymers, where the utilization decreased by about 20% after GM incorporation. The situation between treatments with VC and those with MF and VC was similar.
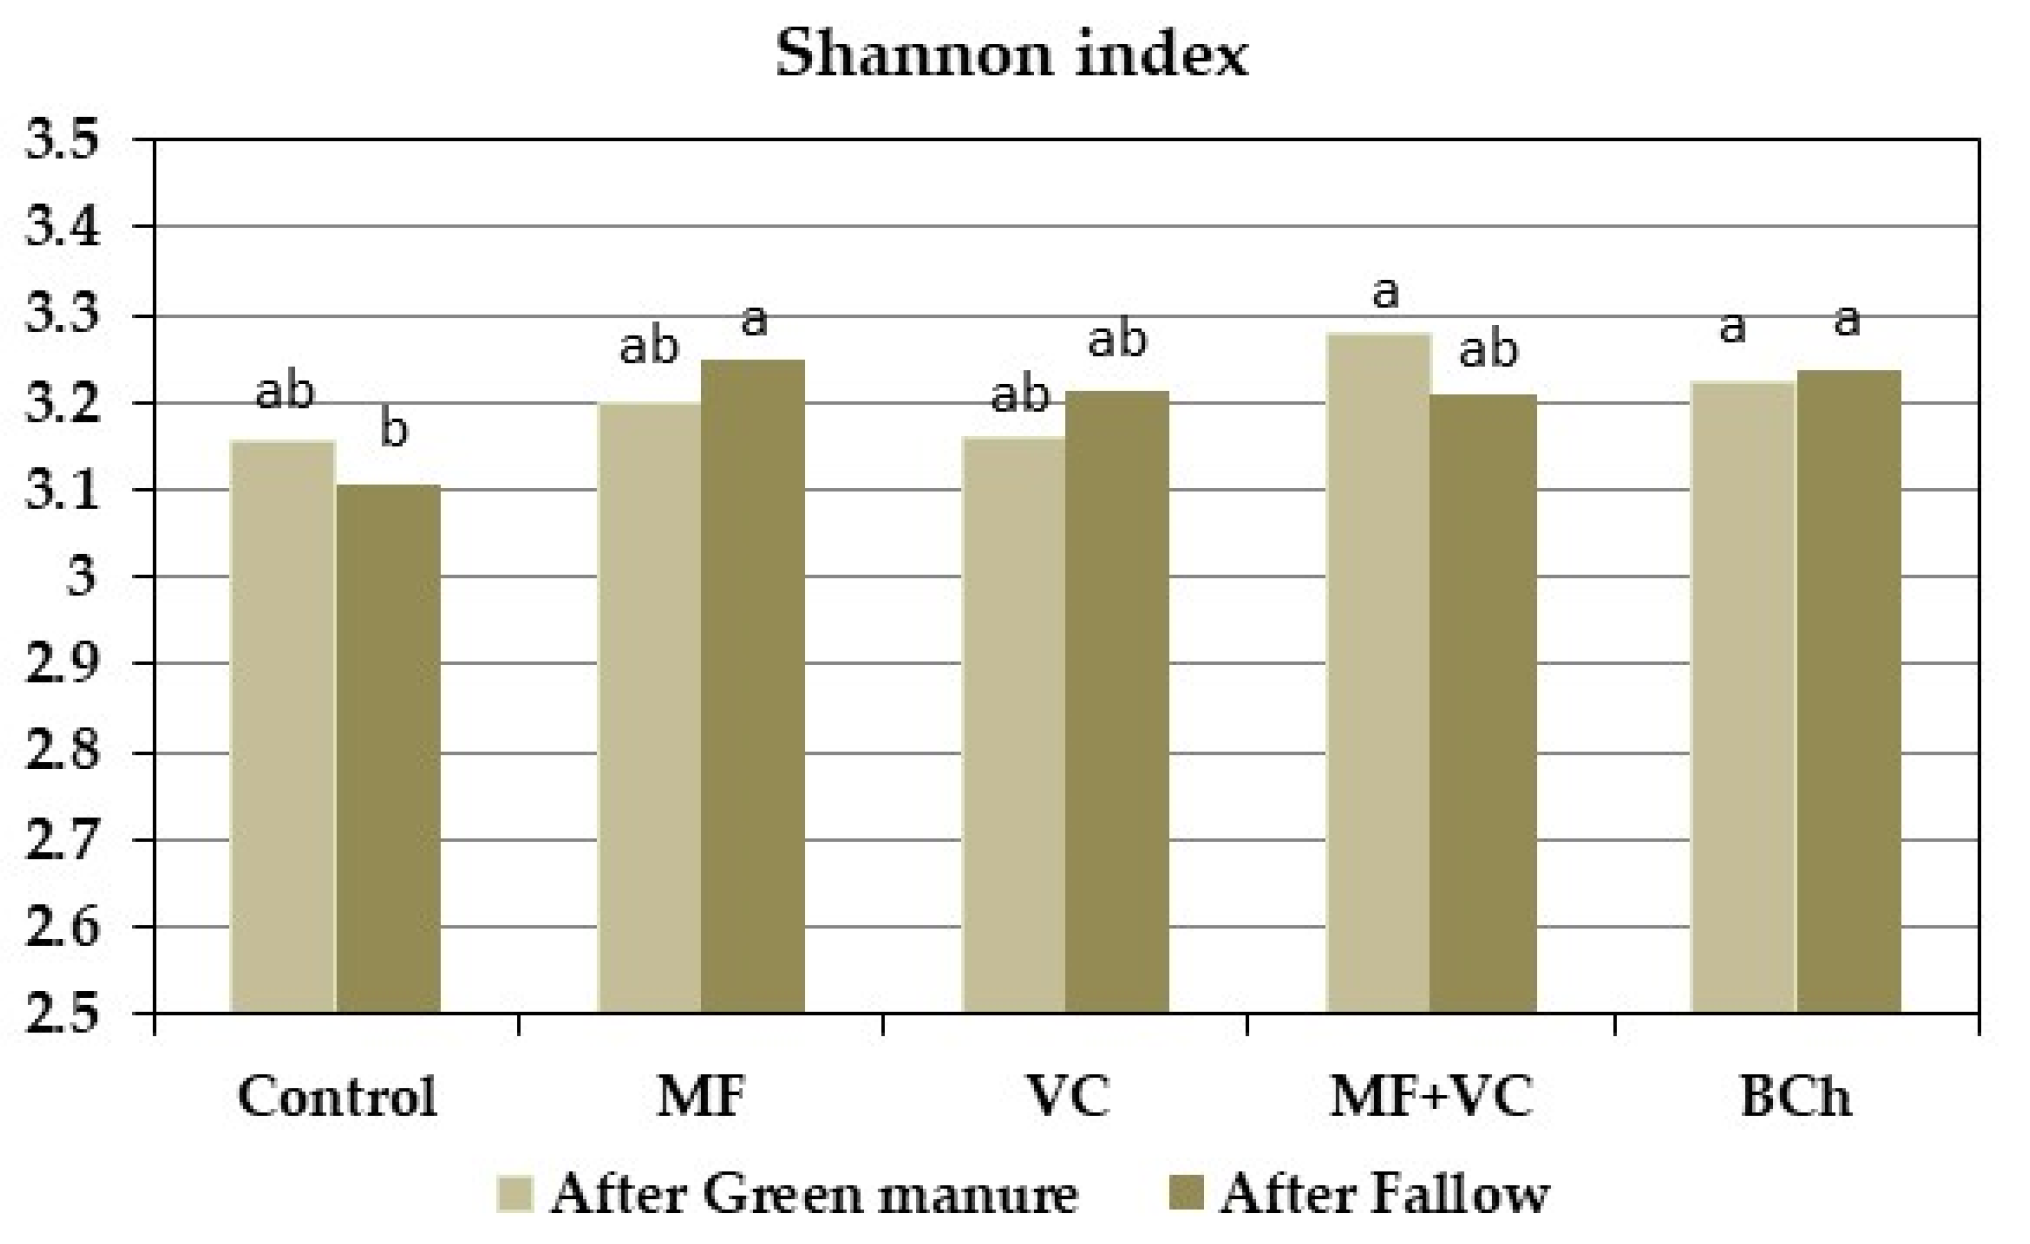
The diversity index we studied did not differ significantly between treatments with the same amendments, nor did the control (Figure 6), thus the predecessor did not influence microbial communities’ diversity. Similar data were obtained among treatments in the GM field. Improved diversity was observed after the addition of MF and BCh in the fallow field compared to the control, while it was not significant with the rest of the treatments.

3.6. PCA Analisys

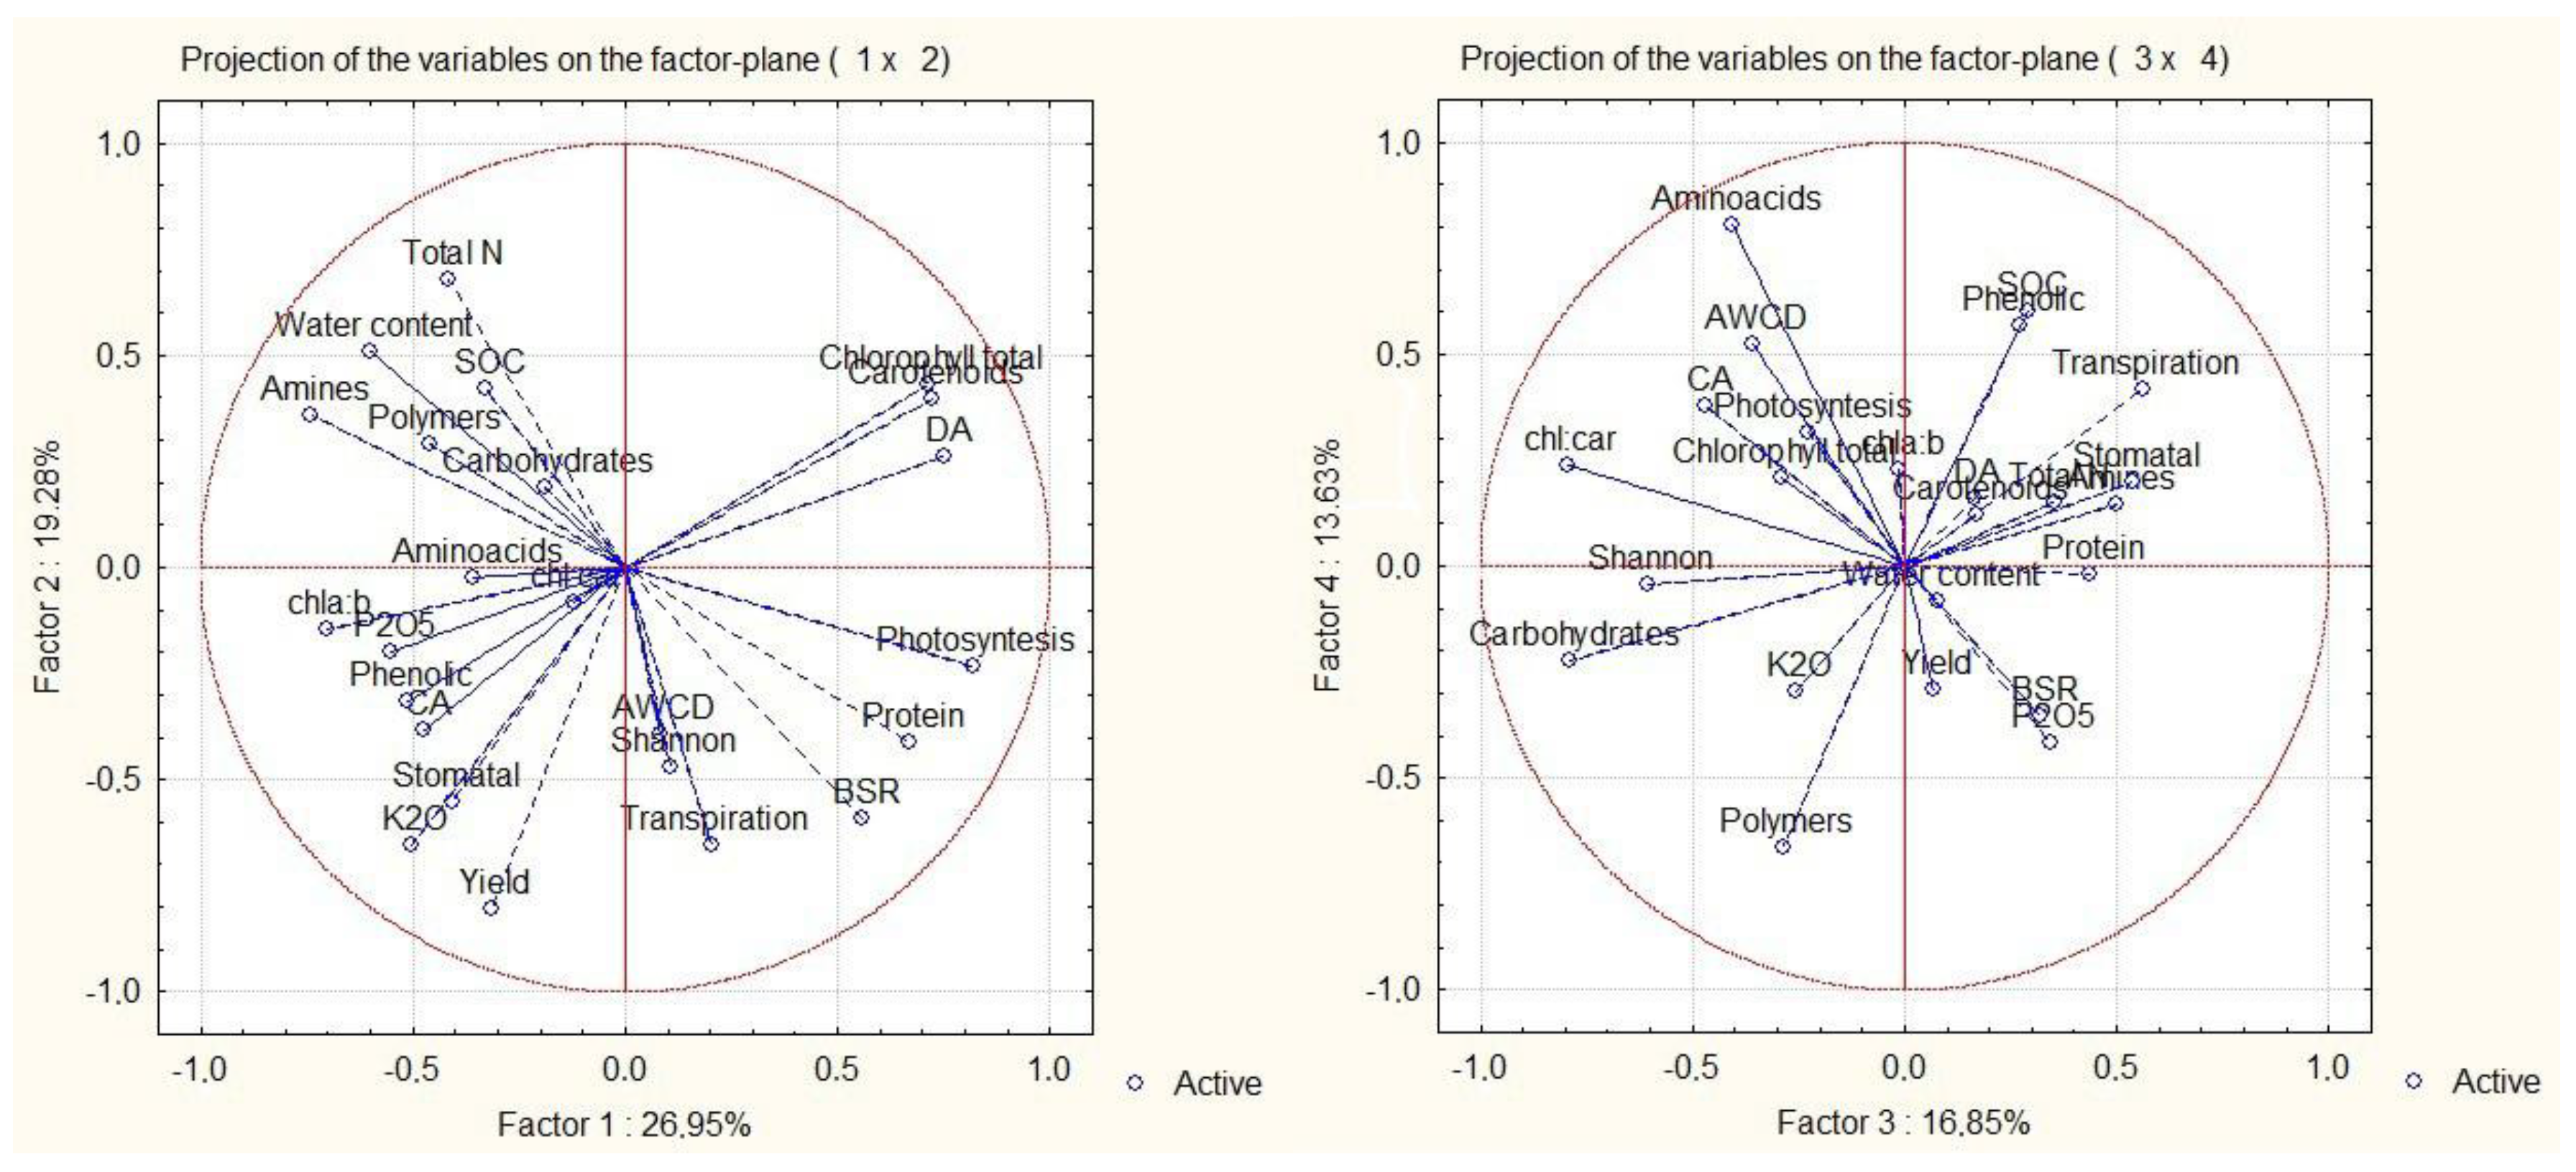
We studied two important variables: predecessor (green manure or fallow) and type of fertilization (without, mineral fertilizer, vermicompost, combination, and biochar). Investigating the importance of each variable, we applied a PCA analysis using different studied parameters (Supplementary Table S1, Figure 7). From the loading matrix, it is evident that Factor 1 (predecessor type) explains 26.95% of the total variance in the dataset. It exerted a maximum effect on grain protein content, basal soil respiration, dehydrogenase activity of soil microbiota, and plant physiology—total chlorophyll and carotenoids content, which reflected on the intensity of photosynthesis (Figure 7, left). The weight of Factor 2 (fertilization type) is 19.28% and has the most impact on soil water content, soil organic content, total N content in soil, and also on plant photosynthetic pigment content. Factor 3 explains 16.85% of the variance of the dataset, and the most affected are the following parameters: soil indicators—SOC, total N, and total P; plant indicators—grain protein content, transpiration, and stomatal conductance; microbial indicators—BSR, amines, and amides (Figure 7, right). We can hypothesize that this factor is probably related to the water content, respectively, of the crops that are irrigated. Factor 4 accounts for 13.63% of the total variance, most expressed on the microbial-related parameters such as AWCD, amino acids, carbohydrates, phenolic compounds, and soil organic content, which is also closely related to microbial activity. The other factors (Factor 5 to Factor 9) have values below 8%, so we have not discussed them here.

4. Discussion

Intensive agriculture requires the input of nutrients into the plant to create a vegetative mass and is especially valuable for agricultural production. The standard approach for that is to use fertilizers applied to the soil or, in some cases, to plant leaves. The production of mineral fertilizers requires a significant amount of resources and, in many cases, leads to their incomplete use and accumulation of residues in the soil and groundwater. In addition, many soils suffer from low organic matter content, which prevents the production of quality yields [17,18]. It can lead to reduced yield, low plant biomass, low quality of produce, and poor soil and plant health [51]. The soil is a complex matrix containing organic matter, mineral particles, air, water content, solutes, microorganisms, and other living beings capable of maintaining plant growth and development [52].
Our results revealed that the growth rate and yield in plants from field 1 were lower, although they maintained a higher photosynthesis rate compared with plants in field 2. A high photosynthesis rate with a low growth rate indicates a nutrient deficiency, where the plant produces abundant carbon but cannot use it to build new tissues due to a lack of essential nutrients. In fact, increased carbon accumulation without additional crop nitrogen accumulation can result in a decrease in yield [53]. Any increase in carbon availability will exacerbate nutrient limitations. This interaction may range from a complete absence of any growth response to increasing photosynthesis under very infertile conditions to a strong enhancement under very fertile conditions [54]. Other causes include respiratory losses, biomass allocation to non-growth tissues, light stress leading to photorespiration, or the accumulation of carbohydrates that signal the plant to slow growth.
For a plant to grow and develop properly, it must balance photosynthesis, respiration, and transpiration. If a plant photosynthesizes at a high rate, but its respiration rate is not high enough to break down the photosynthates produced, photosynthesis will either slow down or stop. On the other hand, if respiration is much more rapid than photosynthesis, the plant will not have adequate photosynthates to produce energy for growth, and it will either slow down or stop altogether [43].
The importance of green manure for short- and mid-term soil fertility and plant production is well known. After ploughing, the incorporated plant is immediately degraded by the soil microbiome. It is a crucial moment for the agrogeochemical cycle in the agroecosystems, improving soil nutrient content and plant productivity [55]. Thus, it is an input of nutrients available to both plants and microbes. We found a slight decrease in yield and other agronomic important parameters due to the oats–vetch green manure incorporation into the soil compared to the soil with predecessor fallow (Figure 1). Other researchers found different effects, reporting lower barley grain yield after fallow and higher after vetch green manure [56]. Liang and co-workers found that green legume manure increased wheat, maize, and rice yield. However, the benefits were also observed under an appropriate planting system, green manure biomass, and environmental factors [57]. Nguyen and collaborators observed a 13% decrease in yield after cereal green manure was used as a predecessor crop [58]. The same authors reported greater improvement in microbial properties after fallow. Given the different final results of these experiments, our findings need to be confirmed in new studies with a more precise alignment of input and output nutrients and their balance. This approach would probably provide greater clarity on the main reasons for the observed facts and the reduced yield associated with green manure.
Removing herbage reduces the barley grain yield when grown afterward by 0% to 33% compared to leaving it on-site [59]. Similar findings were reported when legumes were ploughed into the soil. The following barley crop benefited from incorporated legume grasses, producing more biomass than the barley grown without green manure. The effect of green manure on the soil significantly influenced the soil nutrient pool even in the third vegetation year after the green manure was ploughed into the soil [60]. Nevertheless, this effect is not seen in all cases or in all years of experiments due to the diverse weather conditions affecting the nutrient release rate from green manures. Where the soils are well supplied with nutrients, leaching from the soil may occur, and the green manure may not be effective [61]. The barley grains removed 42–53.4 kg N ha−1, 4.3–7.9 kg P ha−1, and 28–49.3 kg K ha−1 (Figure 2). These findings generally confirm what other researchers reported [61,62].
The VC incorporation improves and complements the MF. Under the present experimental conditions, the application of organic amendments led to improved agronomic parameters. The applied amendment concentrations could be a starting point for adjusting barley nutrition in a wider context. In this sense, researchers highlighted the role of organic matter application to soil, emphasizing the incorporation of compost and vermicompost to stimulate the nutrient pool in the rhizosphere and enhance soil health [63]. Thus, plant growth and yield are improved by the soil nutrients provided by the organic matter and by the allochthonous microbial communities of the vermicompost [64]. However, study conditions could be improved by avoiding some limitations in our study, such as the lack of different concentrations for each type of amendment and a limited number of combinations among them. In practice, soil characteristics are very important and guide the fertilization practices, together with the crop needs. In this sense, a long-term investigation will highlight more deeply the mechanisms of dependency within the soil–microbiome–plant system.

5. Conclusions

Agricultural management directly influences the crop yield and most agricultural parameters. When the predecessor is a spring oats–vetch mixture used as green manure, the successive winter fodder barley has lower yield and crop parameters than when preceded by fallow. The predecessor factor mainly influences grain protein, carotenoid and chlorophyll contents, microbial activities, respiration, and dehydrogenase. In contrast, the fertilization factor mainly impacts soil water and organic content, total soil N, and photosynthetic pigments of barley plants. Microbial activity is boosted after VC application, whereas specific metabolism of amino acids, carbohydrates, and carboxylic acids is observed following biochar application. When growing fodder barley, all agricultural production management activities are important—from crop rotations and their structure, through fertilization, to maintaining soil health and the development of the soil microbiome.

Supplementary Materials

The following supporting information can be downloaded at: https://www.mdpi.com/article/10.3390/agriculture15202145/s1. Figure S1: Barley field scheme; Table S1: Factor weights of studied parameters—PCA analysis.

Author Contributions

Conceptualization, S.S.; methodology, S.S., A.M., and S.P.; formal analysis, I.N., V.P., S.P., A.M., M.Y., Y.Y., and N.M.; investigation, S.S., S.P., and A.M.; resources, S.S. and W.S.; data curation, S.S., A.M., N.M., M.Y., and S.P.; writing—original draft preparation, S.S. and S.P.; writing—review and editing, S.S.; supervision, S.S.; funding acquisition, S.S. All authors have read and agreed to the published version of the manuscript.

Funding

This research was funded by the Bulgarian National “Science Fund”, grant number KP-06-DO 02/5. The authors acknowledge the financial support through the partners of the Joint Call of the Cofund ERA-Nets SusCrop (Grant N° 771134), FACCE ERA-GAS (Grant N° 696356), ICT-AGRI-FOOD (Grant N° 862665), and SusAn (Grant N° 696231).

Institutional Review Board Statement

Not applicable.

Data Availability Statement

The original contributions presented in this study are included in the article/Supplementary Material. Further inquiries can be directed to the corresponding author.

Acknowledgments

The authors express their gratitude to the Unigreen Consortium for fostering this collaboration and providing the opportunity to work together on this project. Their support and encouragement have been invaluable to the development of this research.

Conflicts of Interest

The authors declare no conflicts of interest.

References

  1. Kehinde, B.A.; Sharma, P. Recently isolated antidiabetic hydrolysates and peptides from multiple food sources: A review. Crit. Rev. Food Sci. Nutr. 2020, 60, 322–340. [Google Scholar] [CrossRef]
  2. FAO. FAO STAT. 2023. Available online: https://www.fao.org/faostat/en/#data/QCL (accessed on 5 September 2025).
  3. Godswill, A.G.; Somtochukwu, I.V.; Ikechukwu, A.O.; Kate, E.C. Health benefits of micronutrients (vitamins and minerals) and their associated deficiency diseases: A systematic review. Int. J. Food Sci. 2020, 3, 1–32. [Google Scholar] [CrossRef]
  4. Yadav, M.R.; Kumar, S.; Lal, M.K.; Kumar, D.; Kumar, R.; Yadav, R.K.; Kumar, S.; Nanda, G.; Singh, J.; Udawat, P. Mechanistic understanding of leakage and consequences and recent technological advances in improving nitrogen use efficiency in cereals. Agronomy 2023, 13, 527. [Google Scholar] [CrossRef]
  5. Lyu, H.; Li, Y.; Wang, Y.; Wang, P.; Shang, Y.; Yang, X.; Wang, F.; Yu, A. Drive soil nitrogen transformation and improve crop nitrogen absorption and utilization—A review of green manure applications. Front. Plant Sci. 2024, 14, 1305600. [Google Scholar] [CrossRef]
  6. Gao, S.J.; Zhang, R.G.; Cao, W.D.; Fan, Y.Y.; Gao, J.S.; Huang, J. Long-term rice-rice-green manure rotation changing the microbial communities in typical red paddy soil in south China. J. Integr. Agric. 2015, 14, 2512–2520. [Google Scholar] [CrossRef]
  7. Becker, M.; Ladha, J.K.; Ali, M. Green manure technology: Potential, usage, and limitations. A case study for lowland rice. Plant Soil 1995, 174, 181–194. [Google Scholar] [CrossRef]
  8. Li, Z.; Tian, D.; Wang, B.X.; Wang, J.S.; Wang, B.; Chen, H.Y.H.; Xu, X.F.; Wang, C.G.; He, N.P.; Niu, S. Microbes drive global soil nitrogen mineralization and availability. Glob. Change Biol. 2019, 25, 14557. [Google Scholar] [CrossRef]
  9. Carter, M.S.; Sørensen, P.; Petersen, S.O.; Ma, X.; Ambus, P. Effects of green manure storage and incorporation methods on nitrogen release and N2O emissions after soil application. Biol. Fertil. Soils 2014, 50, 1233–1246. [Google Scholar] [CrossRef]
  10. Portugal, J.R.; Arf, O.; Buzetti, S.; Portugal, A.R.P.; Garcia, N.F.S.; Meirelles, F.C.; Garé, L.M.; Abrantes, F.L.; Rodrigues, R.A.F. Do cover crops improve the productivity and industrial quality of upland rice? Agron. J. 2020, 112, 327–343. [Google Scholar] [CrossRef]
  11. Astier, M.; Maass, J.M.; Etchevers-Barra, J.D.; PeA, J.J.; González, F.D.L. Short-term green manure and tillage management effects on maize yield and soil quality in an andisol. Soil Till. Res. 2006, 88, 153–159. [Google Scholar] [CrossRef]
  12. Rashmi, I.; Shirale, A.; Kartikha, K.S.; Shinogi, K.C.; Meena, B.P.; Kala, S. Leaching of plant nutrients from agricultural lands. In Essential Plant Nutrients; Naeem, M., Ansari, A., Gill, S., Eds.; Springer: Cham, Switzerland, 2017. [Google Scholar] [CrossRef]
  13. Bergström, L.; Kirchmann, H.; Aronsson, H.; Torstensson, G.; Mattsson, L. Use efficiency and leaching of nutrients in organic and conventional cropping systems in Sweden. In Organic Crop Production—Ambitions and Limitations; Kirchmann, H., Bergström, L., Eds.; Springer: Dordrecht, The Netherlands, 2009. [Google Scholar] [CrossRef]
  14. Zuo, W.; Xu, L.; Qiu, M.; Yi, S.; Wang, Y.; Shen, C.; Zhao, Y.; Li, Y.; Gu, C.; Shan, Y.; et al. Effects of Different Exogenous Organic Materials on Improving Soil Fertility in Coastal Saline-Alkali Soil. Agronomy 2023, 13, 61. [Google Scholar] [CrossRef]
  15. Schröder, P.; Beckers, B.; Daniels, S.; Gnädinger, F.; Maestri, E.; Marmiroli, N.; Mench, M.; Millán, R.; Obermeier, M.M.; Oustriere, N.; et al. Intensify production, transform biomass to energy and novel goods and protect soils in Europe—A vision how to mobilize marginal lands. Sci. Total Environ. 2018, 616–617, 1101–1123. [Google Scholar] [CrossRef]
  16. Guo, X.X.; Liu, H.T.; Wu, S.B. Humic substances developed during organic waste composting: Formation mechanisms, structural properties, and agronomic functions. Sci. Total Environ. 2019, 662, 501–510. [Google Scholar] [CrossRef]
  17. Oyege, I.; Balaji Bhaskar, M.S. Effects of Vermicompost on Soil and Plant Health and Promoting Sustainable Agriculture. Soil Syst. 2023, 7, 101. [Google Scholar] [CrossRef]
  18. Shen, Z.; Yu, Z.; Xu, L.; Zhao, Y.; Yi, S.; Shen, C.; Wang, Y.; Li, Y.; Zuo, W.; Gu, C.; et al. Effects of Vermicompost Application on Growth and Heavy Metal Uptake of Barley Grown in Mudflat Salt-Affected Soils. Agronomy 2022, 12, 1007. [Google Scholar] [CrossRef]
  19. Nasiri, S.; Andalibi, B.; Tavakoli, A.; Delavar, M.A.; El-Keblawy, A.; Zwieten, L.V.; Mastinu, A. The mineral biochar alters the biochemical and microbial properties of the soil and the grain yield of Hordeum vulgare L. under drought stress. Land 2023, 12, 559. [Google Scholar] [CrossRef]
  20. Enders, A.; Hanley, K.; Whitman, T.; Joseph, S.; Lehmann, J. Characterization of biochars to evaluate recalcitrance and agronomic performance. Bioresour. Technol. 2012, 114, 644–653. [Google Scholar] [CrossRef]
  21. Agegnehu, G.; Srivastava, A.K.; Bird, M.I. The role of biochar and biochar-compost in improving soil quality and crop performance: A review. Appl. Soil Ecol. 2017, 119, 156–170. [Google Scholar] [CrossRef]
  22. Devi, R.; Kaur, T.; Kour, D.; Rana, K.L.; Yadav, A.; Yadav, A.N. Beneficial fungal communities from different habitats and their roles in plant growth promotion and soil health. Microb. Biosyst. 2020, 5, 21–47. [Google Scholar] [CrossRef]
  23. Houborg, R.; McCabe, M.F.; Cescatti, A.; Gitelson, A.A. Leaf chlorophyll constraint on model simulated gross primary productivity in agricultural systems International. J. Appl. Earth Obs. Geoinform. 2015, 43, 160–176. [Google Scholar] [CrossRef]
  24. Zaytseva, I.Y.; Noskova, E.N.; Lisitsyn, E.M.; Schennikova, I.N. Relationship of barley leaf’s pigment content with development of yield structure elements. IOP Conf. Ser. Earth Environ. Sci. 2021, 677, 042051. [Google Scholar] [CrossRef]
  25. Yu, K.; Lenz-Wiedemann, V.; Chen, X.; Bareth, G. Estimating leaf chlorophyll of barley at different growth stages using spectral indices to reduce soil background and canopy structure effects. ISPRS J. Photogramm. Remote Sens. 2014, 97, 58–77. [Google Scholar] [CrossRef]
  26. Lemaire, G.; Jeuffroy, M.; Gastal, F. Diagnosis tool for plant and crop N status in vegetative stage: Theory and practices for crop N management. Eur. J. Agron. 2008, 28, 614–624. [Google Scholar] [CrossRef]
  27. Caldwell, B.A. Enzyme activities as a component of soil biodiversity: A review. Pedobiologia 2005, 49, 637–644. [Google Scholar] [CrossRef]
  28. Geisseler, D.; Scow, K.M. Long-term effects of mineral fertilizers on soil microorganisms—A review. Soil Biol. Biochem. 2014, 75, 54–63. [Google Scholar] [CrossRef]
  29. Liang, R.; Hou, R.; Li, J.; Lyu, Y.; Hang, S.; Gong, H.; Ouyang, Z. Effects of different fertilization on rhizosphere bacterial communities of winter wheat in the North China Plain. Agronomy 2020, 10, 93. [Google Scholar] [CrossRef]
  30. Foster, E.J.; Hansen, N.; Wallenstein, M.; Cotrufo, M.F. Biochar and manure amendments impact soil nutrients and microbial enzymatic activities in a semi-arid irrigated maize cropping system. Agric. Ecosyst. Environ. 2016, 233, 404–414. [Google Scholar] [CrossRef]
  31. Popova, V.; Petkova, M.; Shilev, S. Metagenomic approach unravelling bacterial diversity in combined composting and vermicomposting technology of agricultural wastes. Ecol. Balk. 2023, 15, 135–150. [Google Scholar]
  32. Jindo, K.; Mizumoto, H.; Sawada, Y.; Sanchez-Monedero, M.A.; Sonoki, T. Physical and chemical characterization of biochars derived from different agricultural residues. Biogeosciences 2014, 11, 6613–6621. [Google Scholar] [CrossRef]
  33. Thomas, G.W. Soil pH and soil acidity. In Methods of Soil Analysis; Sparks, D.L., Ed.; Part 3. SSSA Book Ser. 5; SSSA: Madison, WI, USA, 1996; pp. 475–490. [Google Scholar]
  34. Rhoades, J.D. Salinity, electrical conductivity, and total dissolved solids. In Methods of Soil Analysis; Sparks, D.L., Ed.; Part 3. SSSA Book Ser. 5; SSSA: Madison, WI, USA, 1996; pp. 417–435. [Google Scholar]
  35. Keeny, D.R.; Nelson, D.W. Nitrogen-inorganic forms. In Methods of Soil Analysis; Part 2, Chemical and microbiological methods; Page, A.L., Miller, D.R., Keeny, D.R., Eds.; ASA: Madison, WI, USA; SSSA: Madison, WI, USA, 1982; pp. 643–698. [Google Scholar]
  36. Foster, J.C. Soil sampling and storage. In Methods in Applied Soil Microbiology and Biochemistry; Alef, K., Nannipieri, P., Eds.; Academic Press: Cambridge, MA, USA, 1995; pp. 49–121. [Google Scholar]
  37. Nelson, D.W.; Sommers, L.E. Total carbon, organic carbon, and organic matter. In Methods of Soil Analysis; Part 3. Chemical Methods; Black, C.A., Ed.; Soil Science of America and American Society of Agronomy: Madison, WI, USA, 1996; pp. 961–1010. [Google Scholar]
  38. Yoshida, S.; Forno, D.A.; Cock, J.H.; Gomez, K.A. Laboratory Manual for Physiological Studies of Rice; International Rice Research Institute (IRRI): Manila, Philippines, 1976; pp. 27–34. Available online: http://books.irri.org/9711040352_content.pdf (accessed on 10 September 2025).
  39. FAO. Food Energy—Methods of Analysis and Conversion Factors; Report of a Technical Workshop Rome, 3–6 December 2002; FAO: Rome, Italy, 2003; ISSN 0254-4725. [Google Scholar]
  40. Shlyk, A.A. Biosynthesis of chlorophyll b. Annu. Rev. Plant Physiol. 1971, 22, 169–184. [Google Scholar] [CrossRef]
  41. Lichtenthaler, H.K.; Bushmann, C. Chlorophylls and carotenoids: Measurement and characterization by UV-VIS spectroscopy. Curr. Prot. Food Anal. Chem. 2001, 1, F4.3.1–F4.3.8. [Google Scholar] [CrossRef]
  42. Petrova, S.; Velcheva, I.; Nikolov, B.; Vasileva, T.; Bivolarski, V. Antioxidant Responses and Adaptation Mechanisms of Tilia tomentosa Moench, Fraxinus excelsior L. and Pinus nigra J. F. Arnold towards Urban Air Pollution. Forests 2022, 13, 1689. [Google Scholar] [CrossRef]
  43. Hidayati, N.; Triadiati; Anas, I. Photosynthesis and transpiration rates of rice cultivated under the system of rice intensification and the effects on growth and yield. Hayati J. Biosci. 2016, 23, 67–72. [Google Scholar] [CrossRef]
  44. Schoefs, B. Chlorophyll and carotenoid analysis in food products. Properties of the pigments and methods of analysis. Trends Food Sci. Technol. 2002, 13, 361–371. [Google Scholar] [CrossRef]
  45. Morley, P.G.; Jump, A.S.; West, M.D.; Donoghue, D.N.M. Spectral response of chlorophyll content during leaf senescence in European beech trees. Environ. Res. Commun. 2020, 2, 071002. [Google Scholar] [CrossRef]
  46. Wang, X.; Wang, X.; Chen, Y.; Berlyn, G.P. Photosynthetic parameters of urban greening trees growing on paved land. For.-Biogeosci. For. 2019, 12, 403–410. [Google Scholar] [CrossRef]
  47. Alef, K. Soil respiration. In Methods in Applied Soil Microbiology and Biochemistry; Alef, K., Nannipieri, P., Eds.; Academic Press: Cambridge, MA, USA, 1995; pp. 214–219. [Google Scholar]
  48. Thalmann, A. Zur metodik der bestimmung der dehydrogenaseactivitat im boden mittels thriphenyltetrazolium chloride (TTC). Landwirtsch. Forsch. 1968, 21, 249–258. [Google Scholar]
  49. Alef, K. Dehydrogenase activity. In Methods in Applied Soil Microbiology and Biochemistry; Alef, K., Nannipieri, P., Eds.; Academic Press: Cambridge, MA, USA, 1995; pp. 228–231. [Google Scholar]
  50. Insam, H.; Goberna, M. Use of Biolog for the community level physiological profiling (CLPP) of environmental samples. Mol. Microb. Ecol. Manag. 2008, 452, 853–860. [Google Scholar]
  51. Iacomino, G.; Sarker, T.C.; Ippolito, F.; Bonanomi, G.; Vinale, F.; Staropoli, A.; Idbella, M. Biochar and compost application either alone or in combination affects vegetable yield in a volcanic mediterranean soil. Agronomy 2022, 12, 1996. [Google Scholar] [CrossRef]
  52. Buscot, F. What Are Soils? In Microorganisms in Soils: Roles in Genesis and Functions; Varma, A., Buscot, F., Eds.; Soil Biology; Springer: Berlin/Heidelberg, Germany, 2005; Volume 3. [Google Scholar] [CrossRef]
  53. Sinclair, T.; Rufty, T.W. Photosynthesis and Yield. In Bringing Skepticism to Crop Science; Springer Briefs in Agriculture; Springer: Cham, Switzerland, 2022. [Google Scholar] [CrossRef]
  54. Kirschbaum, M.U. Does enhanced photosynthesis enhance growth? Lessons learned from CO2 enrichment studies. Plant Physiol. 2011, 155, 117–124. [Google Scholar] [CrossRef]
  55. Thorup-Kristensen, K.; Van der Boogard, R. Vertical and horizontal development of the root system of carrots following green manure. Plant Soil 1999, 212, 145–153. [Google Scholar] [CrossRef]
  56. Debele, G.G.; Kassie, K.; Getachew, T. Improving carbon sequestration and yield of barley (Hordeum vulgare) through combined application of green manure and mineral fertilizers under cambisols in ethiopian highlands. In Proceedings of the EGU General Assembly 2024, Vienna, Austria, 14–19 April 2024; EGU24-802. [Google Scholar] [CrossRef]
  57. Liang, K.; Wang, X.; Du, Y.; Li, G.; Wei, Y.; Liu, Y.; Li, Z.; Wei, X. Effect of Legume Green Manure on Yield Increases of Three Major Crops in China: A Meta-Analysis. Agronomy 2022, 12, 1753. [Google Scholar] [CrossRef]
  58. Nguyen, P.V.; Condron, L.M.; Simpson, Z.P.; McDowell, R.W. Inclusion of Leguminous Green Manures Enhances Crop Biomass, Nutrient Uptake, Soil Phosphorus Dynamics and Bioavailability. J. Sustain. Agric. Environ. 2024, 3, e70035. [Google Scholar] [CrossRef]
  59. Frøseth, R.L.; Bakken, A.K.; Bleken, M.A.; Riley, H.; Pommeresche, R.; Thorup-Kristensen, K.; Hansen, S. Effects of green manure herbage management and its digestate from biogas production on barley yield, N recovery, soil structure and earthworm populations. Eur. J. Agron. 2014, 52, 90–102. [Google Scholar] [CrossRef]
  60. Talgre, L.; Lauringson, E.; Roostalu, K.; Astover, A.; Makke, A. Green manure as a nutrient source for succeeding crops. Plant Soil Environ. 2012, 58, 275–281. [Google Scholar] [CrossRef]
  61. Talgre, L. BIOMASS Production of Different Green Manure Crops and Their Effect on the Succeeding Crops Yield. Doctoral Thesis, University of Thartu, Tartu, Estonia, 2013. [Google Scholar]
  62. Kirchmann, H.; Bergström, L.; Kätterer, T.; Andrén, O.; Andersson, R. Can Organic Crop Production Feed the World? In Organic Crop Production—Ambitions and Limitations; Kirchmann, H., Bergström, L., Eds.; Springer: Dordrecht, The Netherlands, 2008; pp. 37–72. [Google Scholar]
  63. Khalifa, T.H.; Mariey, S.A.; Ghareeb, Z.E.; Khatab, I.A.; Alyamani, A. Effect of organic amendments and nano-zinc foliar application on alleviation of water stress in some soil properties and water productivity of barley yield. Agronomy 2022, 12, 585. [Google Scholar] [CrossRef]
  64. Leogrande, R.; Vitti, C.; Castellini, M.; Garofalo, P.; Samarelli, I.; Lacolla, G.; Montesano, F.F.; Spagnuolo, M.; Mastrangelo, M.; Stellacci, A.M. Residual effect of compost and biochar amendment on soil chemical, biological, and physical properties and durum wheat response. Agronomy 2024, 14, 749. [Google Scholar] [CrossRef]
Figure 1. Meteorological data during the vegetation period of winter barley.
Agriculture 15 02145 g001
Figure 2. Agronomical parameters of barley affected by predecessor and fertilization type: yield (A), hectoliter weight (B), thousand-grain weight (C), ear number (D), plant number (E), grain protein content (F). The results represent the means of four replicates. Different letters indicate statistically significant differences between treatments according to the LSD test of ANOVA (p ≤ 0.05). MF—mineral fertilizer; VC—vermicompost; MF+VC—combined application; BCh—biochar.
Agriculture 15 02145 g002
Figure 3. Exported nutrients. The results showed the total quantity of nitrogen (A), phosphorus (B), and potassium (C) exported with the grain yield from each treatment. The bars represent the mean ± standard error (n = 4). MF—mineral fertilizer; VC—vermicompost; MF+VC—combined application; BCh—biochar.
Agriculture 15 02145 g003
Figure 4. Intensity of photosynthesis (A, μmol m−2 s−1), stomatal conductance (Gs, μmol m−2 s−1), and intensity of transpiration (E, μmol m−2 s−1) of barley plants. The results represent the mean ± standard error (n = 5).
Agriculture 15 02145 g004
Figure 5. AWCD of microbial communities after 144 h of incubation at 590 nm. The bars represent the mean, while different letters indicate statistically significant differences between treatments, based on LSD at a significance of p ≤ 0.05.
Agriculture 15 02145 g005
Figure 6. Shannon diversity index of soil microbial communities. The bars represent the mean, while different letters indicate statistically significant differences between treatments, based on LSD at a significance of p ≤ 0.05. MF—mineral fertilizer; VC—vermicompost; MF+VC—combined application; BCh—biochar.
Agriculture 15 02145 g006
Figure 7. PCA of the weight of four factors affecting the studied parameters. SOC—soil organic carbon; BSR—basal soil respiration; DA—dehydrogenase activity; CA—carboxylic acids.
Agriculture 15 02145 g007
Table 1. Treatments used and main macronutrients added to the soil at both experimental fields. MF—mineral fertilizer; VC—vermicompost; MF+VC—mineral fertilizer + vermicompost; BCh—biochar.
TreatmentsConcentration (t ha−1)NPK
(g m−2)
1. Control0000
2. Mineral fertilizer (MF, 15:15:15)0.16.501.501.50
3. Vermicompost (VC)1215.2013.0519.54
4. Mineral fertilizer + vermicompost (MF+VC)0.05 + 610.857.2810.50
5. Biochar (BCh)1013.16.479.5
Table 2. Vermicompost and biochar physicochemical properties on a dry weight basis. Data show mean ± standard error (n = 3).
UnitVermicompostBiochar
TOC(%)17.71 ± 1.365.00 ± 4.23
pH 7.78 ± 0.01-
EC(µS cm−1)1510 ± 12.4-
Total N(%)1.31 ± 0.161.31 ± 0.11
P(%)1.08 ± 0.080.64 ± 0.03
K(%)1.59 ± 0.207.95 ± 0.67
Ca(%)3.11 ± 0.334.28 ± 0.27
Mg(%)0.73 ± 0.083.06 ± 0.27
Fe(%)0.51 ± 0.050.13 ± 0.01
Table 3. Physicochemical parameters of soils in treatments before sowing and at the end of the experiment. The results represent the means of four replicates. Different letters indicate statistically significant differences between treatments. MF—mineral fertilizer; VC—vermicompost; MF+VC—combined application; BCh—biochar. GM—green manure; F—fallow. TOC—total organic carbon; TN—total nitrogen; TP—total phosphorus; TK—total potassium.
pHEC (µS cm−1)TOC (g kg−1)N-NH4 (mg kg−1)N-NO3 (mg kg−1)
GMFGMFGMFGMFGMF
Before sowing8.10 ± 0.05122.2 ± 2.91.04 ± 0.126.48 ± 0.537.05 ± 0.17
Control7.97 c8.21 a130.13 cd123.80 ef1.10 bc1.30 b10.13 a10.13 a13.82 ab16.58 a
MF7.97 c7.99 bc133.37 bc134.63 b0.82 bc0.63 c11.16 a11.90 a10.92 ab10.19 b
VC8.02 bc8.18 a145.77 a145.97 a2.29 a2.39 a9.19 a7.37 a10.07 b9.31 b
MF+VC8.01 bc8.17 a125.30 e130.37 bcd0.88 bc1.03 bc8.29 a9.70 a10.03 b10.49 b
BCh8.07 abc8.12 ab120.97 f127.47 de1.14 bc1.22 bc7.37 a8.29 a11.46 ab9.67 b
S.E. for comp. 0.0672.060.362.342.76
Crit. value comp.0.144.300.744.885.76
TN (mg kg−1)TP (mg kg−1)TK (mg kg−1)Soil humidity (%)
GMFGMFGMFGMF
Before sowing13.52 ± 0.83177.62 ± 12.05298.31 ± 25.7428.4 ± 1.1
Control23.96 ab26.71 a197.59 de272.69 bc292.75 e355.43 cd30.2 bc28.4 bc
MF22.08 abc22.08 abc269.10 bcd357.88 a343.48 d457.60 a28.2 bc23.4 c
VC19.26 bc16.69 c275.50 bc307.75 ab365.48 bcd395.4 bc38.8 a33.4 ab
MF+VC18.32 bc20.20 abc155.06 e165.38 e367.88 bcd400.35 bc35.0 ab32.3 ab
BCh18.82 bc17.96 bc222.81 cde210.13 cde362.8 cd410.65 b31.7 abc29.3 bc
S.E. for comp. 3.5536.5122.541.05
Crit. value comp.7.2474.5646.032.13
Table 4. Photosynthetic pigments content in barley (mg g−1 fresh weight). Different letters indicate statistically significant differences between treatments. chl a—chlorophyll a; chl b—chlorophyll b; chl a+b—chlorophyll a+b; car—carotenoids; chl a/b—chlorophyll a/b; chl a+b/car—chlorophyll a+b/carotenoids. GM—green manure; F—fallow (predecessors).
chl achl bchl a+bcarchl a/bchl a+b/car
GMFGMFGMFGMFGMFGMF
Control1.92 c1.44 c1.92 b0.84 c3.84 b2.29 c1.72 b0.95 b1.00 b1.71 a2.24 b2.41 b
MF3.09 a1.50 c2.01 a0.95 c5.10±a2.45 c2.28 a1.05 b1.54 a1.59 b2.23 b2.33 b
VC1.74 c1.32 c1.73 b0.77 d3.47 c2.09 d1.60 c1.03 b0.99 b1.72 a2.17 c2.03 c
MF+VC2.36 b2.66 a1.6 c1.84 a3.96 b4.51 a1.63 c1.90 a1.47 a1.45 c2.44 b2.37 b
BCh3.07 a2.13 b2.09 a1.44 b5.16 a3.57 b1.81 b0.77 c1.47 a1.48 c2.85 a4.64 a
Table 5. Microbial properties: soil respiration and dehydrogenase activity. GM—green manure; F—fallow.
Soil Respiration
(μg C-CO2 g−1 h−1)
Dehydrogenase Activity (μg TPF g−1 h−1)
GMFGMF
Control2.82 bcd2.25 e0.28 c0.32 bc
MF2.67 d2.70 cd0.34 b0.32 bc
VC4.19 a2.89 bcd0.41 a0.46 a
MF+VC3.15 b2.90 bcd0.36 b0.42 a
BCh3.05 bc2.82 bcd0.28 c0.31 bc
S.E. for comp.0.170.025
Crit. value for comp.0.350.052
Different small letters show statistically significant differences.
Table 6. Substrate group metabolism by the soil communities. Different letters indicate statistically significant differences between treatments in the column. Different colors correspond to the level of activity: blue (low), white (middle), red (high). MF—mineral fertilizer; VC—vermicompost; MF+VC—combined application; BCh—biochar.
FieldsTreatm.AminoacidsAmines & AmidesCharbohydratesCarboxylic AcidsPhenolic CompoundsPolymers
After GMControl2.34 cd1.53 b2.42 a2.21 cd1.13 bc2.68 ab
MF2.58 ab1.60 b2.17 ab2.47 abc1.82 a2.35 bc
VC2.23 d1.15 b1.76 d2.29 bcd1.59 ab2.46 bc
MF+VC2.63 a1.44 b2.06 bc2.46 abc1.53 ab2.28 c
BCh2.32 d1.43 b2.06 bc2.05 d0.82 c2.58 abc
After FallowControl2.62 a2.96 a1.81 cd2.37 bcd2.00 a2.53 bc
MF2.39 bcd1.96 b2.45 a2.60 ab1.63 ab2.91 a
VC2.37 bcd1.60 b2.03 bcd2.30 bcd1.51 ab2.40 bc
MF+VC2.55 abc1.17 b2.10 b2.14 cd1.64 ab2.43 bc
BCh2.72 a1.07 b2.42 a2.80 a1.65 ab2.57 abc
S.E. for comparison0.10.450.140.170.290.18
Critical value for comp.0.220.930.290.370.60.37
Different letters show existing statistically proven difference among treatments. The intense red color shows very good utilization, while the intense blue color demonstrates lowest capacity for it.
Disclaimer/Publisher’s Note: The statements, opinions and data contained in all publications are solely those of the individual author(s) and contributor(s) and not of MDPI and/or the editor(s). MDPI and/or the editor(s) disclaim responsibility for any injury to people or property resulting from any ideas, methods, instructions or products referred to in the content.