Article

Bio-Efficiency of Foliar Herbicides Applied with Drift-Reducing Nozzles

1
Weed Science Unit, Department of Plants and Crops, Faculty of Bioscience Engineering, Ghent University (UGent), 9000 Ghent, Belgium
2
Technology and Food Science Unit, Flanders Research Institute for Agriculture, Fisheries and Food (ILVO), 9820 Merelbeke-Melle, Belgium
3
INAGRO, 8800 Rumbeke-Beitem, Belgium
4
BIOSYST-MeBioS, Department of Biosystems, Katholieke Universiteit Leuven (KU Leuven), 3000 Leuven, Belgium
*
Author to whom correspondence should be addressed.
Agriculture 2025, 15(20), 2115; https://doi.org/10.3390/agriculture15202115
Submission received: 5 September 2025 / Revised: 9 October 2025 / Accepted: 10 October 2025 / Published: 11 October 2025
(This article belongs to the Section Agricultural Technology)

Abstract

The increasing implementation of drift-reduction regulations in agriculture has driven the widespread adoption of drift-reducing spray nozzles. However, concerns remain about their impact on the biological efficacy of foliar-applied herbicides, particularly at early weed growth stages. This study evaluated the bio-efficiency of various drift-reducing flat-fan nozzles across three weed species (Chenopodium album, Solanum nigrum, and Echinochloa crus-galli), two growth stages, and six herbicides differing in mode of action and formulation properties. Dose–response bioassays were conducted using eight nozzle–pressure combinations under controlled greenhouse conditions. Spray characteristics, including droplet size distribution, coverage, contact angle, and surface tension, were quantified to elucidate interactions affecting herbicide efficacy. The results showed that nozzle effects were more pronounced for high-surface-tension formulations and poorly wettable weed targets. Several coarser droplet drift-reducing nozzles (e.g., ID3, APTJ) showed inferior performance in controlling small C. album and S. nigrum targets with bentazon and erectophile E. crus-galli targets with cycloxydim. At the same time, nozzle choice was less critical for tembotrione and nicosulfuron spray solutions, which have low surface tension. Across weed species, growth stages, and herbicides, nozzles producing finer, slower droplets demonstrated superior and more consistent performance compared to those producing larger, faster droplets. These findings offer science-based guidance for selecting nozzle types that balance drift mitigation with effective weed control under current and future regulatory constraints.

1. Introduction

In Northwest Europe, where intensive agricultural systems predominate, effective weed management is essential to safeguard crop yields. Herbicide applications remain a cornerstone of integrated weed management strategies. However, their biological efficacy is highly dependent on achieving uniform and sufficient spray coverage across weed surfaces. Suboptimal application—caused by inappropriate nozzle selection, poor droplet deposition, or adverse environmental conditions—can result in insufficient herbicide uptake, leading to partial control [1]. According to Oerke [2], global potential yield losses due to weeds can reach up to 34%, with estimated losses of 20–30% in major crops such as wheat and sugar beet in Northwest Europe in the absence of weed control. Even under modern management practices, actual yield losses of 5–10% still occur, often due to inconsistencies in application quality. Optimising nozzle performance and spray characteristics is therefore critical to narrowing the gap between potential and actual yields.
However, this objective must also align with the increasingly strict drift-reduction regulations being enforced across Europe. One of the negative side effects of herbicide applications is spray drift [3]. Unintended herbicide drift presents significant environmental and regulatory challenges [4]. Drift, defined as the movement of pesticide droplets, vapours, or particles outside the target area, can contaminate surface and groundwater, affect non-target vegetation, and contribute to the development of herbicide resistance [5,6,7].
To mitigate these risks, regulatory frameworks in the European Union and Flanders have introduced mandatory drift-reduction measures, including the use of drift-reducing nozzles and spraying techniques. Since 2023, a minimum of 75% drift reduction is required for all open-field applications of plant protection products in Flanders, with this threshold increasing to 90% by 2026 [8]. These regulations have driven the adoption of drift-reducing nozzles such as air-induction and pre-orifice nozzles, and drift-reducing technologies such as reduced boom height and nozzle distance, shielded boom, often combined with buffer zones and physical barriers [9]. Drift-reducing nozzles, in particular, have been shown to significantly lower the risk of spray drift [10].
To date, clear guidance on nozzle selection has been lacking, particularly in balancing drift reduction with herbicide efficacy. Growers express increasing concerns that the coarse droplet spectra associated with drift-reducing nozzles may compromise the bio-efficiency, i.e., the effective uptake and action, of foliar herbicides, particularly at early weed growth stages. Herbicide efficacy depends on multiple interacting factors, including droplet retention, coverage, and penetration through the leaf cuticle, all of which may be influenced by nozzle type and spray characteristics [11].
The interaction between herbicide formulation, leaf surface properties, and environmental conditions further complicates this picture. For instance, waxy or hairy leaf surfaces, common in weed species like Chenopodium album L. or Echinochloa crus-galli P. Beauv., reduce droplet spread and herbicide retention, especially for formulations with high surface tension [12,13]. In addition, environmental parameters such as relative humidity, temperature, and wind influence droplet behaviour and herbicide uptake dynamics [14].
While contact herbicides rely on sufficient and uniform spray coverage for localised action, systemic herbicides must be absorbed and translocated within the plant to be effective [1]. Drift-reducing nozzles, which often produce larger droplets and lower coverage, may therefore disproportionately affect contact herbicides more negatively than systemic ones [15,16,17].
This study investigates the bio-efficiency of both contact and systemic foliar herbicides applied through several drift-reducing flat-fan nozzles and a standard flat-fan nozzle, across different weed species and growth stages. The study aims to provide science-based recommendations for sustainable herbicide application under increasingly stringent drift regulations by integrating herbicide dose–response trials with droplet and leaf surface measurements.
The research questions (RQ) investigated were: (RQ1) Is applying foliar herbicides on small weeds less efficient when using drift-reducing nozzles? (RQ2) Which nozzles perform well and consistently over different combinations of foliar herbicides, weed species, and growth stages? (RQ3) Which coverage percentage and droplet size spectrum is required for a bio-efficient application?

2. Materials and Methods

2.1. Dose–Response Experiments

Dose–response experiments were used to investigate the bio-efficiency of eight nozzle type × spray pressure combinations for controlling small weeds. From May to September 2023, three dose–response experiments were carried out, one per weed species (the dicots Chenopodium album L. and Solanum nigrum L., and the monocot Echinochloa crus-galli P. Beauv.). These species were chosen as they are cosmopolitan weeds that are challenging to control, e.g., in vegetable crops or maize (Zea mays L.), and for their contrasting leaf orientations (planophile in S. nigrum and C. album vs. erectophile in E. crus-galli) and leaf surface properties (lipophilic in C. album and E. crus-galli vs. hydrophilic in S. nigrum). Two growth stages were chosen for each species: BBCH10 (cotyledon stage) and BBCH12 (2-leaf stage) for S. nigrum and C. album, and BBCH12 and BBCH14 (4-leaf stage) for E. crus-galli. The weed growth stages correspond to the stages at which herbicides are most commonly applied. Both dicots were treated with two contact herbicides: bentazon (Basagran, 87% a.i., SG, BASF Agricultural Solutions, Waterloo, Belgium) and phenmedipham (Astrix, 160 g L−1, EC, UPL Europe Ltd., Cheshire, UK) and one systemic herbicide tembotrione (Laudis, 44 g a.i. L−1, OD, Bayer Crop Science, Monheim am Rhein, Germany). Echinochloa crus-galli was treated with three systemic herbicides: tembotrione, cycloxydim (Focus plus, 100 g a.i. L−1, EC, BASF Agricultural Solutions, Waterloo, Belgium), and nicosulfuron (Samson Extra 60, 60 g a.i. L−1, OD, ISK Biosciences Europe, Machelen, Belgium) (Table 1). Each herbicide was applied in seven doses (Table 1) and compared with a control. The dose ranges allowed for the successful fitting of dose–response curves in preliminary experiments.
Eight different nozzle type-spray pressure combinations were used to apply the herbicide solutions (Table 2, Figure 1). The nozzles consisted of two ISO 025 and six ISO 03 flat-fan nozzles, representing a wide range of droplet size spectra varying from fine to coarse. The herbicides were applied in an automated spray cabinet (Demtec, Moorslede, Belgium) with one stationary nozzle mounted 50 cm above the pot surface. The conveyor belt speed was changed per nozzle type × spray pressure combination to keep the spray volume constant at 240 L ha−1 in the central 10 cm zone beneath the nozzle (Table 2). This 10 cm zone corresponds to the pot’s position during spraying and was derived from spray distribution measurements with a distribution bench [18].
Each experiment followed a completely randomised design with three factors: herbicide, nozzle–pressure combination, and plant growth stage. Treatments consisted of all factorial combinations of these factors and were randomly assigned to experimental units, consisting of individual plastic pots (9 cm diameter, 0.28 L), with three replicates per treatment. Randomisation was performed independently for each replicate to ensure unbiased allocation and minimise positional effects. For spray coverage analysis (see Section 2.2.3), an additional set of 48 pots per weed species (2 growth stages × 8 nozzle–pressure combinations × 3 replicates) was established and grown under the same conditions.
Regarding pot preparation and plant growth, each pot was filled with steamed sandy loam containing 2.6% organic matter, 10.0% clay, 46.7% silt, and 43.3% sand, with a pHKCl of 5.5. Pots were sown with 50 seeds at a depth of 2 mm and thinned after germination to five uniform plants for S. nigrum and C. album or six for E. crus-galli (Table 3). The seeds were collected from local populations of each species, harvested from at least 100 plants in an organic field. Day- and night-time mean temperature and humidity values during the experimental periods are given in Table 4.

2.2. Measurements

2.2.1. Plant Response

In all three experiments, the foliage dry biomass per pot was measured and used in the dose–response analysis. At harvest, all living plants in each pot were clipped at the soil surface, pooled, and dried for 16 h at 75 °C (Table 3). Afterwards, the foliage dry biomass was weighed per pot.

2.2.2. Droplet Size and Velocity Characteristics

The diameter (μm) and velocity (m s−1) of droplets produced by each nozzle-pressure combination were measured using an Oxford VisiSize N60 (Oxford Lasers Ltd., Oxfordshire, UK) device located at ILVO (Flanders Research Institute for Agriculture, Fisheries and Food, Belgium). This setup, which comprises a laser and a high-resolution, high-framerate camera, allows for analysing ultra-fast, micron-scale droplets and particles using shadowgraphy. The droplets were identified and measured using Particle/Droplet Image Analysis (PDIA), an image-based sizing technique using an automated processing algorithm for analysing digital images of two-phase flows [19]. The droplets passing in the field of view (FOV) between the camera and the high-intensity pulsing light source are recorded as shadows. From the images, the image analysis software VisiSize 6.5.47 identifies the droplets and quantifies their diameter and shape (in one frame), as well as their velocity and flight angle (in two consecutive frames). The selected lens and magnitude resulted in a FOV of 10965 µm × 6246 µm. The characteristics were measured 50 cm below the nozzle and within the central 7 cm zone of the spray plume. This central zone contributes to the spray deposition on the pot plants passing underneath the nozzle. All measurements were conducted along the horizontal long axis of the spray plume, as described by Nuyttens et al. [20]. At least 10,000 droplets were sampled per scan. Pure tap water was used to (i) prevent interference between spray settings and formulations, (ii) avoid contamination of equipment and workspace, and (iii) ensure intercomparability with other studies, as prescribed by ISO 25358:2018 [21]. While absolute droplet values may be slightly affected, the relative ranking of nozzles—and thus correlations with herbicide efficacy—remains valid. Each nozzle-pressure combination was measured three times.
The following volumetric-based parameters were used for data interpretation: Dv0.1, Dv0.5, Dv0.9, and V150. The Dv0.1 and Dv0.9 are the diameters at which 10% and 90% of the droplet volume are contained in droplets at or below that diameter, respectively. Dv0.5, also called the volume median diameter (VMD), is the diameter at which 50% of the volume is contained in either larger or smaller droplets. The V150 is the percentage of the spray volume contained in droplets with a diameter below 150 μm (so-called driftable fines). The vv0.50 represents the droplet velocity below which 50% of the total droplet volume is contained. Additionally, the following number-based parameters were also used for data interpretation: Dn0.5, being the droplet diameter at which 50% of the number of droplets have a diameter at or below this diameter, and N150 being the percentage (%) of droplets smaller than 150 μm. Finally, the average droplet velocity was also determined (m s−1). The vn0.50 is the droplet velocity below which 50% of the droplets travel.

2.2.3. Spray Coverage Characteristics

For each nozzle-pressure combination, spray coverage (%), impact number density (number of droplet impacts per cm2), and mean droplet impact size (mm2) were measured on water-sensitive paper (WSP) using image analysis. Per combination, 10 WSPs (26 mm × 76 mm, Syngenta Crop Protection AG, Basel, Switzerland) were sprayed with pure tap water at a fixed spray volume of 240 L ha−1. Each WSP was positioned horizontally on top of a metal plate on the pot surface. After spraying, WSPs were allowed to dry, collected, and digitised at 2400 dpi. The image was analysed in ImageJ (Version 1.54 g) using the “colour threshold” and “analyse particles” functions to calculate the total blue area/pixels (i.e., the areas affected by droplets). The used settings are given in Table 5. The spray coverage of each WSP was calculated by dividing the total blue area by the total surface area.
Additionally, spray coverage was measured on the plant leaves of the different weed species and stages for each nozzle-pressure combination. Each plant stage of the three weed species was treated the day before the herbicide application. Pots with plants (see Section 2.1) were treated with a spray solution containing 8.4% kaolin clay (Surround WP Crop Protectant, 950 g kg−1 kaolin, WP, Tessenderlo Group, Overpelt, Belgium). After drying, this kaolin solution leaves white spots on the leaves. Afterwards, the leaves of ten plants were clipped and digitised at 2400 dpi. Analysis of the images was carried out in ImageJ in the same way as the WSP. Threshold values are given in Table 5. The spray coverage on each leaf was calculated by dividing the total white area by the total leaf area.

2.2.4. Contact Angle

The contact angle represents the internal angle formed between the droplet surface and the leaf surface. It reflects the balance of forces between the liquid’s surface tension and the leaf surface’s properties. This angle provides information about leaf wettability. A smaller contact angle indicates better spreading (or more wetting), while a larger angle indicates less spreading (or less wetting). The contact angle was measured for both growth stages of the three weed species and four doses of the three herbicides. The first, fourth, sixth, and eighth doses (Table 1) were measured for bentazon and phenmedipham on S. nigrum, while the first, third, fifth, and seventh doses were measured for all other species × herbicide combinations. The contact angle was calculated using a Krüss drop shape analysis system (DSA 10 Mk2, Krüss GmbH, Hamburg, Germany). Individual leaves were cut at the petiole, or the base of the leaf blade in the case of E. crus-galli, and positioned flat on the measuring plate by attaching their underside to one side of a double-sided adhesive tape. This positioning procedure was necessary to ensure standardised and repeatable conditions for contact angle measurements. A 7–8 µL droplet of the herbicide solution was placed on the leaf using a Hamilton syringe. The contact angle was measured using the “contact angle” function with “sessile drop fitting” as the selected calculation method for the contact angle in the software (DSA1.80, Krüss GmbH, Hamburg, Germany).

2.2.5. Surface Tension

The surface tension of the spray solution affects the contact angle of the spray droplet. The lower the surface tension, the smaller the contact angle, and the greater the spreading of the spray droplets on the leaf [22]. The surface tension (mN m−1) was determined using the Wilhelmy plate method [23]. All glassware and the Wilhelmy plate were cleaned with sulfochromic acid and rinsed seven times with demineralised water to eliminate any potential surface contaminants prior to measurement. Surface-active impurities, including minerals and organic matter, can significantly alter the wettability of the plate and thereby distort the accuracy of surface tension measurements. The measured spray solutions are identical to those used in the dose–response experiments. The bentazon-based solutions also contained 3.38 g L−1 methylated rapeseed oil (Actirob) as in the dose–response experiments. The Wilhelmy plate was submerged three times in the solution by lifting and lowering the beaker with the herbicide solution. After the third time, the beaker was lowered until only the edge of the plate touched the surface. The scale was set to zero, and the herbicide solution was lowered until the plate no longer touched the surface. The resulting negative mass reading, caused by the upward meniscus force acting on the plate, was used in Equation (1) to calculate the surface tension.
Equation (1): Formula for the calculation of the surface tension: weight (m; kg), gravitational acceleration (g; m s−2), contact angle (ϑ; °), and the circumference of the plate (l; m) [23].
γ = m · g cos ( ϑ ) · l

2.3. Statistical Analysis

All data (dry biomass, spray coverage, contact angle, surface tension, and droplet characteristics) were analysed in R version 4.3.1 [24]. Normality and homoscedasticity were checked with a quantile-quantile plot and a Levene test. No data transformation was required.
The foliage dry biomass was analysed using the ‘drc’ package [25]. Dose–response curves were calculated according to Streibig et al. [26] for each factorial combination of herbicide, weed species, and growth stage separately. Within each combination, all eight nozzle-pressure combinations were simultaneously fitted. Model selection (log-logistic or Weibull) was based on the Akaike information criterion (AIC) value, the model fit, and the standard error of the effective doses. The ED90 (i.e., the effective dose required for a 90% biomass reduction) was calculated, as were the selectivity indices (SI), which indicate the relative potencies between two dose–response curves. The SI was used to compare the relative differences between ED90 doses of different curves to evaluate the performance of different nozzle-pressure combinations. Compared to an application with a low ED90 response, an application with a high ED90 response requires a higher dose to obtain the same efficacy level of 90% biomass reduction and is hence less bio-efficient.
One-way ANOVAs were conducted to evaluate the effect of the nozzle-pressure combination on droplet size and velocity characteristics. Differences between group means were analysed using the Tukey test at p < 0.05 (with a 95% confidence level). The same analysis was performed on data of spray coverage (determined on WSP and plant leaves), contact angle, and surface tension.

3. Results

3.1. Dry Biomass Reduction

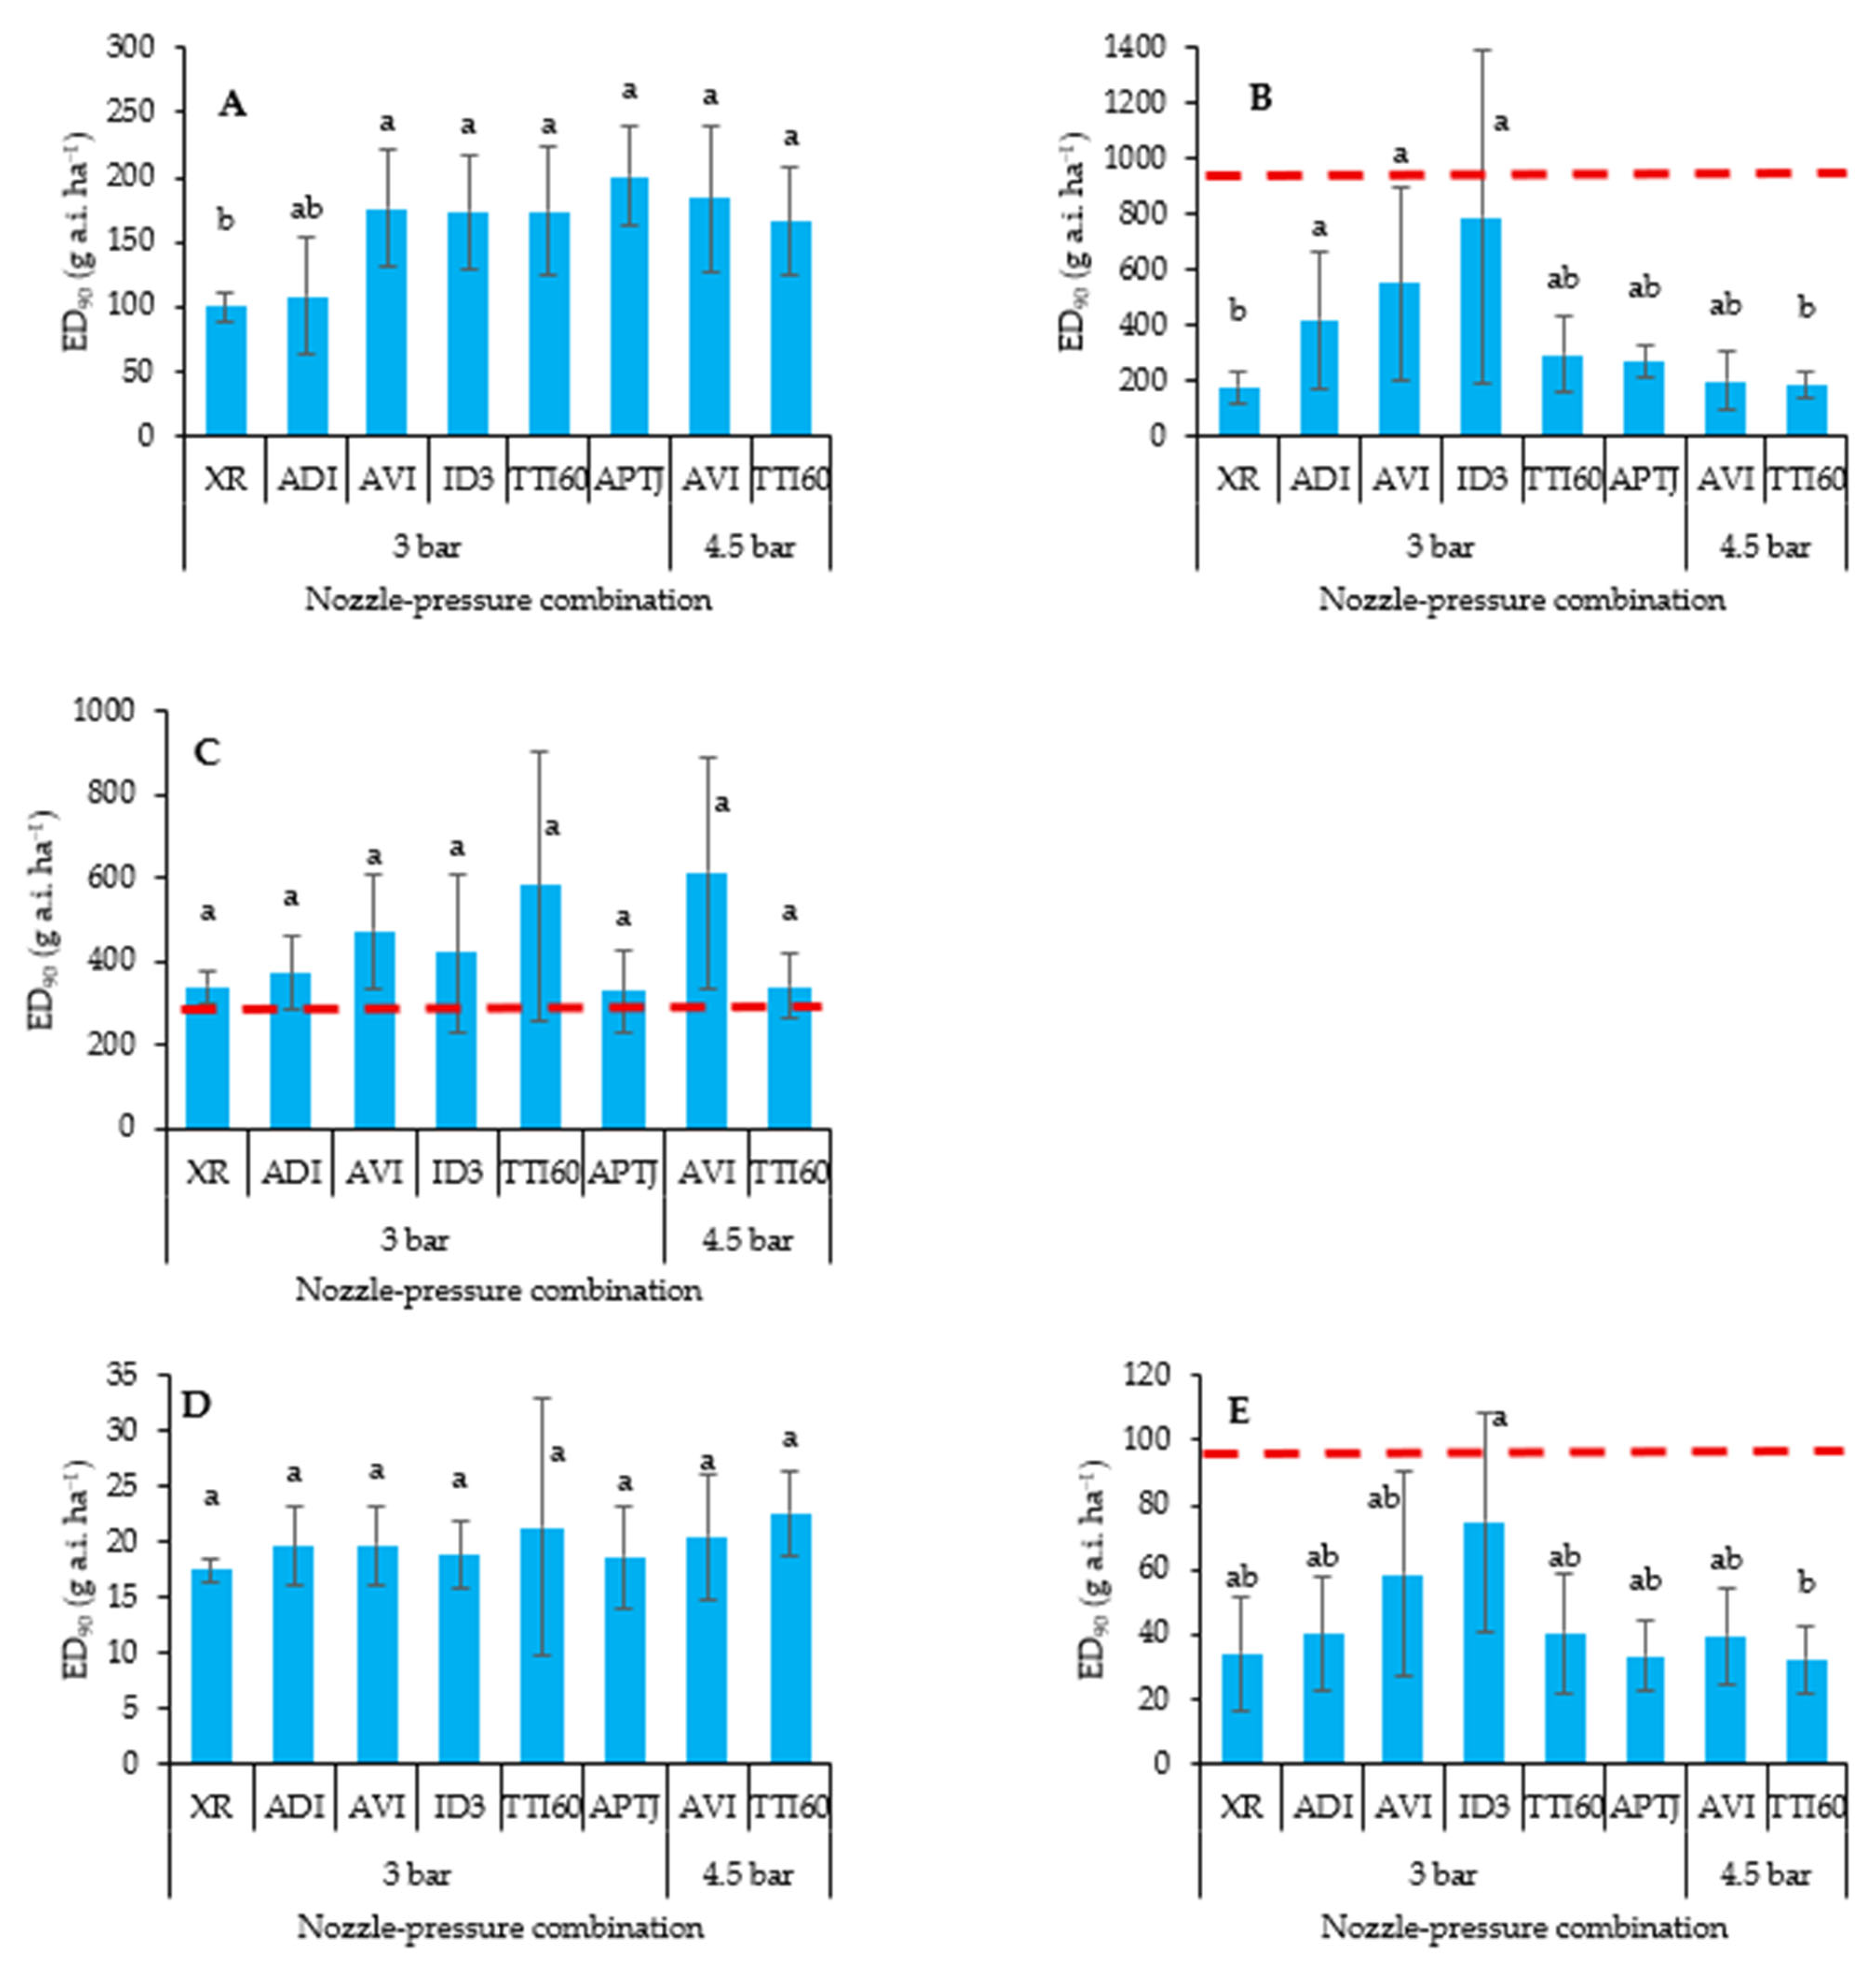
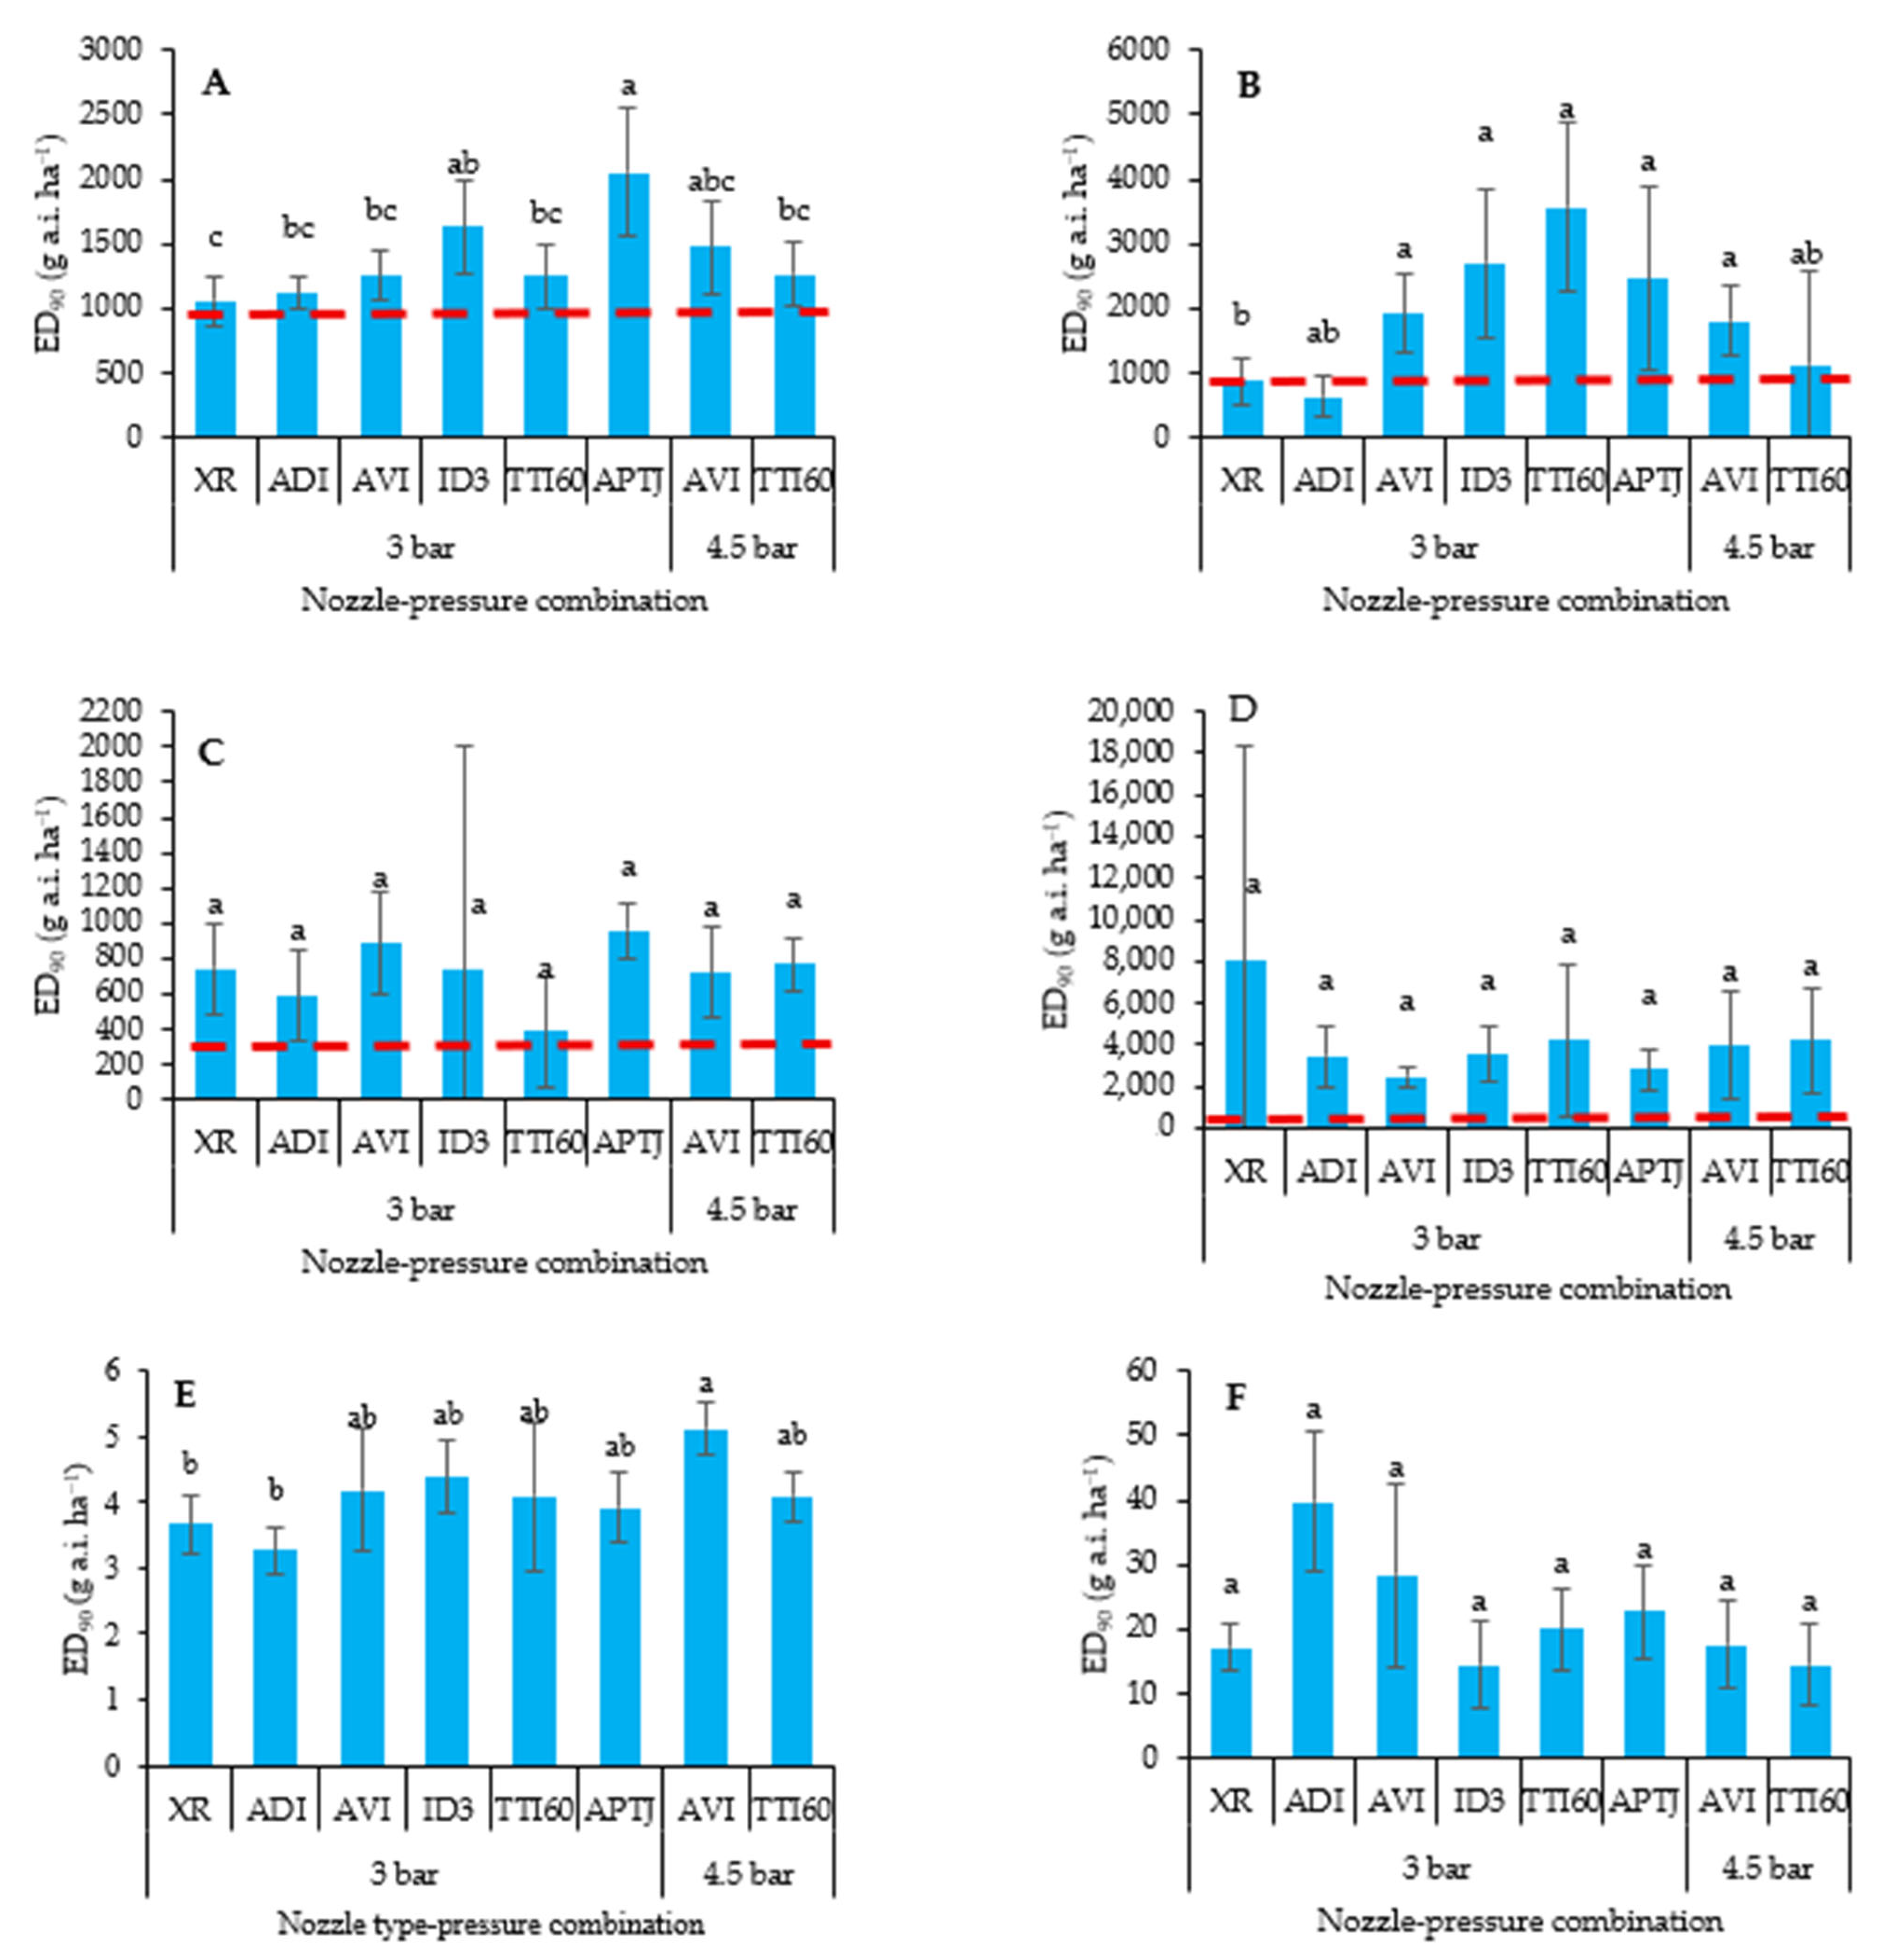
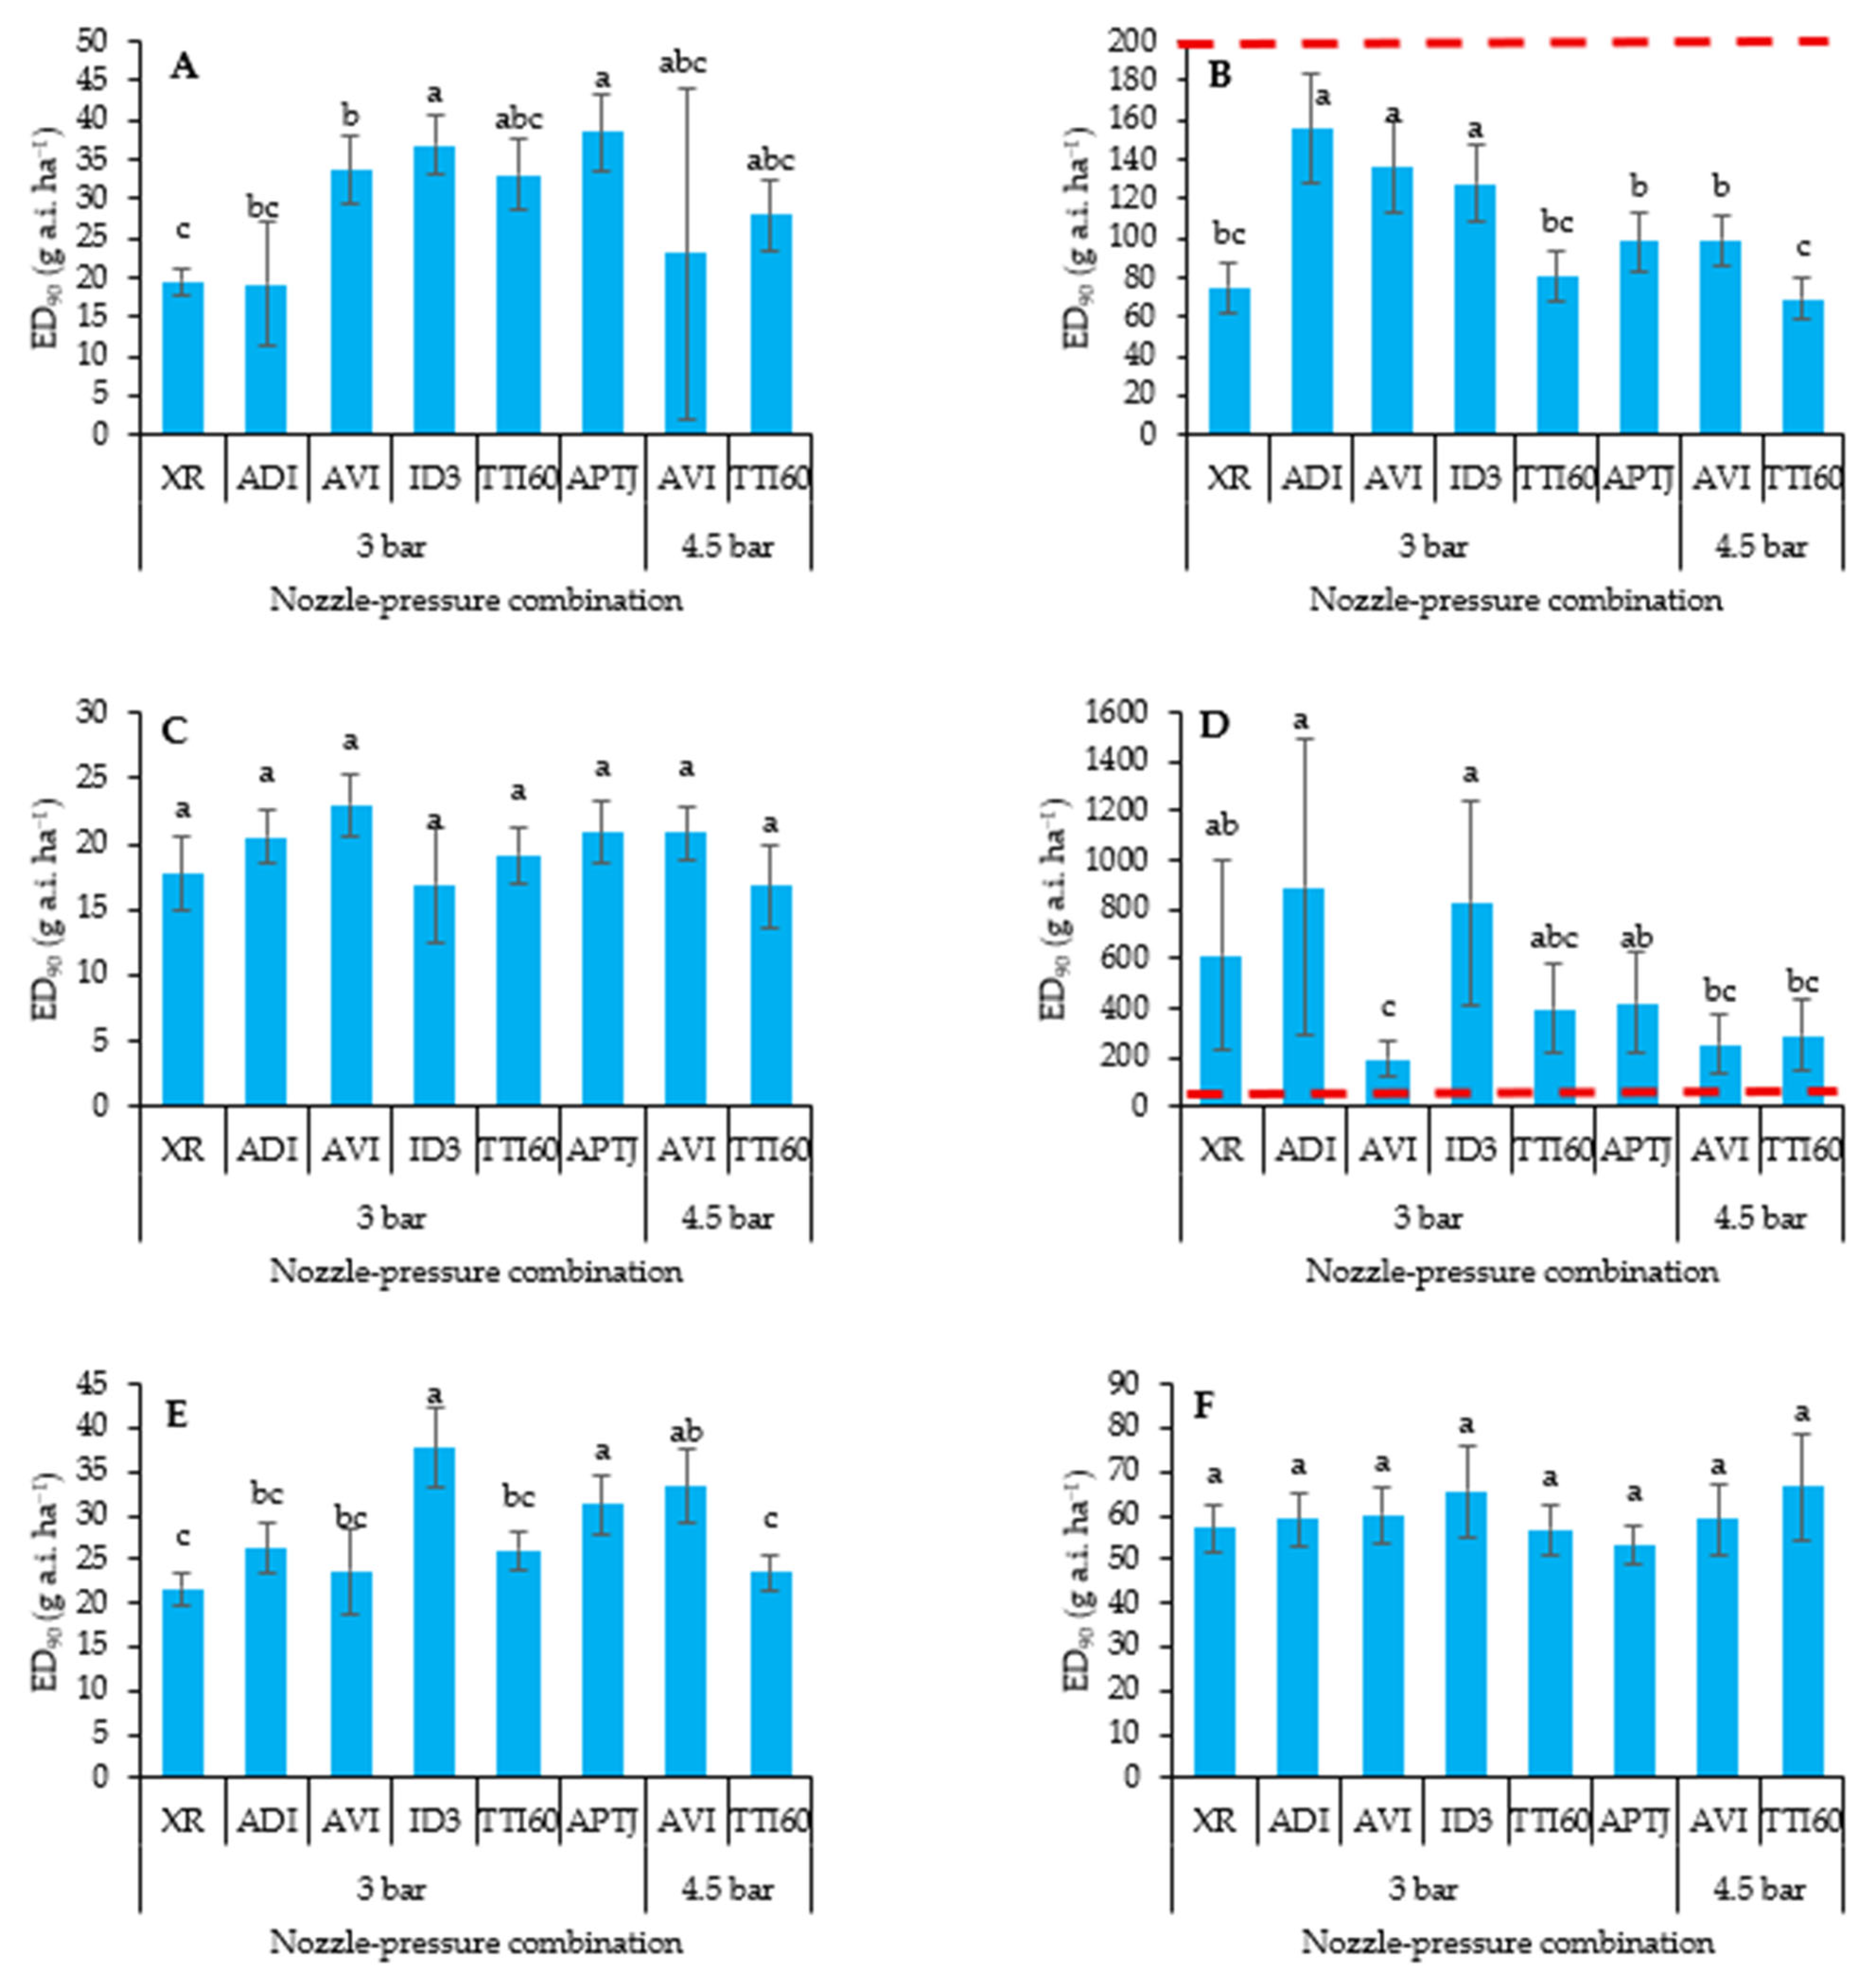
Figure 2, Figure 3 and Figure 4 illustrate the ED90 values obtained for C. album and S. nigrum treated with bentazon, phenmedipham, and tembotrione, and for E. crus-galli treated with cycloxydim, nicosulfuron, and tembotrione. These values were evaluated at two growth stages and with eight different nozzle-pressure combinations. Unless otherwise stated, all applications were performed at a spray pressure of 3.0 bar.
For C. album (Figure 2), the XR nozzle consistently resulted in the lowest ED90 values across both BBCH10 and BBCH12 stages. The ADI nozzle showed no statistically significant differences from XR in any treatment, except for BBCH12 stage plants treated with bentazon. When bentazon was applied, significant nozzle effects were observed at both growth stages. At BBCH10, XR outperformed all drift-reducing nozzles except ADI, with the APTJ nozzle requiring double the dose (2.0× ED90) compared to XR. At BBCH12, XR remained significantly more efficient than ADI, AVI, and ID3, with ED90 values for these nozzles being 2.3, 3.1, and 4.4 times higher than XR, respectively, with all nozzles remaining below the labelled field dose. No significant differences were found between nozzles in the phenmedipham treatments of C. album at BBCH10, although the ED90 values consistently exceeded the labelled field dose. At BBCH12, a dose–response model could not be fitted due to insufficient control (<50%). For tembotrione applications, no significant nozzle-related differences in ED90 were detected, regardless of growth stage, except between TTI60 at 4.5 bar and ID3 at BBCH12.
For S. nigrum (Figure 3), bentazon treatments revealed significant differences at both stages. At BBCH10, the XR nozzle demonstrated significantly better performance than ID3 and APTJ, which required 1.5 and 1.9 times higher ED90 values, respectively. At BBCH12, XR achieved significantly lower ED90 values compared to AVI (3.0 and 4.5 bar), TTI60, ID3, and APTJ, which had ED90 values 2–4 times higher than XR. Air-induction nozzles, particularly TTI60 and ID3, consistently exhibited the highest ED90 values.
As with C. album, phenmedipham applications in S. nigrum yielded no significant nozzle effects, though the ED90 values again exceeded the authorised field dose. For tembotrione applications, XR performed significantly better than AVI at 4.5 bar at BBCH10, but all ED90 values remained well below the field rate. At BBCH12, no significant differences in ED90 were observed between nozzles.
For E. crus-galli (Figure 4), cycloxydim applications at BBCH12 revealed significantly higher ED90 values for AVI, ID3, and APTJ than for XR (1.7, 1.9, and 2.0 times, respectively). Similar patterns were observed at BBCH14, where ADI, AVI, and ID3 showed 2.1, 1.8, and 1.7 times higher ED90 values than XR, with ADI performing the worst. Nicosulfuron treatments showed no significant nozzle effects at BBCH12, but at BBCH14, AVI achieved the best performance, with an ED90 only 0.3 times that of XR. For BBCH12 plants treated with tembotrione, applications with APTJ, AVI (4.5 bar), and ID3 showed 1.4, 1.5, and 1.7 times higher ED90 values relative to XR. No significant nozzle-related differences in ED90 were detected at BBCH14.

3.2. Droplet Size and Velocity Characteristics

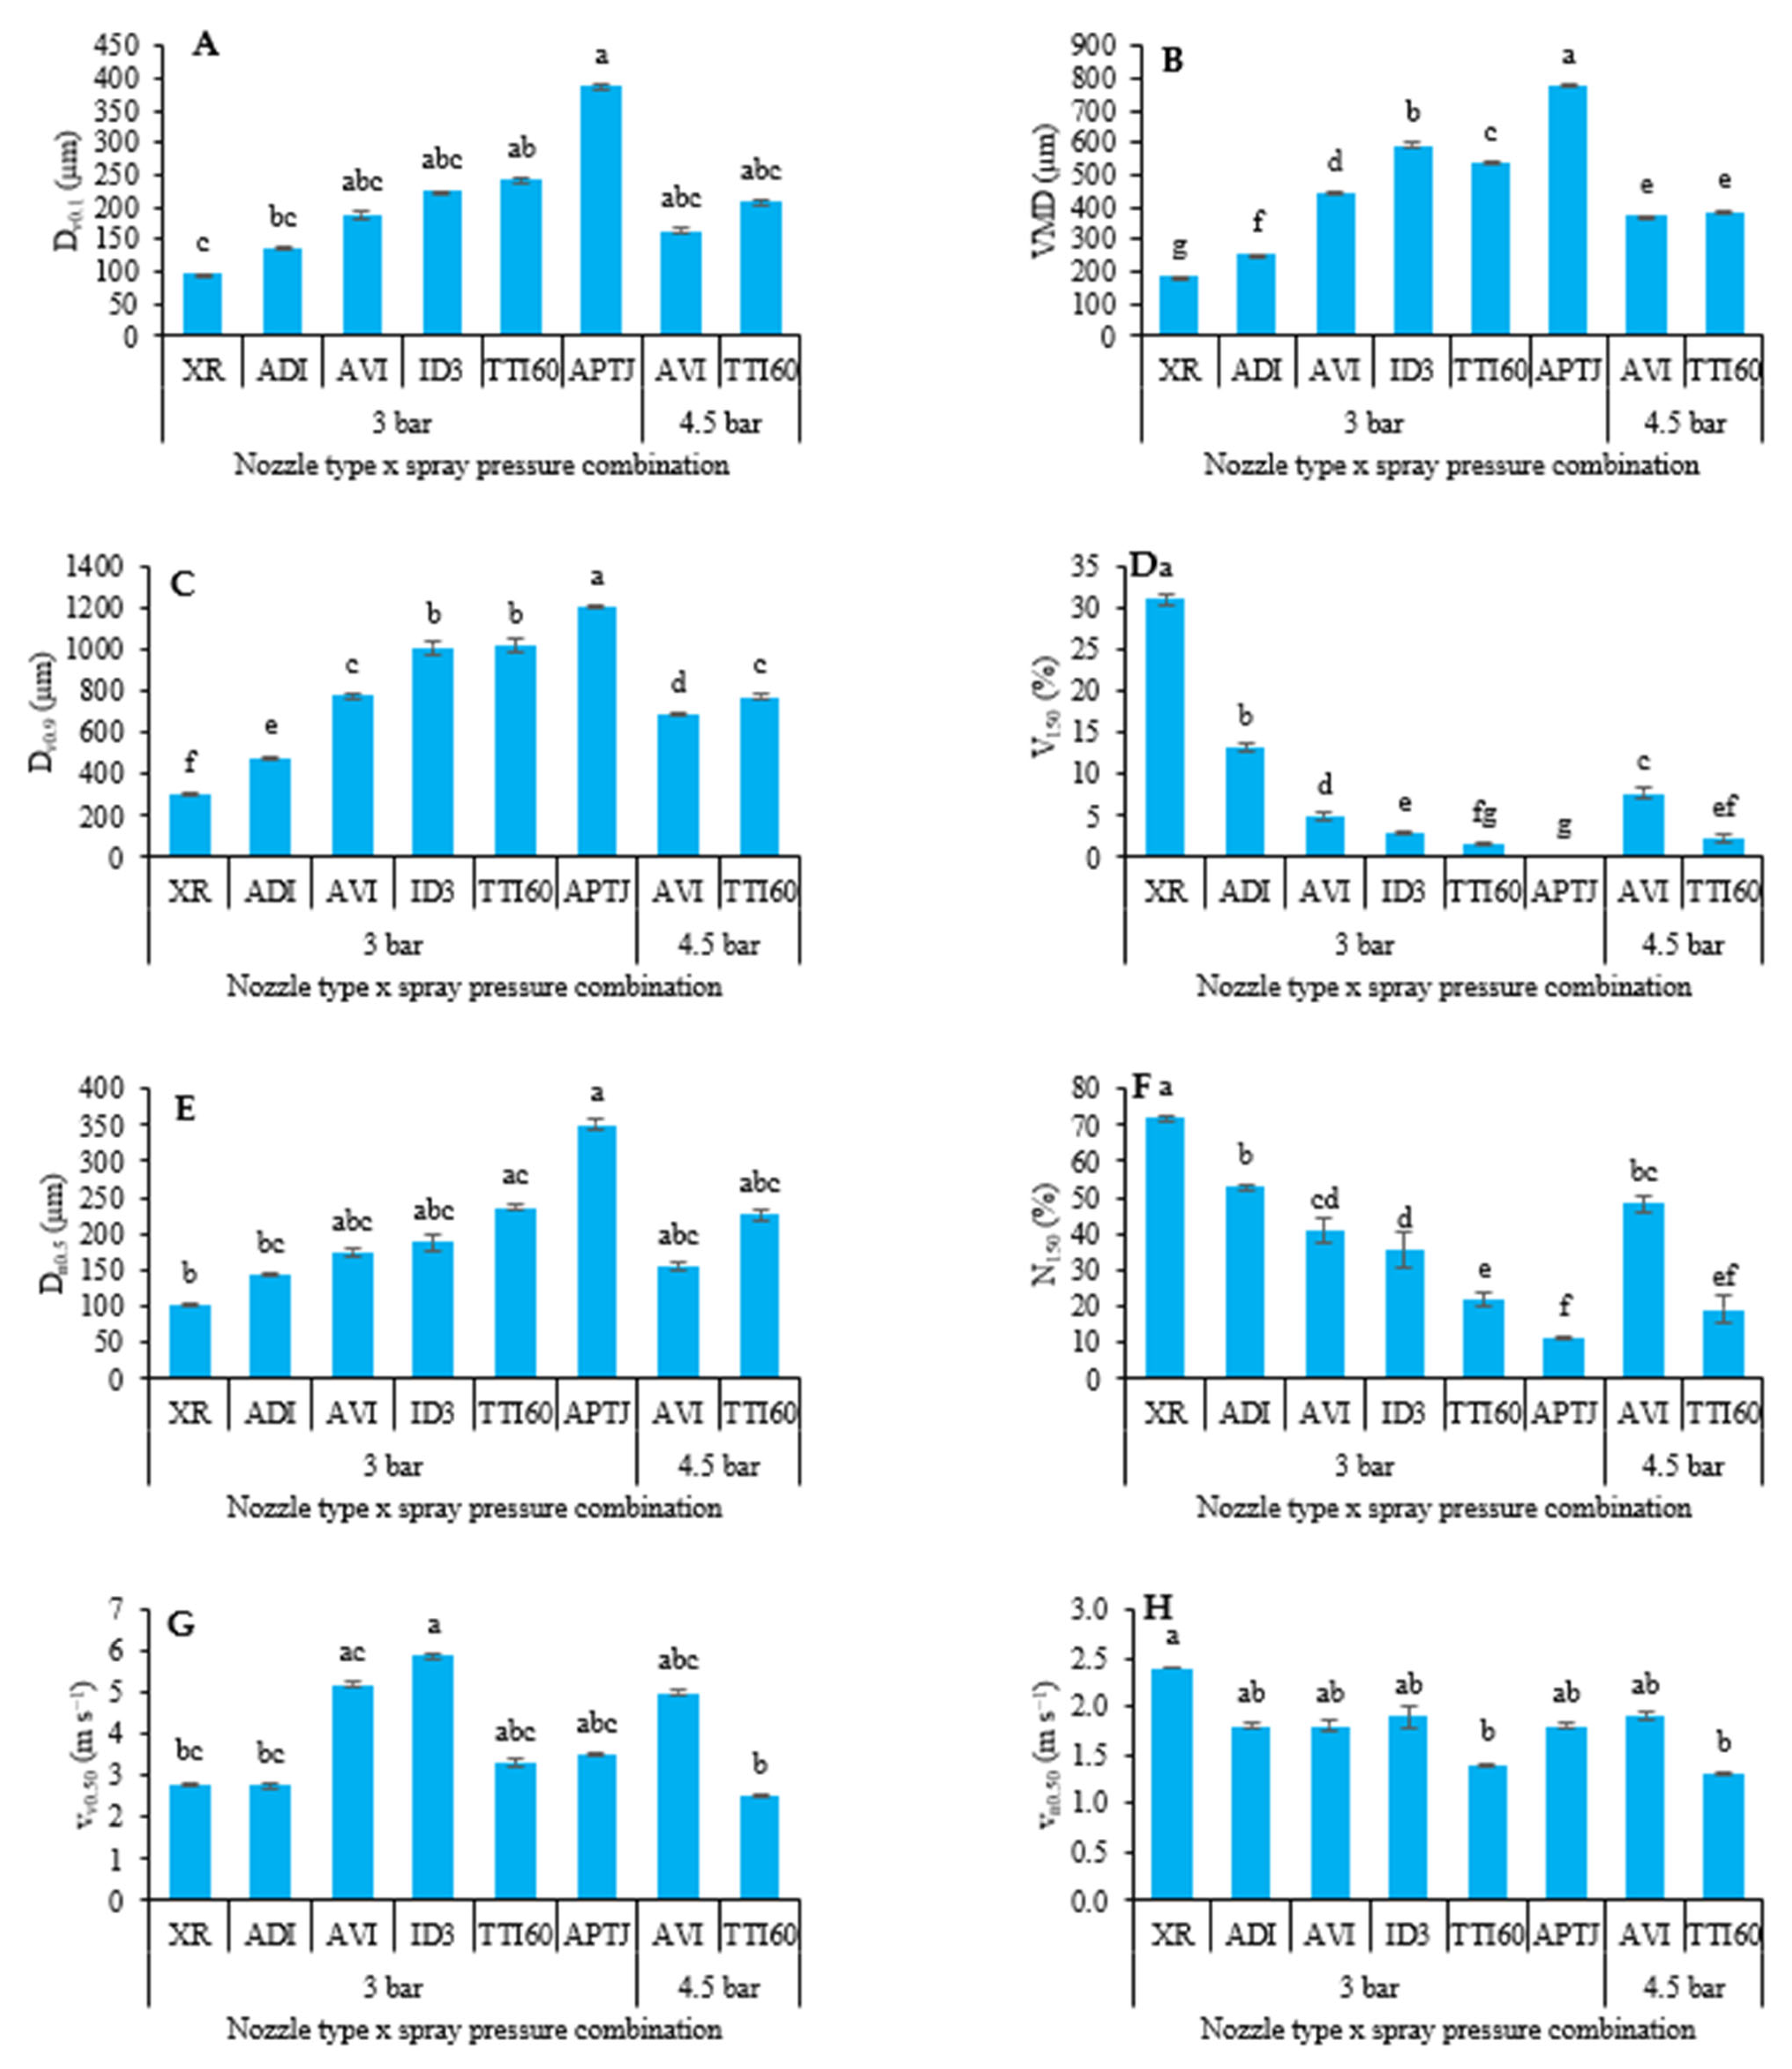
Significant differences in droplet size distribution were observed across nozzle-pressure combinations (Figure 5). The XR nozzle produced the finest spray (VMD = 183.6 µm), while the ID3 and APTJ nozzles generated the coarsest sprays (VMD 591.8 and 778.6 µm, respectively). This trend was also reflected in other droplet size parameters: XR exhibited the lowest values for Dv0.1, Dv0.9, and Dn0.5. All drift-reducing nozzles showed significantly higher Dv0.9 values compared to XR, with APTJ presenting the highest values (3.99 times greater Dv0.9 relative to XR). Dn0.5 was also significantly higher for TTI60 (2.3×) and APTJ (3.42×) relative to XR.
Droplet velocity measurements indicated that the volumetric median velocity (vv0.50) was significantly higher for ID3 than XR, by a factor of 2.19. The numerical median velocity (vn0.50) was significantly greater for XR than for TTI60 at both 3.0 and 4.5 bar, with values 1.73 and 1.77 times higher, respectively.
The proportion of driftable fine droplets (V150) was greatest for XR and lowest for APTJ and TTI60 at 4.5 bar. Both the volume-based (V150) and number-based (N150) fractions of fine droplets were significantly lower for all drift-reducing nozzles compared to XR. Specifically, XR produced an N150 that was 6.3 and 3.8 times higher than that of APTJ and TTI60 (4.5 bar), respectively. In terms of volume, the V150 for XR was 139.4 times higher than that of APTJ and 20.4 times higher than that of TTI60.

3.3. Spray Coverage

3.3.1. Spray Coverage on WSP

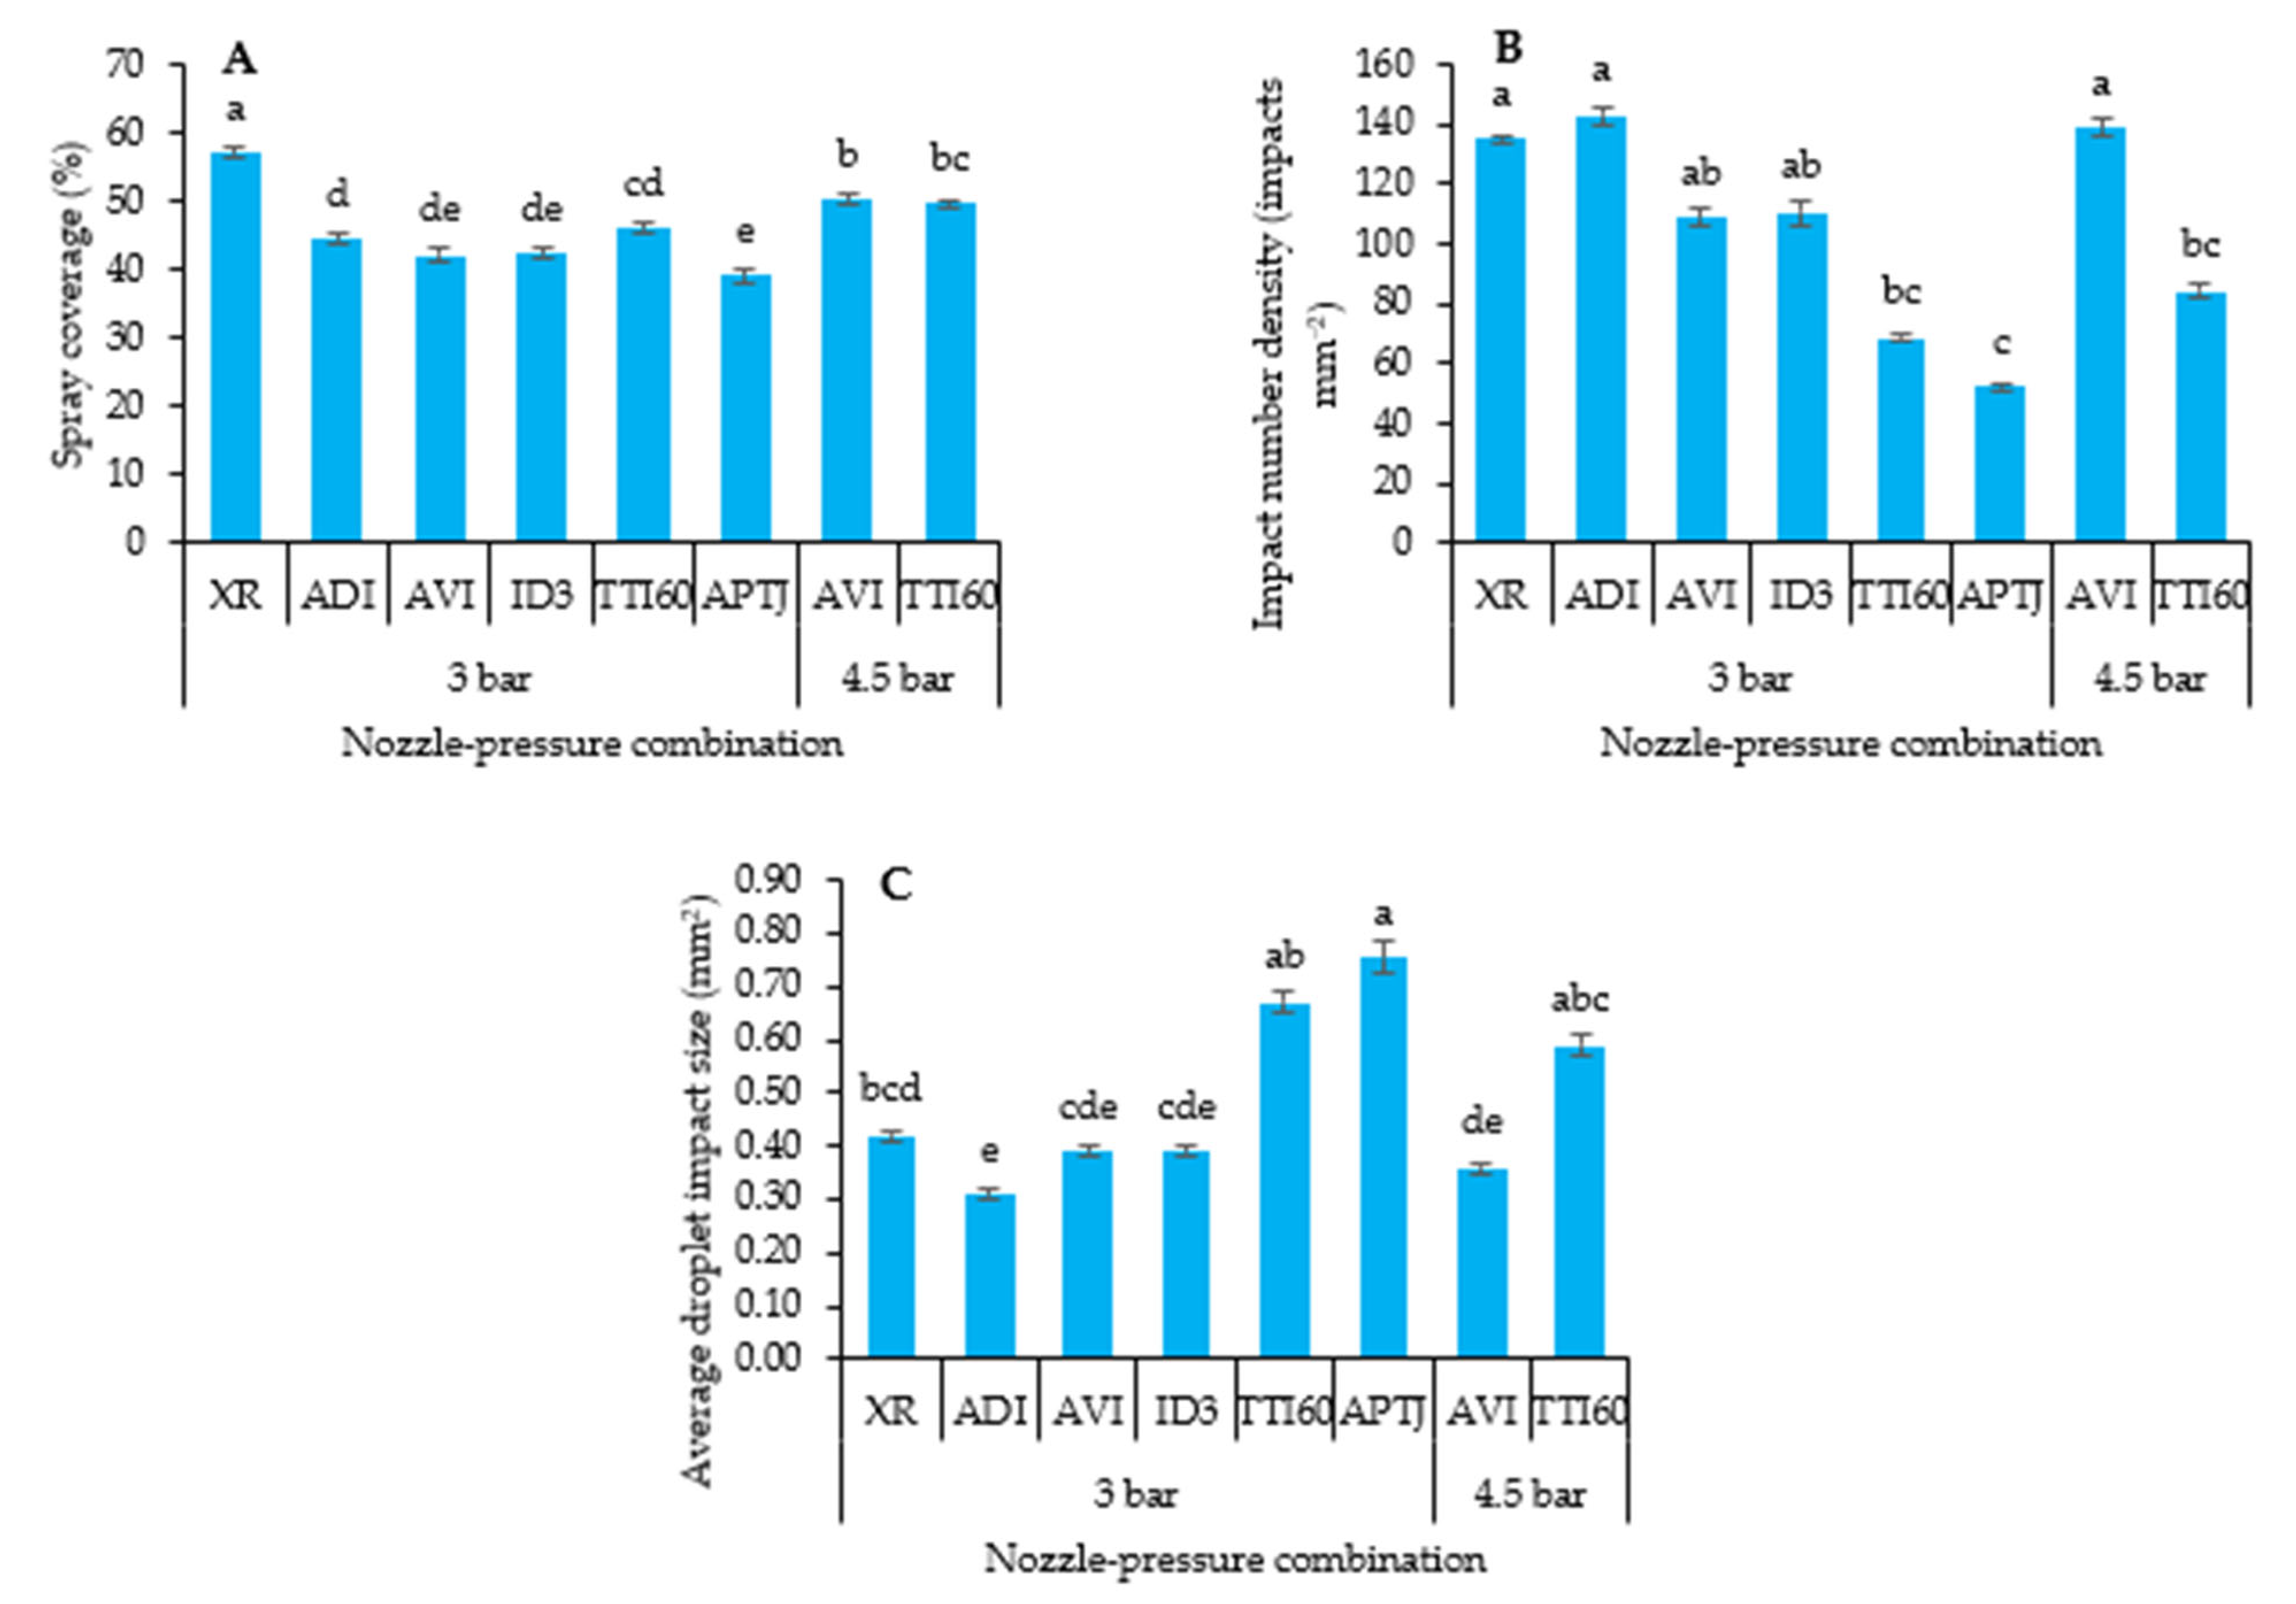
Spray coverage characteristics for each nozzle × pressure combination are presented in Figure 6. The XR nozzle produced the highest coverage on WSP, with significantly greater coverage compared to all drift-reducing nozzles. In contrast, the AVI, ID3, and APTJ nozzles resulted in the lowest overall coverage.
Droplet impact size was largest for the APTJ nozzle, with a mean size 1.78 times larger than that observed for XR. The ADI nozzle showed the smallest impact size, measuring 0.78 times that of XR. The highest droplet impact density was recorded for the XR, ADI, and AVI (4.5 bar) nozzles. At the same time, the APTJ produced the lowest density, with an average impact count of only 38% of that recorded for XR.

3.3.2. Kaolinite Spray Coverage on Plant Leaves

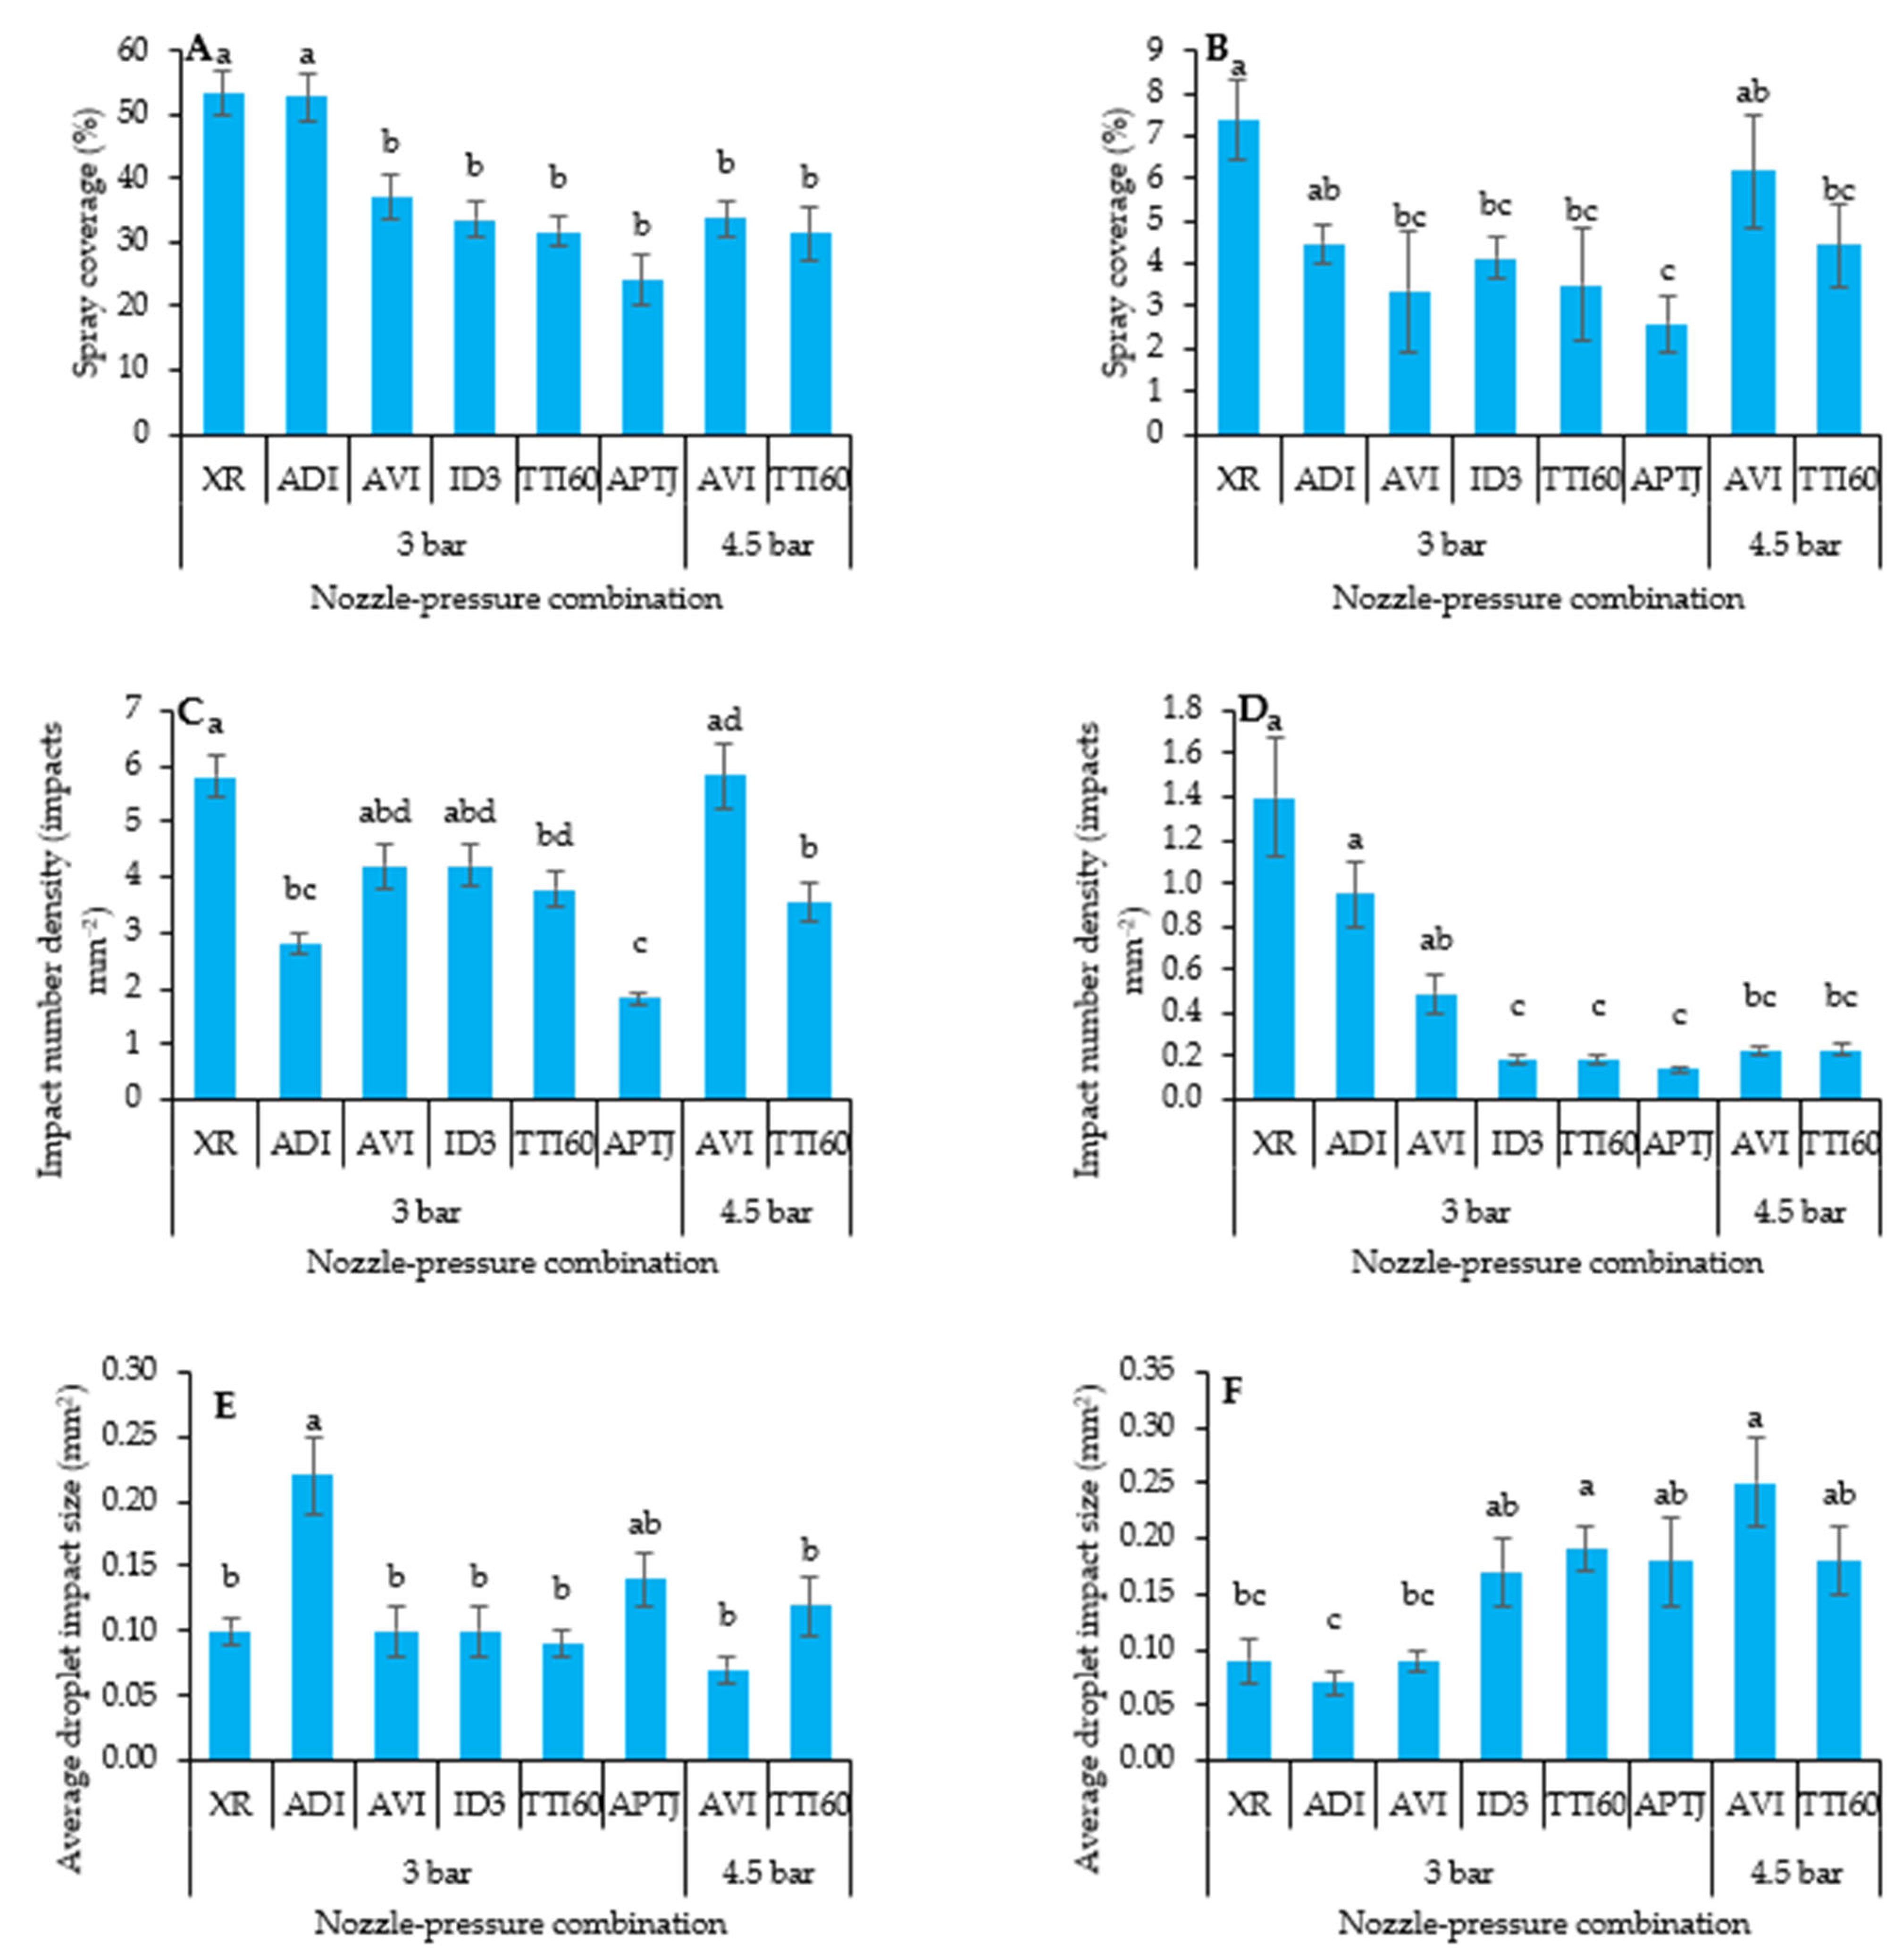
At the BBCH10 stage of C. album, the highest kaolinite spray coverage was observed with the XR and ADI nozzles (Figure 7), while no significant differences were found among the remaining nozzles. At BBCH12, coverage was significantly greater with XR and lowest with APTJ.
Droplet impact size at BBCH10 was significantly larger for the ADI nozzle compared to air-induction nozzles (AVI at 3.0 and 4.5 bar, ID3, and TTI60) and XR, which did not differ significantly from each other. At BBCH12, the largest impacts were recorded for AVI at 4.5 bar and TTI60, which significantly exceeded the impact size of XR, ADI, and AVI at 3 bar.
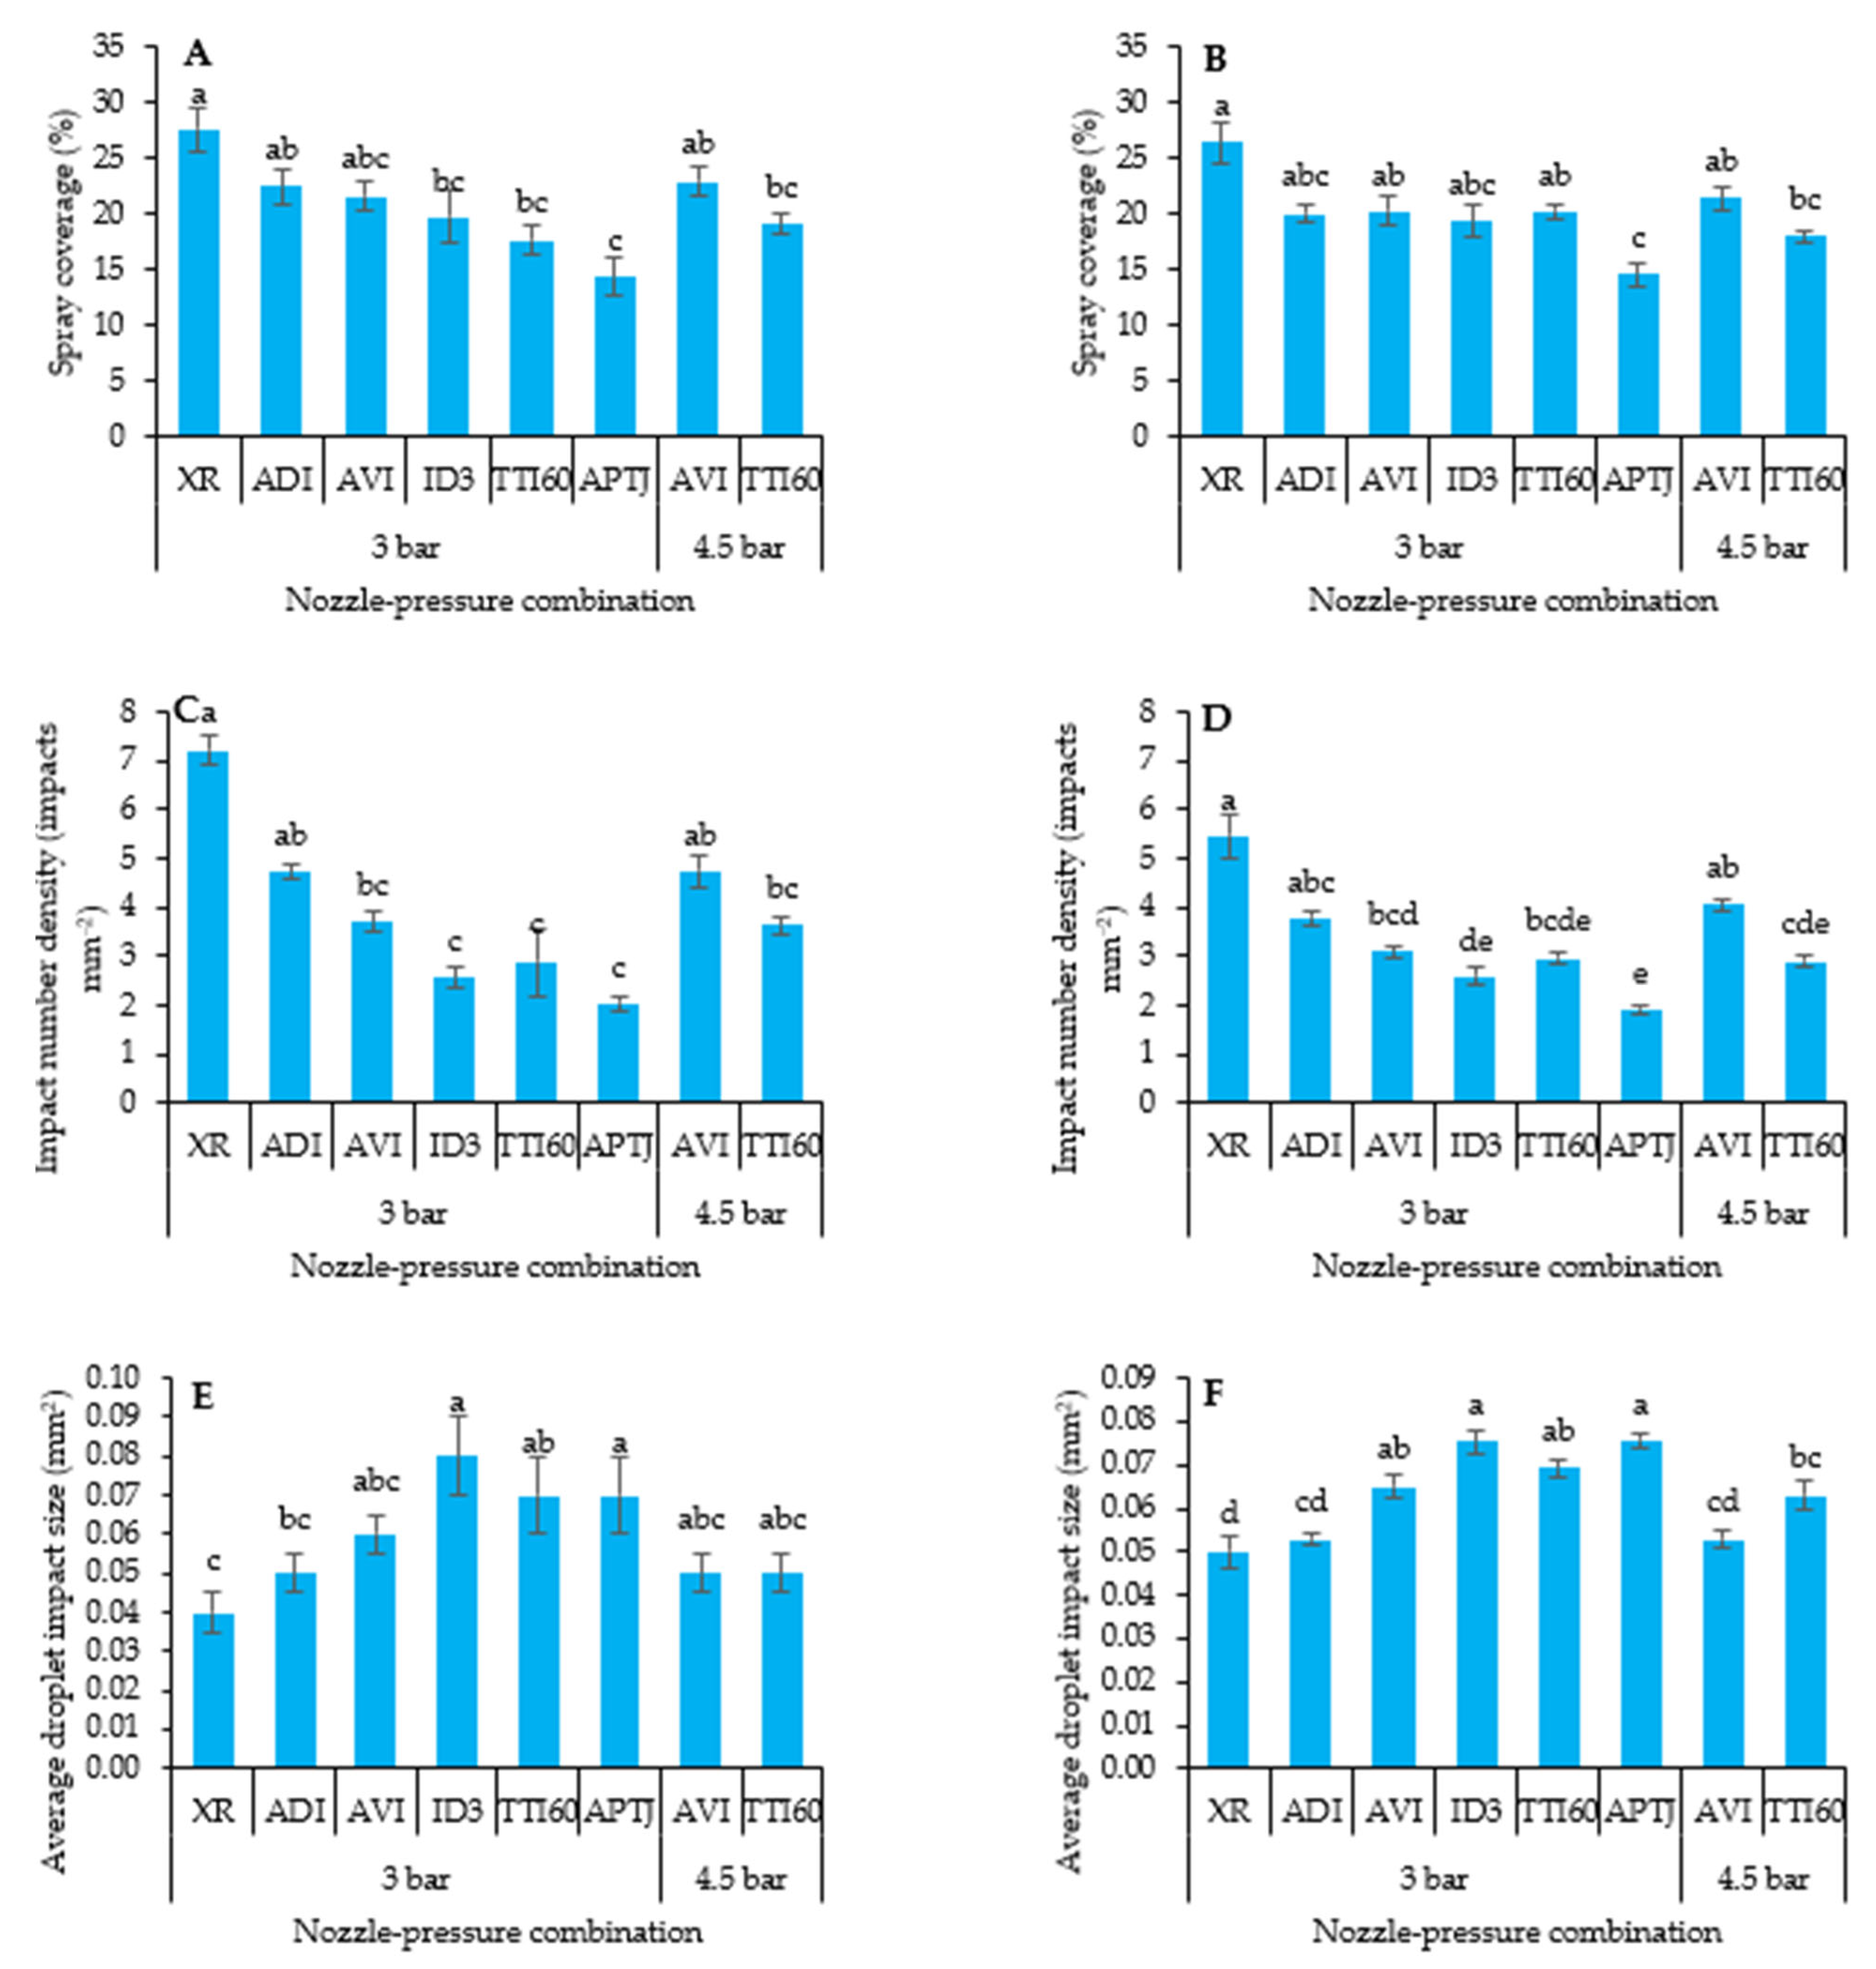
In both stages of S. nigrum (Figure 8), XR achieved the highest coverage, while APTJ resulted in the lowest. At BBCH10, droplet impact size was smallest with XR and largest with ID3. A similar pattern was observed at BBCH12, where XR again had the smallest impact size, and both ID3 and APTJ showed significantly larger droplet imprints.
For E. crus-galli, kaolinite spray coverage remained below 1% for all treatments at both growth stages. Due to this consistently low coverage, no statistical analysis was performed and data is not presented.

3.4. Contact Angle

The contact angle between spray solution and leaf surface was significantly affected by herbicide dose, weed species, and growth stage.
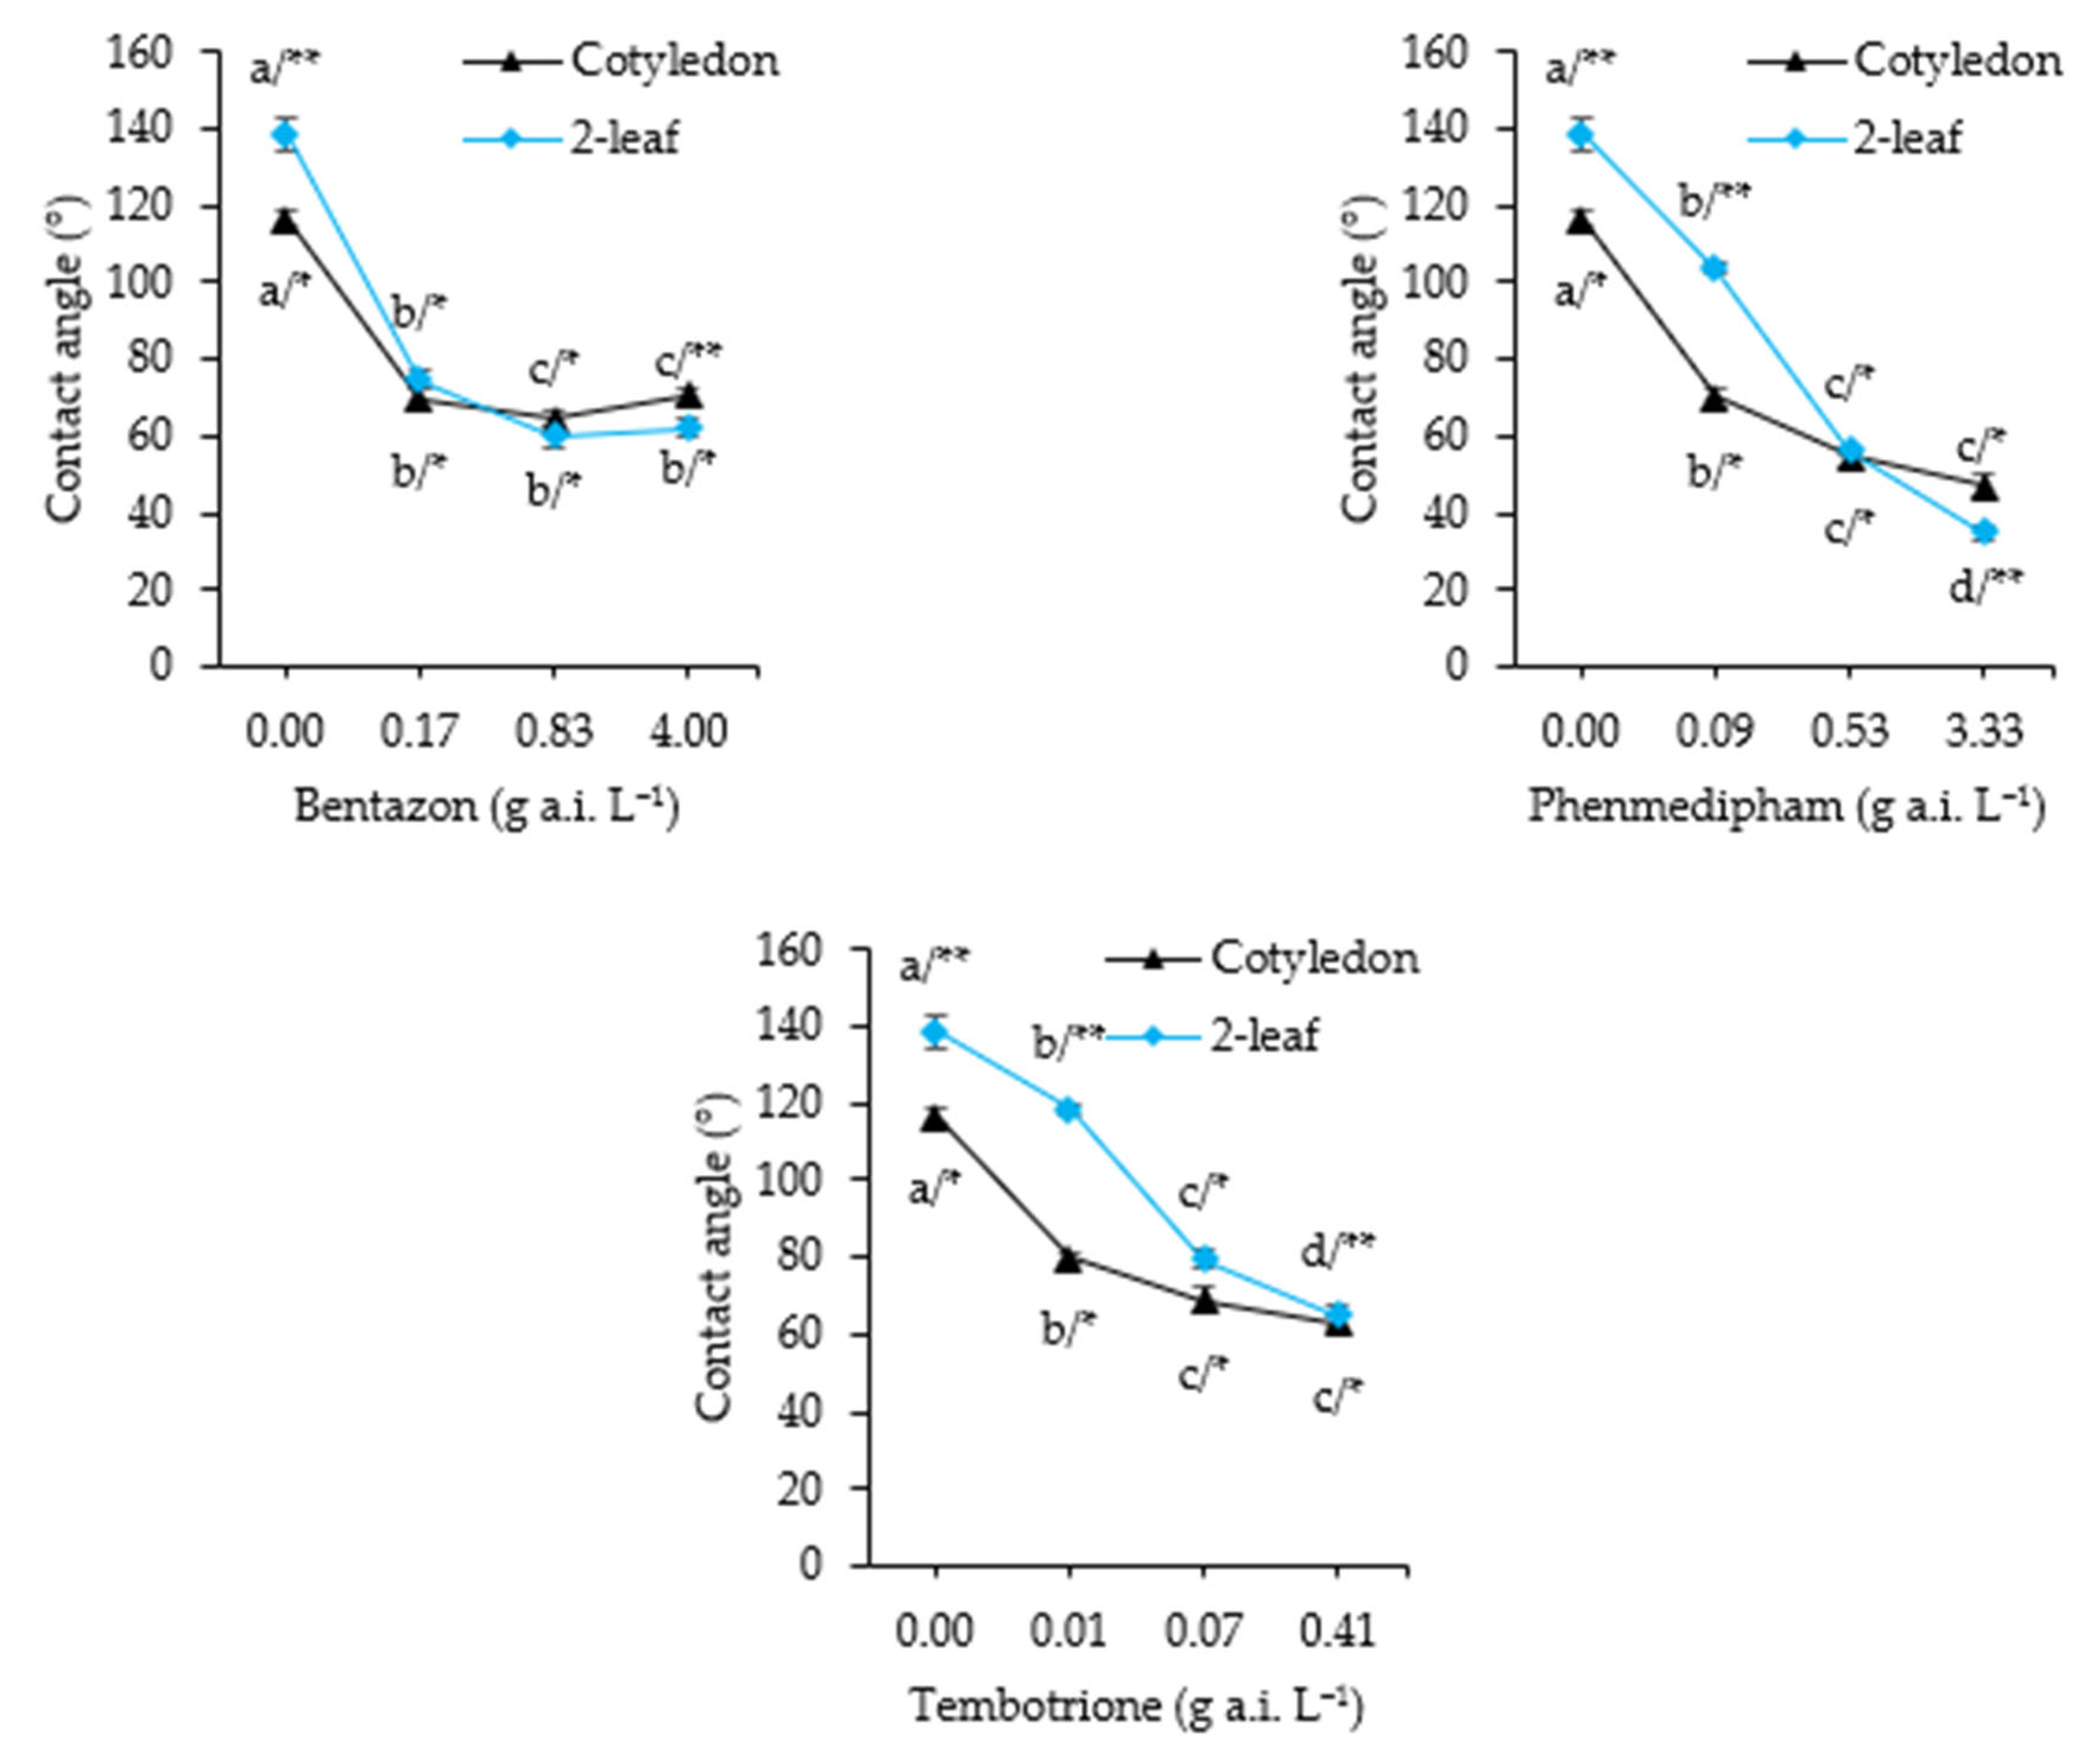
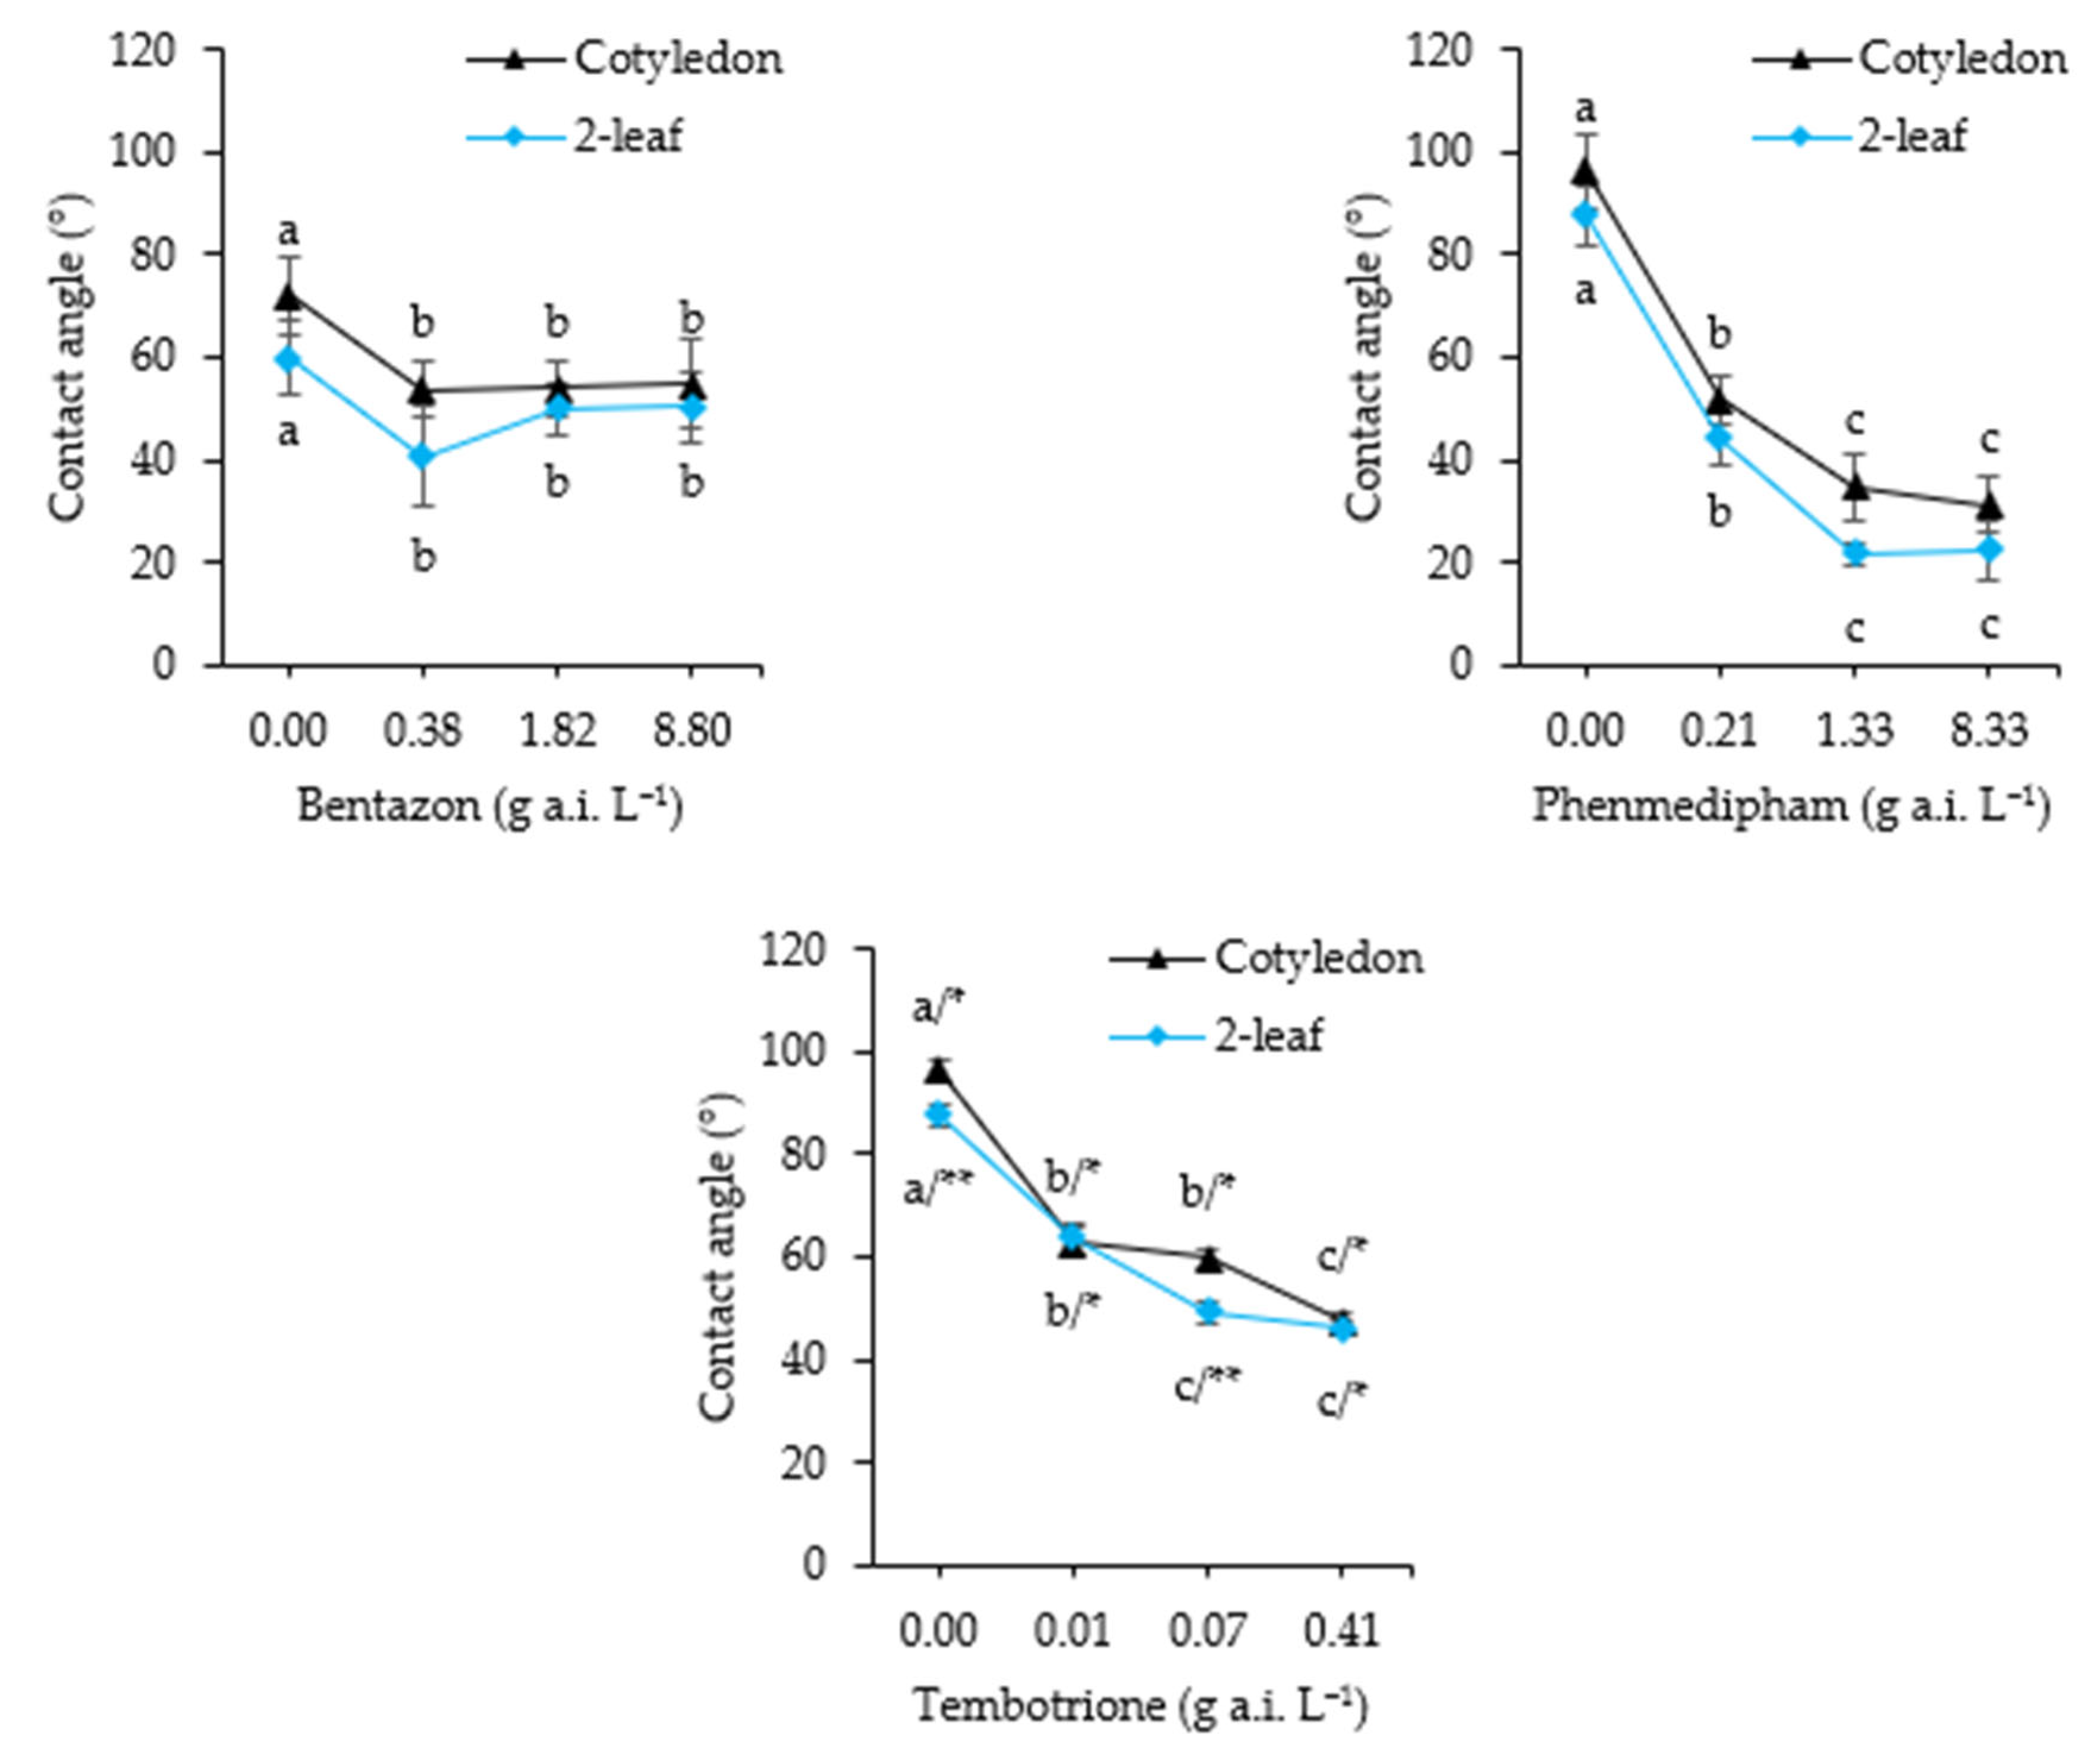
For C. album, bentazon spray solutions significantly reduced contact angles compared to pure water, i.e., concentration of 0.0 g a.i. L−1 (Figure 9). At the BBCH12 stage, a concentration-dependent decline in contact angle was observed, with values decreasing from 0.17 to 0.83 g a.i. L−1. Significant differences were observed between BBCH10 and BBCH12 plants for pure water and the solution with the highest bentazon concentration. Similarly, for phenmedipham and tembotrione, increasing concentrations led to a significant reduction in contact angles at both growth stages. For phenmedipham solutions corresponding with concentrations between 0 and 0.09 g a.i. L−1, contact angles were significantly lower for cotyledon stage plants (BBCH10) than for 2-leaf stage plants (BBCH12), whereas this trend reversed at 3.33 g a.i. L−1. In contrast, tembotrione solutions consistently showed lower contact angles on cotyledons than on true leaves, regardless of concentration.
For S. nigrum, no significant concentration × stage interaction was found for bentazon or phenmedipham. However, a significant effect of growth stage was observed for bentazon, with lower contact angles on BBCH 12 plants (Figure 10). For phenmedipham, no significant stage effect was detected. Tembotrione treatment showed a significant concentration × stage interaction. The application of bentazon resulted in a significant reduction in contact angle compared to water, but no further significant decrease was observed with increasing concentrations. In contrast, phenmedipham significantly reduced contact angle upon application, with a further decline observed from 0.21 to 1.33 g a.i. L−1. Similarly, tembotrione caused a marked reduction compared to water, for both 0 and 0.07 g a.i. L−1 tembotrione, and contact angles were lower on true leaves (BBCH12) than on cotyledons (BBCH10). At BBCH12, the contact angle decreased between 0.01 and 0.07 g a.i. L−1, whereas at BBCH10, a significant drop was only observed between 0.07 and 0.41 g a.i. L−1.
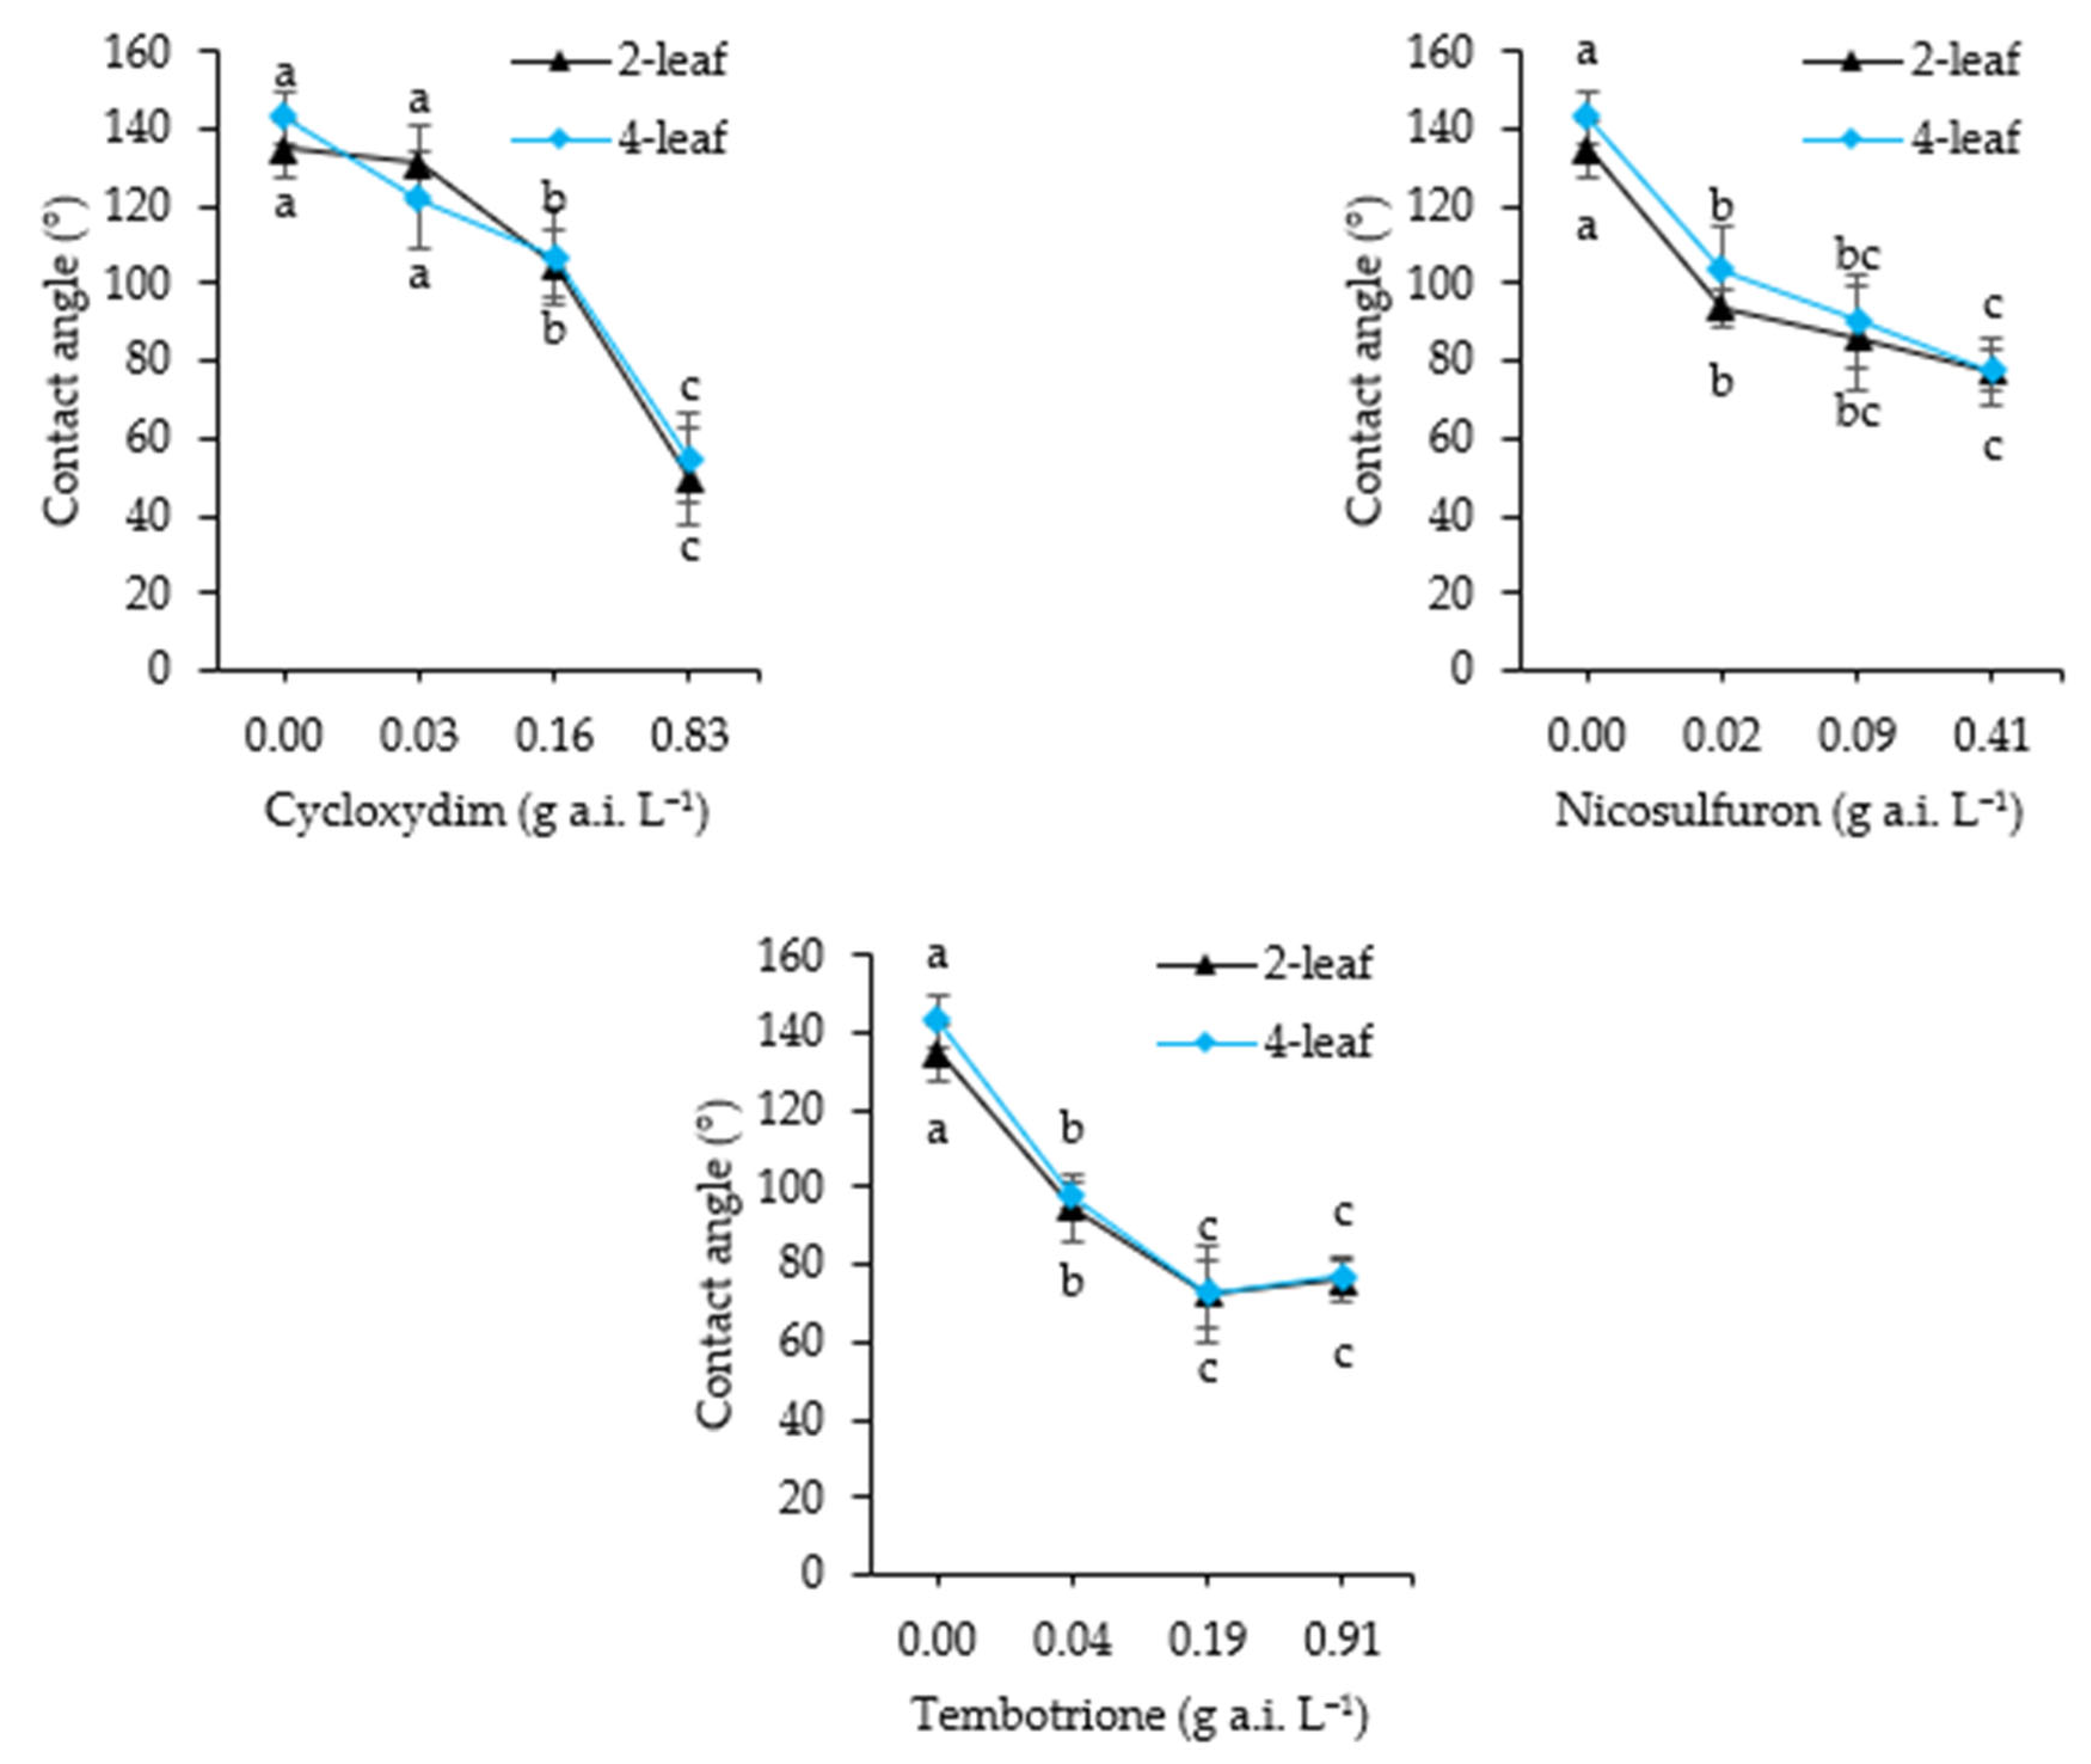
For E. crus-galli, no significant interaction between concentration and growth stage was observed, regardless of the herbicide applied, and no significant effect of growth stage was detected (Figure 11). For cycloxydim spray solutions, contact angles differed significantly from those of pure water only at concentrations above 0.16 g a.i. L−1, continuing to decline up to 0.83 g a.i. L−1. In contrast, nicosulfuron and tembotrione significantly reduced contact angles relative to water at much lower concentrations, 0.02 and 0.04 g a.i. L−1, respectively. With nicosulfuron, further reductions were observed up to 0.41 g a.i. L−1, while for tembotrione, a significant decline only occurred between 0.04 and 0.19 g a.i. L−1.

3.5. Surface Tension

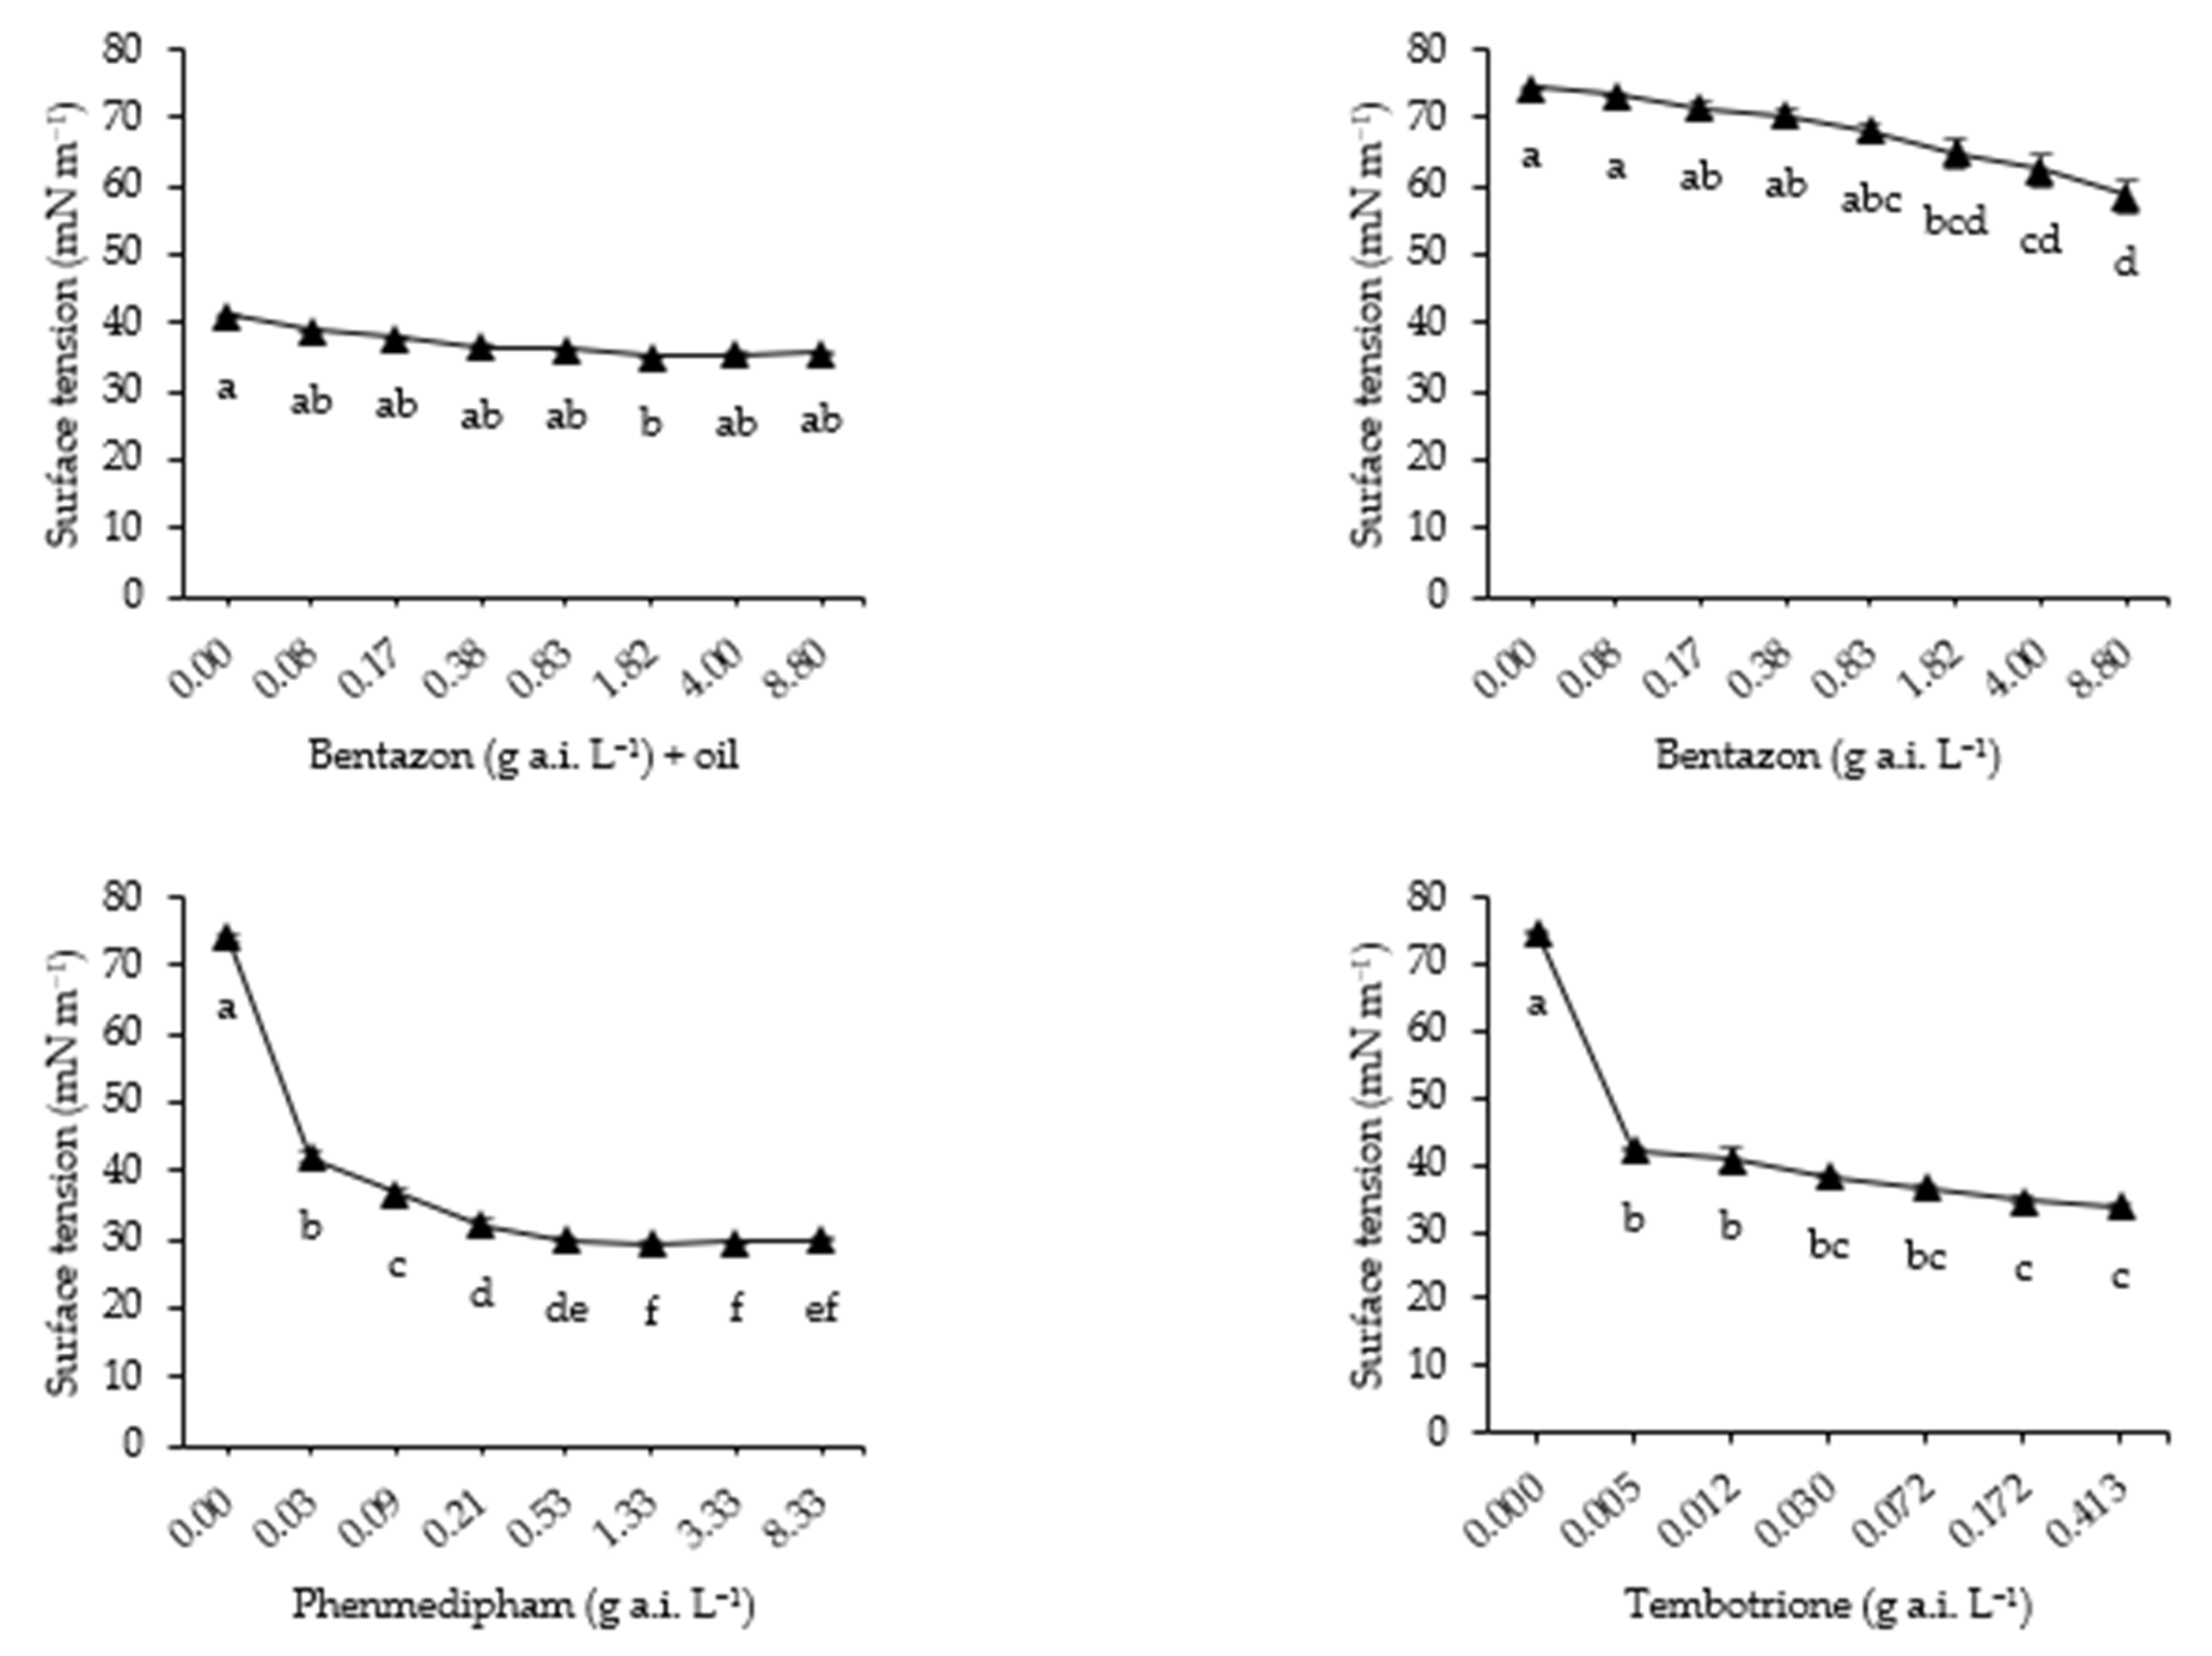
The addition of oil to bentazon spray solutions resulted in a substantial and statistically significant reduction in surface tension (Figure 12). At the lowest tested concentration (0.08 g a.i. L−1), surface tension decreased by 52.1% compared to pure water, and by 39.2% at the highest concentrations (4 g a.i. L−1). In the absence of oil, surface tension remained statistically comparable to water until a threshold concentration of 1.8 g a.i. L−1 was reached.
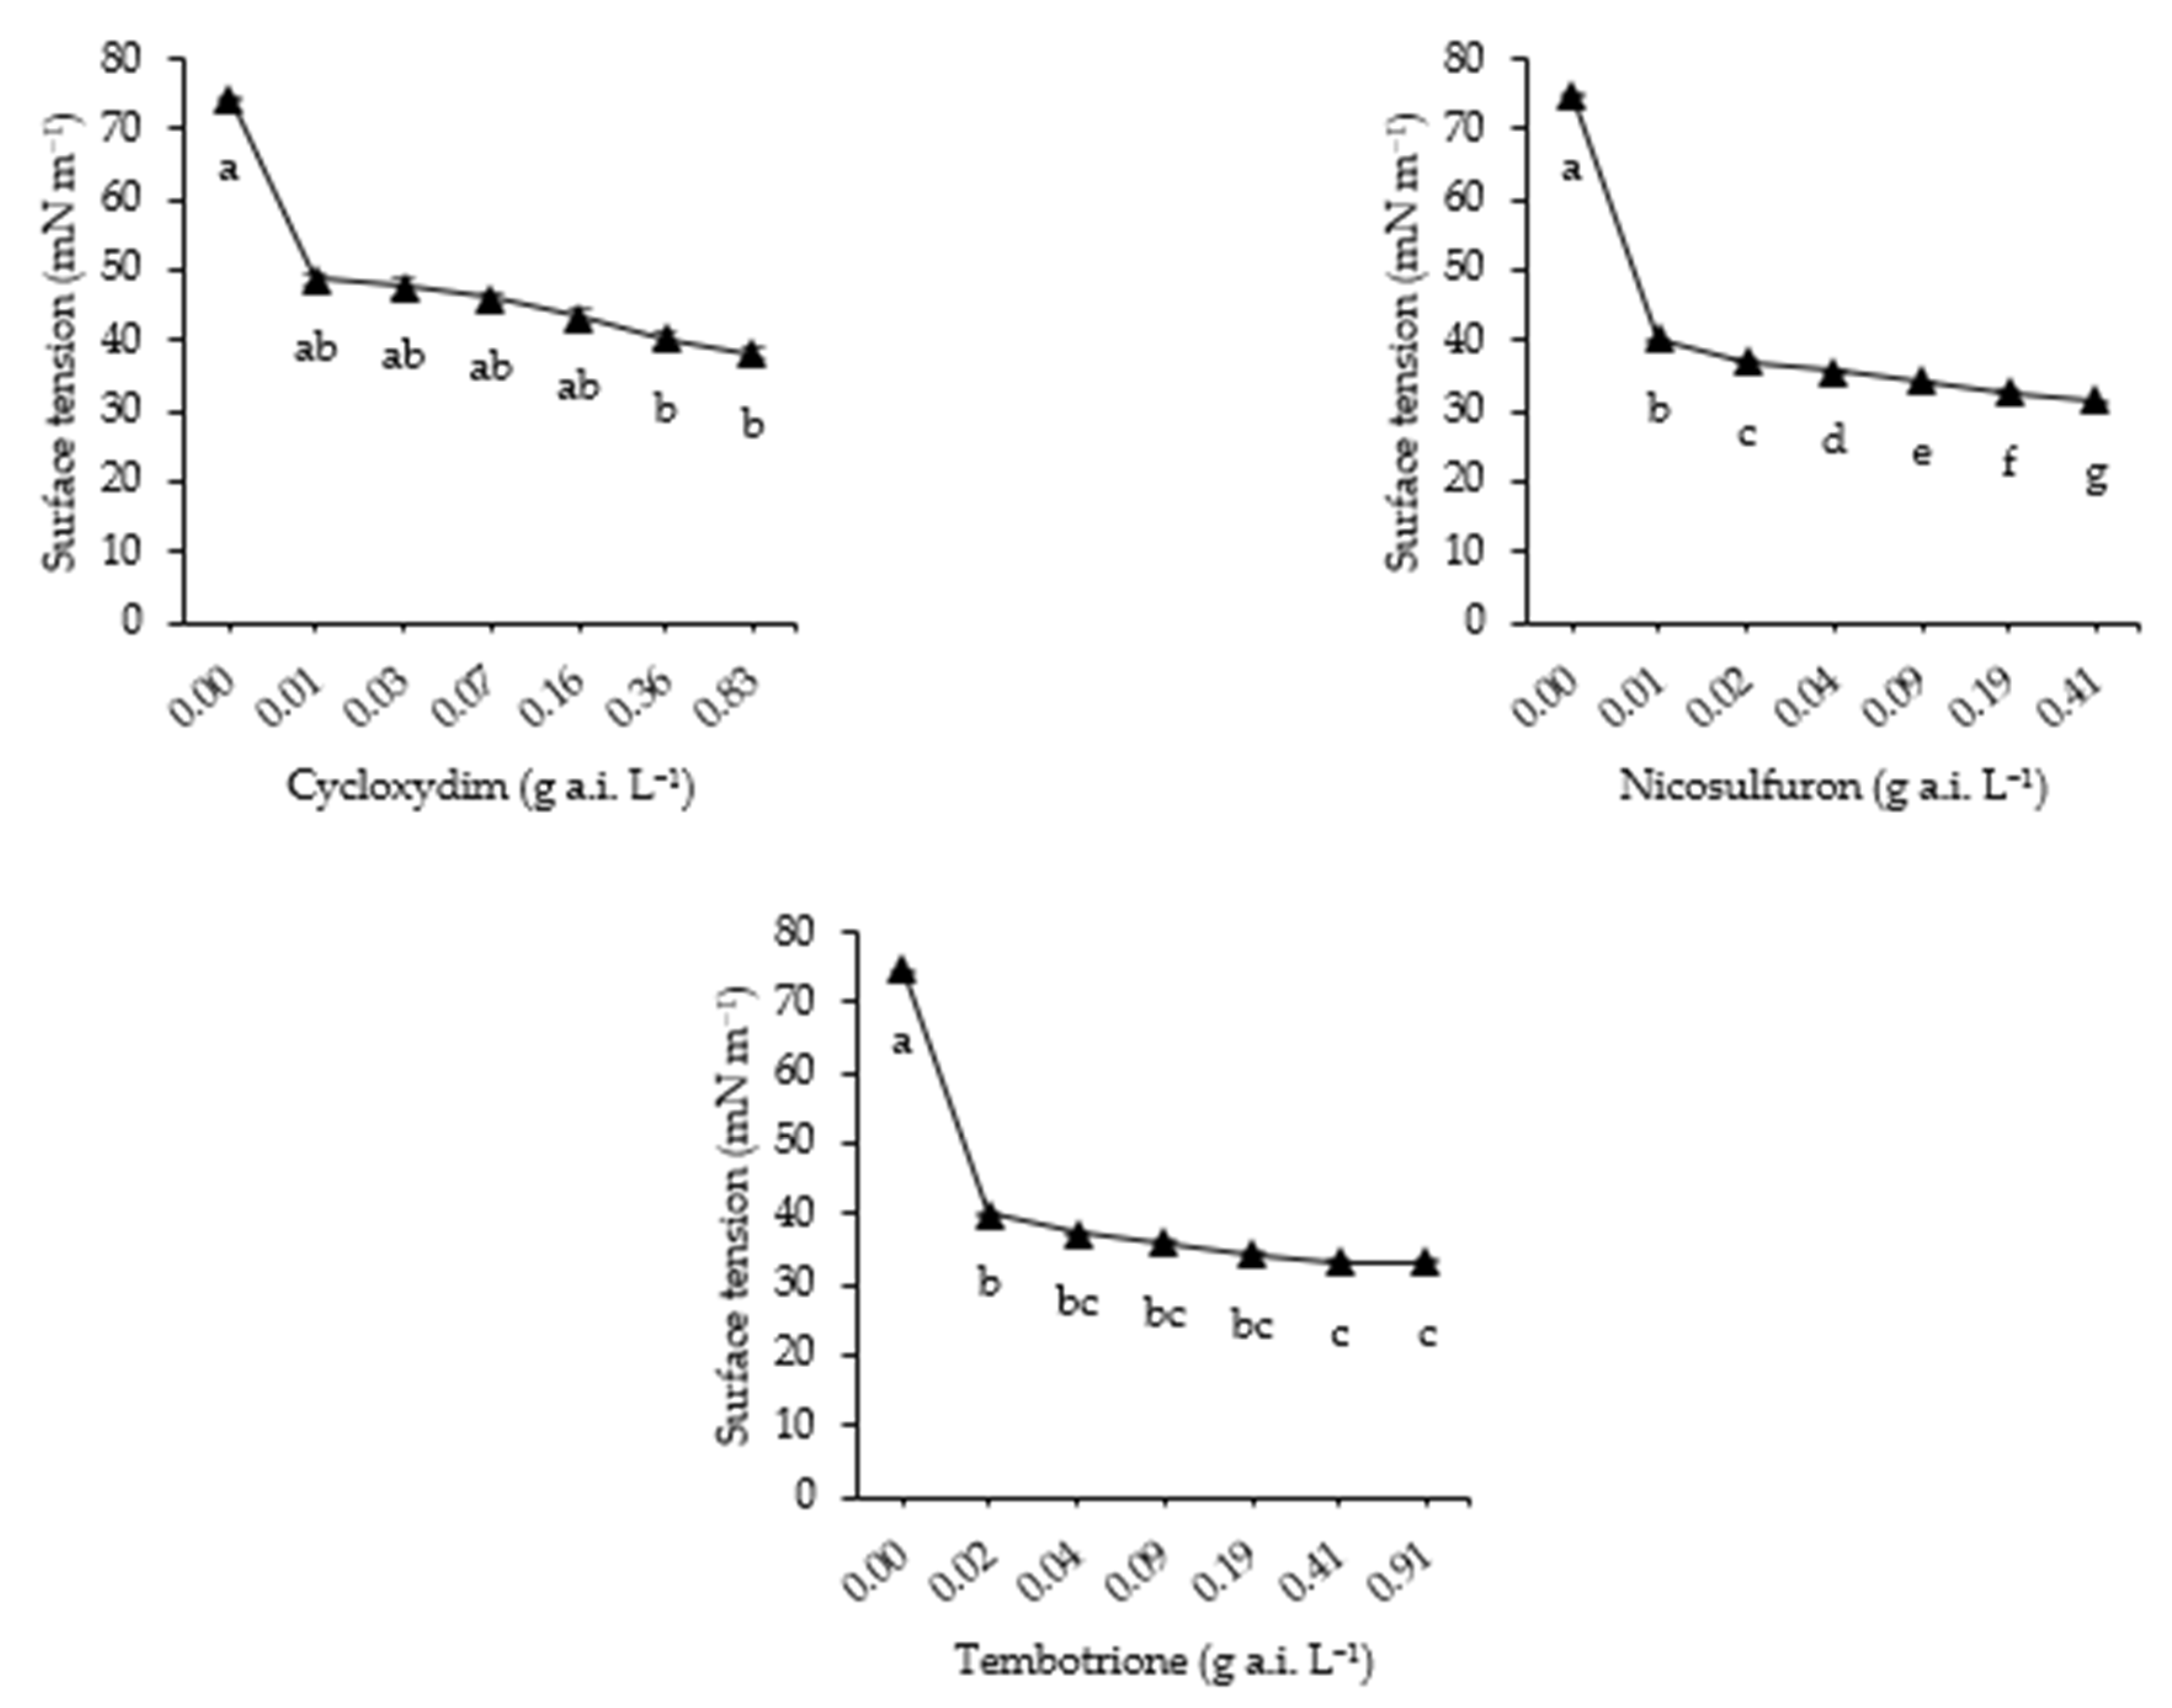
Phenmedipham, as well as tembotrione, cycloxydim, and nicosulfuron, all showed a clear concentration-dependent reduction in surface tension (Figure 13). Cycloxydim-induced reductions became statistically significant at concentrations ≥ 0.36 g a.i. L−1. Nicosulfuron and tembotrione, however, significantly lowered surface tension at much lower concentrations: 0.01 and 0.02 g a.i. L−1, respectively.

4. Discussion

All spray applications in this study were conducted under ideal environmental conditions—specifically, windless conditions and relative humidity above 50%—to isolate the effect of nozzle type on herbicide efficacy. In real-world field conditions, however, environmental factors such as increased wind speed and lower humidity can lead to greater drift and evaporation losses, potentially resulting in higher ED90 values [1]. This effect is likely to be more pronounced with fine-spray nozzles, which generate a higher proportion of driftable droplets compared to coarse-spray nozzles. Nonetheless, we expect the relative ranking of nozzle performance in controlling small weed targets to remain largely consistent. Moreover, spraying under such suboptimal conditions is strongly discouraged, as it compromises target deposition, increases off-target movement, and may ultimately necessitate higher herbicide inputs to achieve effective weed control [27].
In 77.3% of all drift-reducing nozzle × weed species × growth stage × herbicide combinations, no significant differences in bio-efficiency were observed between drift-reducing nozzles and the standard XR nozzle. However, several significant differences were still identified. This study demonstrates that nozzle type, herbicide formulation, weed species, and growth stage all significantly influence the biological efficacy of foliar-applied herbicides on small weed targets.
The standard flat-fan nozzle, which produces small droplets (0% drift reduction class), showed the most consistent performance across all tested combinations of herbicides, weed species, and growth stages. Among the drift-reducing nozzles, the pre-orifice nozzle ADI (50% drift reduction class) and the air-induction dual flat-fan nozzle TTI60 operated at 4.5 bar (75% drift reduction class) were the most consistent, performing equally well as the XR nozzle in 87% and 93% of the factorial combinations, respectively. These drift-reducing nozzles either produce smaller droplets (ADI, VMD ≈ 250 µm) or finer droplets with slower velocity (TTI60), which are less prone to rebound and splash upon impact with leaf surfaces [28].
The performance of drift-reducing flat-fan nozzles in controlling small dicotyledonous weeds was strongly influenced by the herbicide type, as also found by De Cauwer et al. [17], and its surface tension. For C. album and S. nigrum, nozzle effects were observed with bentazon and tembotrione, but not with phenmedipham. For BBCH10 stage plants of C. album treated with bentazon, all drift-reducing nozzles except ADI showed significantly higher ED90 values compared to XR. At BBCH12, only ADI, AVI, and ID3 showed significantly higher ED90 values. For S. nigrum, drift-reducing nozzles like ID3 and APTJ showed higher ED90 at BBCH10, and most drift-reducing nozzles (except ADI and TTI60 at 4.5 bar) showed higher ED90 values at BBCH12. The higher surface tensions and contact angles measured for the bentazon solutions (Basagran SG) compared to those of phenmedipham (Astrix EC) may explain the significant nozzle effects found for bentazon. Within the concentration range between 0.08 and 4.00 g a.i. L−1, surface tension was 6 to 16% higher for bentazon solutions with the addition of 3.38 g L−1 methylated seed oil than for phenmedipham solutions. Contact angles for spray droplets with bentazon (0.82–4.00 g a.i. L−1) were 1.1–1.8 times higher relative to spray droplets with phenmedipham (0.53–3.33 g a.i. L−1), depending on species and growth stage, suggesting reduced leaf wettability for bentazon-based spray solutions. These findings align with the known relationship between higher surface tension and larger contact angles, resulting in smaller contact areas [22].
Among systemic foliar herbicides, 80.4% of all combinations of drift-reducing nozzle, pressure, weed species, growth stage, and herbicide showed no significant difference in efficiency compared to the XR nozzle. For example, tembotrione generally performed consistently, except for a 39.9% reduction in efficiency when applied with the AVI nozzle at 4.5 bar on S. nigrum at the BBCH10 stage. Interestingly, nicosulfuron applied at BBCH14 on E. crus-galli demonstrated improved efficiency with the AVI nozzle at 3.0 bar compared to the XR nozzle, suggesting that nozzle effects for systemic herbicides can be both herbicide- and situation-specific. A significant nozzle effect when using systemic herbicides was more likely under conditions of high surface tension (>35 mN·m−1) and poor leaf wettability (contact angle > 90°). Notably, cycloxydim solutions (40–50 mN·m−1) produced sixfold and twofold greater nozzle-related efficiency differences than nicosulfuron and tembotrione solutions (30–40 mN·m−1), respectively. Moreover, when targeting four-leaf stage plants of E. crus-galli, three of seven drift-reducing nozzles (ADI, AVI, and ID3) were less effective than the XR nozzle with cycloxydim, whereas no such differences were observed for tembotrione or nicosulfuron.
The wetting properties of the weed species played a key role: the difficult-to-wet weeds C. album and E. crus-galli exhibited 1.5 and 1.4 times more significant nozzle-related efficiency differences, respectively, than S. nigrum. Applications of bentazon on C. album and cycloxydim on E. crus-galli were particularly sensitive to changes in nozzle type. Given that fine droplets spread and adhere more readily to hydrophobic surfaces than larger ones [29], nozzle-mediated alterations in droplet spectrum are likely most relevant for poorly wettable leaf surfaces.
Across species, growth stages and herbicides, nozzles producing very coarse droplets (e.g., the non-air induction nozzle APTJ and the air-induction nozzle ID3: VMD ≥ 590 µm) frequently underperformed, particularly when used for applying high-surface-tension herbicides (bentazon, cycloxydim) on poorly wettable targets (C. album and E. crus-galli). The ID3 nozzle not only produces coarse droplets but also larger droplets with faster velocity (vvol0.50 of 5.9 m s−1), resulting in higher Weber values (proportional to droplet kinetic energy at impact). As shown by Massinon et al. [28], the probability of adhesion on difficult-to-wet leaf surfaces decreases with increasing droplet size and impact velocity, due to increased bouncing and splashing. Additionally, larger droplets are more prone to sliding or detachment (runoff) from curved leaves, such as grass leaves [30]. In contrast, S. nigrum, which has inherently more wettable foliage, exhibited far fewer nozzle-related efficiency differences, thus confirming the critical role of target surface properties in droplet impact behaviour and nozzle performance. Despite their superior drift-reduction potential, coarser droplet spectrum nozzles cannot be recommended in scenarios where adhesion probability is critical.
Overall, the XR nozzle provided the best coverage on WSP and plant leaves (using a kaolin spray solution), although the differences were not always statistically significant compared to all drift-reducing nozzles. Although spray coverage on WSP and plant leaves is commonly used to predict application efficiency, the results of this study showed no consistent relationship between spray coverage and ED90 across weed species, growth stages, and herbicides. Wettable papers, which have a constant chemical composition and shape, do not account for the surface properties of plant leaves, which vary in shape, curvature, chemical composition, and hydrophilicity across species and over time. Likewise, kaolin sprays on plant leaves do not capture the formulation effects of herbicides on droplet behaviour (e.g., adhesion, fragmentation, splashing, or bouncing) upon impact with leaf surfaces. Furthermore, it was not possible to define a universally valid droplet spectrum for a bio-efficient herbicide application across species, growth stages, and herbicides. This is because droplet size characteristics alone do not account for differential droplet–leaf interactions among weed targets with varying levels of hydrophobicity, as shown by Massinon et al. [28]. Critical droplet size criteria for a bio-efficient application could be established only under specific spraying conditions. For cotyledon stage plants of C. album and S. nigrum treated with bentazon, and 2-leaf plants of E. crus-galli treated with cycloxydim, no significant difference in ED90 was observed between XR and any drift-reducing nozzle when VMD was ≤252.1 µm and V150 was ≥13.2% as for the pre-orifice nozzle ADI. In these cases, the nozzles with very coarse droplet spectra, such as ID3 and APTJ, showed inferior performance. The inferior performance of coarse droplet nozzles for controlling cotyledon stage plants of C. album and S. nigrum with bentazon perfectly matches with their inferior kaolinite spray coverage. At 3.0 bar, all drift-reducing nozzles except ADI showed 22–55% lower kaolinite spray coverage on cotyledons of C. album and S. nigrum (not always significant) compared to XR. This is probably the result of two combined factors: (1) reduced droplet spread due to the high surface tension of bentazon spray solutions, as mentioned above, and (2) a higher risk of droplets missing their intended target in spray plumes consisting predominantly of a few large droplets, compared to spray plumes made up mostly of many small droplets [20]. All drift-reducing nozzles operating at 3 bar, except ADI, indeed showed 18–61% lower impact numbers on WSP compared to XR. Hence, to achieve a more efficient application of bentazon on cotyledon stage plants, finer droplet spectra should be used.

5. Conclusions

In conclusion, while several drift-reducing nozzles with coarser droplet spectra performed similarly to the standard XR flat-fan nozzle in many herbicide × weed species combinations, bio-efficiency was more variable when targeting small or poorly wettable weed surfaces. This confirms that applying foliar herbicides on small weeds can be less efficient with drift-reducing nozzles (RQ1), particularly when using spray solutions with high surface tension or when targeting erectophile species such as Echinochloa crus-galli and Chenopodium album at early growth stages.
Nozzle performance (RQ2) was found to depend strongly on herbicide physicochemical properties, weed species, growth stage, and leaf surface characteristics. Under challenging conditions—such as applications on narrow cotyledons or poorly wettable surfaces—nozzles producing finer droplet spectra (VMD ≈ 250 µm, e.g., XR or ADI) or lower droplet velocities (vv0.5 < 3 m·s−1, e.g., TTI60) delivered the most consistent and bio-efficient performance.
Regarding coverage and droplet spectrum requirements (RQ3), a droplet size spectrum with a VMD around 250 µm and low droplet velocity was most effective. However, defining precise spray coverage thresholds remains difficult, as coverage measured on water-sensitive paper or plant leaves using kaolin tracer solutions proved to be poor predictors of actual herbicide efficacy, particularly on erectophile or poorly wettable targets.
Because fine-droplet nozzles typically offer limited drift control, they should be combined with advanced drift-reducing strategies, such as air assistance, shielded booms, or reduced boom height and nozzle spacing, to balance bio-efficiency with compliance to drift-reduction legislation (e.g., 75% drift reduction in Belgium).
Future research should investigate whether the addition of tank-mix adjuvants and the use of higher spray pressures can mitigate the reductions in bio-efficiency observed with several coarser droplet, drift-reducing nozzles.

Author Contributions

Conceptualization, B.D.C. and D.N.; methodology, B.D.C., D.N. and S.D.R.; formal analysis, B.D.C., S.D.R., E.V.H. and M.D.M.; investigation, B.D.C., S.D.R., E.V.H., M.D.M. and I.Z.; writing—original draft preparation, B.D.C., S.D.R. and E.V.H.; writing—review and editing, B.D.C., S.D.R., D.N., I.Z., J.V., T.A.Z. and P.V. All authors have read and agreed to the published version of the manuscript.

Funding

This project received funding from VLAIO under grant agreement No. HBC.2021.1070 (OPTiSPRAY-project).

Data Availability Statement

The data presented in this study are available on request from the corresponding author.

Acknowledgments

Contact angle and surface tension measurements were executed at the Particle and Interfacial Technology lab (PaInT) of Paul Van der Meeren (Faculty of Bioscience Engineering, Ghent University, Ghent, Belgium).

Conflicts of Interest

The authors declare no conflicts of interest.

References

  1. Kudsk, P. Optimising Herbicide Performance. In Weed Management Handbook, 9th ed.; Blackwell Science: West Sussex, UK, 2002; pp. 323–344. [Google Scholar]
  2. Oerke, E.-C. Crop Losses to Pests. J. Agric. Sci. 2006, 144, 31–43. [Google Scholar] [CrossRef]
  3. Nuyttens, D.; De Schampheleire, M.; Baetens, K.; Sonck, B. The Influence of Operator-Controlled Variables on Spray Drift from Field Crop Sprayers. Trans. ASABE 2007, 50, 1129–1140. [Google Scholar] [CrossRef]
  4. Boutin, C.; Strandberg, B.; Carpenter, D.; Mathiassen, S.K.; Thomas, P.J. Herbicide Impact on Non-Target Plant Reproduction: What Are the Toxicological and Ecological Implications? Environ. Pollut. 2014, 185, 295–306. [Google Scholar] [CrossRef] [PubMed]
  5. Dexter, A.G. Herbicide Spray Drift. In North Dakota State University Extension Service; (Revised 1995); NDSU Extension Service EXT A-657: Fargo, ND, USA, 1993; p. 11. [Google Scholar]
  6. Vieira, B.C.; Luck, J.D.; Amundsen, K.L.; Werle, R.; Gaines, T.A.; Kruger, G.R. Herbicide Drift Exposure Leads to Reduced Herbicide Sensitivity in Amaranthus spp. Sci. Rep. 2020, 10, 2146. [Google Scholar] [CrossRef] [PubMed]
  7. Moore, D.R.J.; Priest, C.D.; Brayden, B.H.; Hanzas, J.P.; Arpino, M.R.; Richardson, L.; Stryker, J.; Banman, C.; Rodney, S.I.; Chapple, A.; et al. A Field Spray Drift Study to Determine the Downwind Effects of Isoxaflutole Herbicide to Nontarget Plants. Integr. Environ. Assess. Manag. 2021, 18, 757–769. [Google Scholar] [CrossRef] [PubMed]
  8. Agentschap Landbouw & Zeevisserij IPM Richtlijnen-Checklist 2024. Belgisch Staatsblad 2024; Ministrieel Besluit 2 Februari 2024 tot Wijziging van het Ministrieel Besluit van 1 April 2021 tot Vaststelling van de Driftreducerende Middelen of Maatregelen., 48. Available online: https://lv.vlaanderen.be/sites/lv/files/2024-07/IPM_richtlijnen_checklist_2024_juli.pdf (accessed on 9 October 2025).
  9. FOD VVVL. Dienst Gewasbeschermingsmiddelen en Meststoffen Bescherming van het Oppervlaktewater bij het Gebruik van Gewasbeschermingsmiddelen. Available online: https://fytoweb.be/sites/default/files/guide/attachments/bescherming_van_het_oppervlaktewater_20240701.pdf (accessed on 31 August 2025).
  10. Nuyttens, D.; Taylor, W.A.; De Schampheleire, M.; Verboven, P.; Dekeyser, D. Influence of Nozzle Type and Size on Drift Potential by Means of Different Wind Tunnel Evaluation Methods. Biosyst. Eng. 2009, 103, 271–280. [Google Scholar] [CrossRef]
  11. Kirkwood, R.C. Recent Developments in Our Understanding of the Plant Cuticle as a Barrier to the Foliar Uptake of Pesticides†. Pestic. Sci. 1999, 55, 69–77. [Google Scholar] [CrossRef]
  12. Taylor, F.E.; Davies, L.G.; Cobb, A.H. An Analysis of the Epicuticular Wax of Chenopodium album Leaves in Relation to Environmental Change, Leaf Wettability and the Penetration of the Herbicide Bentazone. Ann. Appl. Biol. 1981, 98, 471–478. [Google Scholar] [CrossRef]
  13. Sanyal, D.; Bhowmik, P.C.; Reddy, K.N. Influence of Leaf Surface Micromorphology, Wax Content, and Surfactant on Primisulfuron Droplet Spread on Barnyardgrass (Echinochloa crus-galli) and Green Foxtail (Setaria viridis). Weed Sci. 2006, 54, 627–633. [Google Scholar] [CrossRef]
  14. Kudsk, P.; Kristensen, J.L. Effect of Environmental Factors on Herbicide Performance. Proc. First Int. Weed Control Congr. 1992, 1, 173–186. [Google Scholar]
  15. Ramsdale, B.K.; Messersmith, C.G. Drift-Reducing Nozzle Effects on Herbicide Performance 1. Weed Technol. 2001, 15, 453–460. [Google Scholar] [CrossRef]
  16. Creech, C.F. Herbicide Application Technology Impacts on Herbicide Spray Characteristics and Performance; University of Nebraska: Lincoln, NE, USA, 2015. [Google Scholar]
  17. De Cauwer, B.; De Meuter, I.; De Ryck, S.; Dekeyser, D.; Zwertvaegher, I.; Nuyttens, D. Performance of Drift-Reducing Nozzles in Controlling Small Weed Seedlings with Contact Herbicides. Agronomy 2023, 13, 1342. [Google Scholar] [CrossRef]
  18. ISO 5682-1:2017; Equipment for Crop Protection—Spraying Equipment—Part 1: Test Methods for Sprayer Nozzles. ISO: Geneva, Switzerland, 2017. Available online: https://www.iso.org/standard/60053.html (accessed on 24 August 2025).
  19. Kashdan, J.T.; Shrimpton, J.S.; Whybrew, A. Two-Phase Flow Characterization by Automated Digital Image Analysis. Part 2: Application of PDIA for Sizing Sprays. Part Part Syst. Charact. 2004, 21, 15–23. [Google Scholar] [CrossRef]
  20. Nuyttens, D.; Baetens, K.; De Schampheleire, M.; Sonck, B. Effect of Nozzle Type, Size and Pressure on Spray Droplet Characteristics. Biosyst. Eng. 2007, 97, 333–345. [Google Scholar] [CrossRef]
  21. ISO 25358:2018(En); Crop Protection Equipment—Droplet-Size Spectra from Atomizers—Measurement and Classification. ISO: Geneva, Switzerland, 2018.
  22. Laurén, S. Agrochemicals—How Do Surface Tension and Wettability Affect the Efficiency? Available online: https://www.biolinscientific.com/blog/agrochemicals-how-do-surface-tension-and-wettability-affect-the-efficiency (accessed on 11 February 2025).
  23. Ebnesajjad, S. Surface Tension and Its Measurement. In Handbook of Adhesives and Surface Preparation; Elsevier: Amsterdam, The Netherlands, 2011; pp. 21–30. ISBN 978-1-4377-4461-3. [Google Scholar]
  24. R Core Team. R: A Language and Environment for Statistical Computing; R Foundation for Statistical Computing: Vienna, Austria, 2021; ISBN 3-900051-07-0. [Google Scholar]
  25. Ritz, C.; Streibig, J.C. Bioassay Analysis Using R. J. Stat. Softw. 2005, 12, 1–22. [Google Scholar] [CrossRef]
  26. Streibig, J.C.; Rudemo, M.; Jensen, J.E. Dose-Response Curves and Statistical Models. In Herbicide Bioassays; CRC Press: Boca Raton, FL, USA, 1993; pp. 29–55. [Google Scholar]
  27. Butler Ellis, M.C.; Bradley, A. The Influence of Formulation on Spray Drift. In International Advances in Pesticide Application; Aspects of Applied Biology: Warwick, UK, 2002; pp. 251–258. [Google Scholar]
  28. Massinon, M.; De Cock, N.; Forster, W.A.; Nairn, J.J.; McCue, S.W.; Zabkiewicz, J.A.; Lebeau, F. Spray Droplet Impaction Outcomes for Different Plant Species and Spray Formulations. Crop Prot. 2017, 99, 65–75. [Google Scholar] [CrossRef]
  29. Zwertvaegher, I.K.; Verhaeghe, M.; Brusselman, E.; Verboven, P.; Lebeau, F.; Massinon, M.; Nicolaï, B.M.; Nuyttens, D. The Impact and Retention of Spray Droplets on a Horizontal Hydrophobic Surface. Biosyst. Eng. 2014, 126, 82–91. [Google Scholar] [CrossRef]
  30. Gao, Z.-M.; Hu, W.; Dong, X.-Y.; Zhao, X.-Y.; Wang, S.; Chen, J.; Qiu, B.-J. Motion Behavior of Droplets on Curved Leaf Surfaces Driven by Airflow. Front. Plant Sci. 2024, 15, 1450831. [Google Scholar] [CrossRef] [PubMed]
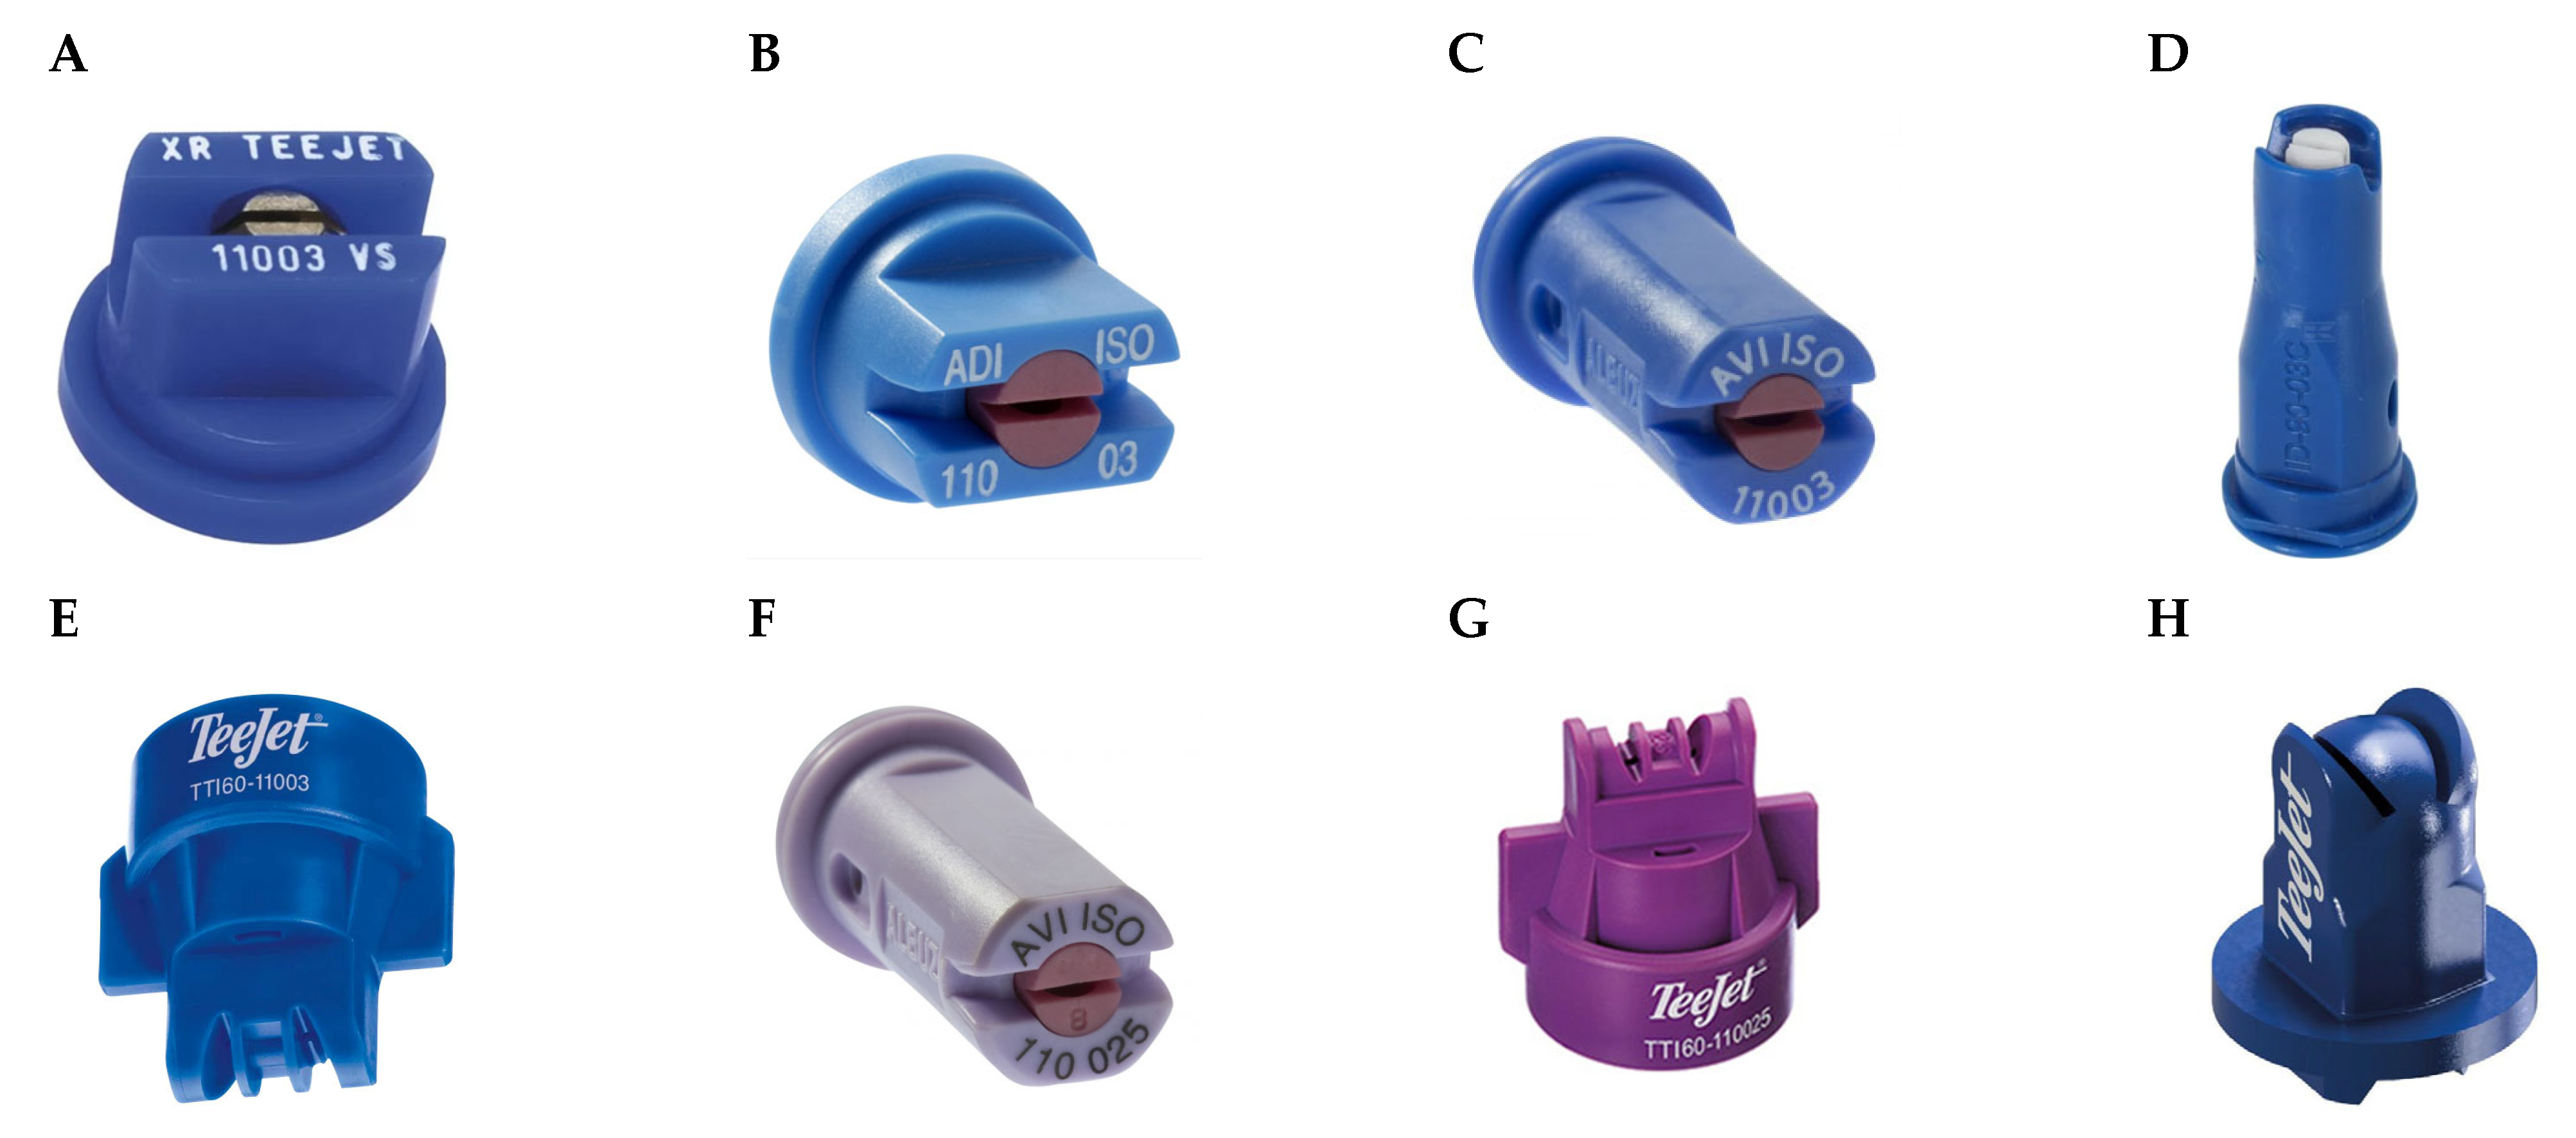
Figure 1. Flat-fan nozzles used in this study, corresponding to those described in Table 2. XR 110 03 (A), ADI 110 03 (B), AVI 110 03 (C), ID3 120 03 (D), TTI60 110 03 (E), AVI 110 025 (F), TTI60 110 025 (G), APTJ 110 03 (H).
Agriculture 15 02115 g001
Figure 2. ED90 responses (with standard errors) of cotyledon (A,C,D) and 2-leaf (B,E) stage plants of C. album to bentazon (A,B), phenmedipham (C), and tembotrione (D,E) applied with various nozzle-pressure combinations. No significant differences (p < 0.05) between bars sharing a common letter (based on computed selectivity indices and corresponding p-values). The red dotted line represents maximum authorized field dose in Belgium.
Agriculture 15 02115 g002
Figure 3. ED90 responses (with standard errors) of cotyledon (A,C,E) and 2-leaf (B,D,F) stage plants of S. nigrum to bentazon (A,B), phenmedipham (C,D), and tembotrione (E,F) applied with various nozzle-pressure combinations. No significant differences (p < 0.05) between bars sharing a common letter (based on computed selectivity indices and corresponding p-values). The red dotted line represents maximum authorized field dose in Belgium.
Agriculture 15 02115 g003
Figure 4. ED90 responses (with standard errors) of 2-leaf (A,C,E) and 4-leaf (B,D,F) stage plants of E. crus-galli to cycloxydim (A,B), nicosulfuron (C,D), and tembotrione (E,F) applied with various nozzle-pressure combinations. No significant differences (p < 0.05) between bars sharing a common letter (based on computed selectivity indices and corresponding p-values). The red dotted line represents the maximum authorised field dose in Belgium.
Agriculture 15 02115 g004
Figure 5. Droplet characteristics (mean ± SE) for all used nozzle type × spray pressure combinations: Dv0.1, VMD = Dv0.5, Dv0.9 (the sizes below which 10%, 50%, and 90% of the total droplet volume are contained; (AC)), V150 (the percentage of the spray volume contained in droplets with a diameter below 150 μm; (D)), Dn0.5 (50% of the total number of droplets is smaller than this value; (E)), N150 (the percentage of droplets smaller than 150 μm; (F)), vv0.50 (droplet speed below which 50% of the total droplet volume is contained; (G)), vn0.50 (droplet speed of 50% of the droplets is slower than this value; (H)). Within droplet characteristics, there are no significant differences (p < 0.05) between values sharing a common letter.
Agriculture 15 02115 g005
Figure 6. Spray coverage (%, A), impact number density (impacts mm−2, B), and mean droplet impact size (mm2, C) on water-sensitive paper for the tested nozzle type × spray pressure combinations (mean ± SE), all at 240 L ha−1. Means without a common letter are significantly different (p < 0.05).
Agriculture 15 02115 g006
Figure 7. Spray coverage characteristics on Chenopodium album at two growth stages, under different nozzle type × spray pressure combinations applied at 240 L ha−1. Subfigures show: kaolinite spray coverage (%) at the cotyledon (A) and 2-leaf stage (B); impact number density (impacts mm−2) at the cotyledon (C) and 2-leaf stage (D); and mean droplet impact size (mm2) at the cotyledon (E) and 2-leaf stage (F). Values represent means ± SE. Bars that do not share a common letter differ significantly (p < 0.05).
Agriculture 15 02115 g007
Figure 8. Spray coverage characteristics on Solanum nigrum at two growth stages, under different nozzle type × spray pressure combinations applied at 240 L ha−1. Subfigures show: kaolinite spray coverage (%) at the cotyledon (A) and 2-leaf stage (B); impact number density (impacts mm−2) at the cotyledon (C) and 2-leaf stage (D); and mean droplet impact size (mm2) at the cotyledon (E) and 2-leaf stage (F). Values represent means ± SE. Bars that do not share a common letter differ significantly (p < 0.05).
Agriculture 15 02115 g008
Figure 9. The contact angles (°, mean ± SE) of sessile spray droplets on the cotyledon and second true leaf of C. album as a function of the concentration of bentazon, phenmedipham, and tembotrione. Within each herbicide × stage combination, means without a common letter are significantly different (p < 0.05). Within each herbicide-dose combination, means with different numbers of asterisks are significantly different. X-axis is not linear.
Agriculture 15 02115 g009
Figure 10. The contact angles (°, mean ± SE) of sessile spray droplets on the cotyledon and second true leaf of S. nigrum as a function of the concentration of bentazon, phenmedipham, and tembotrione. Within each herbicide × stage combination, means without a common letter are significantly different (p < 0.05). Within each herbicide-dose combination, means with different numbers of asterisks are significantly different. X-axis is not linear.
Agriculture 15 02115 g010
Figure 11. The contact angles (°, mean ± SE) of sessile spray droplets on the second and fourth true leaf of E. crus-galli as a function of the concentration of cycloxydim, nicosulfuron, and tembotrione. Within each herbicide × stage combination, means without a common letter are significantly different (p < 0.05). No effect of stage was observed. X-axis is not linear.
Agriculture 15 02115 g011
Figure 12. Surface tension (mN m−1, mean ± SE) as a function of concentration of bentazon (with or without methylated seed oil), phenmedipham, and tembotrione (bioassays with C. album and S. nigrum). Means within a herbicide without a common letter are significantly different (p < 0.05). X-axis is not linear.
Agriculture 15 02115 g012
Figure 13. Surface tension (mN m−1, mean ± SE) as a function of concentration of the systemic herbicides cycloxydim, nicosulfuron, and tembotrione (bioassays with E. crus-galli). Means within a herbicide without a common letter are significantly different (p < 0.05). X-axis is not linear.
Agriculture 15 02115 g013
Table 1. Herbicides and their doses examined in postemergence dose–response bioassays performed at a constant spray volume of 240 L ha−1. The maximum allowed field doses are indicated in bold.
Herbicide (Product Name,
Concentration, Formulation,
Supplier)
Herbicide Mode of Action (HRAC/WSSA-Group/
Legacy HRAC)
Herbicide Doses (g a.i. L−1)
Bentazon 1 (Basagran, 87% a.i., SG, BASF Agricultural Solutions)Photosystem II-Inhibitor (6/C3)0.000–0.078–0.171–0.376–0.826–1.818–4.000 2
0.000–0.171–0.376–0.826–1.818–4.000–8.800 3
Phenmedipham (Astrix, 160 g a.i. L−1, EC, UPL Europe Ltd.)Photosystem II-Inhibitor (5/C1)0.000–0.034–0.085–0.213–0.533–1.333–3.333 2
0.000–0.085–0.213–0.533–1.333–3.333–8.333 3
Tembotrione (Laudis, 44 g a.i. L−1, OD, Bayer Crop Science)HPPD-inhibitor (27/F2)0.000–0.005–0.012–0.030–0.072–0.172–0.413 2, 3
0.000–0.018–0.039–0.085–0.188–0.413–0.908 4
Cycloxydim (Focus plus, 100 g a.i. L−1, EC, BASF Agricultural Solutions)ACCase-inhibitor (1/A)0.000–0.013–0.030–0.068–0.158–0.362–0.830 4
Nicosulfuron (Samson Extra 60, 60 g a.i. L−1, OD, ISK Biosciences Europe)ALS-inhibitor (2/B)0.000–0.008–0.018–0.039–0.085–0.188–0.413 4
1 3.38 g L−1 of methylated rapeseed oil (Actirob B, 812 g a.i. L−1, EC, Oleon NV, Ertvelde, Belgium) was added to the spray solution to enhance foliar uptake and distribution; 2 C. album; 3 S. nigrum; 4 E. crus-galli.
Table 2. Used flat-fan nozzles by full name and acronym, their spray angle, manufacturer, description of the nozzle type, drift reduction class, spray pressure, and belt speed. Nominal flow rate was 1.19 L min−1.
Nozzle TypeManufacturerDescriptionDrift
Reduction Class (%) 1
Spray Pressure (Bar)Belt Speed (km h−1)
XR 110 03TeeJetStandard single 110° flat-fan033.35
ADI 110 03AlbuzPre-orifice single 110° flat-fan5035.35
AVI 110 03AlbuzAir induction single 110° flat-fan7533.98
ID3 120 03LechlerAir induction single 120° flat-fan9034.60
TTI60 110 03TeeJetAir induction dual 110° flat-fan with 30° forward and backward angle9032.81
AVI 110 025AlbuzAir induction single 110° flat-fan754.54.00
TTI60 110 025TeeJetAir induction dual 110° flat-fan with 30° forward and backward angle754.52.97
APTJ 110 03TeeJetNon-air induction dual 110° flat-fan with 30° forward and backward angle? 232.76
1 According to Belgian legislation; 2 Not classified, assumed to be zero in the absence of testing.
Table 3. Dates for sowing, spraying, and harvesting in the three dose–response experiments.
Weed Species (Experiment)Growth Stage 1Date
SowingSprayingHarvesting
C. album
(Exp. 1)
BBCH1026 May 20236 June 202322 June 2023 (bentazon, phenmedipham)
26 June 2023 (tembotrione)
BBCH1217 May 2023
S. nigrum
(Exp. 2)
BBCH1029 June 202313 July 20234 August 2023 (bentazon, phenmedipham)
7 August 2023 (tembotrione)
BBCH1221 June 2023
E. crus-galli
(Exp. 3)
BBCH124 August 202316 August 20237 September 2023
BBCH1427 July 2023
1 Phenological stage: BBCH10 (cotyledon stage), BBCH12 (2-leaf stage), and BBCH14 (4-leaf stage).
Table 4. Mean day- and night-time temperatures and relative humidity during the dose–response experiments.
Weed SpeciesTimingExperimental Period 1Temperature (°C)Relative Humidity (%)
Min.Max.Avg.Min.Max.Avg.
C. albumPre-applicationBBCH12: 17 May–5 June
BBCH10: 26 May–5 June
8.3
9.6
20.2
21.8
14.4
15.6
52.3
46.6
91.0
88.0
71.9
68.1
Day of application06 June10.816.824.156.491.075.3
Post-application6 June–22 June (bentazon; phenmedipham)
6 June–26 June (tembotrione)
14.3
14.3
27.3
27.2
20.9
20.9
46.3
46.3
88.1
88.9
66.8
67.4
S. nigrumPre-applicationBBCH12: 21 June–12 July
BBCH10: 29 June–12 July
13.9
13.5
25.0
24.8
19.4
19.0
52.8
51.4
92.3
92.3
73.0
72.3
Day of application13 July13.623.518.250.891.072.1
Post-application13 July–4 August (bentazon; phenmedipham)
13 July–7 August (tembotrione)
14.0
13.6
22.0
21.5
17.6
17.3
60.9
61.7
93.3
93.4
79.2
79.8
E. crus-galliPre-applicationBBCH14: 27 July–15 August
BBCH12: 04 August–15 August
13.0
20.7
21.7
28.9
17.5
17.5
65.1
61.9
95.583.0
Day of application16 August13.218.923.964.097.681.1
Post-application16 August–7 September14.125.119.566.2100.086.7
1 Phenological stage: BBCH10 (cotyledon stage), BBCH12 (2-leaf stage), and BBCH14 (4-leaf stage).
Table 5. Threshold values used in ImageJ to analyse the spray coverage on water-sensitive paper (WSP) and plant leaves.
ImageJ FunctionParametersSpray Coverage on WSPSpray Coverage on Plant Leaves
Blue AreaTotal Leaf AreaWhite Area
Color thresholdHue0–2550–2550–221
Saturation0–1550–1830–32 or 0–51
Brightness0–25564–255125–255
Analyse particlesPixel size0–infinity350–infinity[10–250]-infinity
Circularity0.01–10.1–10.01–1
Disclaimer/Publisher’s Note: The statements, opinions and data contained in all publications are solely those of the individual author(s) and contributor(s) and not of MDPI and/or the editor(s). MDPI and/or the editor(s) disclaim responsibility for any injury to people or property resulting from any ideas, methods, instructions or products referred to in the content.