Article

A Novel Method to Forecast Nitrate Concentration Levels in Irrigation Areas for Sustainable Agriculture

by
Halil Karahan
1,* and
Müge Erkan Can
2
1
Department of Civil Engineering, Pamukkale University, Denizli 20160, Turkey
2
Department of Agricultural Structures and Irrigation, Cukurova University, Adana 01250, Turkey
*
Author to whom correspondence should be addressed.
Agriculture 2025, 15(2), 161; https://doi.org/10.3390/agriculture15020161
Submission received: 29 November 2024 / Revised: 4 January 2025 / Accepted: 10 January 2025 / Published: 13 January 2025

Abstract

:
This study developed an ANN-based model to predict nitrate concentrations in drainage waters using parameters that are simpler and more cost-effective to measure within the Lower Seyhan Basin, a key agricultural region in Turkey. For this purpose, daily water samples were collected from a drainage measurement station during the 2022 and 2023 water years, and nitrate concentrations were determined in the laboratory. In addition to nitrate concentrations, other parameters, such as flow rate, EC, pH, and precipitation, were also measured simultaneously. The complex relationship between measured nitrate values and other parameters, which are easier and less costly to measure, was used in two different scenarios during the training phase of the ANN-Nitrate model. After the model was trained, nitrate values were estimated for the two scenarios using only the other parameters. In Scenario I, random values from the dataset were predicted, while in Scenario II, predictions were made as a time series, and model results were compared with measured values for both scenarios. The proposed model reliably fills dataset gaps (Scenario I) and predicts nitrate values in time series (Scenario II). The proposed model, although based on an artificial neural network (ANN), also has the potential to be adapted for methods used in machine learning and artificial intelligence, such as Support Vector Machines, Decision Trees, Random Forests, and Ensemble Learning Methods.

1. Introduction

Monitoring water quality is essential for sustaining natural water bodies and ensuring clean drinking water. Numerous factors have led to the routine measurement of a variety of water quality measurements in rivers, lakes, and groundwater, including nitrate (NO3), pH levels, dissolved oxygen, and others. These variables assist in monitoring the health of aquatic ecosystems, identifying potential sources of pollution, and developing mitigation plans. Of these, nitrate concentrations are particularly important because high levels in natural streams can lead to eutrophication, which lowers oxygen levels and negatively impacts aquatic life. Nitrate occurs in both surface and groundwater due to natural processes and anthropogenic activities. The main contributors to the occurrence of nitrates in both surface and groundwater include decomposed plant and animal wastes, certain categories of solid waste, household waste, wastewater from industrial processes, agricultural fertilizers, and wastewater from sewage treatment plants [1,2,3].
Elevated nitrate concentrations in wastewater indicate both a deficiency in essential nitrogen fertilizers and reduced production efficiency. Therefore, it is essential to monitor the movement of nitrate nitrogen in conjunction with intensive agricultural and livestock production methods. The use of neural networks represents a promising innovative tool for the precise simulation of complex nitrogen dynamics in artificially drained soils [4]. Due to its impact on water quality and ecosystem integrity, nitrate contamination occurs in shallow groundwater, and natural water poses serious environmental management and public health problems. Continuous sampling over time to monitor nitrate levels provides crucial insights into pollution trends and informs remediation strategies. However, gaps often appear in these datasets for a variety of reasons, including technical limitations or errors in data processing, requiring accurate techniques to fill in missing values to maintain data integrity and the quality of subsequent analysis. Missing values in these time series datasets complicate data analysis because they can distort statistical results and make it difficult to create trustworthy water management plans. To maintain the integrity of long-term monitoring datasets, accurate missing value imputation techniques are essential.
Significant data gaps and restricted public access in some areas characterize the inadequacy of global databases on groundwater quality [5,6,7]. Protecting ecological integrity and public health requires stepping up research and groundwater quality monitoring [8,9,10,11].
A number of factors, including equipment malfunctions, sampling problems, or external circumstances that may make routine data collection impossible, can result in missing water quality datasets. Monitoring water quality processes and characterizing contaminants involves significant financial and labor costs, requiring extensive sampling initiatives and complex laboratory testing. Therefore, current efforts are focused on developing novel innovations aimed at improving the practicality of these efforts. Due to the interactions and correlations among water quality parameters, such as the concentrations of anions and cations, it is pertinent to examine whether a domain-specific mechanism that governs the observed patterns is present, thereby affirming the predictability of these parameters. The discovery of such predictive models holds particular significance for ecologists and environmental scientists, as it equips them with the capability to forecast water pollution levels and implement necessary precautionary measures proactively in advance [12,13].
Considerable progress in machine learning applications has improved the ability to forecast the presence of such contaminants as fluoride, nitrate, and arsenic [14,15,16,17]. Nonetheless, the ongoing discharge of dangerous substances as a result of human activity still poses new risks, which calls for changing study approaches [18,19]. To guarantee water sustainable management, specific measures are needed to keep the quality of water resources within reasonable and feasible bounds while meeting demands. Thus, it is essential to comprehend how pollutant-water systems behave and how NO3 is transported to a point where it can be predicted how it would react to different modifications. In the absence of a hydrogeological database, the artificial intelligence method can be trained using data from multiple sources at different sizes to solve and predict complicated processes. [20].
Recently, stochastic modeling techniques, such as artificial neural networks (ANNs) other than those used in image processing (e.g., convolutional neural networks), have attracted significant scientific interest due to their simplicity, fast computational capabilities, and relative effectiveness compared to deterministic models [21,22]. To maintain the integrity of long-term monitoring datasets, accurate missing value imputation techniques are essential. Predictive modeling methods such as ANNs are useful in this situation. The main challenge is training the model to accurately predict missing points, especially when the data gaps are large or when the data gaps include critical seasonal fluctuations. Since nitrate is considered the primary measure for assessing groundwater pollution due to feedlot waste or other agricultural activities, it is important to carefully monitor nitrate-nitrogen (NO3-N) concentrations in both surface groundwater and subsurface runoff. Nitrate leaching from agricultural fields receiving manure and fertilizers is typically significantly higher in subsurface drainage effluents than in surface runoff [23].
In environmental sciences and hydrology, ANNs are effective tools for predicting missing values in time series data. Inspired by the neural architecture of the human brain, ANNs are particularly well suited to predicting missing nitrate levels because they can capture the many nonlinear correlations in environmental datasets. ANNs are able to learn patterns and trends from previous nitrate readings and associated environmental variables, helping them predict missing values with a high degree of accuracy. One of the main advantages of ANNs is their ability to extract knowledge from incomplete datasets. With appropriate training, ANNs have the ability to “generalize” from the recognized patterns in the available data to extrapolate missing values. In this context, the input variables fed to the ANN include historical nitrate concentrations, meteorological data, and possibly other ecological indicators. By incorporating information from these inputs, the ANN anticipates the missing nitrate concentrations within the time sequence.
Estimating nitrate concentrations using cost-effective technologies is essential. Black box models such as ANNs are attracting great interest in predicting nitrate concentration by using easily measurable water quality parameters such as temperature, electrical conductivity (EC), groundwater level, and pH. In this context, ANNs do not require prior knowledge of the structure and possible relationships between significant variables. Furthermore, the inherent learning capabilities of ANNs have resulted in their ability to adapt to systemic changes [24]. ANNs are used for the purpose of modeling complex processes, recognizing patterns, and performing time series analysis in various scientific disciplines, including, but not limited to, financial and economic research, industrial engineering studies, hydrological studies, meteorological analysis, and agroecological research efforts [25,26,27,28,29,30,31,32]. Stamenković [33] worked on research pertaining to the forecasting of nutrient concentrations within river systems at a national scale, employing two distinct artificial intelligence methodologies. The methodologies of artificial neural networks (ANN) and support vector machines (SVM) were utilized to estimate the annual concentrations of nitrate and phosphate across the rivers of eleven European nations in this research. The results obtained indicate that the Artificial Neural Network (ANN) demonstrates superior efficacy in forecasting nitrate and phosphate concentrations in comparison to Support Vector Machine (SVM) models. Such findings emphasize that the ANN model represents a potentially advantageous instrument for the prediction of nutrient levels in fluvial systems. Stamenković et al. [34] used a multilayer ANN model to predict nitrate concentrations in the Danube River through Serbia using water quality data observed at ten monitoring stations between 2011 and 2016. Pearson correlation and variance inflation factor analysis were used to decide which of the measured parameters should be used to determine the inputs of the model. According to the correlation analysis, 7 parameters were selected as input values, and according to the VIF analysis, 21 parameters were selected as input values. For both cases, the number of neurons in the hidden layer was 20. The results of the analysis showed that the model performance was the highest when seven parameters were selected as input. RMSE, MAE, and R2 values were used to determine the model performance and were calculated as 0.68, 0.42, and 0.91, respectively. Also, in similar studies conducted on this subject, several researchers have proposed neural networks that use water budget variables or water quality metrics as input parameters for nitrate pollution modeling [35]. Band et al. [36] modeled groundwater nitrate concentration in the Marvdasht basin of Iran based on various artificial intelligence methods such as Support Vector Machines (SVM), Cubist Random Forests (RF), and Bayesian Artificial Neural Networks (Baysian-ANN). For this purpose, nitrate levels were measured in 67 wells in the study area and used as dependent variables for modeling. As model inputs, 11 independent variables such as elevation, slope, plan curvature, profile curvature, precipitation, piezometric depth, distance to river, distance to settlements, sodium (Na), potassium (K), and topographic wetness index (TWI) that affect groundwater nitrate changes were selected by considering the Pearson correlation matrix. It is stated that data from 67 wells with nitrate measurements were used in the modeling; 70% of the data were used as training data and 30% were used as test data. Evaluation criteria such as coefficient of determination (R2), mean absolute error (MAE), root mean square error (RMSE), and Nash–Sutcliffe efficiency (NSE) were used to evaluate the performance of the models. The RF model (R2 = 0.89, RMSE = 4.24, NSE = 0.87) was reported to give better results than the other models. It can be seen that the model performances are quite good. However, the lack of an evaluation of whether the input and output values are simultaneous or not and the lack of a time variation of the model results constitute the shortcomings of the model. Hrnjica et al. [37] used deep neural networks (DNNs) and traditional artificial neural networks (ANNs) to model and predict nitrate concentration in the Klokot River in Bosnia and Herzegovina. The measurements of NO3(t), pH(t), NO3(t-1), and pH(t-1) were used as inputs to predict NO3(t+1) as the output of the model. MSE was used as the error evaluation function, and 64 neurons were used in the hidden layer. The authors stated that the test performance of both DNN and ANN networks was low due to the overfitting of both models. In conclusion, the authors stated that they were not able to accurately model the nitrate concentration in the Klokot River, but DNN was slightly better than ANN in terms of prediction accuracy. This is thought to be due to the very low correlation between nitrate and pH and the large number of neurons used in the model (64). This is because it is known that, when the appropriate network architecture is not selected in ANN models, test performance decreases due to excessive learning [38]. Another group [39] used an ANN as a now-type model to estimate the nitrate contamination of the aquifer in the Gaza Strip. A simpler model using pH, temperature, electrical conductivity, and aquifer level as input parameters has been presented as well [39]. If long time series are available, neural networks can be used for long-term prediction of nitrate concentrations in groundwater [3].
In another study, a more straightforward model with aquifer level, pH, temperature, and electrical conductivity as input parameters was introduced [40]. Neural networks can be used to predict groundwater nitrate concentrations over an extended period of time if long time series are provided [3]. A more recent study [41] evaluated nitrate risk zones by comparing machine learning methods.
Stylianoudaki et al. [42] aimed to estimate the nitrate (NO3) concentration in groundwater using artificial neural networks (ANN) with data that can be easily measured in situ. In the study, chemical and physical analysis data of groundwater samples taken from wells in the Kopaid Plain and Asopos River Basin in Greece were used, and it was stated that the data consisted of 112 records collected from sixteen wells at equal intervals four times a year. The study was conducted in two different scenarios. Pearson correlation values were taken into account in the selection of input values, and in the first scenario, easily measurable data such as pH, electrical conductivity, water temperature, air temperature, and aquifer level were used as inputs to the model. In the second scenario, land use percentages were added to the model inputs in addition to those used in Scenario 1. A trial-and-error procedure was applied to determine the optimum network structure of the model, and the optimum number of neurons was selected as 10. As activation functions, the sigmoid activation function in the hidden layer and the linear activation function in the output layer were selected. The dataset used in the training and testing phases was randomly selected as 80% and 20% of the total data, respectively. RMSE and NSE measures were used to determine the model performance. While RMSE = 26.18 and NSE = 0.54 for Scenario 1, RMSE = 15.95 and NSE = 0.70 for Scenario 2. In other words, the addition of land use percentages to the input values resulted in a significant improvement in the performance of the model. According to Moriasi et al. [43], the model is considered to have a good sensitivity for NSE > 0.65.
El Amri et al. [44] developed Artificial Neural Network (ANN) and Autoregressive Integrated Moving Average (ARIMA) models to determine nitrate concentrations and predict future levels in the Mahdia-Kssour Essef shallow aquifer located in the central-eastern region of Tunisia. In this context, 11 factors were selected as input values as the main influencing factors associated with nitrate concentration in the Mahdia-Kssour Essef aquifer. These factors are depth to groundwater table (GT), number of livestock (L), amount of fertilizer (AF), land use—cereals (LUC), land use—vegetable crops (LUVc), land use—olive crops (LUOc), land use—fodder crops (LUFc), land use—fruit orchards (LUO), coarse texture of soil (SC), medium texture of soil (SM), and fine texture of soil (SF). The model was tested for 11 different input configurations using these factors, and the best results were obtained when all factors were used. The optimum number of neurons was determined as seven by trial and error. The ANN model showed good agreement between the measured and simulated results, and the coefficient of determination (R2), root mean square error (RMSE), and mean absolute error (MAE) values were 0.88, 53.95, and 39.64, respectively. It was also reported that the ANN results were better than those of the ARIMA model.
Deng et al. [45] used a dataset of hydrochemical test results of 316 groundwater samples collected from intensive agricultural areas in Northeast China between 2011 and 2015. A radial basis function artificial neural network (RBF ANN) prediction model and principal component regression (PCR) model were constructed using this dataset, and a particle swarm optimization algorithm was applied to determine the optimal parameter combinations of the RBF ANN. Input values were selected from a large number of basic chemical parameters with high correlations with nitrate. The results revealed that the RBF-ANN model provided a higher accuracy, but the PCR model offered better interpretability. Therefore, the integration of these two models is advantageous for nitrate prediction research.
Numerous publications also address the use of ANN models in sediment loss prediction, nutrient loadings to streams, daily reference evapotranspiration estimation, and drainage water management [4,46,47,48,49]. Chau [50] conducted a comprehensive examination of the integration and presented advancements pertaining to the incorporation of artificial intelligence within the domain of water quality modeling. Hatzikos et al. [51] employed neural networks characterized by active neurons as a methodological instrument for forecasting seawater quality parameters such as temperature, pH, dissolved oxygen, and turbidity. Wagh et al. [52] developed an ANN model capable of predicting nitrate concentration based on input variables such as EC, TDS, TH, Mg, Na, Cl, HCO3, and SO4. The researchers used various ANN algorithms to predict nitrate levels. The optimal ANN model consisted of seven and eight input neurons, six hidden neurons, and nitrate as the output variable in the pre- and post-monsoon periods in 2012. They proposed that neural networks are effective tools for water pollution prediction.
Latif et al. [53] developed and applied a three-layer feed-forward artificial neural network (ANN) model to predict nitrate (NO3), a water quality parameter (WQP), in the Feitsui reservoir (Taiwan). The optimum number of neurons was determined as 17 via a trial and error procedure by increasing the number of neurons from 1 to 20. Five water quality parameters were monitored and used as inputs to the model: ammonium (NH3), nitrogen dioxide (NO2), dissolved oxygen (DO), nitrate (NO3), and phosphate (PO4). The correlation coefficient (R) was used as a statistical measure to evaluate the performance of the model, and the results indicated that ANN is an accurate model for predicting nitrate as a water quality parameter in the Feitsui reservoir. The training, test, validation, and overall regression values were 0.92, 0.93, 0.99, and 0.94, respectively. The fact that the nitrate value predicted by the proposed ANN model was also one of the five input parameters of the model limits the reliability and applicability of the model.
Meng et al. [54] combined Artificial Neural Network (ANN) algorithm and electrochemical methods with artificial intelligence methods for the prediction and intelligent control of nitrate removal. Initial nitrate concentration, pH, time, and current density were used as model inputs, and optimized nitrate output values were used as outputs to maximize nitrate removal. As the network architecture, four input values, seven hidden layer neurons, and one output value were used. RMSE was used as the error evaluation criterion. Optimum nitrate removal and reduction in energy consumption were achieved by adjusting the input values. Since this was a prototype study, it is different from the presented study and other mentioned studies, and the similarity is limited to the use of ANN.
Long-term monitoring of nitrate levels is essential to track nutrient loading and ensure water quality. However, gaps in nitrate datasets, whether due to sporadic sampling or other issues, can have significant implications for data-driven decision making in water resource management. In this study, we evaluate the application of ANNs to predict missing nitrate levels in analyses of water samples regularly collected from the basin. We apply ANNs to predict, forecast, and fill gaps in the same set of missing water quality data, with a focus on nitrate concentrations in water samples. Various scenarios are considered as possible models for ANN structuring and used long-term datasets over specific time series in which gaps are intentionally inserted to simulate incomplete data scenarios. In this context, missing data scenarios are simulated by intentionally removing sections of a nitrate time series dataset and then using ANNs to predict the missing data. To validate the accuracy of the ANN predictions, we compare the predicted values with the actual nitrate measurements that were deliberately excluded from the dataset. This approach allows us to evaluate the performance of the ANN model in predicting missing nitrate levels using known ground truth data, assessing both the accuracy of the predictions and the robustness of the model in different environmental contexts. In addition, another important contribution of the study is that it promises practical implications for water resource management, which requires a lot of time, effort, technical work, and environmental monitoring. Accurate and timely prediction of nitrate concentrations not only helps with our understanding of contamination dynamics, but also supports decision-making processes aimed at mitigating negative impacts on water quality and human health.
A comprehensive review of the existing literature reveals that the majority of studies on estimating nitrate (NO3) concentrations using artificial intelligence models have primarily focused on groundwater, rivers, and reservoirs. These studies have generally relied on water samples collected at varying locations on a monthly or seasonal basis. Additionally, some investigations have addressed NO3 removal in these aquatic systems, though these studies remain limited in scope. Notably, a thorough examination of the literature indicates an absence of research directly aligning with the objectives of our study, particularly within the context of an irrigation basin. In this regard, our research represents a pioneering and novel contribution to the field. It provides a practical example of applying artificial intelligence methods in a real-world irrigation basin characterized by intensive agricultural activities. Over two hydrological years (2022–2023), simultaneous and daily water samples were collected from a single outlet point within the basin, where comprehensive data related to basin characteristics are recorded. These samples were analyzed in a laboratory setting to determine NO3 concentrations. The resultant data were subsequently evaluated using the specified artificial neural network (ANN) model. In this way, with this research, by validating the ANN predictions against actual measured values, we contribute to improving the reliability and usefulness of predictive models in water quality research. With this comprehensive approach, we also aim to provide valuable predictions on the potential of ANNs to improve the accuracy and reliability of nitrate prediction in natural water systems.

2. Materials and Methods

2.1. Study Area, Water Sampling, and Analysis

The Akarsu Irrigation District (AID), the research area, is located in the Lower Seyhan Plain (LSP) of Turkiye, in a catchment area extending over 9495 hectares [55,56]. This region predominantly has flat, homogeneous topography and a Mediterranean climate, with hot, dry summers and warm, rainy winters. The AID records 18.9 °C as the annual average, 9.0 °C as the lowest, and 31.0 °C as the highest air temperature. Furthermore, the catchment and its surroundings are reported to receive an average of 649.5 mm of annual precipitation [57]. In the research area, citrus fruits, wheat, onions, and potatoes were mainly grown in the 2022 winter season. In Turkey, the summer season usually lasts from 1 June to the end of August, and the winter season usually runs from 1 December to the end of February. The shallow groundwater table and water quality of this semi-arid region have been affected by prolonged, continuous irrigation [57]. The soil structure of the study area is generally heavy-textured with a high clay content, and excess water in the soil is drained through open drainage channels. Therefore, continuous water quality management is essential in this area.
Eleven distinct soil series (Incirlik, Arikli, Yenice, Innapli, Arpaci, Canakci, Mursel, Ismailiye, Golyaka, Gemisure, and Misis) comprise the soils of Akarsu [58,59], and 67% of the whole research area is covered by the Arikli (29.5%), Incirlik (25.3%), and Yenice (12.2%) series. Mursel (0.7%) and Innapli (1.03%) have the lowest distributions [59]. The Lower Seyhan Plain is not predominantly a karst area, but certain parts of the region might show some karst characteristics due to the underlying limestone formations. In the study area, groundwater levels are close to the plant root zone levels, especially during rainy seasons and periods when irrigation is intensive (average 1.5 m). The groundwater level in the study area typically varies between 1.5 and 3 m, with seasonal fluctuations that influence the water table and drainage dynamics. As the intensity of irrigation decreases towards the end of the hydrological year, the groundwater depth begins to fall below the root zone. At the end of the irrigation season and during periods of no precipitation, groundwater can exceed 2.5 m depth.
Figure 1 shows the AID, which is located in the eastern Mediterranean region of Turkiye. The map is a detailed overview of the Lower Seyhan Plain in Turkiye, with a focus on irrigation and drainage infrastructure. It includes a map showing the broader region and a smaller inset map focusing on the Lower Seyhan Plain itself. Flow directions represented with arrows indicate the irrigation and drainage flow directions of water within the plain.
The Lower Seyhan Plain is an agricultural area with a well-developed irrigation and drainage system. The pumping stations obtain water from a source (river, reservoir) to supply the irrigation canals. The measuring stations help monitor water flow and ensure efficient management of the system. As seen in Figure 1, an irrigation pumping station is used to pump water for agricultural areas; an irrigation gauging station measures the flow rate and water levels in irrigation canals. The drainage stations collect excess water from the fields and drain it into a suitable drain. Drainage water samples used in the study were automatically taken daily with the automatic water sampling device (ISCO-3700, Louisville, KY, USA) installed at the drainage gauging station where observations were made. The water samples were brought to Çukurova University, Faculty of Agriculture, Department of Agricultural Structures and Irrigation Laboratory to be prepared for analysis and were first recorded on the laboratory record sheet, then filtered with blue-band filter paper and transferred to plastic bottles cleaned by passing them through a chromic acid solution. The bottles were labeled according to the technique. Depending on the time and labor, the water samples were either analyzed immediately [60] or kept in the refrigerator at +4 °C until the analysis was performed. A Shimadzu brand spectrophotometer device was used in the analyses performed to determine the NO3 concentrations in irrigation and drainage waters in mg L−1 units.

2.2. Observed Data Used

The dataset used in the model studies was obtained through flow measurements taken at the drainage gauging station and laboratory analyses of collected water samples. Covering the 2022 and 2023 water years, the dataset spans 730 days and includes EC, pH, Q (Discharge), P (daily precipitation), NO3, and the DOWY (day of water year) value, which indicates the day of the water year for each measurement day to account for temporal variations in the dataset. Comprising 730 rows and 5 columns, the dataset was used in two scenarios during the training and testing phases of the proposed ANN model, with each scenario containing its own two different conditions. Detailed information regarding the scenarios is provided in Section 2.3.
As mentioned above, since measuring nitrate is a difficult and costly process, this study aims to develop a method to express nitrate values in terms of a few parameters that are easier and cheaper to measure, rather than relying on laboratory analyses. For this process, as seen in Figure 2, correlations between nitrate levels and the values of DOWY, EC, pH, Q, and P were calculated, and the highest correlation with nitrate was found to be inversely proportional to the flow rate (−0.668). This was followed by the correlation between nitrate and EC (0.623). Although the correlation between nitrate and the other parameters was relatively weak, preliminary tests indicated that using these parameters as inputs contributes positively to the model’s generalization and test performance.
The minimum, maximum, average, and standard deviations of nitrate concentrations and model parameters are summarized in Table 1. As shown in Table 1, the average nitrate concentration over the two years was 31.03 mg/L, with a standard deviation of 21.32 mg/L. The average daily discharge measured in the drainage channel was 3.19 m3/s, with a standard deviation of 1.96 m3/s. The variability of rainfall and EC (electrical conductivity) values was also quite high, indicating that the dataset used in the modeling process was particularly challenging. Despite this, a very good model performance was achieved. Additionally, it is important to highlight that the entire dataset consisted of real field data obtained from on-site measurements and laboratory analyses, which enhances the originality and value of the study.
In the correlation matrix provided in Figure 2, three different combinations were used in the preliminary calculations for selecting the network architecture of the model, based on the correlation relationships between the nitrate concentrations intended to be predicted using the proposed model and other parameters.
All the data used in the model are original and based on intensive field and laboratory measurements, requiring significant effort and time. In the preliminary evaluation for modeling, the data matrix was checked for duplicate rows, and no repeated data were found. Values that showed deviations in scatter plots were not excluded as outliers. This is because field observations revealed that, in cases of water scarcity, water from drainage channels was sometimes used for irrigation, or water was pumped into the irrigation area during dry seasons for use in irrigation. It was generally determined that the quality of the water used in these situations was lower compared to the primary water source for irrigation. Therefore, preserving extreme values was considered important both for future model development and for designing management strategies to be implemented in the field. For this reason, such values were not excluded as outliers from the dataset.
The temporal variations in the parameters used in the model and nitrate concentrations throughout the 2022–2023 water years are presented in Figure 3. As observed in Figure 3, there is a clear positive correlation between nitrate values and EC, and an inverse correlation with Q. It can generally be stated that there is no functional relationship between nitrate and the other parameters. However, it is noteworthy that these parameters significantly influence the model’s performance, particularly in predicting extreme values.

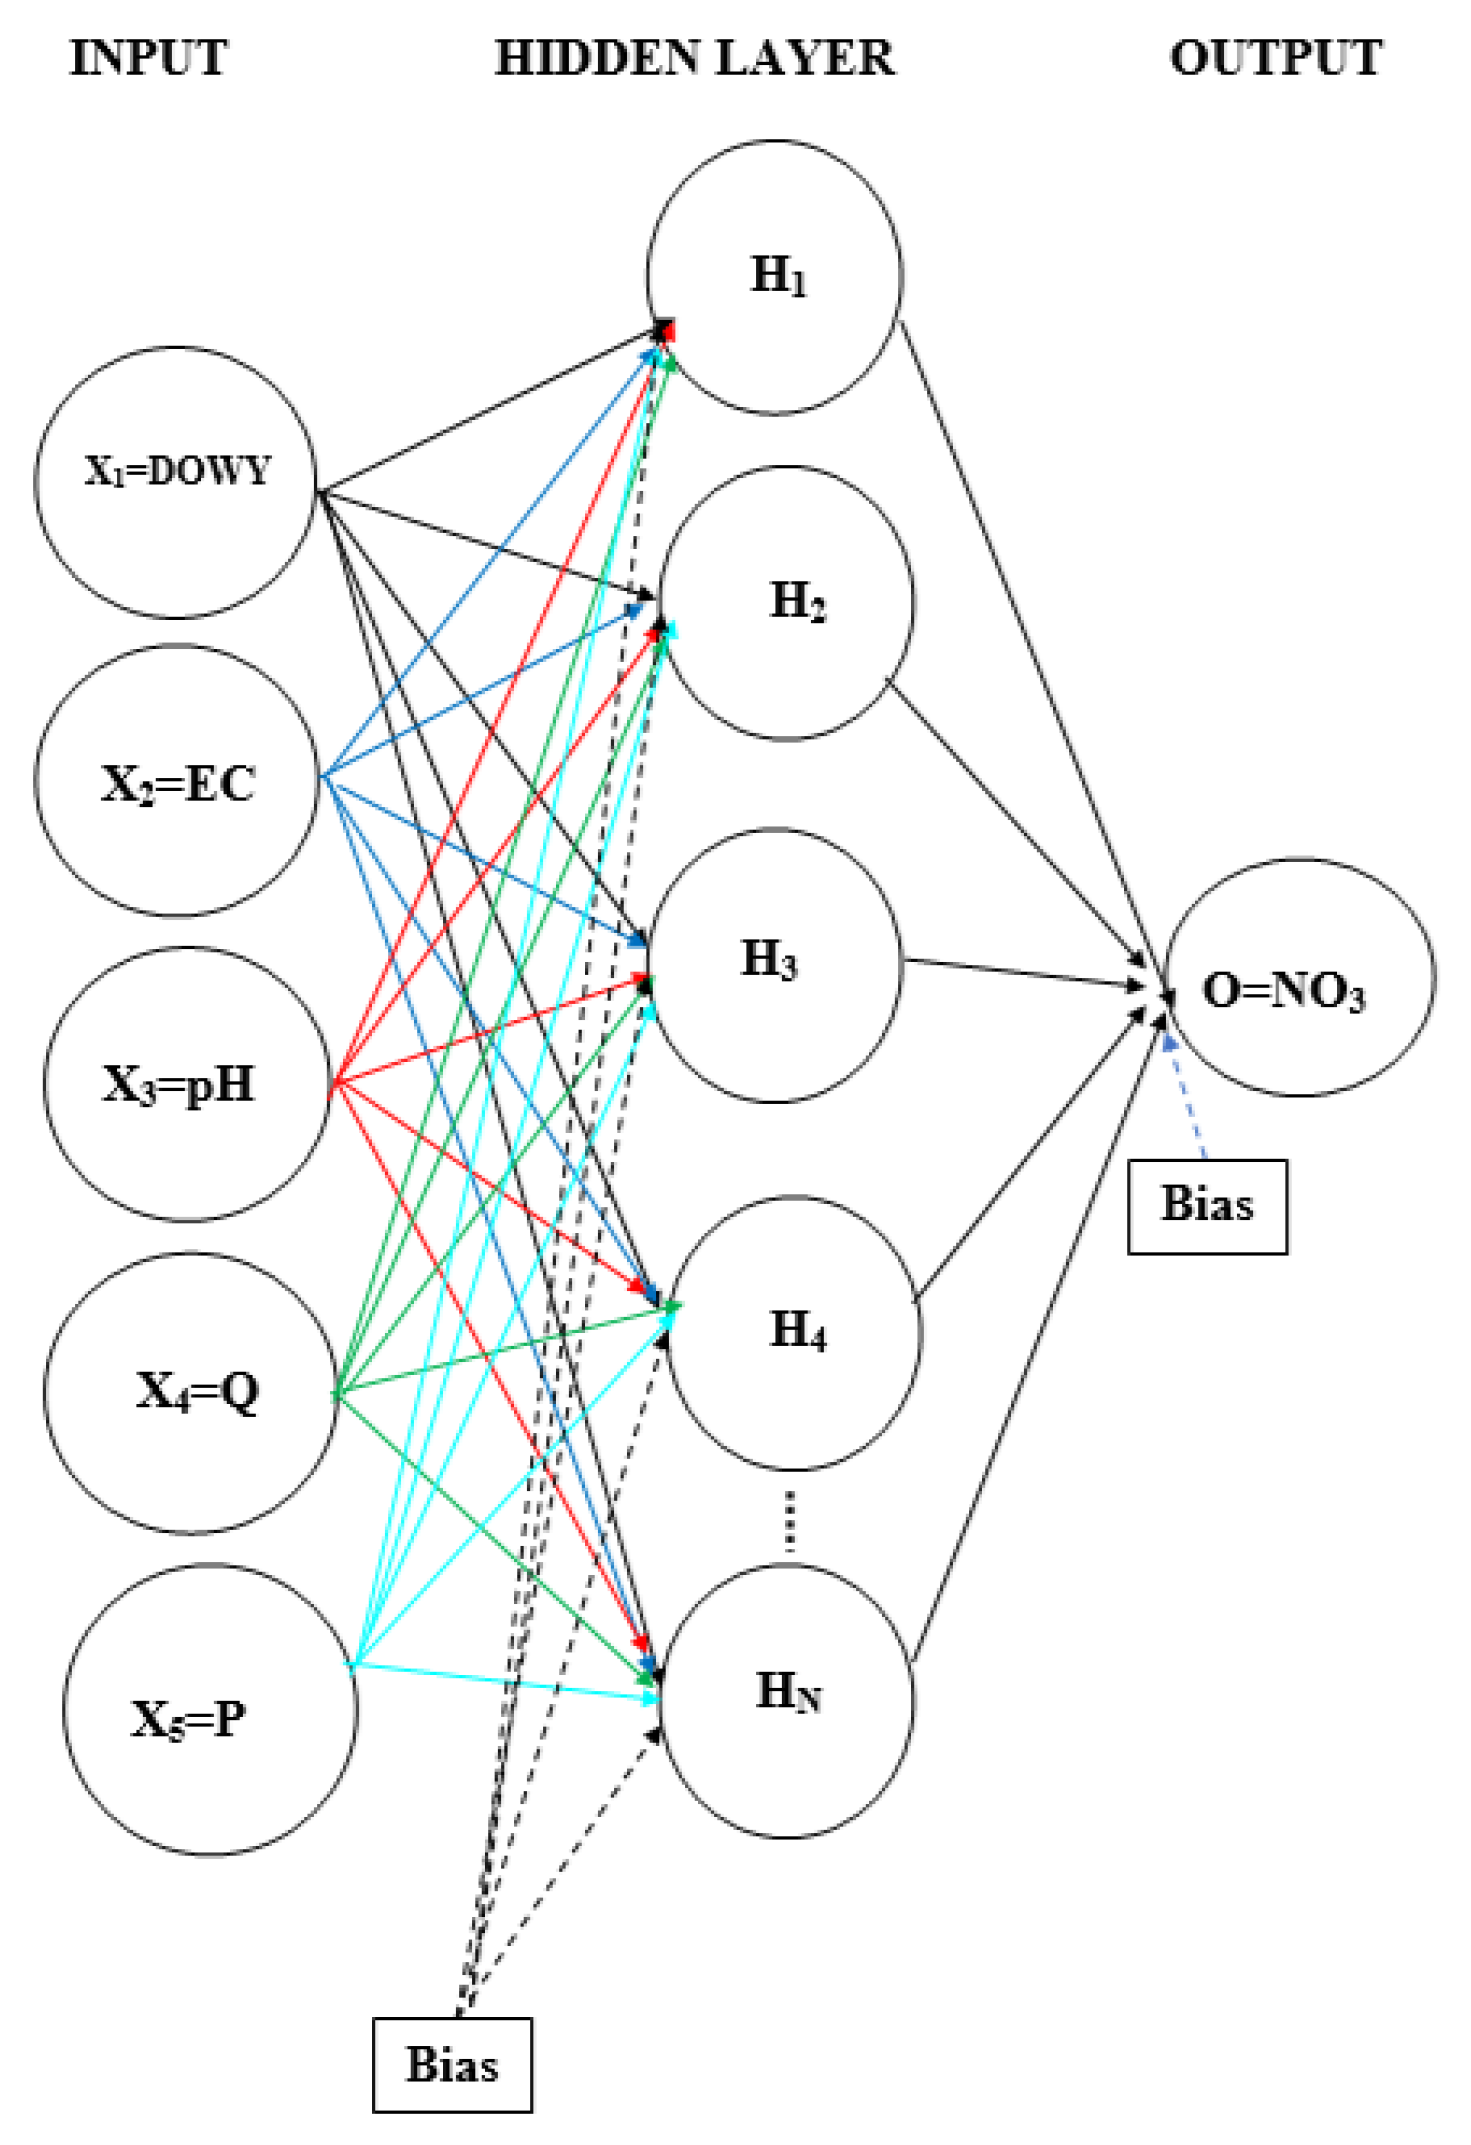
2.3. Developing an ANN Model for Nitrate Concentrations
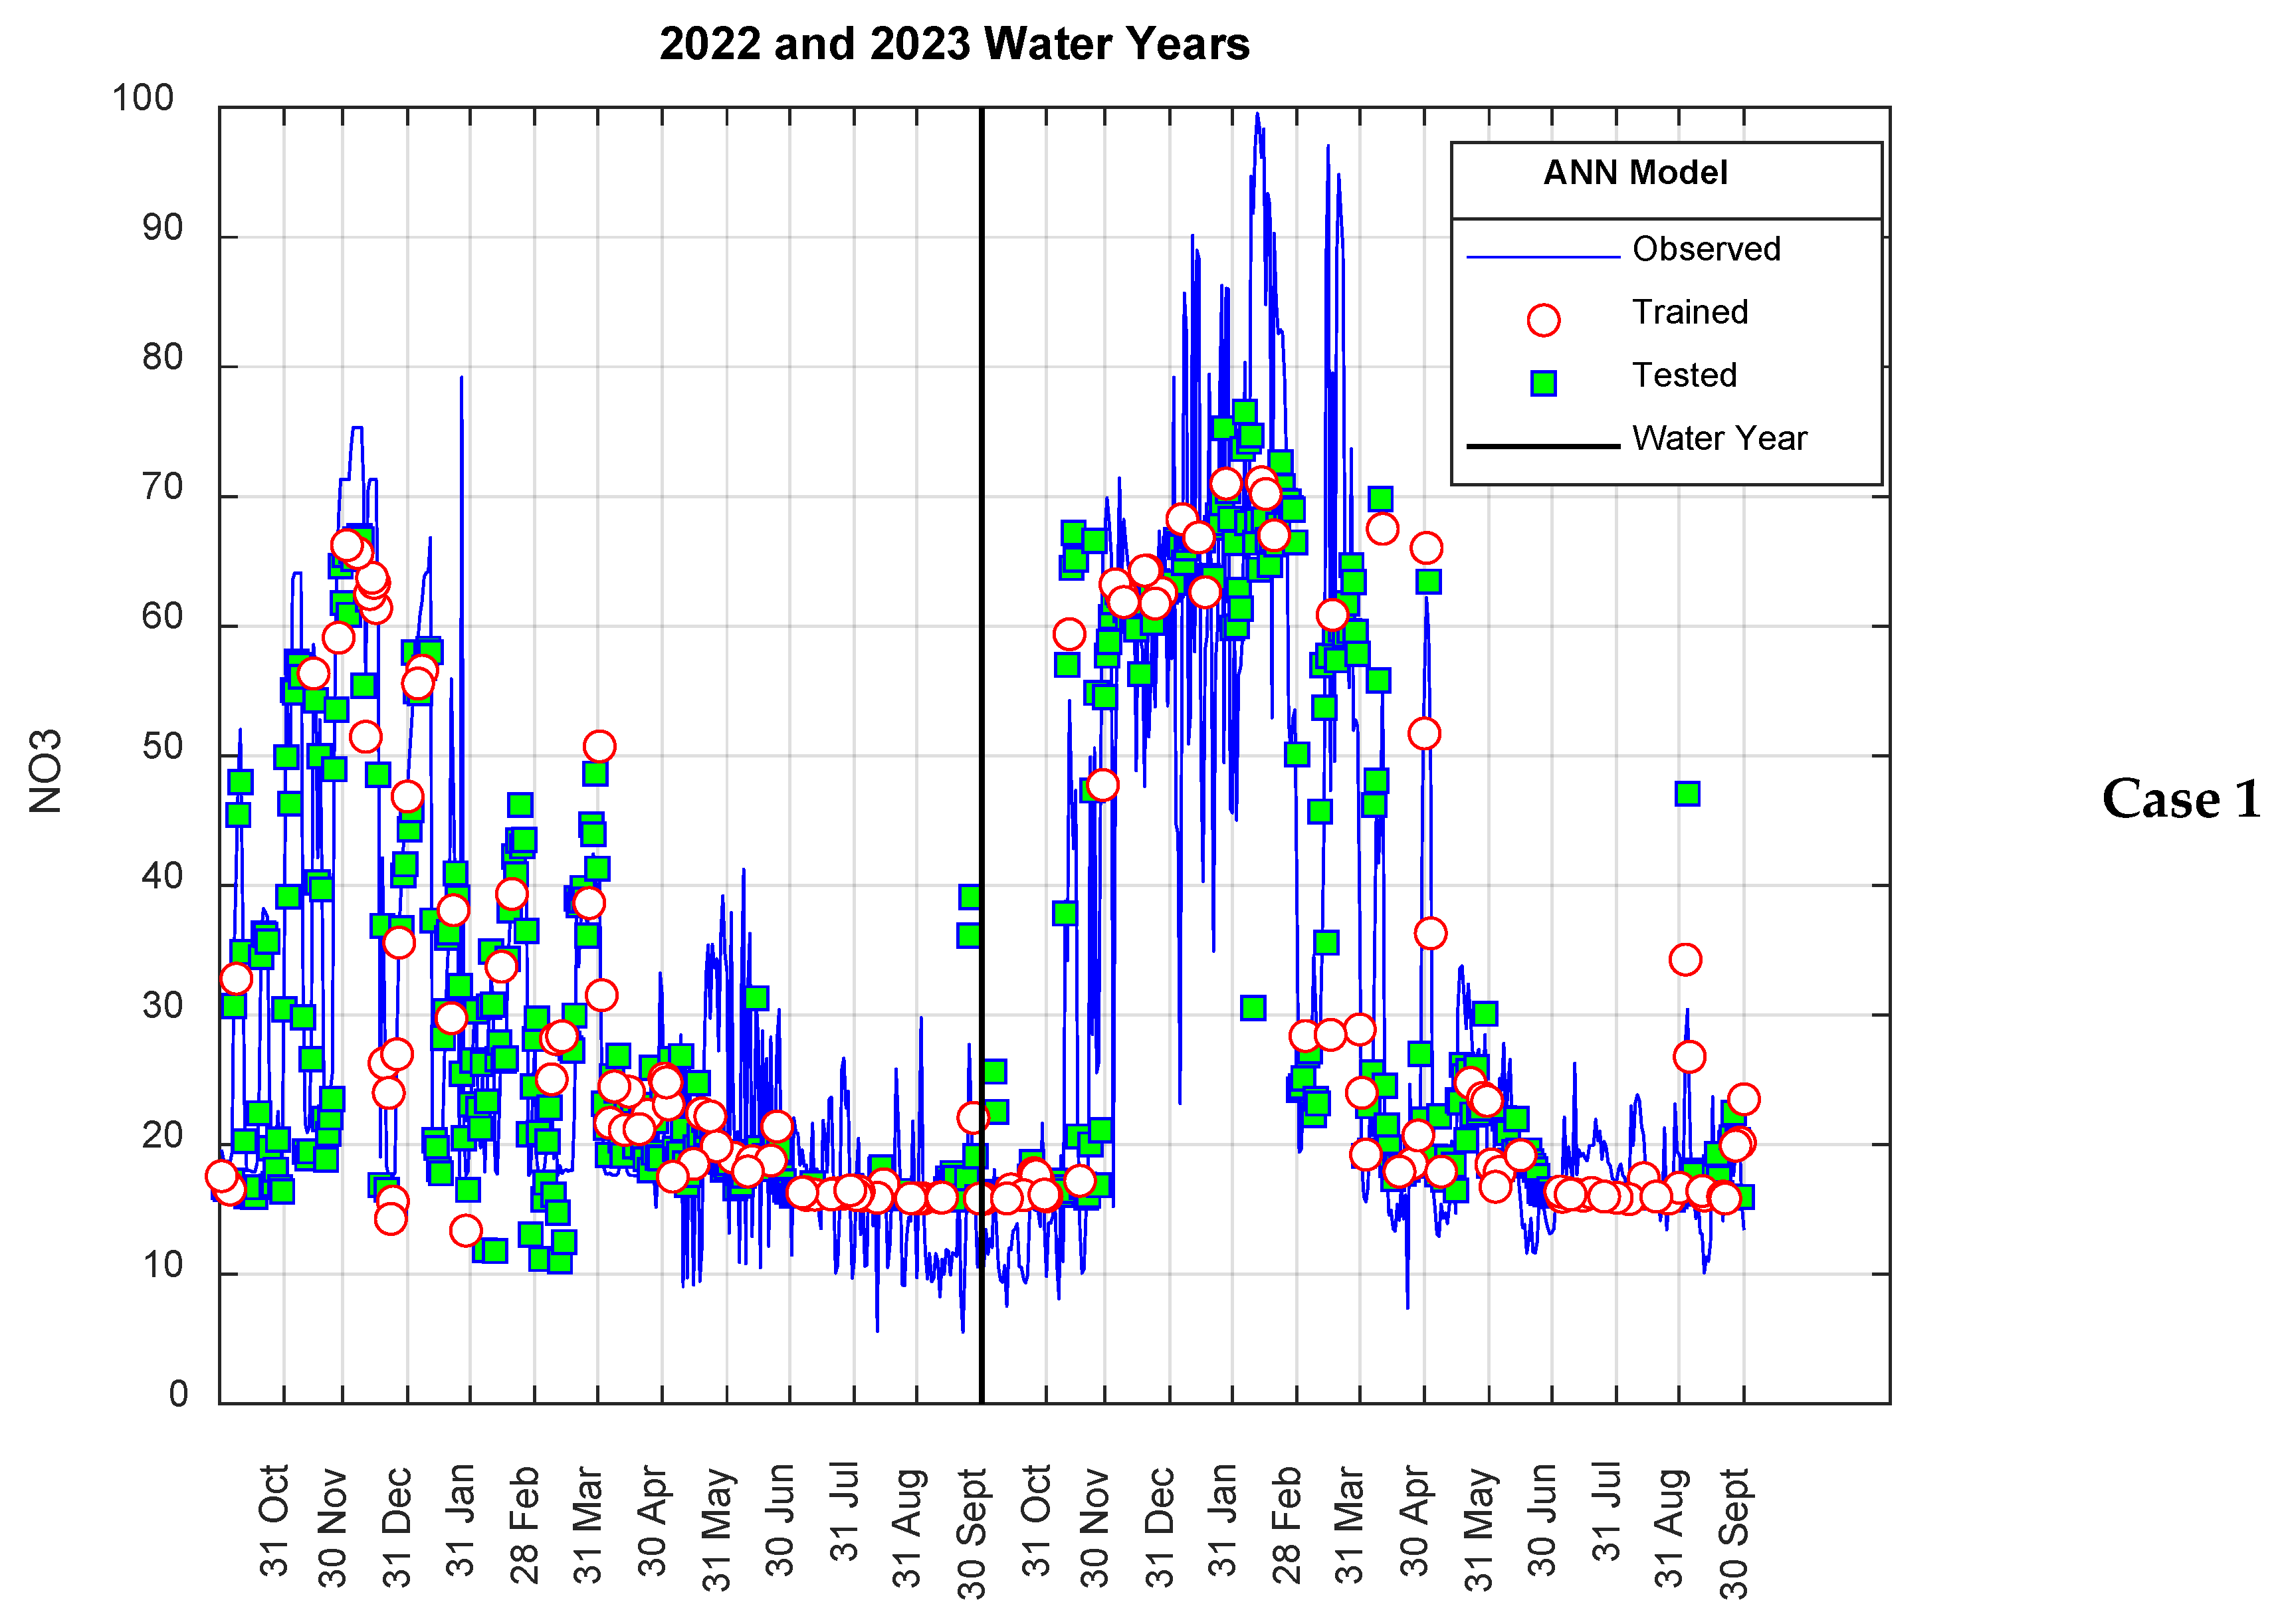
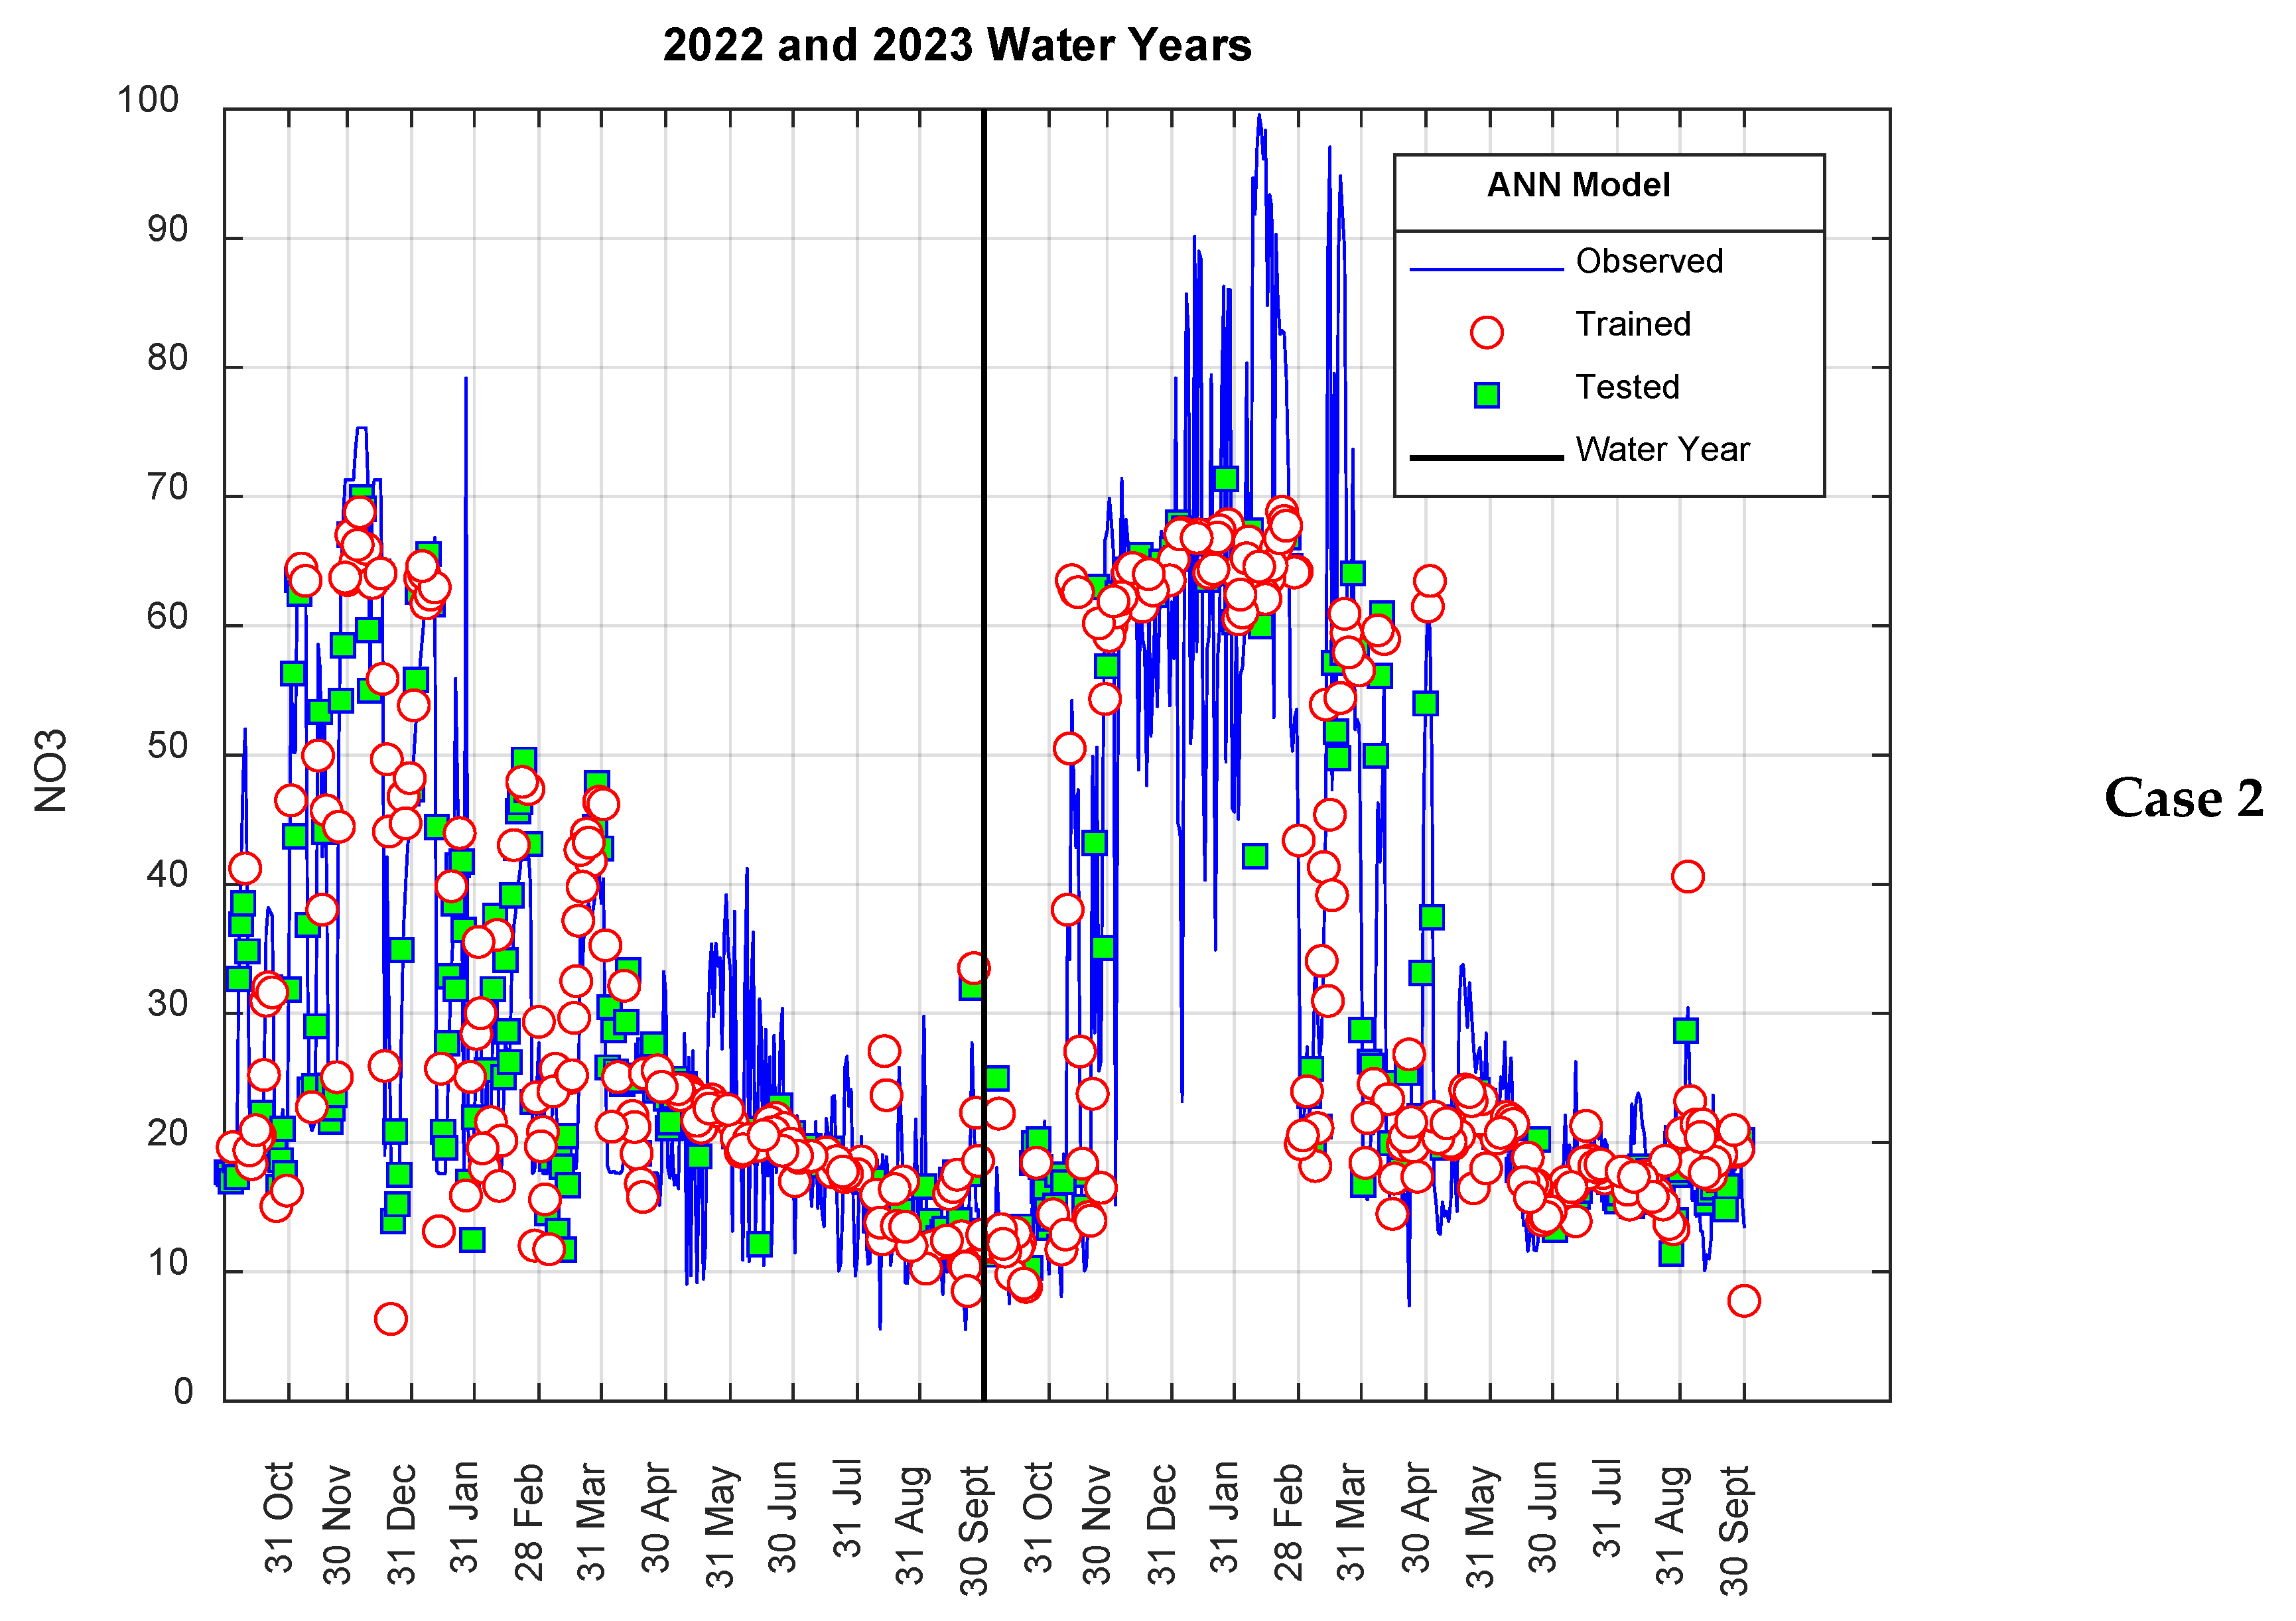
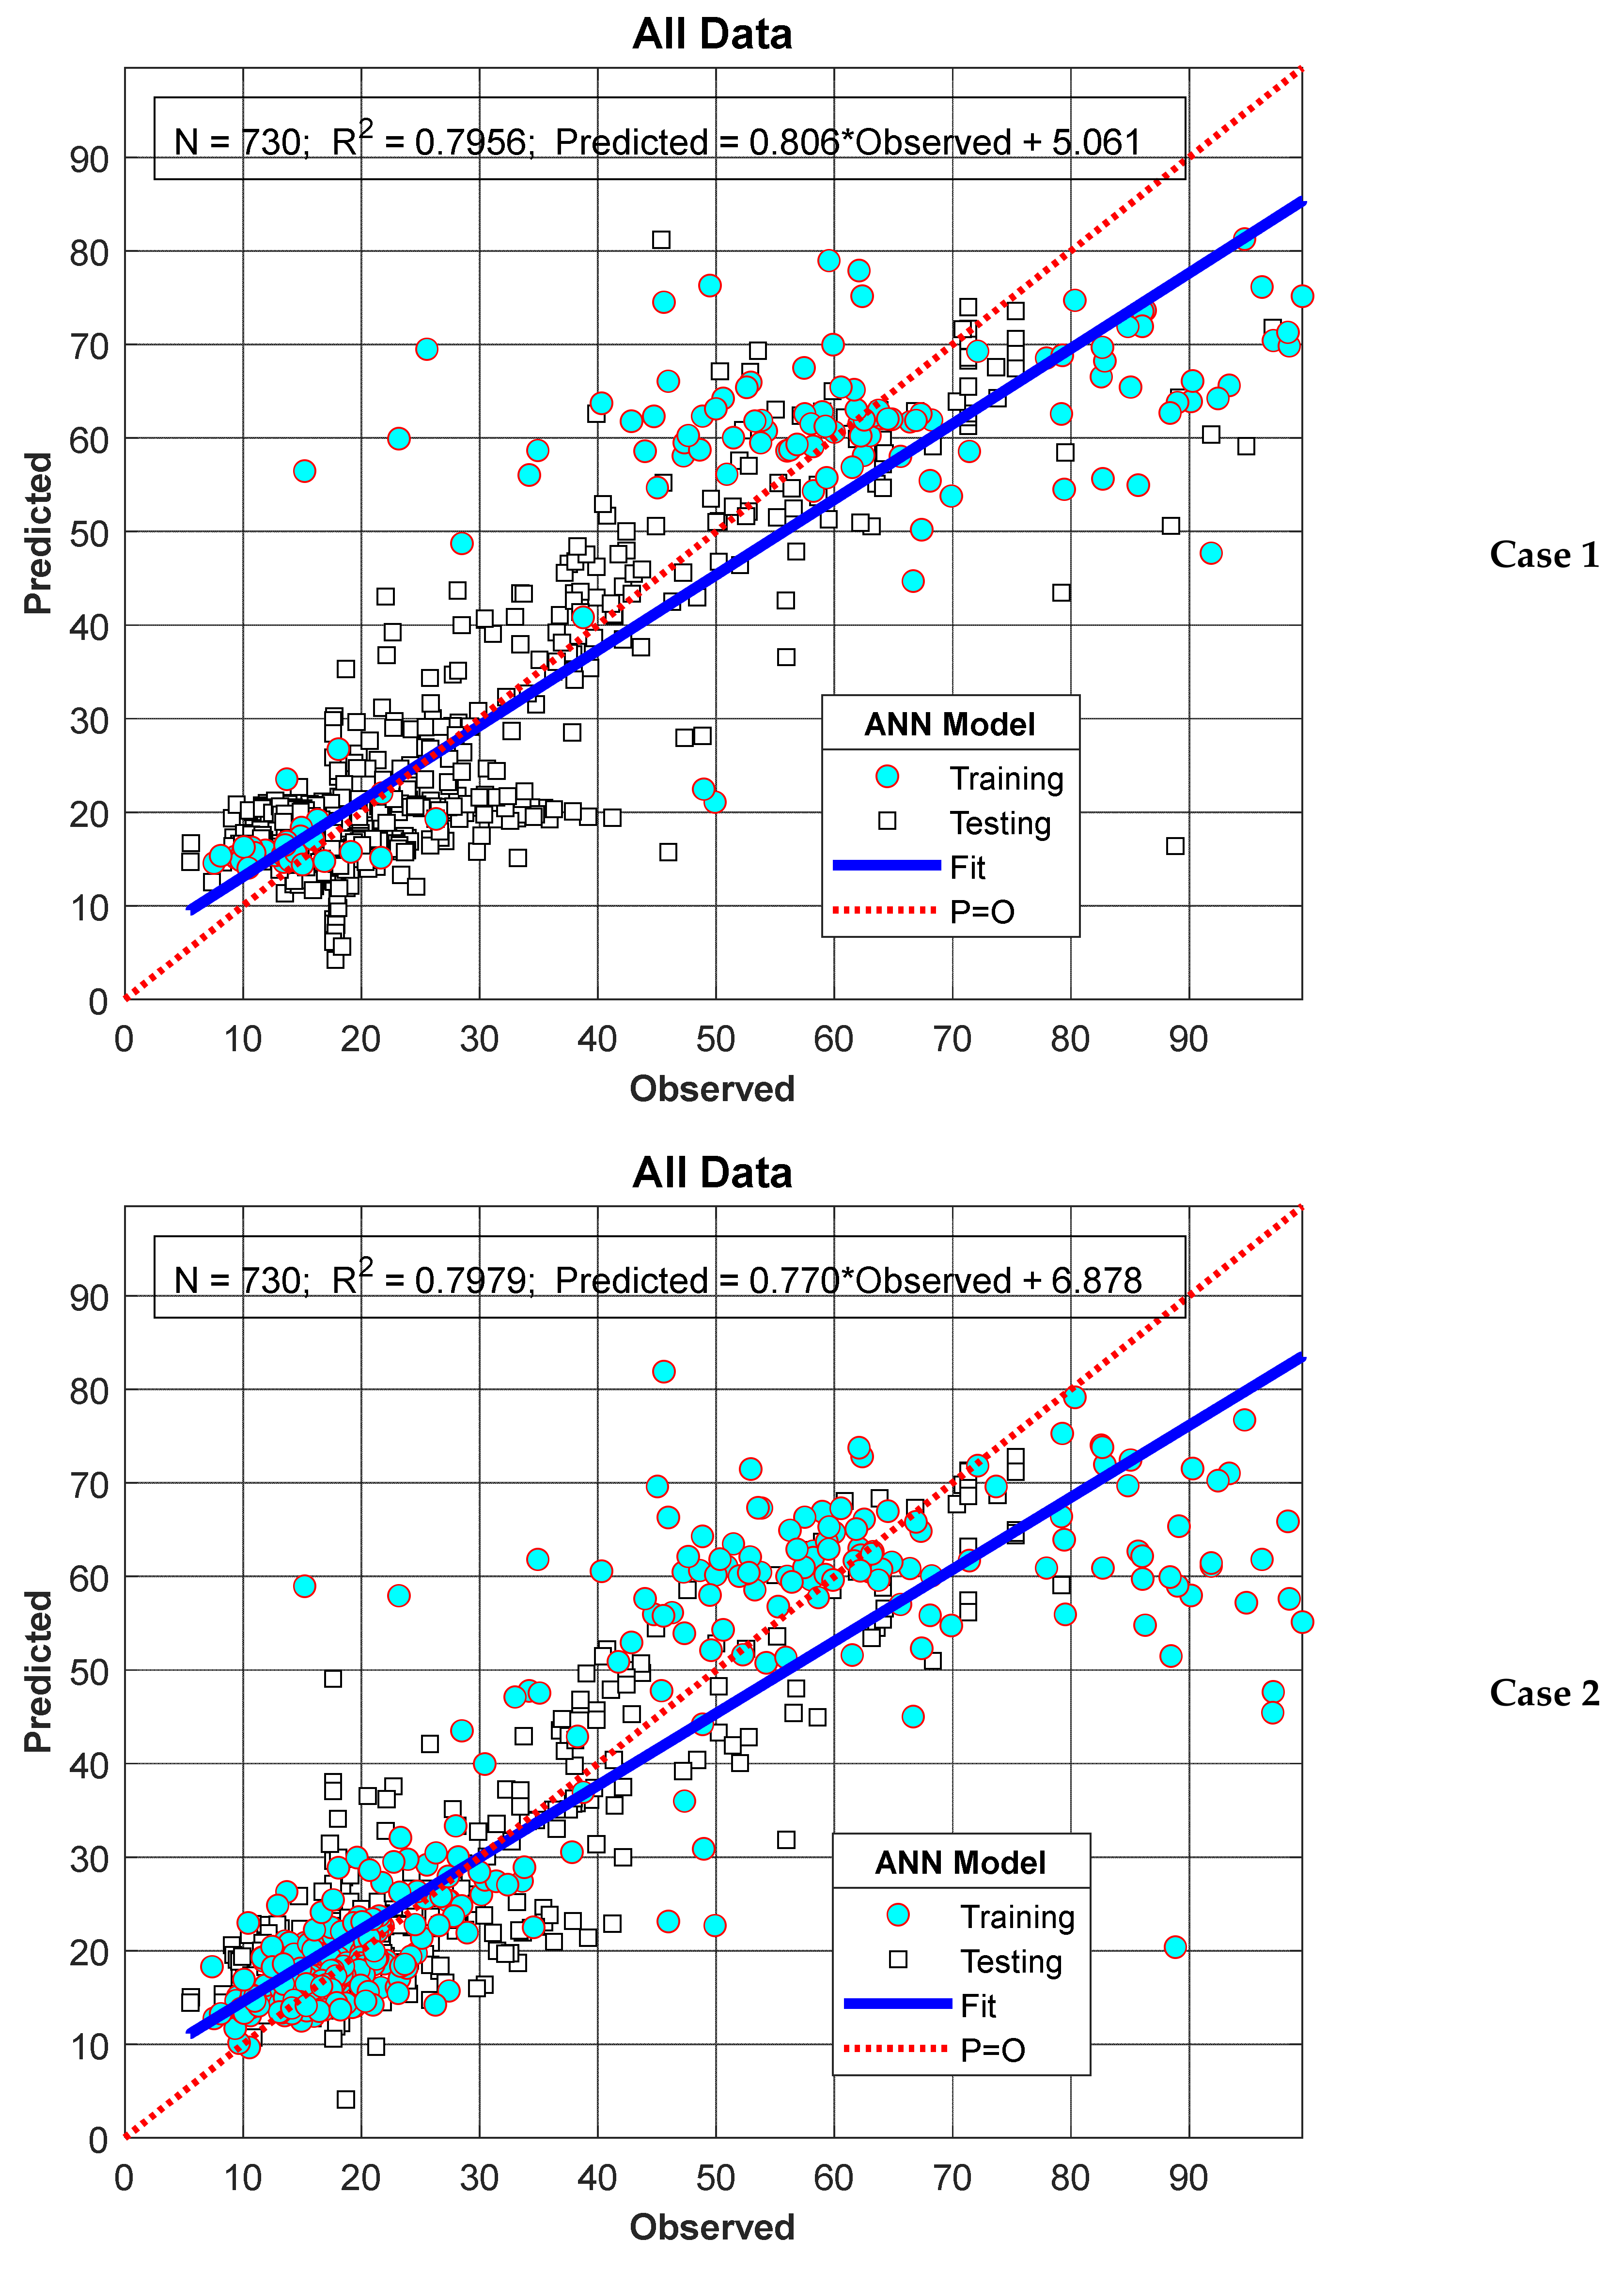
To determine the optimal number of neurons in the hidden layer, 80% of the data was used for training the network, and 20% was used for testing. This process was repeated for 100 different randomly selected training and testing datasets, and the Mean Squared Error (MSE) value was calculated. This process was repeated in a loop from 1 to the maximum number of neurons, which was 30 in this study; the number of neurons that yielded the minimum MSE value was selected as the optimal number of neurons; and the analyses were conducted accordingly [61,62]. As seen in Figure 4, the optimum number of neurons obtained for Scenario I and II was 12.
During the determination of the optimal number of neurons in the hidden layer and throughout the modeling process, the Levenberg–Marquardt algorithm—a fast and efficient learning algorithm that combines the precision of the Newton method with the stability of the gradient descent algorithm—was employed as the learning algorithm [63,64,65]. The hyperbolic tangent sigmoid function and the linear activation function were used as activation functions in the hidden layer and output layer, respectively. The hyperbolic tangent sigmoid function, which operates within the range of −1 to +1, enables faster learning capability during the weight update process [66,67]. Meanwhile, the linear activation function produces more natural results in the output layer, as it transmits the input without any linear distortion [68,69]. Preliminary trials were conducted to test the performance of the learning algorithm and activation functions, and the selections were made accordingly. The analyses performed on the aforementioned computer were completed within processing times ranging from 5 to 15 min for each case, depending on the amount of data used in training. The development, training, and testing phases of the proposed ANN model were conducted on a desktop workstation using the Python 3.13 programming language. The performance criteria used to determine model performance are provided in Appendix A.
In the selection of input values for the model, the correlation matrix was taken into account. Initially, EC and Q values, which showed a high correlation with nitrate, were tested individually. Subsequently, the DOWY parameter was added to demonstrate the effect of time. Finally, pH and P values, which have a low correlation with nitrate, were included. The model performance for each of these three scenarios is summarized in Table 2 using various evaluation metrics. As shown in Table 2, two, three, and five parameters were used as inputs, respectively. These were selected as [EC, Q], [DOWY, EC, Q], and [DOWY, EC, pH, Q, P]. The Mean Squared Error (MSE), a widely used error evaluation metric in the literature, was employed as the objective function to determine the model’s performance. Additionally, the obtained results were evaluated using other error assessment metrics (RMSE, MAE, MAPE, Pearson correlation coefficient, R2, NSE), and the model’s performance was summarized in Table 2. A strong agreement was observed between the results in Table 2 and the correlation matrix. Even when parameters with high correlation to nitrate were used as inputs, a very good performance was achieved. However, when parameters with lower correlation were included as inputs, a slight improvement in the model’s test performance was observed. This improvement, approximately 3–5%, is more noticeable in the scatter plots. Therefore, all the parameters mentioned above were used during the training and testing phases. After determining the optimal number of neurons in the hidden layer as 12, the optimal network architecture to be used in the model was defined as 5, 12, and 1 for the input, hidden, and output layers, respectively, as shown in Figure 5.

3. Results

The ANN-Nitrate model was implemented for the 2022 and 2023 water years using data obtained from the study area in two scenarios. In Scenario I, the data used in the training and testing phases were selected randomly from the dataset, while in Scenario II, they were chosen in two consecutive time periods. In Scenario I, the aim was to predict nitrate values for days without measurements due to various reasons within the measurement period, whereas in Scenario II, the aim was to predict values before or after the measurement period. For each scenario, the amounts of data used in the training phase of the model were chosen as 20% and 50% of the total data, labeled as cases 1 and 2, respectively.
The measured values and model results for Scenario I are provided in Figure 6 as Case 1 and Case 2, respectively. As can be seen from Figure 6, the model results show good agreement with the measured values in both cases and represent the overall trend quite well. In Figure 7, the alignment of the model results with the measured values is shown through scatter plots. The R2 values calculated for Case 1 and Case 2 are 0.7935 and 0.7831, respectively, which are considered to indicate that the proposed model has very good generalization and predictive capability.
Considering that the data ratio commonly used in the literature in the training phase of ANN models [38,61,70] is between 0.70 and 0.80, the fact that the results obtained using 20% of the dataset are very close to those obtained using 50% of the dataset, and that they represent the actual situation quite well, indicates that the model’s input values and architecture could be a good alternative for predicting nitrate values.
In Scenario II, unlike in Scenario I, the data used for training and testing the ANN-Nitrate model were selected sequentially. In the training phase of the model, the first 0.20 and 0.50 portions of the dataset were used for case I and case II, respectively, and the remaining 0.80 and 0.50 were predicted in the testing phase. The results obtained for Scenario II are presented in Figure 8. As can be seen from Figure 8, there was very good agreement between the model results and the measured nitrate values, and the overall trend was accurately reflected.
In Figure 9, the model results obtained for Scenario II are presented as a scatter plot against the measured nitrate values. As shown in Figure 9, the R2 values were calculated as 0.7789 and 0.7598 for case I and case II, respectively. It can be noted that the R2 values calculated for Scenario II are somewhat lower than those in Scenario I. However, as seen in case II, it is expected that model performance will decrease as the prediction period increases. This situation will be discussed in more detail in the next section.

4. Discussion

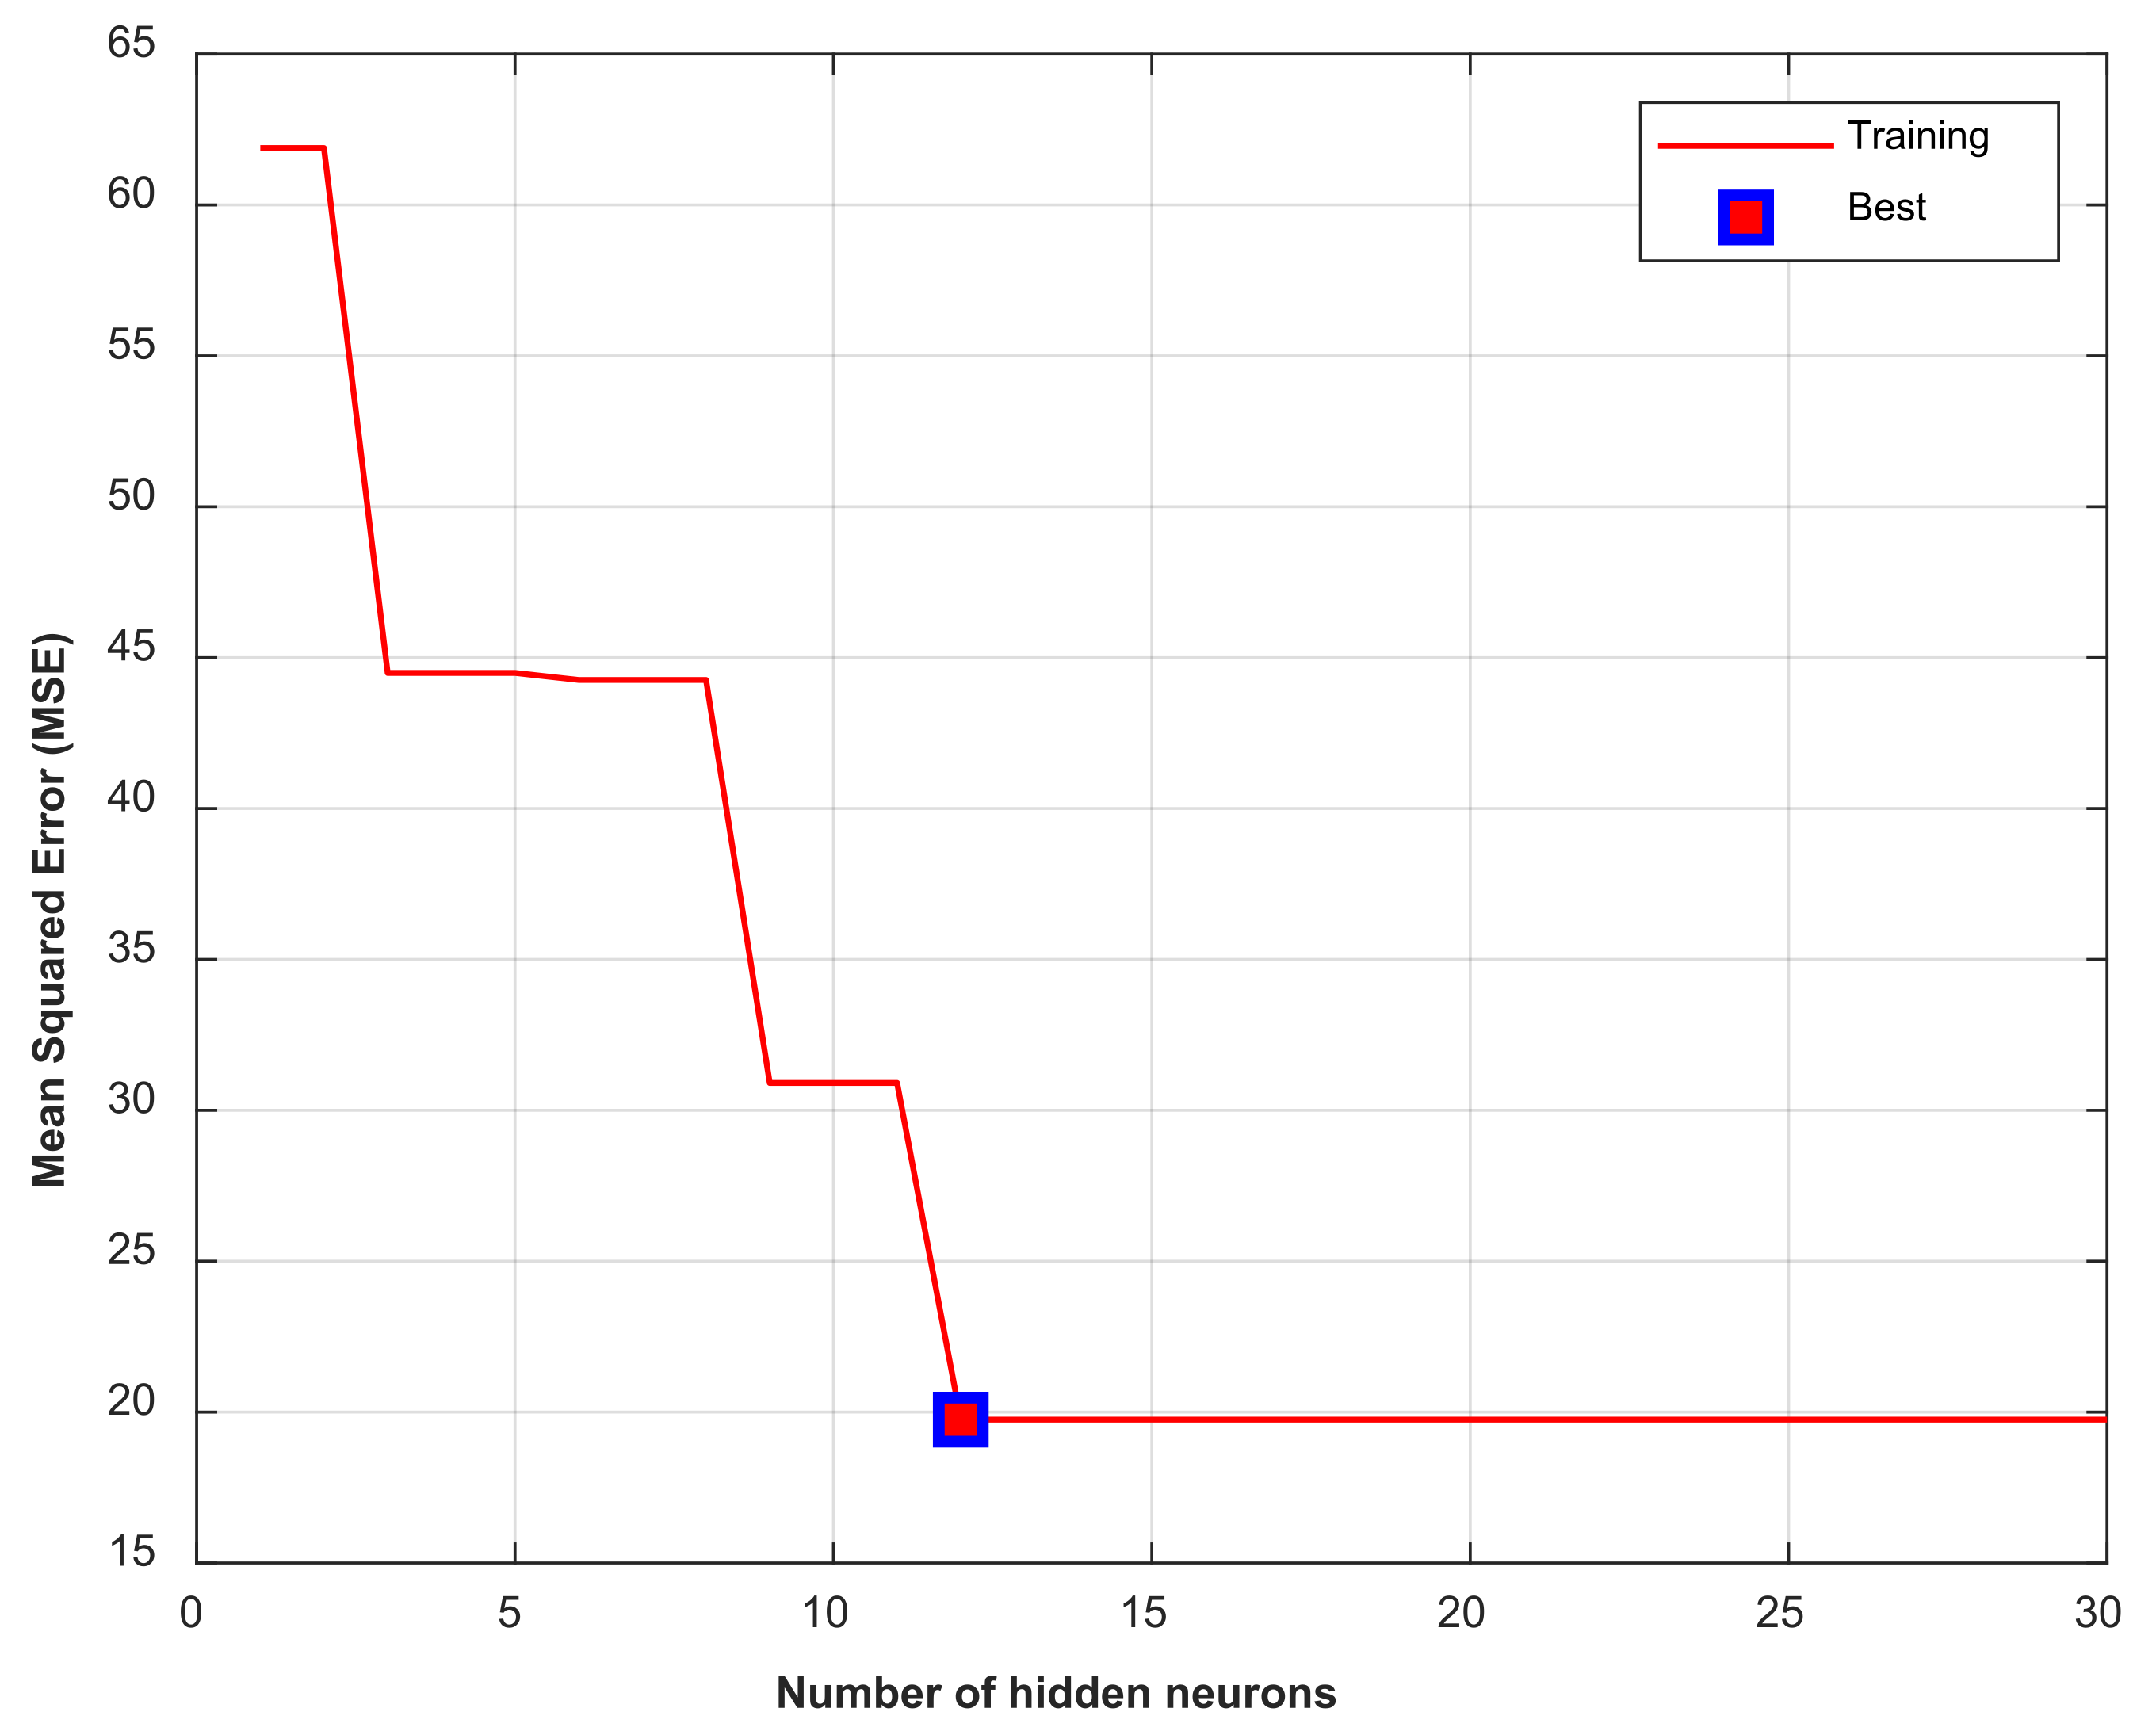
4.1. Optimal Network Selection and Performance Factors in ANN Models

The selection of the optimal network structure plays a crucial role in the performance of ANN models, along with the choice of learning algorithms, transfer functions, and the ratio and selection methodology of the training data. Evaluations and comments on this topic are provided below. In studies on ANN-based nitrate models, Pearson correlation values are generally used for selecting input data [34,36,42,45,53]. Some studies also consider basic statistical parameters alongside Pearson correlation values; however, analyses based on Pearson correlation values have shown better performance [34]. In this study, Pearson correlation values were considered in the selection of input data. Unlike other studies, the impact of input data on model performance was determined through analysis, and the results are presented in detail based on various error evaluation criteria. It was observed that parameters with low Pearson correlation coefficients had limited impact on the results, although these inputs improved scatter plots in models with low Pearson correlation coefficients.
There is no standard formula for determining the optimal number of neurons. However, in systems with limited data, selecting a large number of hidden neurons improves the training performance but decreases the test performance of the model [38,61,62,70]. To prevent overfitting, computationally intensive methods such as grid search, random search, or cross-validation are typically used. Trial-and-error methods are commonly employed in studies related to nitrate modeling [42,44,54]. Regarding learning algorithms and transfer functions, information is generally insufficient. As error evaluation criteria, different metrics such as MSE, MAE, and R2 are used individually or in combination.
In this study, instead of using the computationally intensive trial-and-error method for optimal network selection, 80% of the data was used for training and 20% for testing. This process was repeated for 100 randomly selected training and test datasets, and the Mean Squared Error (MSE) was calculated. This procedure was performed in a loop up to a maximum of 30 neurons. The number of neurons that provided the minimum MSE was selected as the optimal number, and analyses were conducted accordingly [61,62,70].
To determine the optimal network structure, commonly used learning algorithms and transfer functions in the literature were randomly varied, simultaneously identifying the most suitable learning algorithm and transfer functions for the data. As a result, the Levenberg–Marquardt algorithm was identified as the best learning algorithm, and the hyperbolic tangent sigmoid function for the hidden layer and the linear activation function for the output layer were determined as the best transfer functions. Thus, the optimal network architecture, learning algorithm, and transfer functions were identified in a single step. This procedure was applied for the first time in this study and is considered a significant contribution to ANN modeling.
The data used in this study were collected from a station that gathers all drainage waters of a real irrigation field over two water years (2022–2023) through daily measurements and laboratory analyses, resulting in 730 daily datasets. In the literature, the data used in nitrate models are often collected from different locations and times. Additionally, the data length is reported as 316 in [45], with [42] and [36] following at 112 and 67, respectively.
Therefore, although model performance based on error evaluation criteria is high, the variability in data length and the use of data from different locations and times are considered limiting factors for decision makers and practitioners. For sustainable agriculture and water management, continuous measurements and support for researchers are essential, as obtaining such data is particularly challenging in developing countries. Hence, this study, based on daily measurements from a single station using real data, is considered significant for decision makers and practitioners in terms of both methodology and practical application.

4.2. Data Ratios and Selection Methods in Training and Testing

Another important factor influencing the performance of ANN models is the ratio and selection method of data used during training and testing. Typically, 80% of the total data is used for training, and 20% is used for testing [38,61,62,70]. Most publications on nitrate modeling also use these ratios with random selection. In this study, the training data ratio was increased from 10% to 80%, and the performance was analyzed. Since no significant improvement was observed beyond 20%, Scenario 1 used 20% of the total data for training, and Scenario 2 used 50%. The remaining data were used for testing. Although using 20% of the total data for training yielded satisfactory results, 50% was selected in Scenario 2 to evaluate the prediction performance of one year based on training data from the other year in the two-year dataset.
Each scenario includes two cases: Case 1 involved random selection of data, while Case 2 involved sequential selection in the form of a time series. In both scenarios, model performance was evaluated as very good based on NSE values [43], with random selection showing slightly better performance. When data are selected sequentially, care must be taken to include extreme values in the training data. Detailed analyses on this matter are provided below.
When evaluating the results of the ANN-Nitrate model presented in the previous section, it is evident that the results obtained for Scenario I were better than those for Scenario II. This is thought to be due to the fact that in Scenario I, the data used for the training and testing phases were randomly selected from the entire series, while in Scenario II, the data were selected as a consecutive time series. As can be clearly seen from Figure 6 and Figure 8, although the nitrate values measured for the 2022 water year showed a similar trend to those for 2023, they were relatively smaller. Therefore, since all the data used in the training phase for Scenario II pertained to 2022, the test performance was slightly lower compared to Scenario I. This situation is particularly more evident in Case II. This is because all the data used in the training phase of Case II belonged to 2022, while the model results calculated in the testing phase belonged entirely to the 2023 water year. To verify this argument, in this section, data from 2023 instead of 2022were used in the model training phase, and values for 2022 were calculated as test data. In other words, the training and testing data used in Scenario II were swapped, and the analysis was repeated. The results are summarized in Figure 10 and Figure 11. As can be clearly seen from Figure 10, although the peak values for 2022 were very well predicted, deviations in minimum values showed a significant increase. On the other hand, as shown in Figure 11, the R2 values increased to 0.7956 and 0.7979 for cases I and II, respectively. In other words, there was a noticeable improvement in the model’s performance.
From the points raised in the previous section and the discussions in this section, it is clear that the overall performance of Scenario I was better than that of Scenario II. However, considering that the purposes of the two scenarios were different and that the results of Scenario II were also quite satisfactory in practical terms, it can be concluded that the proposed model can be reliably used for both scenarios.
The analyses conducted in Section 2 utilized R2 and MSE as objective functions to determine the optimal network architecture for the proposed model and to observe the impact of input parameters on model performance. However, the model performance was recalculated based on all error evaluation metrics using the obtained results, and it is presented comparatively in Table 2. As clearly shown in Table 2, the model’s performance was highly stable and practically satisfactory across all scenarios and conditions based on all evaluation metrics. To support this argument, all calculations were repeated for both scenarios using MSE and MAE as objective functions. The model performances based on all evaluation metrics are summarized in Table 3 using the obtained results. As can be clearly seen from Table 3, when R2 values were calculated based on the results obtained using MAE and MSE as objective functions, there was a very strong agreement with the R2 values provided between Figure 6 and Figure 11. This demonstrates that the performance of the proposed model and network architecture did not vary depending on the error evaluation metric used.

5. Conclusions

This study aimed to develop an ANN-based model to determine nitrate concentrations in drainage waters within an irrigation area located in the Lower Seyhan Basin, one of Turkey’s significant agricultural production regions. For this purpose, water samples were taken daily during the 2022 and 2023 water years at a station where drainage waters from the entire irrigation area are collected, and nitrate concentrations were determined in the laboratory. Along with nitrate concentrations, other parameters such as discharge, electrical conductivity, pH, and precipitation were also measured simultaneously at the same station. The complex relationship between the measured nitrate values and other parameters, which are easier and cheaper to measure, was used in two different scenarios during the learning phase of the ANN-Nitrate model. The model, once trained, predicted nitrate values using the other parameters. In Scenario I, random values were predicted, while in Scenario II, predictions were made as a time series, and the model results were compared with measured values.
For Scenario I case 1, the model performances (R2) for training, testing, and the entire dataset were 0.8805, 0.7732, and 0.7935, respectively, while for case 2, they were 0.7637, 0.8048, and 0.7831, respectively. As observed, despite the data proportions used in training the model varying from 0.20 to 0.50 of the total data in both cases, there was no significant change in model performance for the full dataset. This outcome is considered a result of the careful selection of both the parameters used in training the ANN-Nitrate model and the model’s network architecture. Furthermore, training the model with fewer data and achieving a high test performance highlights another significant aspect of this study.
Similarly, in Scenario II case 1, the model performances (R2) for training, testing, and the entire dataset were 0.8722, 0.7498, and 0.7789, respectively, while for case 2, they were 0.8422, 0.7155, and 0.7598, respectively. The overall performance of Scenario I appeared to be better than Scenario II. However, considering that each scenario served a different purpose and that Scenario II also provided practically satisfactory results, it can be said that the proposed model can be reliably used for both scenarios.
The proposed model, based on artificial neural networks (ANNs), is designed to predict nitrate concentrations in drainage waters within the Lower Seyhan Basin, one of Turkey’s key agricultural regions, using parameters that are simpler and more cost-effective to measure. However, it also has the potential to be applied to other methods commonly used in machine learning and artificial intelligence, such as Support Vector Machines (SVM), Decision Trees, Random Forests, Ensemble Methods, and Deep Learning Techniques. Furthermore, the model can be used without requiring any modifications for other basins where the input values are measured. Future studies are planned to apply the model to other basins to enhance its generalizability and to compare the test performances of the aforementioned methods in a systematic manner.
In conclusion, the ability to accurately predict nitrate—a significant parameter in terms of irrigation and general water quality—using an ANN-based model with parameters that are easier and cheaper to measure, such as EC, pH, Q, and P, is considered an important contribution of this study to the literature. This model aids both in filling in missing data and in making future predictions.

Author Contributions

Conceptualization, H.K. and M.E.C.; methodology, H.K and M.E.C.; software, H.K.; validation, H.K.; formal analysis, M.E.C.; investigation, H.K. and M.E.C.; resources.; data curation, H.K. and M.E.C.; writing—original draft, H.K. and M.E.C.; writing—review and editing, H.K. and M.E.C.; supervision, H.K.; project administration, H.K. All authors have read and agreed to the published version of the manuscript.

Funding

This research was funded by Scientific and Technological Research Council of Turkiye (TUBITAK), Project number: 122Y007. The authors thank the TUBITAK for obtaining financial support for this work.

Institutional Review Board Statement

Not applicable.

Data Availability Statement

Data are available upon request from the authors.

Conflicts of Interest

The authors declare no conflicts of interest.

Appendix A. Definitions of Error Indicators

Mean   Squared   Error   (MSE) M S E = 1 N i = 1 N ( N i t O b s N i t C o m p ) 2
Root   Mean   Squared   Error   (RMSE) R M S E = 1 N i = 1 N ( N i t O b s N i t C o m p ) 2
Mean   absolute   error   (MAE) M A E = 1 N i = 1 N N i t O b s N i t C o m p
Mean   absolute   percentage   error   (MAPE) M A P E = 1 N i = 1 N N i t O b s N i t C o m p N i t O b s  
R-Squared   ( R 2 ) R 2 = 1 i = 1 N ( N i t O b s N i t C o m p ) 2 i = 1 N ( N i t O b s N i t O b s ¯ ) 2
Nash–Sutcliffe   model   efficiency   coefficient   (NSE) N S E = 1 1 N i = 1 N N i t O b s N i t C o m p 1 N i = 1 N N i t O b s N i t O b s ¯  

References

  1. McNeely, R.N.; Neimanis, V.P.; Dwyer, L. Water Quality Sourcebook: A Guide to Water Quality Parameters; Inland Waters Directorate, Water Quality Branch: Ottawa, Canada, 1979; pp. 1–89. [Google Scholar]
  2. Hem, J.D. Study and Interpretation of the Chemical Characteristics of Natural Water; Department of the Interior, US Geological Survey: Alexandria, VA, USA, 1985; Volume 2254. [Google Scholar]
  3. Benzer, S.; Benzer, R. Modelling nitrate prediction of groundwater and surface water using artificial neural networks. J. Polytech. 2018, 21, 321–325. [Google Scholar] [CrossRef]
  4. Sharma, V.; Negi, S.C.; Rudra, R.P.; Yang, S. Neural networks for predicting nitrate-nitrogen in drainage water. Agric. Water Manag. 2003, 63, 169–183. [Google Scholar] [CrossRef]
  5. Horsburgh, J.S.; Hooper, R.P.; Bales, J.; Hedstrom, M.; Imker, H.J.; Lehnert, K.A.; Shanley, L.A.; Stall, S. Assessing the state of research data publication in hydrology: A perspective from the Consortium of Universities for the Advancement of Hydrologic Science, Incorporated. Wiley Interdiscip. Rev. Water 2020, 7, e1422. [Google Scholar] [CrossRef]
  6. McDonough, L.K.; Santos, I.R.; Andersen, M.S.; O’Carroll, D.M.; Rutlidge, H.; Meredith, K.; Oudone, P.; Bridgeman, J.; Goddy, D.C.; Sorensen, J.P.; et al. Changes in global groundwater organic carbon driven by climate change and urbanization. Nat. Commun. 2020, 11, 1279. [Google Scholar] [CrossRef]
  7. Misstear, B.; Vargas, C.R.; Lapworth, D.; Ouedraogo, I.; Podgorski, J. A global perspective on assessing groundwater quality. Hydrogeol. J. 2023, 31, 11–14. [Google Scholar] [CrossRef]
  8. Basu, N.B.; Van Meter, K.J.; Byrnes, D.K.; Van Cappellen, P.; Brouwer, R.; Jacobsen, B.H.; Jarsjö, J.; Rudolph, D.L.; Cunha, M.C.; Nelson, N.; et al. Managing nitrogen legacies to accelerate water quality improvement. Nat. Geosci. 2022, 15, 97–105. [Google Scholar] [CrossRef]
  9. Foster, S.S.D.; Chilton, P.J. Groundwater: The processes and global significance of aquifer degradation. Philosophical Transactions of the Royal Society of London. Ser. B Biol. Sci. 2003, 358, 1957–1972. [Google Scholar] [CrossRef]
  10. Jasechko, S.; Perrone, D. Global groundwater wells at risk of running dry. Science 2021, 372, 418–421. [Google Scholar] [CrossRef]
  11. Torres-Martínez, J.A.; Mahlknecht, J.; Kumar, M.; Loge, F.J.; Kaown, D. Advancing groundwater quality predictions: Machine learning challenges and solutions. Sci. Total Environ. 2024, 949, 174973. [Google Scholar] [CrossRef]
  12. Palani, S.; Liong, S.Y.; Tkalich, P. An ANN application for water quality forecasting. Mar. Pollut. Bull. 2008, 56, 1586–1597. [Google Scholar] [CrossRef]
  13. Zare, A.; Bayat, V.; Daneshkare, A. Forecasting nitrate concentration in groundwater using artificial neural network and linear regression models. Int. Agrophysics 2011, 25, 2–187. [Google Scholar]
  14. Mahlknecht, J.; Torres-Martínez, J.A.; Kumar, M.; Mora, A.; Kaown, D.; Loge, F.J. Nitrate prediction in groundwater of data scarce regions: The futuristic fresh-water management outlook. Sci. Total Environ. 2023, 905, 166863. [Google Scholar] [CrossRef] [PubMed]
  15. Podgorski, J.; Berg, M. Global analysis and prediction of fluoride in groundwater. Nat. Commun. 2022, 13, 4232. [Google Scholar] [CrossRef] [PubMed]
  16. Podgorski, J.; Berg, M. Global threat of arsenic in groundwater. Science 2020, 368, 845–850. [Google Scholar] [CrossRef] [PubMed]
  17. Sarkar, S.; Mukherjee, A.; Chakraborty, M.; Quamar, M.T.; Duttagupta, S.; Bhattacharya, A. Prediction of elevated groundwater fluoride across India using multi-model approach: Insights on the influence of geologic and environmental factors. Environ. Sci. Pollut. Res. 2023, 30, 31998–32013. [Google Scholar] [CrossRef]
  18. Alengebawy, A.; Abdelkhalek, S.T.; Qureshi, S.R.; Wang, M.Q. Heavy metals and pesticides toxicity in agricultural soil and plants: Ecological risks and human health implications. Toxics 2021, 9, 42. [Google Scholar] [CrossRef]
  19. Hube, S.; Wu, B. Mitigation of emerging pollutants and pathogens in decentralized wastewater treatment processes: A review. Sci. Total Environ. 2021, 779, 146545. [Google Scholar] [CrossRef]
  20. Yaseen, Z.M.; Ebtehaj, I.; Bonakdari, H.; Deo, R.C.; Mehr, A.D.; Mohtar, W.H.M.W.; Diop, L.; El-shafie, A.; Singh, V.P. Novel approach for streamflow forecasting using a hybrid ANFIS-FFA model. J. Hydrol. 2017, 554, 263–276. [Google Scholar] [CrossRef]
  21. Sarangi, A.; Singh, M.; Bhattacharya, A.K.; Singh, A.K. Subsurface drainage performance study using SALTMOD and ANN models. Agric. Water Manag. 2006, 84, 240–248. [Google Scholar] [CrossRef]
  22. Karahan, H.; Ayvaz, M.T. Forecasting aquifer parameters using artificial neural networks. J. Porous Media 2006, 9, 429–444. [Google Scholar] [CrossRef]
  23. Logan, T.J.; Eckert, D.J.; Beak, D.G. Tillage, crop and climatic effects of runoff and tile drainage losses of nitrate and four herbicides. Soil Tillage Res. 1994, 30, 75–103. [Google Scholar] [CrossRef]
  24. Strik, D.P.; Domnanovich, A.M.; Zani, L.; Braun, R.; Holubar, P. Prediction of trace compounds in biogas from anaerobic digestion using the MATLAB Neural Network Toolbox. Environ. Modell. Softw. 2005, 20, 803–810. [Google Scholar] [CrossRef]
  25. Koekkoek, E.J.W.; Booltink, H. Neural network models to predict soil water retention. Eur. J. Soil Sci. 1999, 50, 489–495. [Google Scholar] [CrossRef]
  26. Co, H.C.; Boosarawongse, R. Forecasting Thailand’s rice export: Statistical techniques vs. artificial neural networks. Comput. Ind. Eng. 2007, 53, 610–627. [Google Scholar] [CrossRef]
  27. Erzin, Y.; Rao, B.H.; Singh, D.N. Artificial neural network models for predicting soil thermal resistivity. Int. J. Therm. Sci. 2008, 47, 1347–1358. [Google Scholar] [CrossRef]
  28. Baker, L.; Ellison, D. Optimisation of pedotransfer functions using an artificial neural network ensemble method. Geoderma 2008, 144, 212–224. [Google Scholar] [CrossRef]
  29. Liu, H.; Xie, D.; Wu, W. Soil water content forecasting by ANN and SVM hybrid architecture. Env. Monit. Assess. 2008, 143, 187–193. [Google Scholar] [CrossRef]
  30. Patil, S.L.; Tantau, H.J.; Salokhe, V.M. Modelling of tropical greenhouse temperature by auto regressive and neural network models. Biosyst. Eng. 2008, 99, 423–431. [Google Scholar] [CrossRef]
  31. Xu, L.; Yang, J.; Zhang, Q.; Niu, H. Modelling water and salt transport in a soil–water–plant system under different groundwater tables. Water Environ. J. 2008, 22, 265–273. [Google Scholar] [CrossRef]
  32. Zou, P.; Yang, J.; Fu, J.; Liu, G.; Li, D. Artificial neural network and time series models for predicting soil salt and water content. Agric. Water Manag. 2010, 97, 2009–2019. [Google Scholar] [CrossRef]
  33. Stamenković, L.J. Application of ANN and SVM for prediction nutrients in rivers. J. Environ. Sci. Health Part A 2021, 56, 867–873. [Google Scholar] [CrossRef]
  34. Stamenković, L.J.; Mrazovac Kurilić, S.; Presburger Ulniković, V. Prediction of nitrate concentration in Danube River water by ysing Artificial Neural Networks. Water Supply 2020, 20, 2119–2132. [Google Scholar] [CrossRef]
  35. Jung, K.; Bae, D.-H.; Um, M.-J.; Kim, S.; Jeon, S.; Park, D. Evaluation of nitrate load estimations using neural networks and canonical correlation analysis with K-Fold Cross-Validation. Sustainability 2020, 12, 400. [Google Scholar] [CrossRef]
  36. Band, S.S.; Janizadeh, S.; Pal, S.C.; Chowdhuri, I.; Siabi, Z.; Norouzi, A.; Melesse, A.M.; Shokri, M.; Mosavi, A. Comparative analysis of Artificial Intelligence models for accurate estimation of groundwater nitrate concentration. Sensors 2020, 20, 5763. [Google Scholar] [CrossRef]
  37. Hrnjica, B.; Mehr, A.D.; Jakupovic, E.; Crnkic, A.; Hasanagic, R. Application of deep learning neural networks for nitrate prediction in the Klokot River, Bosnia and Herzegovina. In Proceedings of the 2021 7th International Conference on Control, Instrumentation and Automation (ICCIA), Tabriz, Iran, 23–24 February 2021; IEEE: Tabriz, Iran, 2021; pp. 1–6. [Google Scholar]
  38. Maier, H.R.; Dandy, G.C. Neural networks for the prediction and forecasting of water resources variables: A review of modelling issues and applications. Environ. Model. Softw. 2000, 15, 101–124. [Google Scholar] [CrossRef]
  39. Al-Mahallawi, K.; Mania, J.; Hani, A.; Shahrour, I. Using of neural networks for the prediction of nitrate groundwater contamination in rural and agricultural areas. Environ. Earth Sci. 2012, 65, 917–928. [Google Scholar] [CrossRef]
  40. Yesilnacar, M.I.; Sahinkaya, E.; Naz, M.; Ozkaya, B. Neural network prediction of nitrate in groundwater of Harran Plain, Turkiye. Environ. Geol. 2008, 56, 19–25. [Google Scholar] [CrossRef]
  41. Elzain, H.E.; Chung, S.Y.; Senapathi, V.; Sekar, S.; Lee, S.Y.; Roy, P.D.; Hassan, A.; Sabarathinam, C. Comparative study of machine learning models for evaluating groundwater vulnerability to nitrate contamination. Ecotoxicol. Environ. Saf. 2022, 229, 113061. [Google Scholar] [CrossRef]
  42. Stylianoudaki, C.; Trichakis, I.; Karatzas, G.P. Modeling groundwater nitrate contamination using artificial neural networks. Water 2022, 14, 1173. [Google Scholar] [CrossRef]
  43. Moriasi, D.N.; Arnold, J.G.; Van Liew, M.W.; Bingner, R.L.; Harmel, R.D.; Veith, T.L. Model Evaluation Guidelines for Systematic Quantification of Accuracy in Watershed Simulations. Trans. ASABE 2007, 50, 885–900. [Google Scholar] [CrossRef]
  44. El Amri, A.; M’nassri, S.; Nasri, N.; Nsir, H.; Majdoub, R. Nitrate concentration analysis and prediction in a shallow aquifer in central-eastern Tunisia using artificial neural network and time series modelling. Environ. Sci. Pollut. Res. 2022, 29, 43300–43318. [Google Scholar] [CrossRef]
  45. Deng, Y.; Ye, X.; Du, X. Predictive modeling and analysis of key drivers of groundwater nitrate pollution based on machine learning. J. Hydrol. 2023, 624, 129934. [Google Scholar] [CrossRef]
  46. Sarangi, A.; Bhattacharya, A.K. Comparison of artificial neural network and regression models for sediment loss prediction from Banha watershed in India. Agric. Water Manag. 2005, 78, 195–208. [Google Scholar] [CrossRef]
  47. Kim, M.Y.; Seo, M.C.; Kim, M.K. Linking hydro-meteorological factors to the assessment of nutrient loadings to streams from large-plotted paddy rice fields. Agric. Water Manag. 2007, 87, 223–228. [Google Scholar] [CrossRef]
  48. Landeras, G.; Ortiz-Barredo, A.; López, J.J. Comparison of artificial neural network models and empirical and semi-empirical equations for daily reference evapotranspiration estimation in the Basque Country (Northern Spain). Agric. Water Manag. 2008, 95, 553–565. [Google Scholar] [CrossRef]
  49. Chinh, L.V.; Hiramatsu, K.; Harada, M.; Mori, M. Estimation of water levels in a main drainage canal in a flat low-lying agricultural area using artificial neural network models. Agric. Water Manag. 2009, 96, 1332–1338. [Google Scholar] [CrossRef]
  50. Chau, K.W. A review on integration of artificial intelligence into water quality modelling. Mar. Poll. Bull. 2006, 52, 726–733. [Google Scholar] [CrossRef]
  51. Hatzikos, E.; Anastasakis, L.; Bassiliades, N.; Vlahavas, I. Applying neural networks with active neurons to sea-water quality measurements. In Proceedings of the Second International Scientific Conference on Computer Science, Varna, Bulgaria, 11–13 May 2005; IEEE Computer Society: Washington, DC, USA, 2005; pp. 114–119. [Google Scholar]
  52. Wagh, V.; Panaskar, D.; Muley, A.; Mukate, S.; Gaikwad, S. Neural network modelling for nitrate concentration in groundwater of Kadava River basin, Nashik, Maharashtra, India. Groundw. Sustain. Develop. 2018, 7, 436–445. [Google Scholar] [CrossRef]
  53. Latif, S.D.; Azmi, M.S.B.N.; Ahmed, A.N.; Fai, C.M.; El-Shafie, A. Application of artificial neural network for forecasting nitrate concentration as a water quality parameter: A case study of Feitsui Reservoir, Taiwan. Int. J. Des. Nat. Ecodynamics 2020, 15, 647–652. [Google Scholar] [CrossRef]
  54. Meng, G.; Fang, L.; Yin, Y.; Zhang, Z.; Li, T.; Chen, P.; Liu, Y.; Zhang, L. Intelligent control of the electrochemical nitrate removal basing on artificial neural network (ANN). J. Water Process Eng. 2022, 49, 103122. [Google Scholar] [CrossRef]
  55. Alsenjar, O.; Çetin, M.; Aksu, H.; Akgül, M.A.; Golpinar, M.S. Cropping pattern classification using artificial neural networks and evapotranspiration estimation in the Eastern Mediterranean region of Turkey. J. Agric. Sci. 2023, 29, 677–689. [Google Scholar] [CrossRef]
  56. Alsenjar, O.; Cetin, M.; Aksu, H.; Golpinar, M.S.; Akgul, M.A. Actual evapotranspiration estimation using METRIC model and Landsat satellite images over an irrigated field in the Eastern Mediterranean Region of Turkey. Med. Geosc. Rev. 2023, 5, 35–49. [Google Scholar] [CrossRef]
  57. Cetin, M.; Kaman, H.; Kirda, C.; Sesveren, S. Analysis of irrigation performance in water resources planning and management: A case study. Fresenius Environ. Bull. 2020, 29, 3409–3414. [Google Scholar]
  58. Dinç, U.; Şenol, S.; Sayın, M.; Kapur, S.; Güzel, N.; Derici, R.; Yeşilsoy, M.Ş.; Yeğingil, D.; Sari, M.; Kaya, Z.; et al. The soils of Southeastern Anatolia Region (GAT) 1. Harran Plain. In TUBİTAK Agriculture and Forestry Group Guided Research Project Final Result Report; Project Number: TOAG-534; TÜBİTAK: Ankara, Türkiye, 1988. (In Turkish) [Google Scholar]
  59. Karnez, E.; Sagir, H.; Gavan, M.; Golpinar, M.S.; Cetin, M.; Akgul, M.A.; İbrikci, H.; Pintar, M. Modeling Agricultural Land Management to Improve Understanding of Nitrogen Leaching in an Irrigated Mediterranean Area in Southern Turkey; IntechOpen: London, UK, 2017; ISBN 978-953-51-2882-3. [Google Scholar]
  60. Rice, E.W.; Bridgewater, L. Standard Methods for the Examination of Water and Wastewater; American Public Health Association: Washington, DC, USA, 2012; Volume 10. [Google Scholar]
  61. Karahan, H.; Iplikci, S.; Yasar, M.; Gurarslan, G. River flow estimation from upstream flow records using support vector machines. J. Appl. Math. 2014, 2014, 714213. [Google Scholar] [CrossRef]
  62. Karahan, H.; Ayvaz, M.T. Simultaneous parameter identification of a heterogeneous aquifer system using artificial neural networks. Hydrogeol. J. 2008, 16, 817–827. [Google Scholar] [CrossRef]
  63. Bilski, J.; Kowalczyk, B.; Marchlewska, A.; Zurada, J.M. Local Levenberg-Marquardt algorithm for learning feedforwad neural networks. J. Artif. Intell. Soft Comput. Res. 2020, 10, 299–316. [Google Scholar] [CrossRef]
  64. Yan, Z.; Zhong, S.; Lin, L.; Cui, Z. Adaptive Levenberg–Marquardt algorithm: A new optimization strategy for Levenberg–Marquardt neural networks. Mathematics 2021, 9, 2176. [Google Scholar] [CrossRef]
  65. Haring, M.; Grøtli, E.I.; Riemer-Sørensen, S.; Seel, K.; Hanssen, K.G. A Levenberg-Marquardt algorithm for sparse identification of dynamical systems. IEEE Trans. Neural Netw. Learn. Syst. 2022, 34, 9323–9336. [Google Scholar] [CrossRef]
  66. Souayeh, B.; Sabir, Z. Designing hyperbolic tangent sigmoid function for solving the Williamson nanofluid model. Fractal Fract. 2023, 7, 350. [Google Scholar] [CrossRef]
  67. Pérez–Enríquez, L.; Zapotecas–Martínez, S.; Oliva, D.; Altamirano-Robles, L. Hyperbolic tangent sigmoid as a transformation function for image contrast enhancement. In Proceedings of the 2023 IEEE Symposium Series on Computational Intelligence (SSCI), Mexico City, Mexico, 5–8 December 2023; IEEE: Piscataway, NJ, USA, 2023; pp. 282–287. [Google Scholar]
  68. Rasamoelina, A.D.; Adjailia, F.; Sinčák, P. A review of activation function for artificial neural network. In Proceedings of the 2020 IEEE 18th World Symposium on Applied Machine Intelligence and Informatics (SAMI), Herlany, Slovakia, 23–25 January 2020; IEEE: Piscataway, NJ, USA, 2020; pp. 281–286. [Google Scholar]
  69. Parhi, R.; Nowak, R.D. The role of neural network activation functions. IEEE Signal Process. Lett. 2020, 27, 1779–1783. [Google Scholar] [CrossRef]
  70. Karahan, H.; Cetin, M.; Can, M.E.; Alsenjar, O. Developing a New ANN Model to Estimate Daily Actual Evapotranspiration Using Limited Climatic Data and Remote Sensing Techniques for Sustainable Water Management. Sustainability 2024, 16, 2481. [Google Scholar] [CrossRef]
Figure 1. Location of the study area in Turkiye, irrigation and drainage water flow directions, and the water sampling station (Drainage gauging station).
Agriculture 15 00161 g001
Figure 2. The correlation relationship between NO3 and model parameters.
Agriculture 15 00161 g002
Figure 3. The temporal variation in nitrate concentrations and model inputs.
Agriculture 15 00161 g003
Figure 4. A three-layer feed-forward ANN.
Agriculture 15 00161 g004
Figure 5. The typical structure of multi-layer ANNs used in this study.
Agriculture 15 00161 g005
Figure 6. Model results for Scenario I.
Agriculture 15 00161 g006aAgriculture 15 00161 g006b
Figure 7. Model results for Scenario I.
Agriculture 15 00161 g007aAgriculture 15 00161 g007b
Figure 8. Model results for Scenario II.
Agriculture 15 00161 g008
Figure 9. Model performance for Scenario II.
Agriculture 15 00161 g009
Figure 10. Model results for Scenario II.
Agriculture 15 00161 g010
Figure 11. Model performance for Scenario II.
Agriculture 15 00161 g011
Table 1. Statistical summary of nitrate values and model parameters.
NO3 (mg/L)EC (ds/m)pHQ (m3/s)P (mm)
Min5.530.006.470.590.00
Max99.572.758.8813.3477.20
Aveg31.031.058.263.191.94
Std. Dev.21.320.740.281.967.49
Table 2. Variation in model performance based on input parameters.
InputsScenarioCase MSERMSEMAEMAPECorr.R2NSE
EC, Q I 1 109.567710.46756.503327.04350.87170.75980.7586
2 106.985910.34346.680824.13930.87430.76440.7643
II 1 113.917310.67326.691224.04510.86550.74910.7490
2 117.462910.83806.649824.95300.86210.74330.7412
DOWY, EC, Q I 1 97.21949.86006.437623.00490.88680.78640.7858
2 100.693910.03466.641223.07140.88210.77820.7782
II 1 109.434510.46117.108326.88380.87120.75910.7589
2 108.361710.40976.718123.13750.87530.76610.7613
DOWY, EC, pH, Q, P I 1 96.80209.83886.356925.86530.88720.78710.7867
2 99.48919.97446.688923.48080.88370.78100.7808
II 1 92.22499.60346.513124.29210.89280.79720.7968
2 94.40689.71636.543822.09060.89170.79510.7920
Table 3. Variation in model performance based on objective function.
Obj. FuncScenarioCase MSERMSEMAEMAPECorr. R2
MSE I 1 107.845110.38497.125923.70320.87360.7632
2 108.220610.40296.565222.23810.87340.7627
II 1 98.46159.92286.789723.20570.88540.7840
2 96.22549.80956.614923.33780.88770.7881
MAE I 1 100.991310.04947.077724.66140.88180.7776
2 102.725110.13536.675223.94520.88000.7744
II 1 94.21359.70646.536323.33900.89030.7927
2 92.11559.59776.419123.07280.89290.7973
Disclaimer/Publisher’s Note: The statements, opinions and data contained in all publications are solely those of the individual author(s) and contributor(s) and not of MDPI and/or the editor(s). MDPI and/or the editor(s) disclaim responsibility for any injury to people or property resulting from any ideas, methods, instructions or products referred to in the content.

