Article

High Proportion of Blue Light Contributes to Product Quality and Resistance to Phytophthora Infestans in Tomato Seedlings

1
College of Horticulture, Sichuan Agricultural University, Chengdu 611130, China
2
Crop Research Institute, Xinjiang Academy of Agricultural Sciences, Urumqi 830091, China
3
Shannan Agricultural Technology Extension Center, Shannan 856000, China
4
School of Agricultural Engineering, Jiangsu University, Zhenjiang 212013, China
5
Institute of Urban Agriculture, Chinese Academy of Agricultural Sciences, Chengdu 610213, China
*
Authors to whom correspondence should be addressed.
These authors contributed equally to this work.
Agriculture 2025, 15(19), 2082; https://doi.org/10.3390/agriculture15192082
Submission received: 29 August 2025 / Revised: 2 October 2025 / Accepted: 4 October 2025 / Published: 6 October 2025

Abstract

Plant seedlings are sensitive to cultivation environment factors and highly susceptible to pathogenic infections under adverse conditions such as inappropriate light environment. In this study, five kinds of LED lighting sources with different red (R) and blue (B) light combinations were set up: R10B0, R7B3, R5B5, R2B8 and R0B10 (with R:B ratios of 10:0, 7:3, 5:5, 2:8 and 0:10, respectively) to explore their effects on tomato seedlings’ growth, AsA-GSH cycle, endogenous hormones, and resistance to Phytophthora infestans, providing a basis for factory seedling light-quality selection. The results showed that with the increase in the proportion of blue light in the composite light, the growth indicators, photosynthetic characteristic parameters and enzyme activities of tomato seedlings generally increased. The contents of AsA, reduced glutathione, and oxidized glutathione all reached the maximum under high-proportion blue-light treatments (R2B8 and R0B10). The high-blue-light groups (R2B8 and R0B10) had the highest AsA and glutathione contents. The red–blue combinations reduced inhibitory ABA and increased growth-promoting hormones (e.g., melatonin), while monochromatic light increased ABA to inhibit growth. After inoculation with P. infestans, the apoplastic glucose content was the highest under the red–blue-combined treatments (R5B5 and R2B8), while the total glucose content in leaves was the highest under the combined light R2B8 treatment. In conclusion, high-proportion blue-light treatment can greatly promote the photosynthetic process of tomato, enhance the AsA-GSH cycle, and achieve the best effect in improving the resistance of tomatoes to P. infestans. Given these, the optimal light environment setting was R:B = 2:8.

1. Introduction

Tomato (Solanum lycopersicum) is widely favored by the public for its delicious taste and rich nutrition. In terms of tomato annual planting area and yield, China ranks first in the world nowadays [1], and there is a huge market demand for high-quality tomato seedlings. Raising seedlings on an industrial scale is an important approach to achieving efficient commercial tomato production. Tomato seedling cultivation is affected by factors such as temperature, humidity, light intensity, light quality and their interactions. Among them, light is a key factor affecting the morphology, physiology, metabolic characteristics and reproductive differentiation of Solanaceae plants. It not only drives the production of plant biomass through photosynthesis, but also plays a crucial role in the host’s defense against pathogenic bacteria [2,3,4,5].
In recent years, with the development of photobiology, artificial lighting has become an important cultivation strategy in protected horticultural plant production [6,7,8,9]. As a new generation of lighting sources, light-emitting diodes (LEDs) display the advantages of low energy consumption, pure light quality, high controllability and adjustability [10]. Moreover, the LED radiation spectrum and the red–blue light-quality ratio can be adjusted according to the needs of different plants to improve the utilization efficiency of the light source [11]. Studies have shown that when the greenhouse tomato is irradiated with supplemental LED lighting with a red light–blue light ratio of 7:3, the leaf width, number of roots, root length, soil plant analysis development (SPAD) value and root activity of tomatoes improve significantly [6]. In plant factory production, when the red light–blue light ratio is 81:15, the content of soluble sugar in water dropwort is higher, the contents of nitrate and crude fiber are lower, and the comprehensive nutritional quality is the best [12]. The use of a multi-color LED light environment not only promotes the rooting and leaf expansion of Photinia × fraseri but also improves its passivation response to stresses such as high salt and heavy metals to a certain extent [13]. Some studies have shown that the special phenotypes of plants under specific light wavelengths may be related to their endogenous hormone levels and gene mutations. However, there are few studies on the effects of different light sources on changes in plant endogenous hormone levels and gene levels.
On the other hand, in actual production, light stress caused by various factors such as geographical conditions and performance of facilities and equipment often reduces plants’ resistance to diseases [2,3], thereby affecting crop yield and product quality. The practice of protected tomato cultivation shows that late blight, caused by Phytophthora infestans, is a fungal disease that breaks out in a wide area, causes serious damage and is difficult to prevent and control in tomato production [14]. Generally, in higher plants, enzymatic and non-enzymatic systems are important systems that can maintain protein stability, membrane structure integrity and membrane lipid peroxidation [15,16]. Changes in the light environment usually first affect the changes in light-harvesting proteins, induce their phosphorylation, and then trigger a series of changes in the organism, such as photosynthetic reactions and antioxidant reactions. Among them, the AsA-GSH cycle is an important cycle system for scavenging free radicals, which is mainly composed of ascorbic acid (AsA), glutathione, including reduced glutathione (GSH) and oxidized glutathione (GSSG), and related metabolic enzymes, e.g., ascorbate peroxidase (APX), monodehydroascorbate reductase (MDHAR), dehydroascorbate reductase (DHAR) and glutathione reductase (GR) [17]. A large number of studies have shown that the functional operation of the AsA-GSH cycle can reduce the level of reactive oxygen species in plants, maintain the balance of reactive oxygen species and alleviate cellular oxidative stress [18,19,20]. At the same time, higher plants use photosynthesis to convert CO2 in leaves into organic carbon, which is finally converted into hexoses, including glucose [21,22]. As an energy and signal molecule, glucose is involved in regulating plant growth and development and host resistance [21,23,24,25] and can be used as a signal encoding information to reversely regulate photosynthetic efficiency [22]. There is evidence that glucose can intervene in the passivation response of tomatoes to Pseudomonas syringae (Pst DC3000) under low-light conditions [26]. However, whether it is involved in other pathogenic infection processes is still unclear.
Light is one of the important environmental factors of protected horticultural cultivation, and light quality profoundly affects the morphogenesis of tissue culture seedlings [27]. At present, there have been relevant reports on the effects of LED light quality on the development and metabolism of vegetables, but most of them focus on agronomic traits, and there are few reports on the mechanism of light-quality regulating tomato morphogenesis and pathogenic resistance response. This study analyzed the effects of different ratios of LED light quality on tomato growth, photosynthetic physiology, endogenous hormone content and AsA-GSH cycle, investigated the changes in apoplastic glucose in tomatoes and its relationship with the occurrence of late blight and explored the response mechanism of tomatoes to light quality, aiming to provide a theoretical basis for the selection of light quality in subsequent tomato tissue culture and high-quality factory seedling cultivation.

2. Materials and Methods

2.1. Materials and Site

The experiment was conducted in the plant factory of the College of Horticulture, Sichuan Agricultural University, from March to October 2024. The tomato variety NS3389 from Guangzhou Nanshu Agricultural Technology Co., Ltd. (Guangzhou, China) was used as the test materials and cultivated with commercial substrate (Peilei No. 2, Peilei Organic Fertilizer Co., Ltd., Zhenjiang, China). LED lamps (Chenhua Lighting Co., Ltd., Guangzhou, China) were customized according to the experimental requirements, and encapsulated into in a size of 1200 mm (length) × 24 mm (width) × 24 mm (thickness).

2.2. Experiment Design

Tomato seeds were sown in seedling trays (50 holes, 540 mm × 280 mm) in a dark germination room with a temperature of 30 °C and a relative humility of 90% for 3 days. Then, the plants were transported into a plant cultivation room for lighting treatment, with a light cycle of 16 h/8 h (day/night), temperature of 23 °C/18 °C (day/night) and relative humility of 70 ± 3% [6,7]. Based on previous preliminary experiments results and relative literature analysis, a total of 5 LED red (R)–blue (B) light-quality ratio treatments were set up: R10B0, R7B3, R5B5, R2B8 and R0B10, respectively. The measured photosynthetic photon flux density (PPFD) was 200 μmol·m−2·s−1 at 30 cm from the LED module (Figure 1). Each treatment contained 5 LED lamps irradiating 2 seedling trays, ensuring that at least 80 seedlings could be used as valid samples. The height between the layers of the cultivation shelf was 35 cm, and the light intensity measured at 30 cm from the lamp tube was 400 ± 20 μmol⸱m−2·s−1. After 35 days of lighting treatment, the plants grew to a stage with approximately 3–4 true leaves. Seedlings with uniform growth in each treatment were prepared for further index investigation.

2.3. Plant Morphology Analyses

A total of 20 plants per treatment were randomly selected and destructively harvested for determination of the following: fresh and dry weights of aboveground parts, the height of seedlings, health index (calculated as stem diameter/stem height × total dry weight [28]), leaf areas (LI-3000C; Li-Cor Inc. Lincoln, NE, USA) and leaf chlorophyll contents (SPAD, SPAD-502; Minolta, Osaka, Japan), according to [6].

2.4. Photosynthesis Parameter Measurements

The third fully expanded leaf of 10 randomly selected seedlings per treatment was analyzed using a portable photosynthesis system (Li-6400XT, Li-Cor Inc., Lincoln, NE, USA). The net photosynthetic rate (PN), stomatal conductance (GS), transpiration rate (Tr) and intercellular CO2 concentration (Ci) were measured according to [7].

2.5. Measurements of AsA-GSH Cycle Indicators

A total of 10 plants per treatment were randomly sampled. The activities of APX, GR, MDHAR and DHAR in the third fully expanded leaf of seedlings were determined by enzyme-linked immunosorbent assay (ELISA) according to [29] on the 40th day after lighting treatment. The ELISA kits were all purchased from Beijing Solarbio Science & Technology Co., Ltd. (Beijing, China), with model numbers BC0220, BC1160, BC0650 and BC0660, respectively. The contents of AsA, GSH and GSSG were determined by the ELISA-colorimetric method [30]. The kits were all purchased from Shanghai Meilian Biotechnology Co., Ltd. (Shanghai, China), with model numbers ml077005, ml094982 and ml094988, respectively.

2.6. Plant Endogenous Hormones Measurements

A total of 10 plants per treatment were randomly selected for endogenous hormones measurements. The contents of melatonin (MEL), kinetin (KIN), trans-zeatin (ZE), indole acetic acid (IAA), indole butyric acid (IBA) and abscisic acid (ABA) were quantitatively determined by HPLC. The HPLC procedure and standard curve calibration were performed with reference to the method of Farrokhzad [31]. The contents of the above plant hormones in each light-treated sample were quantified by chromatographic peak values, and the final results were expressed in ng·g−1.

2.7. Pathogen Inoculation and Glucose Measurements

Phytophthora infestans (P. infestans) were cultured in King’s B media containing rifampicin (25 mg·mL−1) at 28 °C overnight and resuspended in 10 mM magnesium chloride [32]. A total of 20 plants per treatment were inoculated with the pathogen suspension at a final concentration of 107 colony-forming units (CFU) mL−1 with 0.02% Silwet L-77 by spraying [26], with sterile water as a control for mock inoculation. Six hours after inoculation, 1 g of fresh third fully expanded leaf tissue, mixed from 5 randomly sampled seedlings per treatment, was prepared for further total and apoplastic glucose (Glc) content measurement by HPLC, according to [33]. At 3 d postinoculation (dpi) under different light conditions, disease symptoms were assessed by trypan blue staining, and the fungal population counts [34] were determined from 5 randomly sampled seedlings per treatment.

2.8. Data Statistics and Analysis

Data analysis was performed using SPSS 27.0 software and, and data were plotted with Origin 2020. Different letters represent significance (p < 0.05) according to Tukey’s HSD test.

3. Results

3.1. Plant Growth and Development

It can be seen from Table 1 that the aboveground fresh weight of tomatoes in each treatment follows the order R10B0 < R7B3 < R5B5 < R2B8 < R0B10. In terms of aboveground dry weight of tomatoes, the R2B8 treatment also has the highest value, which is significantly greater than those of the other treatments (except the R0B10 treatment). The dry weight of the other treatments is 7.72% to 49.61% lower than that of the R2B8 treatment. Plant height is still highest in the R2B8 treatment, and except for the R0B10 treatments, the plant heights of the other treatments are significantly lower than that of the R2B8 treatment. The leaf area of each treatment follows the order R10B0 < R7B3 < R5B5 < R0B10 < R2B8. Among them, there are no significant differences among the R5B5, R2B8 and R0B10 treatments, and all of them are significantly larger than those of the R10B0 and R7B3 treatments. The SPAD value of the R10B0 treatment is the lowest, and the SPAD values of other treatments are significantly higher by 26.97% to 56.99% compared with it. The root length and the health index of seedlings reach the maximum in the R2B8 treatment, and those of other treatments are decreased by 10.71% to 38.00% and 7.46% to 22.39%, respectively, compared with the R2B8 treatment.

3.2. Leaf Photosynthesis Capacity

The PN of tomatoes in each treatment followed the order R10B0 < R7B3 < R5B5 < R2B8 < R0B10 (Figure 2a). There was no significant difference among the R5B5, R2B8 and R0B10 treatments. The other treatments significantly increased by 46.51–102.79% compared with the minimum value observed in the R10B0 treatment. The GS values of the R2B8 and R0B10 treatments were the highest, while no significant difference was observed between these two groups (Figure 2b). The trend of Ci in each treatment group was essentially opposite to that of PN, specifically following the order R0B10 < R2B8 < R7B3 < R5B5 < R10B0 (Figure 2c). Compared with the R10B0 treatment, the other treatments decreased by 8.07–30.00%, with the R2B8 and R0B10 treatments being significantly lower than the R10B0 treatment. It can be seen from Figure 2d that the R10B0 treatment group had the lowest Tr, and the value of other treatment groups was significantly 22.22–91.11% higher than that of this group. Among them, there were no significant differences in Tr between the R2B8 and R0B10 treatment groups, which showed the highest values.

3.3. Enzyme Activities of Key Enzymes in the AsA-GSH Cycle

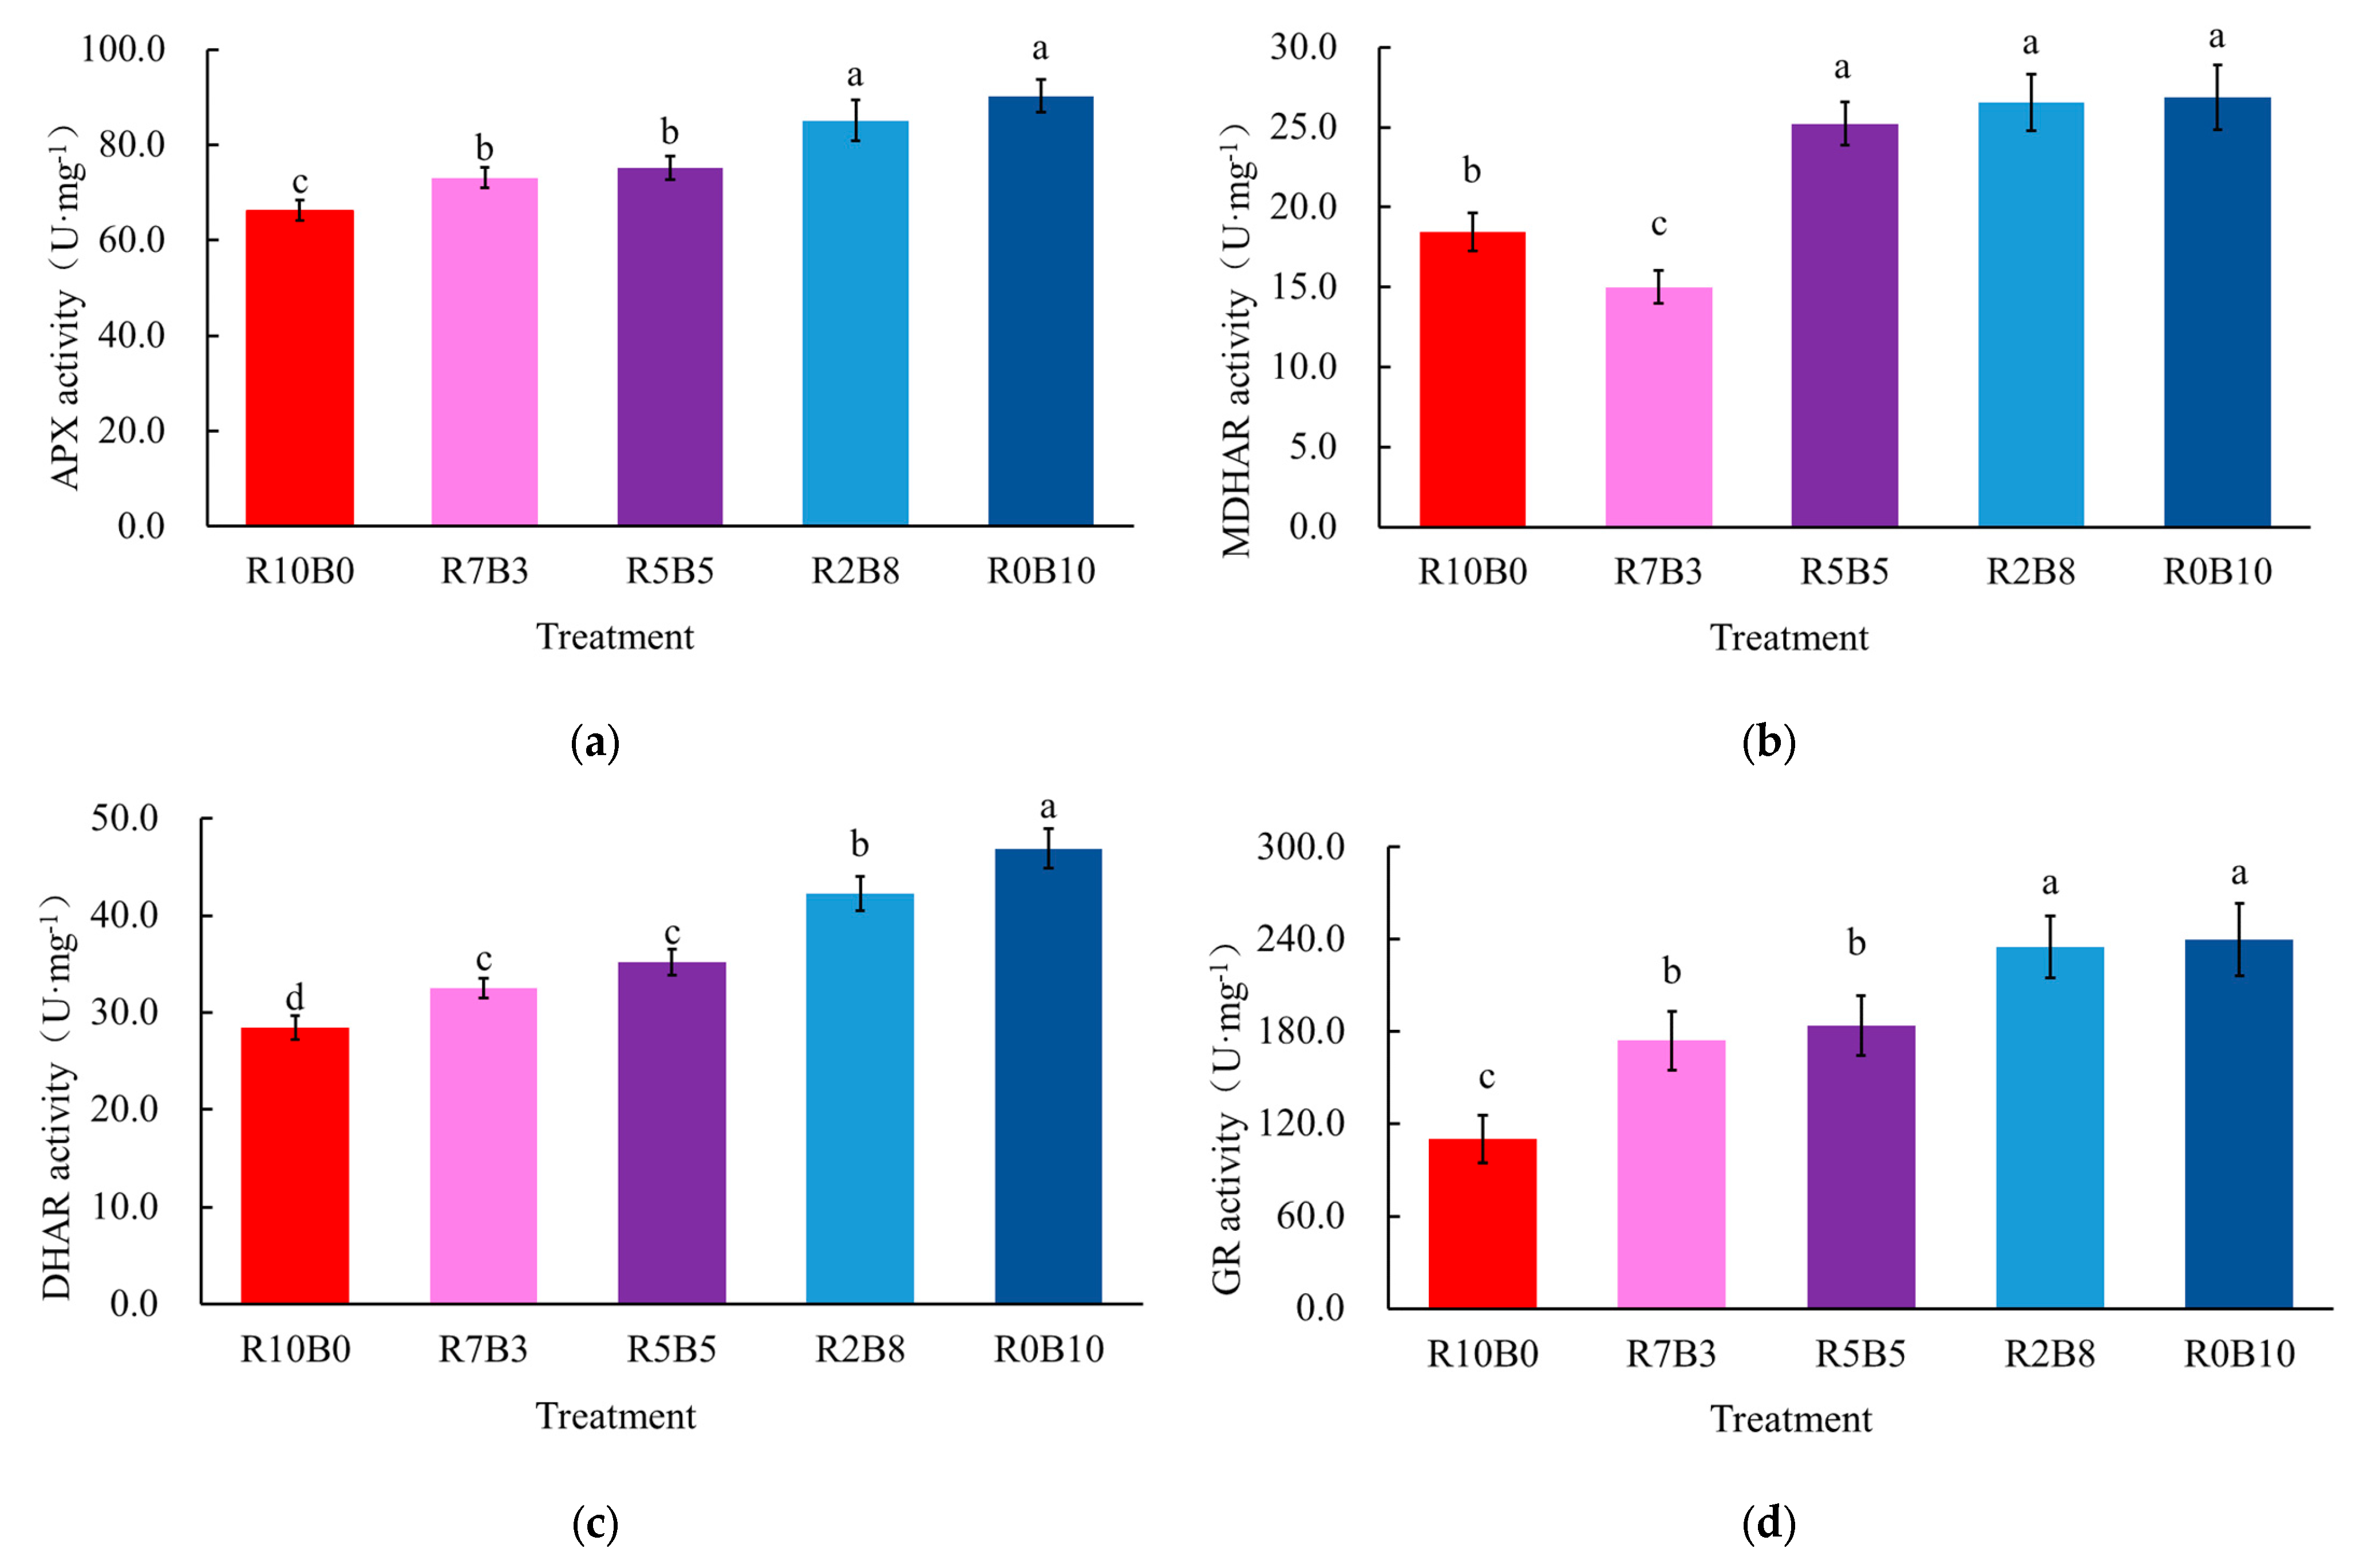
As shown in Figure 3a, the tomatoes treated with R10B0 exhibited the lowest APX activity. The APX activity in the other treatment groups was 10.40–36.25% higher than that in the R10B0 group; however, there were no significant differences in APX activity between the R7B3 and R5B5 groups, or between the R2B8 and R0B10 groups. Moreover, the R2B8 and R0B10 treatment groups showed the highest APX activity, followed by the R7B3 and R5B5 groups. The MDHAR activity in each treatment group followed the order R7B3 < R10B0 < R5B5, R2B8 and R0B10 (with no significant difference among these three groups). Compared with the R7B3 group, the MDHAR activity in the R10B0, R5B5, R2B8 and R0B10 groups was significantly increased by 22.85%, 68.02%, 76.95% and 79.01%, respectively (Figure 3b). The DHAR activity in each treatment group followed the order R10B0 < R7B3 and R5B5 < R2B8 < R0B10 (Figure 3c). Among these groups, there was no significant difference between the R7B3 and R5B5 groups. The DHAR activity in the other treatment groups was 14.31–64.80% higher than that in the R10B0 group. The R2B8 and R0B10 treatment groups had approximately the highest GR activity, followed by the R5B5 and R7B35 group, with no significant difference between the two groups (Figure 3d). The lowest GR activity was observed in the R10B0 treatment group, which was approximately 41.11% lower than that of the next ranking groups (R7B3 and R5B5 group) and 54.17% lower than that of the R2B8 and R0B10 groups, respectively.

3.4. Contents of Key Substances in the AsA-GSH Cycle

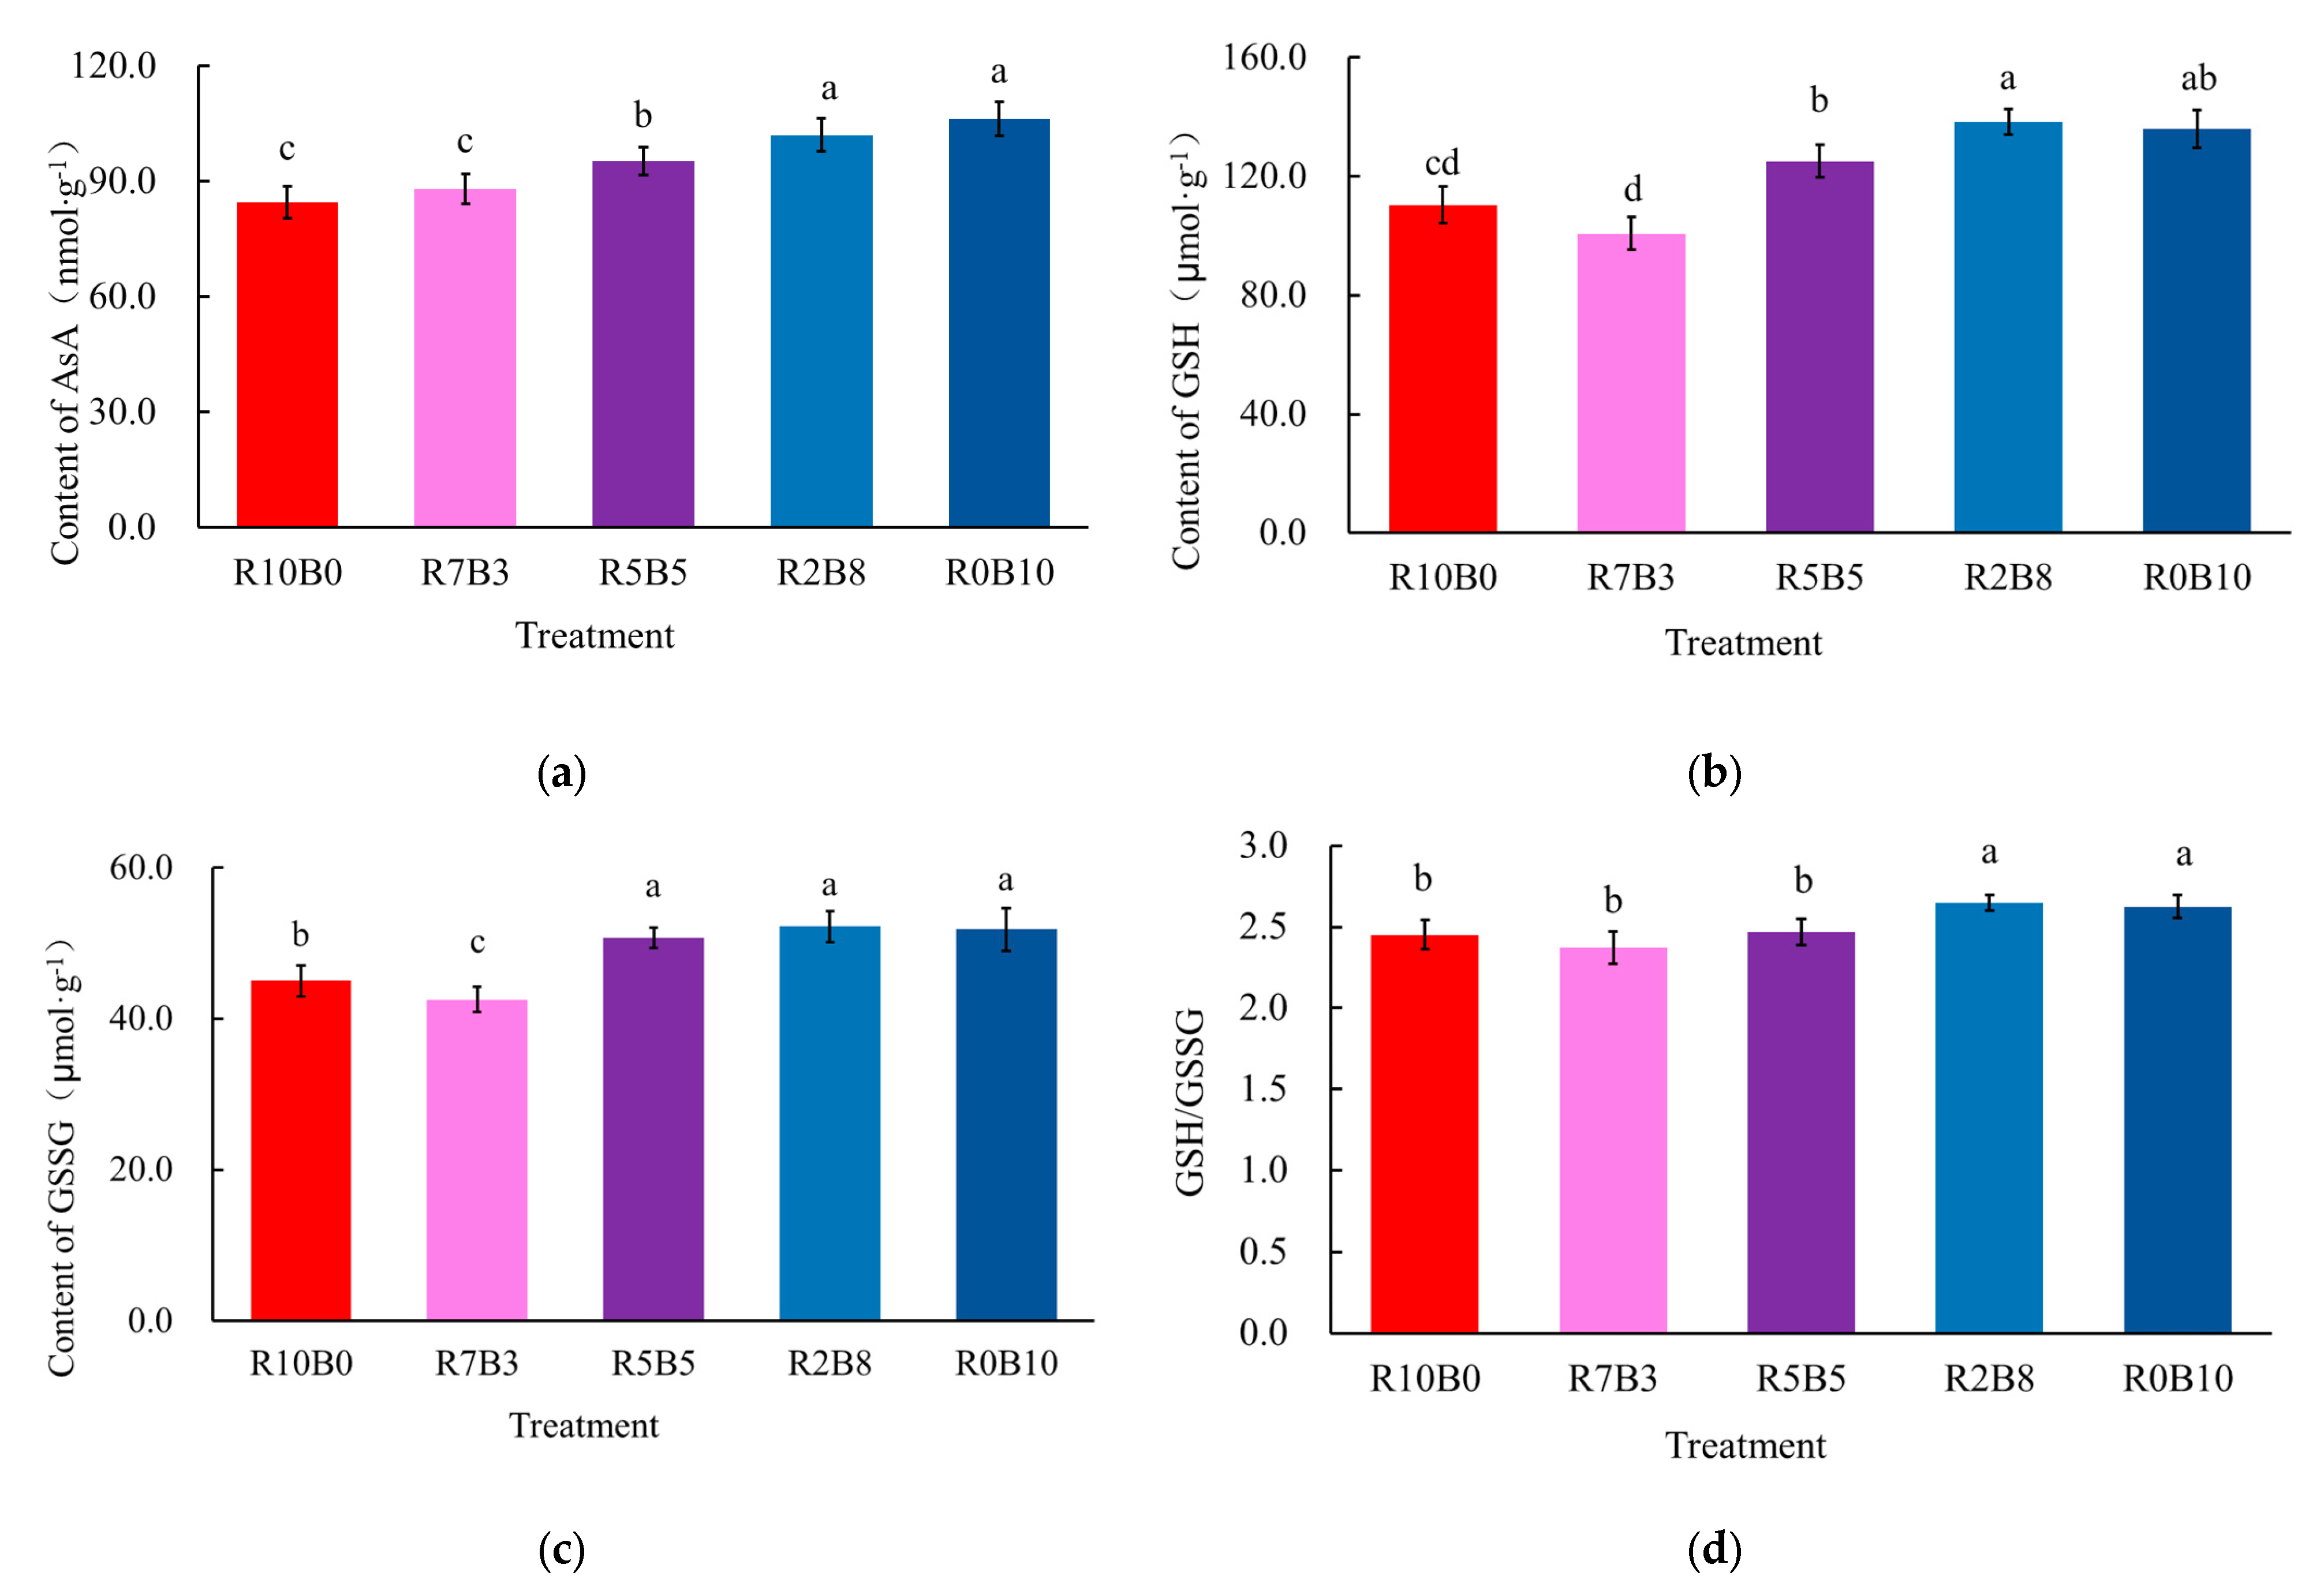
As shown in Figure 4a, tomatoes in the R10B0 and R7B3 treatments had similarly low AsA contents, while the tomatoes treated in the R2B8 and R0B10 treatments had the highest values. The GSH content of tomatoes in each treatment group followed the order R7B3 < R10B0 < R5B5 < R0B10 < R2B8 (Figure 4b). Among these groups, there were no significant differences in GSH content between the R7B3 treatment group and the R10B0 treatment group. However, the highest value was observed in plants under the R2B8 treatment, and the second highest GSH content was detected in the R5B5 treatment group, with the GSH content of seedlings from the R0B10 treatment group showing no significant difference from either of these two groups. It can be seen from Figure 4c that the GSSG content of tomatoes in each treatment group followed the order R7B3 < R10B0 < R5B5, R0B10 and R2B8 (no significant difference was observed among these three groups). Among them, the GSSG content of the treatment groups with a relatively high proportion of blue light (R5B5, R2B8 and R0B10) was significantly higher than that of the treatment groups with a high proportion of red light (R7B3 and R10B0). As presented in Figure 4d, the ratio of glutathione to oxidized glutathione (GSH/GSSG) in tomatoes of each treatment group followed the order R7B3, R10B0 and R5B5 < R0B10 and R2B8. Among these, the aforementioned ratio of the treatment groups with a high proportion of blue light (R2B8 and R0B10) was significantly higher than that of the treatment groups with a relatively high proportion of red light (R5B5, R7B3 and R10B0).

3.5. Contents of Endogenous Hormones in Seedlings

As shown in Table 2, the R0B10 treatment group had the highest content of MEL. There was no significant difference in MEL content between the R2B8 group and the R10B0 or R5B5 treatment groups, while the MEL content of the other treatment groups was significantly lower than that of the R0B10 group by 29.07–56.10%. The R2B8 treatment group exhibited the lowest content of ABA. Compared with the R2B8 group, the ABA content of the other treatment groups increased by 2.36–26.89%, with the ABA content of the R10B0 and R0B10 treatment groups being significantly higher than that of the R2B8 group. The KIN content in each treatment group followed the order R10B0 < R5B5 < R0B10 < R7B3 < R2B8. The KIN content of other treatment groups was 3.15–17.57% lower than that of the R2B8 treatment group. The R2B8 treatment group had the highest contents of ZE and IBA. In comparison with the R2B8 group, the ZE content of other treatment groups decreased by 3.23–19.35%, and the IBA content decreased by 3.47–25.43%. The IAA content in each treatment group ranged from 13.17 to 16.22 ng·g−1. Among all groups, the R2B8 treatment group had the highest IAA content, and the IAA content of other treatment groups was 4.50–18.80% lower than that of the R2B8 group.

3.6. Disease Susceptibility and Glucose Content

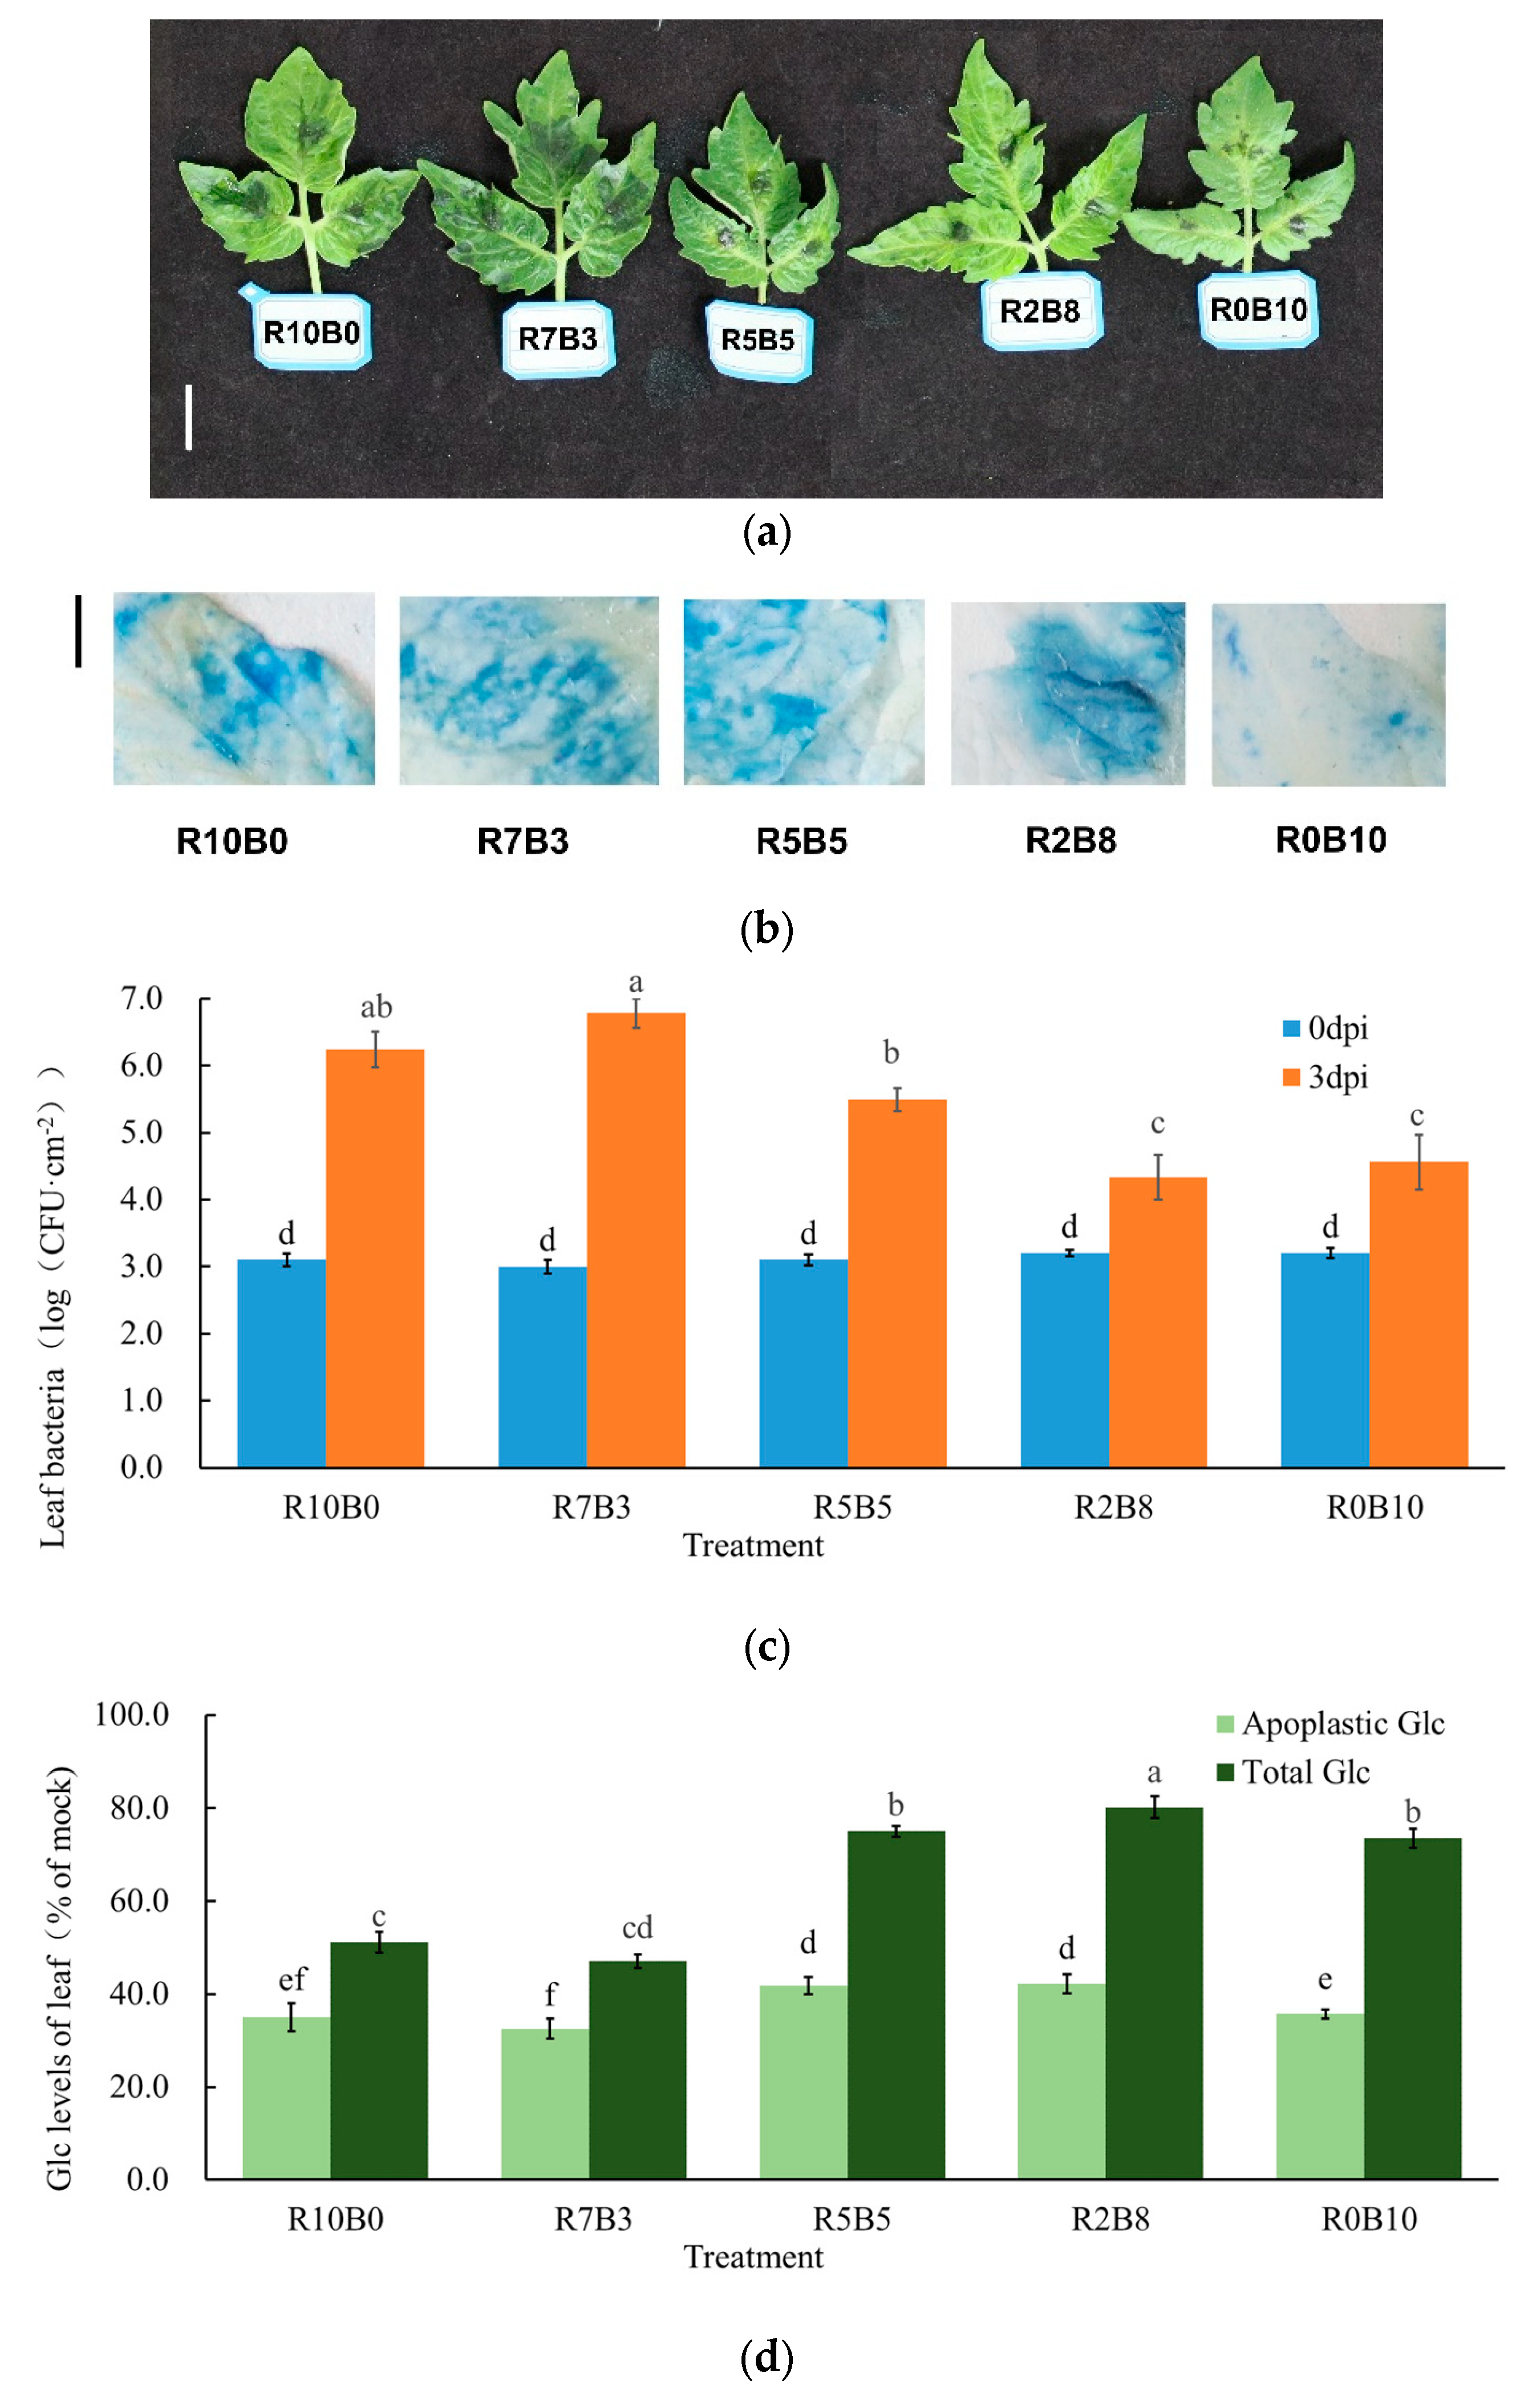
As shown in Figure 5, the light-quality treatment significantly affected the susceptibility of tomato to P. infestans. The seedlings under the R7B3 treatment exhibited most leaf lesions, while the bacterial amount in the leaves under the R2B8 and R0B10 treatment groups was the lowest (Figure 5a–c). We defined the actual value of the Glc of each light-condition treatment with mock-inoculated plants as 1, and the data shown in Figure 4d represent the relative apoplastic Glc and total Glc (as percentages of mock-inoculated plants) of seedlings after P. infestans inoculation under different treatments. It was observed that the levels of both apoplastic and total Glc were significantly decreased by P. infestans inoculation. The highest apoplastic Glc was observed in the R5B5 and R2B8 treatment groups, approximately 29.83% higher than the minimum value in the R7B3 treatment group. However, the highest total Glc under P. infestans inoculation was observed in leaves under the R2B8 treatment, approximately 8.95% higher than the second ranking value.

4. Discussion

Light quality is a crucial factor in the industrialized raising of seedlings in protected horticulture. In China, fluorescent lamps or LED lights are commonly used as light sources for tissue culture or seedling production [10]; however, there are currently insufficient studies on the application of LED light-quality ratios in tomato seedlings quality and plant disease susceptibility during production. In this study, the use of appropriate light quality ratios exerted a positive impact on tomato growth, indicating that light-quality ratios have good feasibility in tomato seedlings. Fresh weight, dry weight, SPAD value and root development status of vegetable crop plants are important indicators reflecting plant growth conditions: the higher their values, the better the plant growth [6,8]. The results of this study showed that there were certain differences in various growth trait indicators under different LED light-quality ratio treatments. Among them, the treatments with high-proportion blue light (R2B8 and R0B10) resulted in better plant growth, with the R2B8 treatment showing the optimal effect. Under this light-quality ratio, tomato plants had the widest leaf area, the best root development, and the maximum accumulation of dry matter. In contrast, treatments with high-proportion red light (R10B0, R7B3) led to dwarf plants and slow growth. This result differs from previous reports showing that high-proportion red-light treatment can significantly promote the elongation of stems and leaf sheaths in lettuce in a mini-plant factory, increase plumpness and root-to-shoot ratio and accelerate the plant growth process [35]. The reason for the difference between the two results may be that there are still differences in biological characteristics among different vegetable crops, leading to differences in their response mechanisms to light quality.
Parameters of gas exchange characteristics are important indicators reflecting photosynthetic efficiency, the state of photosynthetic electron transport and the quality of leaf development. Favorable photosynthetic gas exchange characteristics indicate a smooth photosynthetic process, good leaf development and coordinated physiological metabolism [36]. The results of this study showed that compared with the high-proportion red-light treatment, high-proportion blue light resulted in better parameters of photosynthetic gas exchange characteristics, as reflected in higher PN, Gs and Tr, as well as lower Ci. Previous studies have shown that stomatal opening and closing are regulated by light signal receptors [6,7,37]; therefore, blue light may be the main light quality that mediates light signal receptors in tomato plants. A relatively high Gs value indicates vigorous photosynthetic physiological metabolism, and higher PN and Gs are conducive to the progress of the dark reaction, enabling the synthesis and accumulation of more organic matter [38]. This is basically consistent with the research results of a previous report: under a relatively high proportion of blue light, the activity of RuBP carboxylase in the leaves of Sedum rubrotinctum was the highest, and the photosynthetic pigment content, electron transport efficiency and net photosynthetic rate were also the highest [37]. Light quality is a key factor affecting plant development and physiological metabolism. Different light-quality ratios have significant impacts on the morphogenesis and photosynthetic physiology of Solanaceae plants. Plants mainly absorb blue–violet light for photosynthesis and energy conversion processes, with blue light being the main light source that regulates photoreceptor proteins [6,37,39].
The AsA-GSH cycle is one of the important antioxidant systems in plants. The rapid operation of the AsA-GSH cycle can reduce the content of reactive oxygen species (ROS) free radicals, thereby alleviating cell damage caused by ROS stress [40,41,42]. The most active enzymes in the AsA-GSH cycle are ascorbate peroxidase and glutathione reductase; their activity levels directly affect the efficiency of ROS scavenging by the AsA-GSH cycle [17,43]. Glutathione is a key detoxifying substance in plants, which can maintain the structural stability of membrane proteins by quenching reactive oxygen species [17]. In this study, compared with the pure red light treatment (R10B0), as the proportion of blue light increased, the activities of enzymes (GPX, MDHAR, DHAR and GR) and the contents of AsA, GSH and GSSG generally increased. Among all treatments, R2B8 and R0B10 showed better performance, indicating that blue light can promote the scavenging of oxidative products in the cytoplasm, mitochondria, plastids and peroxisomes of tomato plants, thereby regulating oxidative stress. In addition, the R2B8 and R0B10 treatments resulted in the highest GSH/GSSG ratio. GSH/GSSG is an important indicator reflecting the reduction efficiency in the turnover rate of the AsA-GSH cycle [17,43], and a higher GSH/GSSG ratio indicates the optimal intracellular redox state.
Endogenous hormones are one of the crucial factors required for in vitro plant tissue culture and industrialized seedling production. Different light qualities can affect the synthesis of endogenous hormones through phytochromes, thereby influencing cell proliferation and differentiation in multiple aspects [17,27]. Previous studies indicated that different LED light-quality ratios have significantly different effects on various endogenous hormones in potatoes. Specifically, when the treatment with 45% red light + 35% blue light + 20% green light was adopted, the concentrations of endogenous gibberellins (GAs) and IAA reached the highest levels. These two hormones can act synergistically to stimulate the elongation of stem cells and internodes, ultimately increasing biomass [44]. A study also found that different LED light-quality ratios have a significant impact on the growth performance of cucumbers. Specifically, blue light can induce the secretion of IAA, while green light can promote the accumulation of gibberellins [45]. In this study, the contents of MEL, KIN, ZR, IAA and IBA in leaves of tomatoes reached the highest overall level under the R2B8 treatment. All the aforementioned endogenous hormones can promote plant growth, increase the accumulation of photosynthetic products and alleviate abiotic stress. This result suggests that adding a small proportion of red light to pure blue light can promote the synthesis of MEL, KIN, ZR, IAA and IBA in tomatoes. A study on protocorm-like bodies (PLBs) of Oncidium in tissue culture found that under pure red-light treatment, the content of abscisic acid (ABA) was consistently higher than that in groups treated with other single-light qualities [46]. Our study also confirmed that the ABA content in tomatoes was the highest under pure red light treatment. Since ABA has the effects of inducing organ senescence and abscission, as well as inhibiting the growth of new tissues, it can be concluded that pure red light is not conducive to the growth and development of tomato seedlings. However, adding a certain proportion of blue light to pure red light helps to reduce the inhibitory effect caused by ABA.
In the process of intensive seedling production, facility-based cultivation profits often suffer severe losses due to disease outbreaks. In recent years, the connection between the light environment and plant disease immune responses has gradually gained attention [26,47,48,49]. Chloroplasts are the light-harvesting centers in cells, and light and pathogen resistance can be linked through chloroplasts [5,50]. Moreover, chloroplast-derived metabolites (including carbohydrates) may act as signaling molecules to regulate disease resistance of tomatoes under different light conditions [51,52,53]. In our study, we found that different light-quality wavelengths had a significant impact on the resistance of tomato seedlings to Phytophthora infestans. Specifically, increasing the proportion of red light enhanced the susceptibility of plants to Phytophthora infestans. Additionally, the glucose content in tomato leaves—especially apoplastic GLc content—decreased significantly after inoculation with P. infestans under low-light conditions. Similarly, after 4 or 6 h of infection by the pathogen Pseudomonas syringae pv. phaseolicola, the apoplastic Glc content in bean leaves also decreased [54]. In previous studies on Arabidopsis thaliana, the reduction in apoplastic Glc under low-light environments was regarded as a detector for sensing changes in plant light fluctuations [22]. Carbohydrates (including glucose) have the potential to be used as foliar fertilizers to stimulate plant immunity, thereby protecting crops from pathogen damage [27]. In contrast, in several previous studies, apoplastic glucose was considered to act as an energy or nutrient source to regulate plant defense responses [55,56,57]. However, glucose (as an energy or nutrient source) is also regarded as a signal that participates in regulating TOR-mediated plant growth and development [58]. Therefore, we propose that the reduction of apoplastic glucose may act as a signaling molecule to rapidly sense changes in the plant immune system caused by alterations in light wavelengths, thereby affecting the function of the plant defense system. Consequently, future studies need to further explore how plant cells sense changes in apoplastic glucose levels, and then identify the specific action pathways and key factors involved. Combined with the fact that other emerging photobiological technologies (such as laser biostimulation technology) can also exert a positive effect on the growth of seeds or seedlings [59,60], this provides a reference for ensuring the efficiency of facility-based production, promoting green and environmentally friendly agricultural production and enhancing the broad-spectrum stress resistance of crops.

5. Conclusions

Five kinds of LED lighting sources with different red and blue light combinations were set up to study the effect of different light-quality ratios on the growth, AsA-GSH cycle, and endogenous hormone contents of tomato seedlings, as well as the resistance response of the plants to Phytophthora infestans. The results showed that different light-quality ratios have a significant impact on the growth and development, endogenous hormone synthesis, and AsA-GSH cycle of tomato seedlings. Pure blue light and composite light treatments with a high proportion of blue light can promote the synthesis of growth-promoting endogenous hormones in tomatoes, thereby enabling tomato seedlings to exhibit better overall growth and development, superior photosynthetic physiological performance, higher dry matter accumulation in various organs and a faster AsA-GSH cycle rate. Meanwhile, high-proportion blue-light treatment alleviated the reduction in both apoplastic and total glucose in tomato leaves after P. infestans inoculation and achieved the best effect in improving the resistance of tomatoes to P. infestans. However, pure red or blue light-quality treatment increases the ABA content in leaves, which has an inhibitory effect on tomato growth. Given these results, the optimal light environment setting was red light–blue light = 2:8.

Author Contributions

Conceptualization, C.J. and Y.S.; methodology, M.L. and T.P.; validation, K.Z. and Y.M.; formal analysis, Z.L. and M.L.; investigation, K.Z. and S.G.; resources, Y.Z. and J.X.; data curation, K.Z. and J.X.; writing—original draft preparation, C.J., Z.L. and Y.M.; writing—review and editing, K.Z., S.G. and T.P.; project administration, C.J. and W.L.; funding acquisition, Y.S. and W.L. All authors have read and agreed to the published version of the manuscript.

Funding

This research was funded by the National Science Foundation of China (32202581), Independent Cultivation Project of Research Institute of Crop Germplasm Resources, Xinjiang Academy of Agricultural Sciences (PZ202302) and the Natural Science Foundation Project of the Tibet Autonomous Region (XZ202301ZR005G).

Institutional Review Board Statement

Not applicable.

Data Availability Statement

The original contributions presented in this study are included in the article. Further inquiries can be directed to the corresponding authors.

Conflicts of Interest

The authors declare no conflicts of interest.

References

  1. Liu, D.; Chen, J.; Hao, Y.; Yang, X.; Chen, R.; Zhang, Y. Effects of extreme root restriction on the nutritional and flavor quality, and sucrose metabolism of tomato (Solanum lycopersicum L.). Horticulturae 2023, 9, 813. [Google Scholar] [CrossRef]
  2. Genoud, T.; Buchala, A.J.; Chua, N.H.; Métraux, J.P. Phytochrome signalling modulates the SA-perceptive pathway in Arabidopsis. Plant J. 2002, 31, 87–95. [Google Scholar] [CrossRef] [PubMed]
  3. Ballaré, C.L. Light regulation of plant defense. Annu. Rev. Plant Biol. 2014, 65, 335–363. [Google Scholar] [CrossRef] [PubMed]
  4. Zhang, H.; Zheng, X.; Zhang, Z. The Magnaporthe grisea species complex and plant pathogenesis. Mol. Plant Pathol. 2016, 17, 796–804. [Google Scholar] [CrossRef] [PubMed]
  5. Liu, M.X.; Zhang, S.B.; Hu, J.X.; Sun, W.X.; Padilla, J.; He, Y.L.; Li, Y.; Yin, Z.Y.; Liu, X.Y.; Wang, W.H.; et al. Phosphorylation guarded light-harvesting complex II contributes to broad-spectrum blast resistance in rice. Proc. Natl. Acad. Sci. USA 2019, 116, 17572–17577. [Google Scholar] [CrossRef]
  6. Song, Y.; Jiang, C.; Gao, L. Polychromatic supplemental lighting from underneath canopy is more effective to enhance tomato plant development by improving leaf photosynthesis and stomatal regulation. Front. Plant Sci. 2016, 7, 1832. [Google Scholar] [CrossRef]
  7. Jiang, C.; Johkan, M.; Hohjo, M.; Tsukagoshi, S.; Ebihara, M.; Nakaminami, A.; Maruo, T. Photosynthesis, plant growth, and fruit production of single-truss tomato improves with supplemental lighting provided from underneath or within the inner canopy. Sci. Hortic. 2017, 222, 221–229. [Google Scholar] [CrossRef]
  8. Jiang, C.; Johkan, M.; Hohjo, T.; Tsukagoshi, S.; Ebihara, M.; Nakaminami, A.; Maruo, M. Supplemental lighting applied within or underneath the canopy enhances leaf photosynthesis, stomatal regulation and plant development of tomato under limiting light conditions. Acta Hortic. 2018, 1227, 645–652. [Google Scholar] [CrossRef]
  9. Fan, C.Y.; Manivannan, A.; Wei, H. Light quality-mediated influence of morphogenesis in micropropagated horticultural crops: A comprehensive overview. BioMed Res. Int. 2022, 2022, 4615079. [Google Scholar] [CrossRef]
  10. Fang, S.; Lang, T.; Cai, M.; Han, T. Light keys open locks of plant photoresponses: A review of phosphors for plant cultivation LEDs. J. Alloys Compd. 2022, 902, 163825. [Google Scholar] [CrossRef]
  11. Bhattarai, T.; Ebong, A.; Raja, M.Y.A. A review of Light-Emitting Diodes and Ultraviolet Light-Emitting Diodes and their applications. Photonics 2024, 11, 491. [Google Scholar] [CrossRef]
  12. Zhao, X.; Tong, J.; Meng, Y.; Wang, L.; Wang, X.; Wu, Z. Effect of different light ratios in plant factories on the growth and quality of water dropwort. North. Hortic. 2022, 6, 8–14, (In Chinese with English Abstract). [Google Scholar]
  13. Wang, Z.; Ma, J.; He, S.; He, D.; Shang, W.; Wang, H. Effects of different proportions of light qualities from LED light sources on the growth of tissue-cultured seedlings of Photinia × fraseri. Jiangsu Agri. Sci. 2019, 47, 152–155. [Google Scholar]
  14. Campos, M.D.; Félix, M.R.; Patanita, M.; Materatski, P.; Varanda, C. High throughput sequencing unravels tomato-pathogen interactions towards a sustainable plant breeding. Hortic. Res. 2021, 8, 171. [Google Scholar] [CrossRef] [PubMed]
  15. Zhang, H.; Zhu, J.; Gong, Z.; Zhu, J. Abiotic stress responses in plants. Nat. Rev. Genet. 2022, 23, 104–119. [Google Scholar] [CrossRef]
  16. Nawaz, M.; Sun, J.; Shabbir, S.; Khattak, W.A.; Ren, G.; Nie, X.; Bo, Y.; Javed, Q.; Du, D.; Sonne, C. A review of plants strategies to resist biotic and abiotic environmental stressors. Sci. Total Environ. 2023, 900, 165832. [Google Scholar] [CrossRef]
  17. Hasanuzzaman, M.; Bhuyan, M.H.M.B.; Anee, T.I.; Parvin, K.; Nahar, K.; Mahmud, J.A.; Fujita, M. Regulation of Ascorbate-Glutathione pathway in mitigating oxidative damage in plants under abiotic stress. Antioxidants 2019, 8, 384. [Google Scholar] [CrossRef]
  18. Wang, J.; Zhang, Z.; Huang, R. Regulation of ascorbic acid synthesis in plants. Plant Signal Behav. 2013, 8, e24536. [Google Scholar] [CrossRef]
  19. Fenech, M.; Amorim-Silva, V.; del Valle, A.E.; Arnaud, D.; Ruiz-Lopez, N.; Castillo, A.G.; Smirnoff, N.; Botella, M.A. The role of GDP-l-galactose phosphorylase in the control of ascorbate biosynthesis. Plant Physiol. 2021, 185, 1574–1594. [Google Scholar] [CrossRef]
  20. Castro, J.C.; Castro, C.G.; Cobos, M. Genetic and biochemical strategies for regulation of L-ascorbic acid biosynthesis in plants through the L-galactose pathway. Front. Plant Sci. 2023, 14, 1099829. [Google Scholar] [CrossRef]
  21. Ruan, Y.L. Sucrose metabolism: Gateway to diverse carbon use and sugar signaling. Annu. Rev. Plant Biol. 2014, 65, 33–67. [Google Scholar] [CrossRef]
  22. Liao, K.L.; Jones, R.D.; McCarter, P.; Tunc-Ozdemir, M.; Draper, J.A.; Elston, T.C.; Kramer, D.; Jones, A.M. A shadow detector for photosynthesis efficiency. J. Theor. Biol. 2017, 414, 231–244. [Google Scholar] [CrossRef] [PubMed]
  23. Bolouri Moghaddam, M.R.; Van den Ende, W. Sugars and plant innate immunity. J. Exp. Bot. 2012, 63, 3989–3998. [Google Scholar] [CrossRef] [PubMed]
  24. Häusler, R.E.; Heinrichs, L.; Schmitz, J.; Flugge, U.I. How sugars might coordinate chloroplast and nuclear gene expression during acclimation to high light intensities. Mol. Plant 2014, 7, 1121–1137. [Google Scholar] [CrossRef] [PubMed]
  25. Trouvelot, S.; Heloir, M.C.; Poinssot, B.; Gauthier, A.; Paris, F.; Guillier, C.; Combier, M.; Trda, L.; Daire, X.; Adrian, M. Carbohydrates in plant immunity and plant protection: Roles and potential application as foliar sprays. Front. Plant Sci. 2014, 5, 592. [Google Scholar] [CrossRef]
  26. Wang, J.; Wang, A.; Luo, Q.; Hu, Z.; Ma, Q.; Li, Y.; Lin, T.; Liang, X.; Yu, J.; Foyer, C.H.; et al. Glucose sensing by regulator of G protein signaling 1 (RGS1) plays a crucial role in coordinating defense in response to environmental variation in tomato. New Phytol. 2022, 236, 561–575. [Google Scholar] [CrossRef]
  27. Paradiso, R.; Proietti, S. Light-quality manipulation to control plant growth and photomorphogenesis in greenhouse horticulture: The state of the art and theopportunities of modern LED Systems. J. Plant Growth Regul. 2022, 41, 742–780. [Google Scholar] [CrossRef]
  28. Fan, X.X.; Xu, Z.G.; Liu, X.Y.; Tang, C.M.; Wang, L.W.; Han, X. Effects of light intensity on the growth and leaf development of young tomato plants grown under a combination of red and blue light. Sci. Hortic. 2013, 153, 50–55. [Google Scholar] [CrossRef]
  29. Liu, G.; Shi, Y.; Sun, J.; Mu, J. Recent advances on fluorescence-based enzyme linked immunosorbent assay. Chin. J. Anal. Chem. 2023, 51, 331–339. [Google Scholar]
  30. Thiha, A.; Ibrahim, F. A colorimetric enzyme-linked immunosorbent assay (ELISA) detection platform for a point-of-care dengue detection system on a lab-on-compact-disc. Sensors 2015, 15, 11431–11441. [Google Scholar] [CrossRef]
  31. Farrokhzad, Y.; Babaei, A.; Yadollahi, A.; Kashkooli, A.B.; Mokhtassi-Bidgoli, A.; Hesami, S. In vitro photomorphogenesis, plant growth regulators, melatonin content, and DNA methylation under various wavelengths of light in Phalaenopsis amabilis. Plant Cell Tiss. Organ. Cult. 2022, 149, 535–548. [Google Scholar] [CrossRef]
  32. Ding, S.; Shao, X.; Li, J.; Ahammed, G.J.; Yao, Y.; Ding, J.; Hu, Z.; Yu, J.; Shi, K. Nitrogen forms and metabolism affect plant defence to foliar and root pathogens in tomato. Plant Cell Environ. 2021, 44, 1596–1610. [Google Scholar] [CrossRef] [PubMed]
  33. Wang, J. Function and Mechanisms of Apoplastic Glucose Signaling in Tomato Disease Resistance Under Low Light Condition. Ph.D. Thesis, Zhejiang University, Hangzhou, China,, 2021. [Google Scholar]
  34. Zhang, N.; Pombo, M.A.; Rosli, H.G.; Martin, G.B. Tomato wall-associated kinase SlWak1 depends on Fls2/Fls3 to promote apoplastic immune responses to Pseudomonas syringae. Plant Phys. 2020, 183, 1869–1882. [Google Scholar] [CrossRef] [PubMed]
  35. Hang, T.; Lu, N.; Takagaki, M.; Mao, H. Leaf area model based on thermal effectiveness and photosynthetically active radiation in lettuce grown in mini-plant factories under different light cycles. Sci. Hortic. 2019, 252, 113–120. [Google Scholar] [CrossRef]
  36. Song, J.; Fan, Y.; Li, X.; Li, Y.; Mao, H.; Zuo, Z.; Zou, Z. Effects of daily light integral on tomato (Solanum lycopersicon L.) grafting and quality in a controlled environment. Int. J. Agric. Biol. Eng. 2022, 15, 44–50. [Google Scholar] [CrossRef]
  37. Si, C.; Lin, Y.; Luo, S.; Yu, Y.; Liu, R.; Naz, M.; Dai, Z. Effects of LED light quality combinations on growth and leaf colour of tissue culture generated plantlets in Sedum rubrotinctum. Hortic. Sci. Technol. 2024, 42, 53–67. [Google Scholar] [CrossRef]
  38. Gu, L.; Han, J.; Wood, J.D.; Chang, C.Y.; Sun, Y. Sun-induced Chl fluorescence and its importance for biophysical modeling of photosynthesis based on light reactions. New Phytol. 2019, 233, 1179–1191. [Google Scholar] [CrossRef]
  39. Song, J.; Zhang, R.; Yang, F.; Wang, J.; Cai, W.; Zhang, Y. Nocturnal LED supplemental lighting improves quality of tomato seedlings by increasing biomass accumulation in a controlled environment. Agronomy 2024, 14, 1888. [Google Scholar] [CrossRef]
  40. An, R.; Liu, X.; Luo, S.; Li, G.; Hu, H.; Li, P. Taxifolin delays the degradation of chlorophyll in pakchoi (Brassica rapa L. subsp. chinensis) by regulating the ascorbate-glutathione cycle. Postharvest Biol. Technol. 2022, 191, 111982. [Google Scholar] [CrossRef]
  41. Pan, L.; Zhou, C.; Jing, J.; Zhuang, M.; Zhang, J.; Wang, K.; Zhang, H. Metabolomics analysis of cucumber fruit in response to foliar fertilizer and pesticides using UHPLC-Q-Orbitrap-HRMS. Food Chem. 2021, 369, 130960. [Google Scholar] [CrossRef]
  42. Liu, C.; Yu, H.; Liu, Y.; Zhang, L.; Li, D.; Zhao, X.; Zhang, J.; Sui, Y. Promoting anthocyanin biosynthesis in purple lettuce through sucrose supplementation under nitrogen limitation. Horticulturae 2024, 10, 838. [Google Scholar] [CrossRef]
  43. Ahmad, N.; Naeem, M.; Ali, H.; Alabbosh, K.F.; Hussain, H.; Khan, I.; Siddiqui, S.A.; Khan, A.A.; Iqbal, B. From challenges to solutions: The impact of melatonin on abiotic stress synergies in horticultural plants via redox regulation and epigenetic signaling. Sci. Hortic. 2023, 321, 112369. [Google Scholar] [CrossRef]
  44. Chen, L.; Wang, H.; Gong, X.; Xue, X.; Hu, Y. Effects of different LED light spectra on growth and alterations of endogenous hormone of potato plantlets grown in vitro. Chin. Potato J. 2020, 34, 257–267, (In Chinese with English Abstract). [Google Scholar]
  45. Li, X.; Zhao, S.; Bao, X.; Yang, Y.; Wu, Y.; Yang, Z. Effect of increasing the percentage of green light on morphology, photosynthetic traits and carbohydrates of cucumber seedlings. J. China Agric. Univ. 2024, 29, 58–65, (In Chinese with English Abstract). [Google Scholar]
  46. Farrokhzad, Y.; Babaei, A.; Yadollahi, A.; Kashkooli, A.B.; Mokhtassi-Bidgoli, A.; Hessami, S. Informative title: Development of lighting intensity approach for shoot proliferation in Phalaenopsis amabilis through combination with silver nanoparticles. Sci. Hortic. 2022, 292, 110582. [Google Scholar] [CrossRef]
  47. Wan, L.; Li, H.; Li, C.; Wang, A.; Yang, Y.; Wang, P. Hyperspectral sensing of plant diseases: Principle and methods. Agronomy 2022, 12, 1451. [Google Scholar] [CrossRef]
  48. Sun, J.; Tan, X.; Liu, B.; Battino, M.; Meng, X.; Zhang, F. Blue light inhibits gray mold infection by inducing disease resistance in cherry tomato. Postharvest Biol. Technol. 2024, 215, 113006. [Google Scholar] [CrossRef]
  49. Wang, Y.; Shi, Q.; Lin, J.; Lu, X.; Ye, B.; Lv, H.; Du, X.; Chen, T. Hormone metabolism and substance accumulation in cucumber plants: Downy mildew infection and potassium stress. Agriculture 2025, 15, 994. [Google Scholar] [CrossRef]
  50. Kangasjärvi, S.; Neukermans, J.; Li, S.; Aro, E.M.; Noctor, G. Photosynthesis, photorespiration, and light signalling in defence responses. J. Exp. Bot. 2012, 63, 1619–1636. [Google Scholar] [CrossRef]
  51. Heinrichs, L.; Schmitz, J.; Flügge, U.I.; Häusler, R.E. The mysterious rescue of adg1-1/tpt-2-an Arabidopsis thaliana double mutant impaired in acclimation to high light-by exogenously supplied sugars. Front. Plant Sci. 2012, 3, 265. [Google Scholar] [CrossRef]
  52. Schmitz, J.; Schöttler, M.A.; Krueger, S.; Geimer, S.; Schneider, A.; Kleine, T.; Leister, D.; Bell, K.; Flügge, U.I.; Häusler, R.E. Defects in leaf carbohydrate metabolism compromise acclimation to high light and lead to a high chlorophyll fluorescence phenotype in Arabidopsis thaliana. BMC Plant Biol. 2012, 12, 8. [Google Scholar] [CrossRef]
  53. Schmitz, J.; Heinrichs, L.; Scossa, F.; Fernie, A.R.; Oelze, M.L.; Dietz, K.J.; Rothbart, M.; Grimm, B.; Flügge, U.I.; Häusler, R.E. The essential role of sugar metabolism in the acclimation response of Arabidopsis thaliana to high light intensities. J. Exp. Bot. 2014, 65, 1619–1636. [Google Scholar] [CrossRef]
  54. O’Leary, B.M.; Neale, H.C.; Geilfus, C.M.; Jackson, R.W.; Arnold, D.L.; Preston, G.M. Early changes in apoplast composition associated with defence and disease in interactions between phaseolus vulgaris and the halo blight pathogen pseudomonas syringae pv. phaseolicola. Plant Cell Environ. 2016, 39, 2172–2184. [Google Scholar] [CrossRef]
  55. Dodds, P.N.; Lagudah, E.S. Starving the enemy. Science 2016, 354, 1377–1378. [Google Scholar] [CrossRef]
  56. Yamada, K.; Saijo, Y.; Nakagami, H.; Takano, Y. Regulation of sugar transporter activity for antibacterial defense in Arabidopsis. Science 2016, 354, 1427–1430. [Google Scholar] [CrossRef] [PubMed]
  57. Naseem, M.; Kunz, M.; Dandekar, T. Plant-pathogen maneuvering over apoplastic sugars. Trends Plant Sci. 2017, 22, 740–743. [Google Scholar] [CrossRef] [PubMed]
  58. Xiong, Y.; Mccormack, M.; Li, L.; Hall, Q.; Xiang, C.; Sheen, J. Glucose-TOR signalling reprograms the transcriptome and activates meristems. Nature 2013, 496, 181. [Google Scholar] [CrossRef] [PubMed]
  59. Klimek-Kopyra, A.; Dobrowolski, J.W.; Czech, T.; Neugschwandtner, R.W.; Gambuś, F.; Kot, D. Chapter One—The Use of Laser Biotechnology in Agri-Environment as a Significant Agronomical Advance Increasing Crop Yield and Quality. In Advances in Agronomy; Sparks, D.L., Ed.; Academic Press: Cambridge, MA, USA, 2021; Volume 170, pp. 1–33. [Google Scholar]
  60. Dłużniewska, J.; Klimek-Kopyra, A.; Czech, T.; Dobrowolski, J.W.; Dacewicz, E. The Use of Coherent Laser Stimulation of Seeds and a Fungal Inoculum to Increase the Productivity and Health of Soybean Plants. Agronomy 2021, 11, 1923. [Google Scholar] [CrossRef]
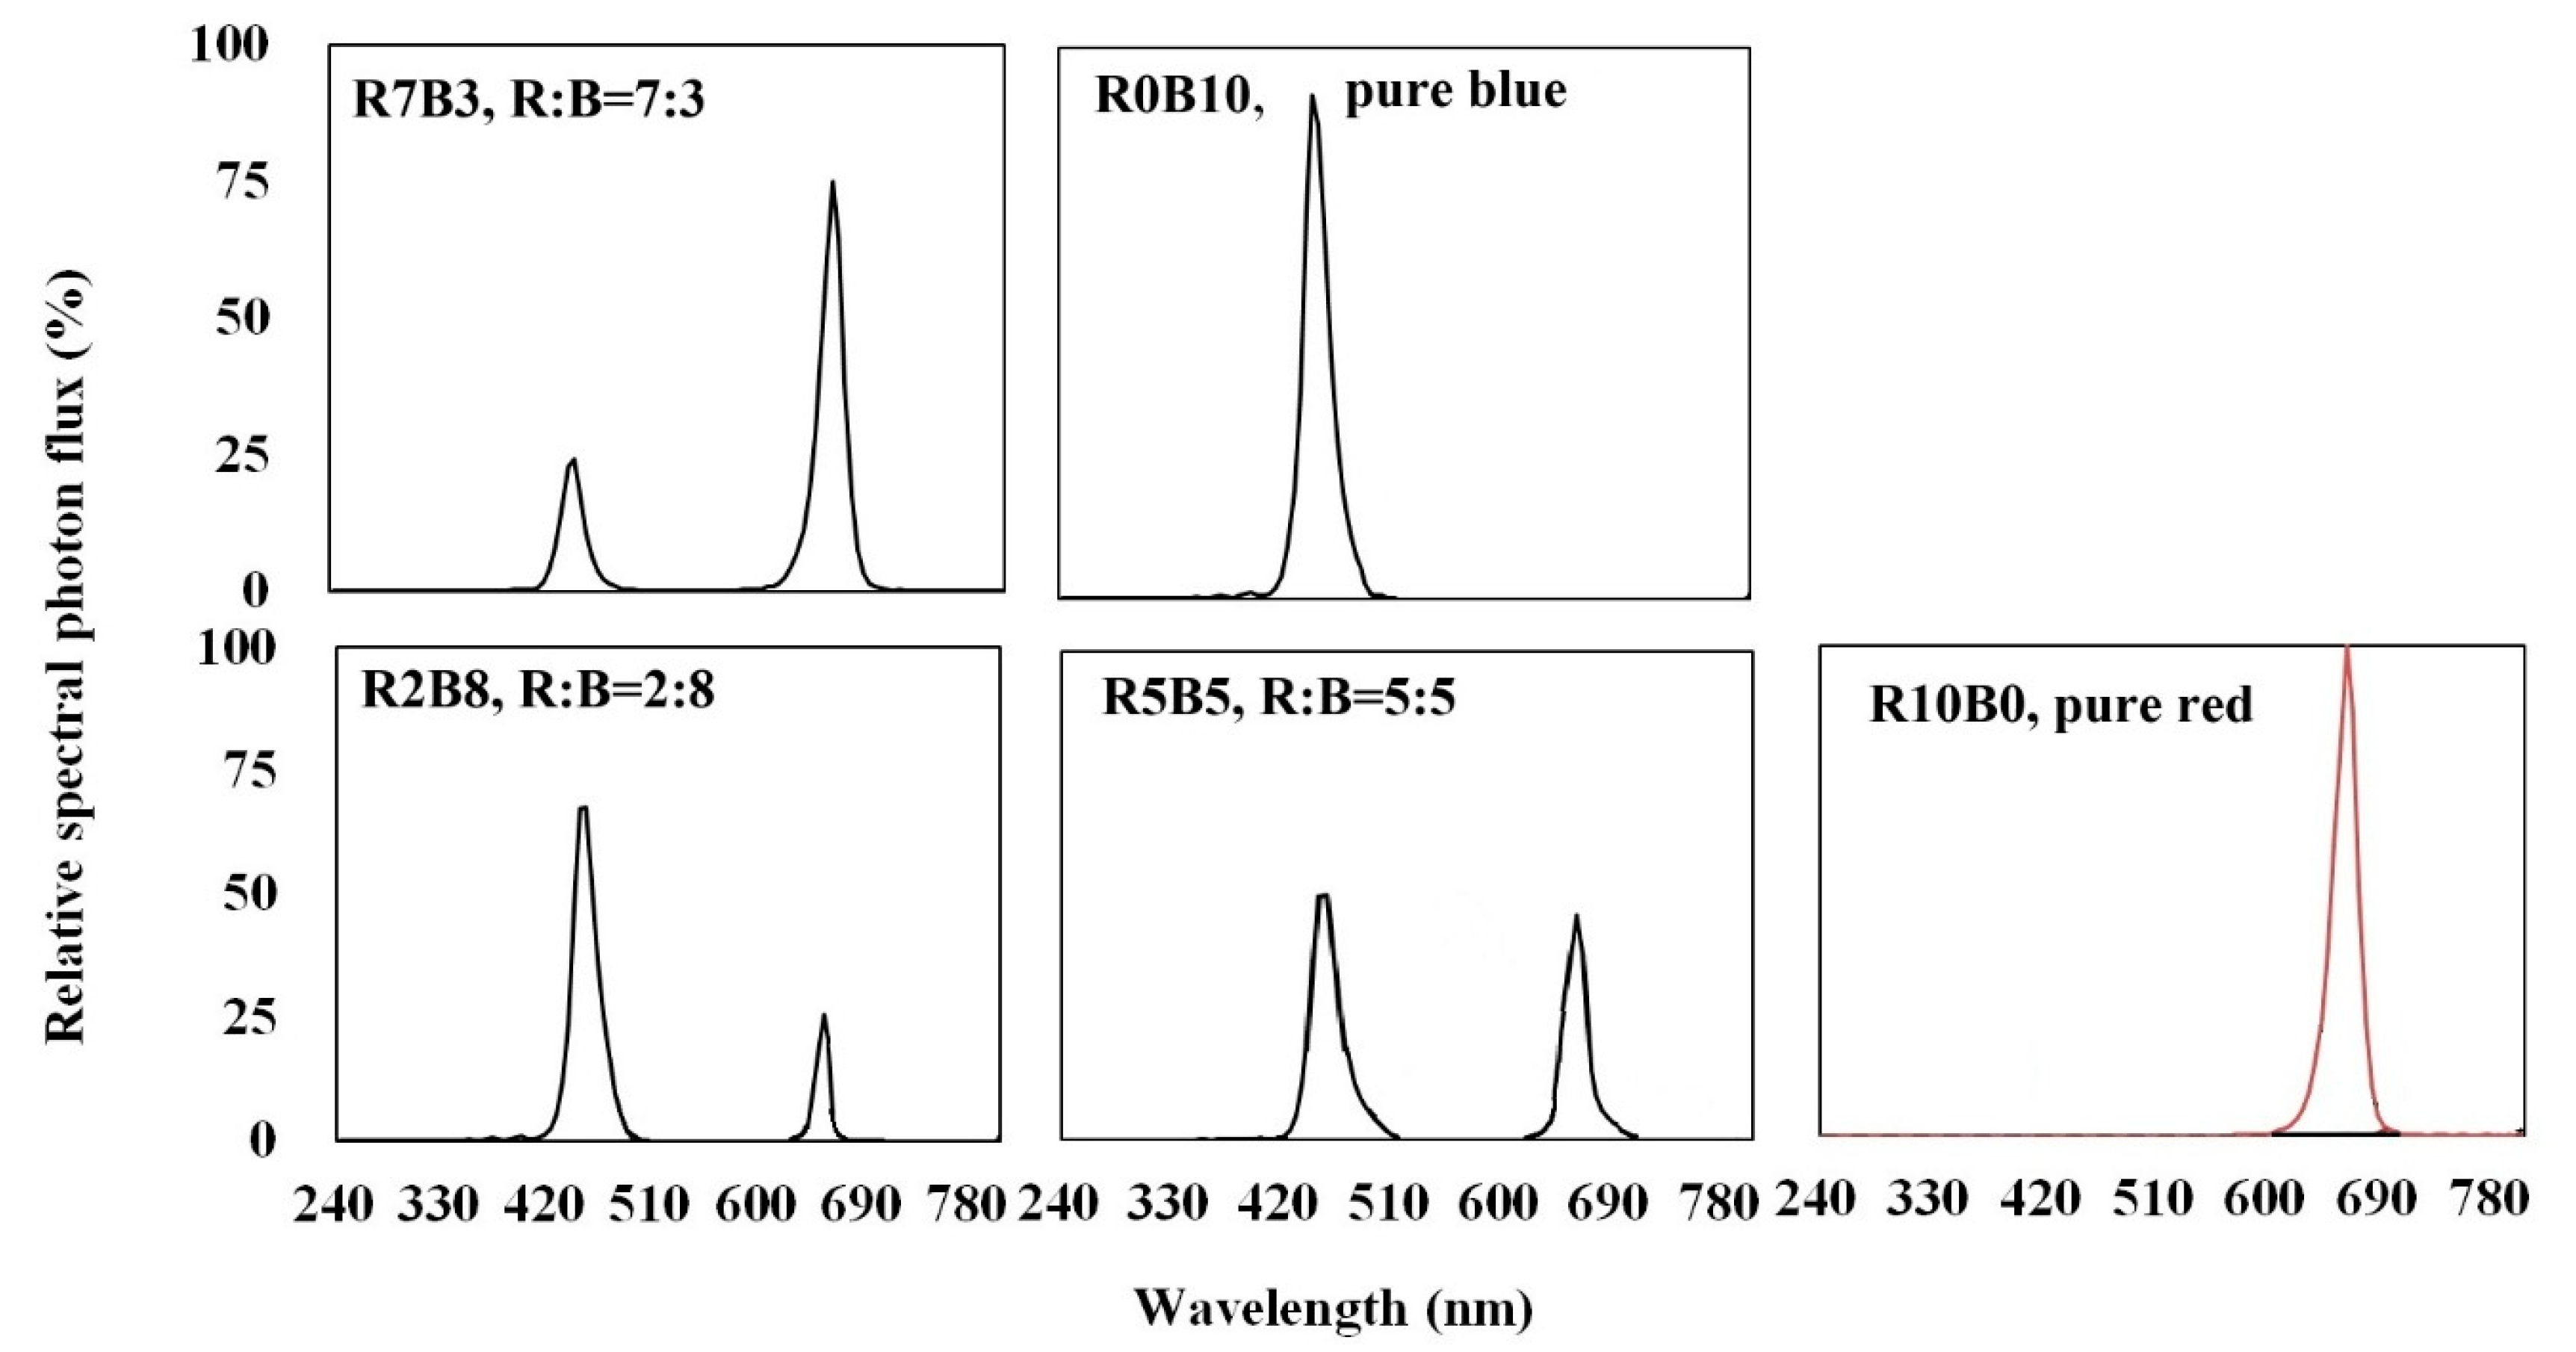
Figure 1. The relative spectral photon flux of LEDs. Spectral characteristics were all measured at 30 cm directly below the lamp.
Agriculture 15 02082 g001
Figure 2. Effects of different light quality on tomato photosynthetic physiology: (a) PN (net photosynthetic rate); (b) GS (stomatal conductance); (c) Ci (intercellular CO2 conductance); (d) Tr (transpiration rate). Five LED red (R)–blue (B) light-quality ratio treatments (R10B0, R7B3, R5B5, R2B8 and R0B10, with R:B ratios of 10:0, 7:3, 5:5, 2:8 and 0:10, respectively) were set up and applied to tomato seedlings. Different letters indicate significant differences between treatments (p < 0.05, Tukey’s test).
Agriculture 15 02082 g002
Figure 3. Effects of different light quality on activities of key enzymes in the AsA-GSH cycle of tomato seedlings: (a) APX (ascorbate peroxidase); (b) MDHAR (monodehydroascorbate reductase); (c) DHAR (dehydroascorbate reductase); (d) GR (glutathione reductase). Five LED red (R)–blue (B) light-quality ratio treatments (R10B0, R7B3, R5B5, R2B8 and R0B10 with R:B ratios of 10:0, 7:3, 5:5, 2:8 and 0:10, respectively) were set up and applied to tomato seedlings. Different letters indicate significant differences between treatments (p < 0.05, Tukey’s test).
Agriculture 15 02082 g003
Figure 4. Effects of different light quality on the contents of key substances in the AsA-GSH cycle of tomato seedlings: (a) AsA (ascorbic acid); (b) GSH (reduced glutathione); (c) GSSG (oxidized glutathione); (d) GSH/GSSG. Five LED red (R)–blue (B) light-quality ratio treatments (R10B0, R7B3, R5B5, R2B8 and R0B10 with R:B ratios of 10:0, 7:3, 5:5, 2:8 and 0:10, respectively) were set up and applied to tomato seedlings. Different letters indicate significant differences between treatments (p < 0.05, Tukey’s test).
Agriculture 15 02082 g004
Figure 5. Effects of different light quality on P. infestans susceptibility and glucose content of tomato seedlings: (a) representative disease symptoms photographed at 3 dpi. Bar, 1 cm.; (b) representative trypan blue staining for cell death in tomato leaves at 3 dpi. Bar, 500 μm.; (c) bacterial growth in tomato leaves at 0 and 3 dpi.; (d) apoplastic glucose (Glc) contents and total Glc contents of tomato leaves at 6 hpi under different light conditions. Five LED red (R)–blue (B) light-quality ratio treatments (R10B0, R7B3, R5B5, R2B8 and R0B10 with R:B ratios of 10:0, 7:3, 5:5, 2:8 and 0:10, respectively) were set up and applied to tomato seedlings. Different letters indicate significant differences between treatments (p < 0.05, Tukey’s test).
Agriculture 15 02082 g005
Table 1. Effects of different light-quality ratios on tomato morphology.
TreatmentFresh Weight Aboveground (g)Dry Weight Aboveground (mg)Stem Height (cm)Leaf Area (cm2)SPADRoot Length (cm)Health Index
R10B02.15 ± 0.19 d 127.34 ± 1.84 d6.82 ± 0.27 d14.09 ± 0.72 c34.76 ± 3.06 d28.00 ± 1.01 c0.52 ± 0.07 c
R7B33.15 ± 0.12 bc37.12 ± 4.13 c10.78 ± 0.69 c17.89 ± 0.79 b47.13 ± 2.23 c33.02 ± 3.02 b0.52 ± 0.09 c
R5B53.56 ± 0.37 bc38.21 ± 3.33 c10.47 ± 0.71 c20.31 ± 0.78 a50.98 ± 2.13 bc38.17 ± 3.95 abc0.58 ± 0.01 b
R2B84.13 ± 0.17 ab54.26 ± 3.04 a13.18 ± 0.81 a22.12 ± 1.31 a55.39 ± 2.36 ab45.16 ± 3.96 a0.67 ± 0.08 a
R0B104.36 ± 0.41 a50.07 ± 3.39 ab13.32 ± 0.33 a21.31 ± 0.98 a59.85 ± 2.77 a40.32 ± 2.09 ab0.62 ± 0.03 a
1 Five LED red (R)–blue (B) light-quality ratio treatments (R10B0, R7B3, R5B5, R2B8 and R0B10 with R:B ratios of 10:0, 7:3, 5:5, 2:8 and 0:10, respectively) were set up and applied to tomato seedlings. Results are shown as mean values ± SD, with different letters indicating significant differences between treatments (p < 0.05, Tukey’s test). The same below.
Table 2. Effects of different light-quality ratios on contents of endogenous hormones in tomato seedlings.
TreatmentMEL (ng·g−1)ABA (ng·g−1)KIN (ng·g−1)ZE (ng·g−1)IAA (ng·g−1)IBA (ng·g−1)
R10B02.16 ± 0.13 d2.43 ± 0.18 a1.83 ± 0.05 c0.81 ± 0.01 b13.17 ± 0.15 d3.16 ± 0.75 d
R7B32.52 ± 0.17 c2.22 ± 0.12 ab2.16 ± 0.06 b0.75 ± 0.05 c14.44 ± 0.18 bc3.02 ± 1.28 d
R5B53.49 ± 0.12 b2.17 ± 0.17 ab1.91 ± 0.09 c0.77 ± 0.04 cb14.08 ± 0.23 cd3.91 ± 1.23 b
R2B84.01 ± 0.20 ab2.12 ± 0.17 b2.22 ± 0.04 a0.93 ± 0.05 a16.22 ± 0.12 a4.05 ± 1.01 a
R0B104.92 ± 0.12 a2.69 ± 0.14 a2.15 ± 0.03 b0.90 ± 0.03 a15.49 ± 0.21 ab3.54 ± 1.03 c
Five LED red (R)–blue (B) light-quality ratio treatments (R10B0, R7B3, R5B5, R2B8 and R0B10 with R:B ratios of 10:0, 7:3, 5:5, 2:8 and 0:10, respectively) were set up and applied to tomato seedlings. Results are shown as mean values ± SD, for the contents of MEL (melatonin), ABA (abscisic acid), KIN (kinetin), ZE (trans-zeatin), IAA (indole acetic acid) and IBA (indole butyric acid). Different letters indicate significant differences between treatments (p < 0.05, Tukey’s test).
Disclaimer/Publisher’s Note: The statements, opinions and data contained in all publications are solely those of the individual author(s) and contributor(s) and not of MDPI and/or the editor(s). MDPI and/or the editor(s) disclaim responsibility for any injury to people or property resulting from any ideas, methods, instructions or products referred to in the content.